Abstract
This paper describes research on the stress-corrosion crack growth (SCCG) behavior of a new series of bioactive glasses designed to fabricate coatings on Ti and Co-Cr-based implant alloys. These glasses should provide improved implant fixation between implant and exhibit good mechanical stability in vivo. It is then important to develop an understanding of the mechanisms that control environmentally-assisted crack growth in this new family of glasses and its effect on their reliability. Several compositions have been tested in both static and cyclic loading in simulated body fluid. These show only small dependences of stress-corrosion crack growth behavior on the composition. Traditional SCCG mechanisms for silicate glasses appear to be operative for the new bioactive glasses studied here. At higher velocities, hydrodynamic effects reduce growth rates under conditions that would rarely pertain for small natural flaws in devices.
Introduction
Bioactive glasses are a class of glasses that will react with the human physiological environment to form hydroxycarbonate apatite (HCA) on their surfaces; salient mechanisms are reviewed in ref. [1]. Because HCA has a similar structure to biological apatites, the body recognizes the modified surface to be bone-like and as such will deposit bone, and in some cases soft collagen-based tissue. This bioactive nature, combined with the relative ease in which glasses can be processed, suggests that these glasses could be excellent materials for biological implants. Unfortunately, glass generally has poor mechanical strength and low toughness (< 1 MPa√m) when compared to typical metallic implant alloys, such as Ti-6Al-4V which has a strength of ∼800 MPa and a toughness of >25 MPa√m. In addition, glasses are subject to environmentally-assisted crack growth [2-8] where the principal mechanism is severing of the Si-O bond in the glass network by aqueous attack. Formation of thick hydroxylated layers [9], actual dissolution of the glass [10], or especially leaching of more soluble components, such as alkalis [11], may also be involved, particularly at low crack velocities. Although this further limits their structural integrity, one promising load-bearing application for these glasses may be as coatings to promote implant/tissue bonding.
A new series of glasses in the family Na-K-Ca-Mg-P-Si-O (Table 1) have been prepared that show bioactivity to differing degrees either in vitro [12-17], or, in the case of 6P55, in vivo using rat models [18]. Glasses with silica contents larger than ∼ 60 wt% (e.g., 6P61) are not bioactive, but they are biocompatible [19,20]. The compositions of the glasses are related to that of the original Bioglass® developed by Hench [1] but with silica contents ranging between 46 and 69 mol% and MgO and K2O partially substituted for CaO and Na2O. These substitutions are designed to manipulate the thermal expansion (in the range of 8.8 to 15.1 × 10⁻⁶ °C-1) [19] such that the glasses can be used to fabricate coatings on Ti and Co-Cr based implant alloys without generating large thermal stresses. In addition the softening points are lower than 700 °C [19] and enameling of Ti-based alloys can be carried out below the α–>β transformation of Ti (955-1010°C). It is considered that these glass coatings would provide improved fixation between metallic implants and biological tissue. An added benefit of the range of properties that these glasses exhibit is that a hydroxyapatite (HA) second phase can be added in order to tailor the level of bioactivity desired in the final coating [21]. In fact, many of these glasses have already been successfully deposited on implant alloys as single/multilayer films and as glass/HA composite coatings while maintaining satisfactory coating bioactivity [12,14,19,21,22]. In addition, the precipitation times of HCA “in vitro” on the surface of these glasses can vary enormously (from hours to weeks) depending on their composition [19,20]. This system provides a unique opportunity to asses systematically the effect of the bioactivity (in particular the precipitation of second phases in simulated body fluid) on the stress-corrosion crack growth behavior and compare it with predictions from established models that focus on the break-up of the Si-O bond.
TABLE 1.
Glass Compositions in Weight Percent
| SiO2 | Na2O | K2O | CaO | MgO | P2O5 | Al2O3 | |
|---|---|---|---|---|---|---|---|
| 6P44a | 44.18 | 23.63 | 6.45 | 12.6 | 7.14 | 6 | |
| 6P50 | 49.82 | 15.54 | 4.2 | 15.57 | 8.87 | 6 | |
| 6P53a | 52.64 | 16.99 | 4.63 | 12.6 | 7.14 | 6 | |
| 6P53c | 52.64 | 10.34 | 2.82 | 18 | 10.2 | 6 | |
| 6P55 | 54.5 | 12 | 4 | 15 | 8.5 | 6 | |
| 6P57 | 56.5 | 11 | 3 | 15 | 8.5 | 6 | |
| 6P61 | 61.1 | 10.34 | 2.82 | 12.6 | 7.14 | 6 | |
| Bioglass® | 45 | 24.5 | 24.5 | 6 | |||
| Soda-Lime | 72 | 14 | 1 | 7 | 4 | 2 |
Both glasses and glass/metal interfaces[23] are subject to environmentally-assisted crack growth. The subcritical crack growth behavior of these glasses and their interfaces with Ti-based and CoCr-based implant alloys has to be characterized to assure long-term mechanical stability of the implant in the body. We report here the stress-corrosion crack growth (SCCG) behavior of these bulk glasses under static and cyclic loading. These studies form part of a comprehensive analysis of the glasses and coatings fracture, wear and fatigue behavior [15-17,24-26]. The final goal is to gather the basic information needed to develop lifetime prediction analysis of specific devices that will allow the design of coatings with optimum mechanical stability for a given application.
Materials and Methods
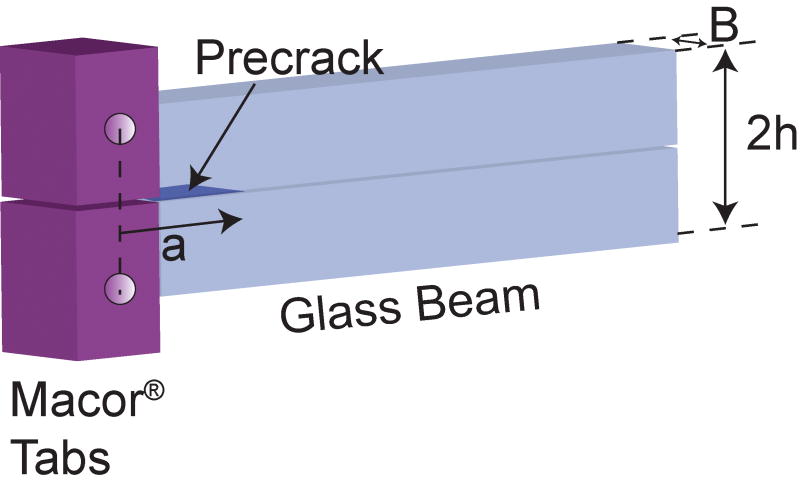
The glasses were prepared by melting powders of 99.9% silica powder and reagent grade NaPO3, Na2CO3, K2CO3, CaCO3, and MgO mixed in either an isopropyl or ethyl alcohol suspension using a high speed stirrer. The dried mixtures were melted in a Pt crucible at 1400°C for 4 hr and cast in a graphite mold to make 10 × 40 × 50 mm plates [12,14]. These plates were then machined into beams having dimensions of width, B = 5 ± 0.5 mm, height, 2h = 8 ± 0.04 mm, and length, L = 50 ± 5 mm. The stress-corrosion crack-growth properties of the bioactive glasses were measured using the double-cantilever beam (DCB) specimen, shown in Fig. 1. To prevent crack deflection from fracturing the arms of the DCB, the beams were side-grooved (300 µm wide) along the length of the beam centerline leaving approximately 1/3 the thickness of the beam intact. The beams were annealed at 500°C for 1 hr to relieve any residual stresses due to machining.
Figure 1.
The DCB geometry used for crack-growth study. Dimensions were thickness, B, of 5 ± 0.5 mm, height, 2h, of 8 ± 0.04 mm, and length, L, of 50 ± 5 mm.
All specimens were precracked in air (crack initiation being facilitated by the use of a sawn chevron notch) and then tested in a flowing simulated body fluid [20,27] (SBF; ∼0.5 l/min, pH 7.25) at 37°C (Table 2). Stress-corrosion crack-growth tests were carried out using a series of fixed applied loads that consisted of weights on a graphite hanger suspended from Macor® glass ceramic loading tabs bonded to the specimen; with the use of graphite pins in the loading tabs, the system was suitable for testing in the SBF. Crack lengths were monitored using both direct optical measurement and crack-mouth opening compliance. Crack-mouth opening was measured using an induction based displacement gauge manufactured by Kaman Instruments Co. (Colorado Springs, CO), (calibrated to operate in SBF) and specimen compliance was used to determine crack lengths with the following equation:
TABLE 2.
Ion Concentrations of the simulated body fluid used in this research and of human plasma.
| Ion Concentration (mM) | ||||||||
|---|---|---|---|---|---|---|---|---|
| Na+ | K+ | Ca2+ | Mg2+ | Cl- | ||||
| SBF | 142.0 | 5.0 | 2.5 | 1.5 | 147.8 | 4.2 | 1.0 | 0.5 |
| Human plasma | 142.0 | 5.0 | 2.5 | 1.5 | 103.0 | 27.0 | 1.0 | 0.5 |
| (1) |
where E is the elastic modulus of the glass, B the beam width, u the mouth opening displacement, P the load, and g(a/h) is the calibration function relating crack length, a, and beam half height, h, to the compliance of the specimen.
Crack-growth rates and applied stress intensities were determined from the crack length versus time data by averaging over crack extensions of ∼1 mm. Linear fits of the crack length vs. time data were used to determine crack-growth rates. The applied stress intensity, K, was calculated using the DCB solution [28]:
| (2) |
where f(a/h) is the geometry dependent function for the DCB, and Bn is the crack front width remaining after side-grooving. Crack lengths could be measured easily to within an accuracy of ±250 µm which bounds the error in the stress intensity calculation to ±0.005 MPa√m, which is not a significant source of uncertainty. Based upon measured multiple data sets, the variability in the crack-growth rate curves from specimen to specimen, as well as the relatively weak dependence of the applied stress intensity on the crack length, implies that the accuracy of the crack-length measurements is not a significant source of uncertainty for determining K. Stress intensities corresponding to each growth rate were determined by simply averaging over the fitting interval. The data were then converted to strain energy release rate, , via the relation:
| (3) |
where E′ is the plane-strain elastic modulus, E/(1-v2), and v is Poisson's ratio. The modulus and Poisson's ratio of f-silica are 72.4 GPa and 0.16, respectively. These values have yet to be fully characterized for the new bioactive glasses. However, initial measurements indicate that elastic parameters of soda-lime glass can be assumed to pertain, i.e., E = 70 GPa and v = 0.22 [15,17].
Limited additional testing of similar specimens was done under applied cyclic loading to assess possible fatigue effects in an SBF environment. These tests were conducted on a computer-controlled, servo-hydraulic machine (Model 810, MTS Corporation, Minneapolis, MN) with a sinusoidal load cycle and R = 0.1, where R is the ratio of the minimum to maximum applied load in the cycle, at a frequency of f = 5 Hz. Crack lengths were continuously monitored in situ using unloading compliance as determined from the displacement gauge. Fatigue-crack growth rate curves were acquired under a decreasing K load-shedding scheme in accordance with ASTM E-647 [29]; the rate of change in stress intensity (= dlnK/da) was limited to 0.08 mm-1. Experience indicated that crack lengths could be determined to ±25 µm; the accuracy exceeds that for static loading because data could be averaged over many unloading cycles and by virtue of evaluating the slope of the displacement gauge output, drift in the zero is unimportant.
Results
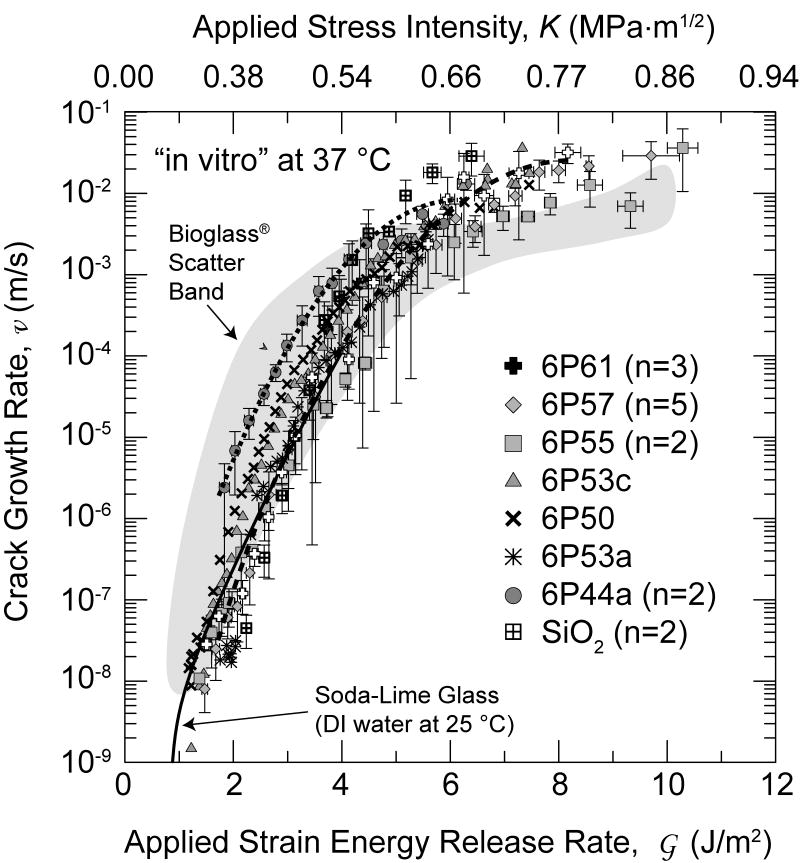
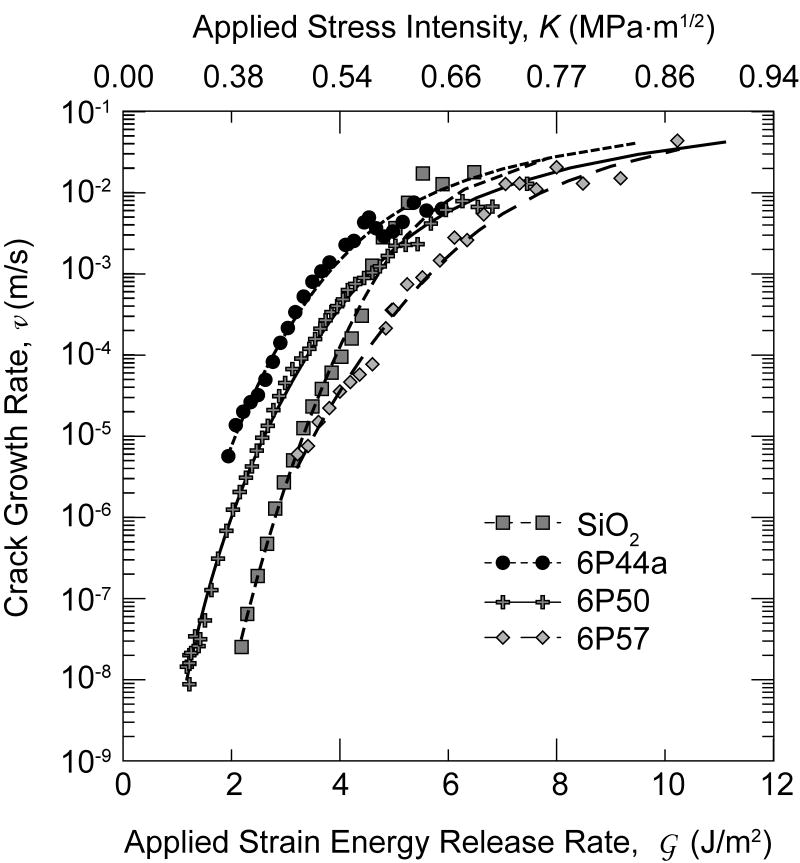
Figure 2 shows the average crack-growth rate vs. average strain energy release rate and average stress intensity ( curve, and, equivalently, ) for the glass compositions listed in Table 1. For those compositions with more than one sample tested, data were averaged by: i) merging all data for that composition, ii) separating the data into 0.2 MPa√m intervals, iii) averaging the and K data for each interval, iv) calculating a standard deviation for each interval, v) and then converting the K data to using Eq. 3. The ordinate and abscissa error bars on the data points represent one standard deviation for each averaged block of data. Lines have been drawn through the data for the 6P44 and the 6P61 glasses (Fig. 2), which represent the extremes in the new glass compositions; it can be seen that the differences in behavior for the various compositions seem to vanish and, possibly excepting those for fused SiO2, with the data seem to be converging at the lower velocities measured (such that individual data points are obscured).
Figure 2.
The average SCCG data for glasses in Table 1 (n designates the number of samples in each population if greater than one). The gray band describes data for Bioglass® 45S5 taken from ref. [31], and solid line describes data for soda-lime glass taken from ref. [32]. All data except for soda-lime glass were taken in SBF at 37°C.
Although the majority of the crack-velocity data shown (Fig. 2) were taken with a compliance gauge, optical measurements were included over most of the velocity range probed for most compositions. No systematic differences were evident, except that the highest velocities cannot be measured optically. For the more reactive compositions, the glass surfaces become clouded early in the tests which eventually precluded optical measurements. Inspection of individual curves reveals occasional erratic behavior. This is believed to primarily result because the crack sometimes deflects off of the centerline; it can then become constrained as it approaches the edge of the side-groove and accelerate upon straightening out. The DCB geometry is known to be sensitive to this instability, which is the reason for the commonly used side groove. However, in the present situation the sample arm heights, h, and aspect ratios, h/B, were much smaller than are often used, e.g., by Wiederhorn in refs. [7,8,30], and side-grooves were proportionally deeper. This geometrical configuration was selected in order to permit sensitive compliance measurements to be accessible over a wide range of crack velocity, but it does seem to increase the tendency of the crack to wander off axis. The errors in crack velocity and the sample-to-sample scatter are largely attributed to this instability, although friction at the graphite pin, which would cause errors in K is greater than would obtain in a non-corrosive fluid or vapor. Nonetheless, this geometry is useful for these reactive glasses and would be useful for testing composite or interfacial samples for which optical measurements are impossible.
It was found that all compositions of the new bioactive glasses had similar SCCG properties to those of the original Bioglass® 45S5 composition [31] and the “parent” soda-lime glass [30], the soda-lime glass data were taken in water at 25°C and not in SBF at 37°C. In fact, all compositions tested show similar crack-growth rate response with only small differences in trends of the growth rates at a given driving force for the differing glass compositions.
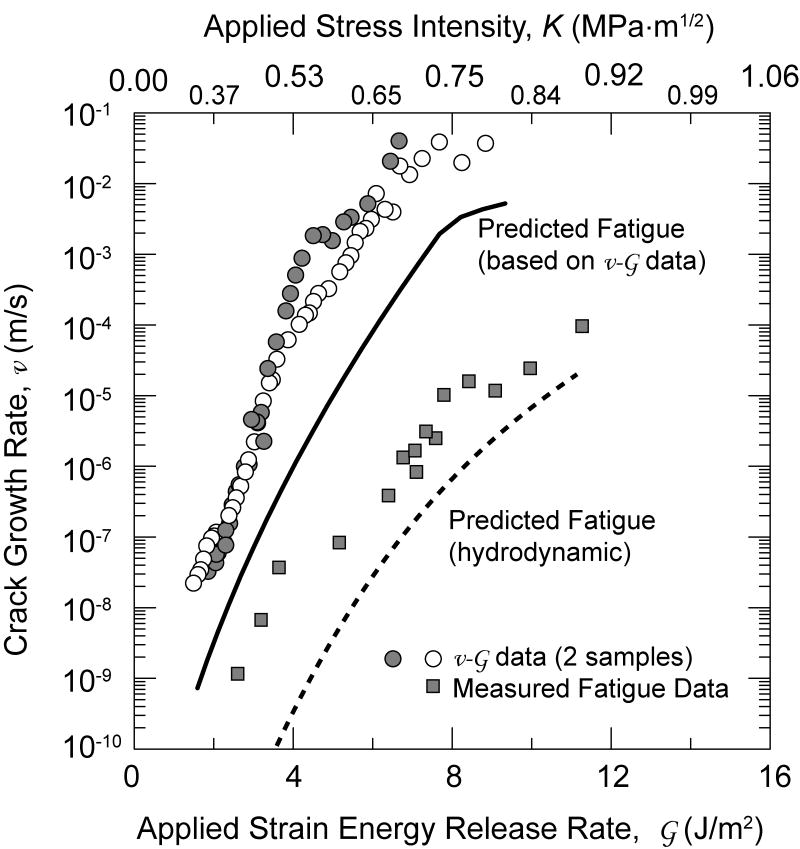
Cyclic crack-growth rate data for 6P61 glass are presented in Fig. 3 as a function of the maximum applied stress-intensity factor, and equivalently Kmax, where the SCCG properties are included for comparison. As expected, the crack-growth rates for the cyclic loading are lower for a given applied Kmax.
Figure 3.
Crack-growth rates measured under cyclic loading for 6P61 glass are compared with predictions of growth rates under fatigue loading based on data from static crack-growth rates computed for two cases: i) no hydrodynamic forces acting at crack flanks, ii) the crack tip at the mean load throughout the applied loading cycle. These results show that for no shielding, the predictions overestimate cyclic crack-growth rates while with high shielding the cyclic growth rates are underpredicted.
Discussion
The curves have the typical form of SCCG data taken in aqueous environments: a stress-dependent region below ∼10-3 m/s and a “plateau” region above ∼10-3 m/s [32-34]. The stress-dependent region has been described as a reaction-rate limited bond rupture at the crack tip [8], involving dissociative chemisorption to form hydroxylated surface bonds [33-36], or perhaps even dissolution [4, 10], whereas, the plateau region may be attributed to crack-tip shielding [32-34] from hydrodynamic traction forces acting on the crack flanks as the crack walls separate during failure.
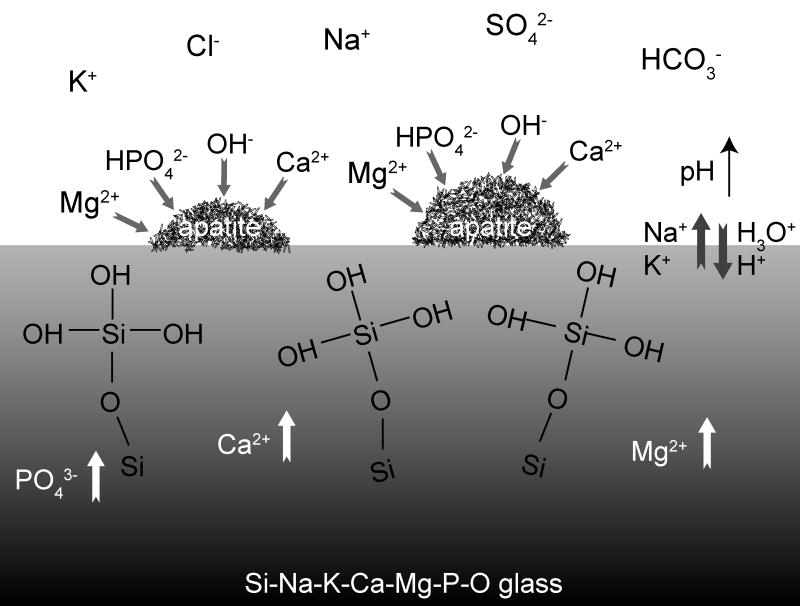
Despite the compositional similarity to typical silicate-based glasses (e.g., soda-lime-silica glass), it might be expected that, due to the reactivity of the bioactive glasses with the SBF, there would be some compositional or bioactivity dependence of the SCCG behavior (Fig. 4) [20,37,38]. Expected responses may include:
Figure 4.
The mechanisms of reaction of the Si-Na-K-Ca-Mg-P-O glasses with SBF are consistent with those described by Hench for Bioglass® [20,37,38]. The steps involved are: the exchange of Na+ and K+ from the glass with H+ or H3O+ from solution, accompanied by the loss of soluble silica into the solution and the formation of silanols on the glass surface; condensation and repolymerization of a SiO2-rich layer on the surface; migration of Ca2+ and PO3-4 through the silica-rich layer forming a CaO-P2O5-rich film that incorporates calcium and phosphates from solution; finally, the crystallization of the amorphous calcium phosphate film to form an apatite layer. De Aza et al. [39] have pointed out that the increase in pH on the glass surface due to the ionic exchange between the labile cations Na+, K+, Ca+ etc., is necessary for the partial dissolution of the silica-rich layer and the subsequent apatite precipitation.
HCA may grow on the crack flanks and “bridge” or “heal” the crack at low crack velocities
stress-enhanced dissolution of the glass at the crack tip (since bioactive glasses have weak solubility in SBF)
preferential leaching of mobile components at the crack tip with subsequent increase of the local pH [39]
HCA could grow on the crack flanks and wedge the crack open
the glass network might experience a higher degree of chemical attack due to the active ionic species in the SBF.
The first phenomenon should cause slower crack growth relative to soda-lime glass, particularly in the near-threshold regime. The second could cause accelerated crack growth compared to that of soda-lime glass in water if the bioactive glasses are more corrosion-sensitive to SBF; in contrast, however, if this dissolution were rapid, crack growth could be decelerated relative to soda-lime glass due to resultant crack-tip blunting. The fourth possible response would only arise due to unloading, but in service could lead to higher average stresses on the crack tip and shorter service lifetimes. If the ionic species in the SBF play a role in glass dissolution, the last point suggests that there should be accelerated crack growth in the bioactive glasses at all crack velocities.
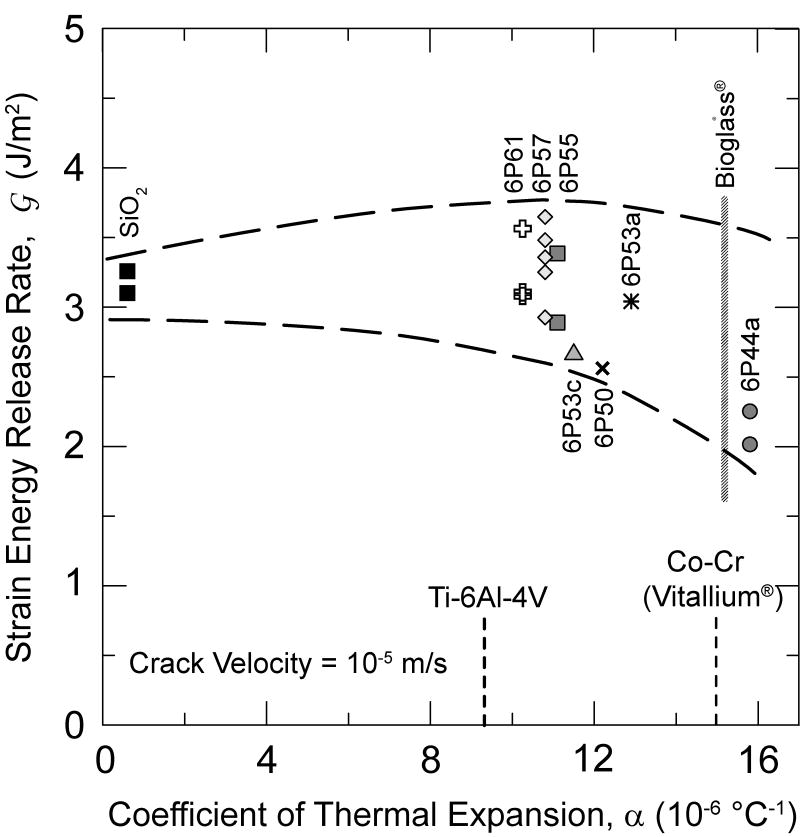
The data, however, suggest that the responses of the bioactive and non-bioactive (e.g., 6P61) glasses in SBF are similar to that of soda-lime glass tested in water. Therefore, it appears that the bioactivity (that can promote modifications of the surface state or the precipitation of second phases [20]) does not significantly impact the SCCG behavior of the bioactive glasses over the velocity range tested to date, and that the typical mechanisms of SCCG in silicates [2-8] are applicable to this class of glasses as well. This is depicted in Fig. 5, in which the driving force, , required to cause crack velocities of 10-5 m/s are plotted against the thermal expansion coefficient (CTE) of the glass. The CTE increases with decreasing SiO2 content, and also with a higher ratio of alkali to alkaline oxides in the glass (see Table 1). The bioactivity of this set of glasses also tends to increase with this same ranking. Apparently, the fracture resistance for this velocity tends to decrease mildly with increases reactivity. It is also evident that glasses can be tailored to match the CTE of the commonly used alloys for dental restorations or bone replacement implants.
Figure 5.
Range of strain energy release rates observed at a crack-growth velocity of 10-5 m/s plotted against thermal expansion coefficient (CTE) of the glass. The glass thermal expansion range covers the entire range between Ti-based to Co-Cr-based alloys.
This behavior is next considered briefly in terms of distinct mechanisms of crack growth, i.e., in the reaction limited (I), hydrostatically limited (II), and threshold regions of the behavior.
Region I
The strongly stress-dependent region of the SCCG curves has been classically described in terms of a stress-assisted chemical reaction theory[2-4,7,8,30,33,34,40-42]. Such data often fit the phenomenological relation v = CKm over wide ranges of crack velocities remarkably well [43]. For each of the present samples, data with velocities less than 5 × 10⁻³ m/s were fit to this empirical relation and the parameters are tabulated (Table 3). The simple parameters from alternative fits to the relations discussed below are also in Table 3; they fit less well, taking parameters as constants, but have mechanistic interpretations.
TABLE 3.
Calculated parameters (activation areas and volumes) from the analysis of the and curves for the different glasses. The data presented are average values. The regression coefficient for the fittings is always larger than 0.9.
| based analysis | based analysis | ||||
|---|---|---|---|---|---|
| Equation | v = CKm | ||||
| Glass | n | C (MPa-mm1-m/2s-1) | m | Activation Volume, ΔV* (Å3) | Activation area, A* (Å2) |
| 6P44a | 2 | 30.1 | 17 | 2.6 ± 0.2 | 0.9 ± 0.2 |
| 6P50 | 1 | 12.2 | 17 | 3.4 | 1.4 |
| 6P53a | 1 | 50.8 | 21 | 3.7 | 1.3 |
| 6P53c | 1 | 30.2 | 19 | 3.8 | 1.6 |
| 6P55 | 2 | 2.3 | 17 | 3.2 ± 0.4 | 1.2 ± 0.2 |
| 6P57 | 5 | 10.9 | 19 | 3.4 ± 0.4 | 1.2 ± 0.2 |
| 6P61 | 3 | 30.5 | 20 | 3.7 ± 0.9 | 1.4 ± 0.4 |
| SiO2 | 2 | 9.6 104 | 32 | 5.6 ± 0.9 | 1.9 ± 0.2 |
Attempts to describe the behavior in terms of equations based upon stress and chemically-driven bond rupture at the crack tip do not lead to analytical but general relationships in terms of a few parameters [44,45]. However, several simple approximate relations have often been invoked. One characterizing equation derived to describe the stress-dependent crack growth regime is:
| (4) |
where is the crack velocity, R the gas constant, T the absolute temperature, ΔE the activation free energy for the corrosion chemical reaction, and b is a constant extracted from the slope of the curve. The activation volume, ΔV*, can be related to the slope of the curve via the relation [33,34]:
| (5) |
where ρ is the radius of curvature of the crack tip, typically assumed to be 0.5 nm, i.e., the network spacing of glass. As can be intuitively assumed, a lower activation volume implies a smaller volume change between the reactants and the activated complex, which in turn implies higher susceptibility to the corrosion reaction and faster crack-growth rates. Table 3 shows the calculated ΔV* for the new bioactive/biocompatible glasses. The values range from 2.6-3.8 Å3 and compare very well, within the scatter of the data, to 3.8 Å3 reported for soda-lime glass [33,34]. The values are somewhat smaller for the more reactive glasses especially as compared to that for pure SiO2, which is 5.6 Å3. A value of 3.3 Å3 was computed theoretically for the hydrolysis of a bond in fused SiO2 [36]. This implies that in region I, these bioactive glasses do not show any significant corrosion mechanisms beyond that of water attack of the silica network, the primary stress-corrosion mechanism for traditional silicate glasses.
Alternatively the curves can be described using a relationship that follows directly for a situation where a crack is extending by chemical adsorption enhanced bond rupture on a well defined plane [46-48]:
| (6a) |
| (6b) |
The activation area, , describes the incremental area swept by the crack during a thermally activated event, and this area multiplied by the net driving force effectively reduces the activation barrier, ΔE. In principle, A* (and also ΔV*) should depend on driving force, decreasing as increases. However if true, then the activation barrier also depends upon the net driving force, , because the crack front moves up the barrier statically as increases and thereby reduces the remaining barrier to be overcome by thermal activation and the area associated with it A*. If the mechanism depends upon thermally activated bond rupture at a site such as a kink on the crack front which could move reversibly forward or backward depending upon whether the driving force were just above or below the threshold value, , then a well-defined threshold for crack growth could be expected, as is expressed in Eq. (6a) [46,47,49-52]. However, invoking Eq. (6a) means crack healing is also implied to occur by similar processes with similar kinetics for , where γs corresponds to the surface energy in the local environment, although in reality the desorption and healing kinetics may be comparatively much slower than adsorption and growth kinetics. Indeed data exist for glass [53,54] and for mica [50,51,55,56] showing that healed cracks are less tough upon reloading from which it is implied that some water remains trapped after crack closure. In such instances, Eq. (6b) should be considered to be more appropriate, and any apparent threshold like behavior would arise from an increase in A*, or from a more profound change in the crack extension mechanism or crack geometry. In the event of a variable A*, but with essentially a single type of activated barrier controlling extension, the slope of the crack-growth curve follows from Eq. (6b), assuming is independent of driving force as:
| (7) |
It can be shown that the second and third terms are equal and opposite leading to the simple relation between slope and A*.
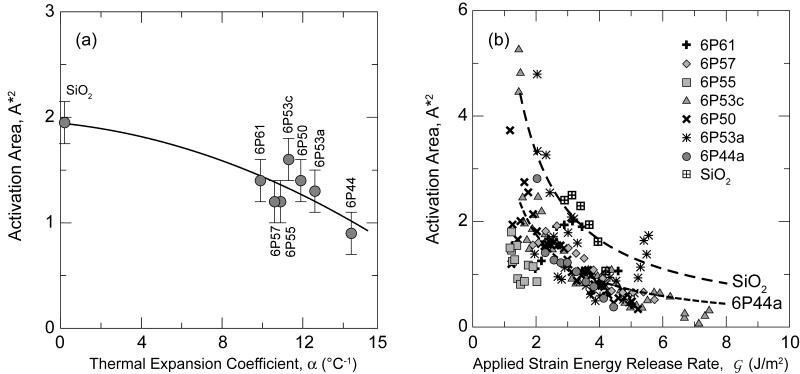
The average values of A*, also given in Table 3 for the new bioactive/biocompatible glasses, obtained from the average slope using all data in region I, range from 0.9-1.6 Å2. These values are slightly lower than that measured for fused silica, at 1.9 Å2, as might be expected due the higher connectivity of the glass network in fused silica. The values of A* tend to decrease with increasing CTE (Fig. 6a), consistent with the somewhat higher crack-growth rates found for the more reactive glasses in region I (Fig. 2). Similar values of A* ∼ 1 Å2 have been reported for soda-lime glass [51].
Figure 6.
(a) Plot showing a decline of activation area for crack growth versus CTE of the glass, indicating indirectly that the parameter A* decreases with increasing reactivity of the glass caused by higher alkali and alkaline earth oxide contents. (b) Dependence of the activation area with , according to the data shown in Fig. 2. The lines are theoretical boundaries ( ) taking m from the fittings summarized in Table 2.
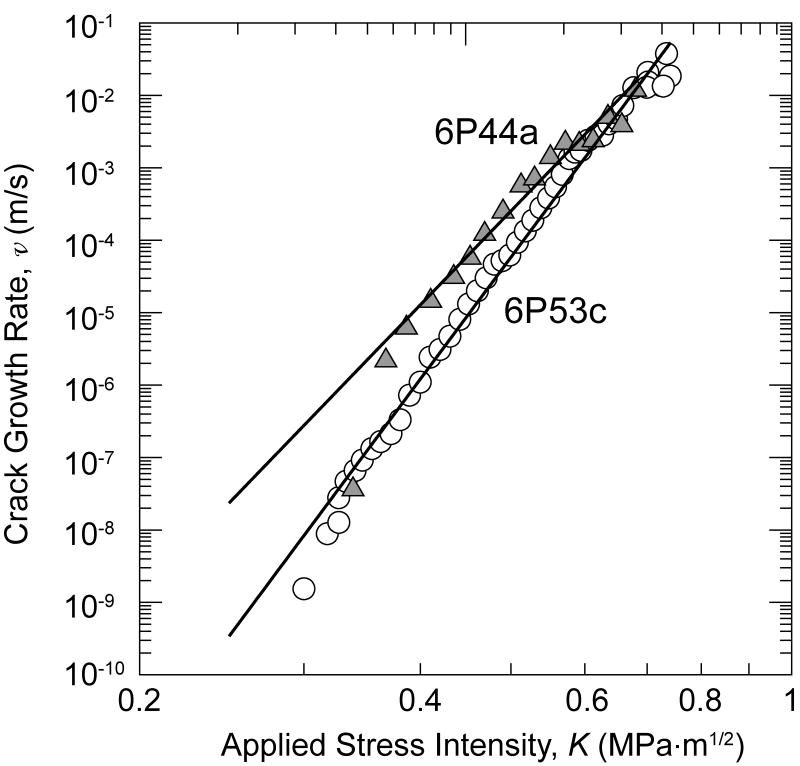
The activation areas, A*, directly obtained from the slope of the curves via Eq. (8) are also plotted versus driving force in Fig. 6b; they show a notable inverse dependence upon driving force. The present data fit Eq. (4) well over a wide range of , especially when results of several tests are averaged for a given glass. Thus, it follows that . Such values determined using the average n (Table 3) are plotted as lines for several glasses over range of the where the data fit the empirical relation without systematic deviation. The resulting values of A* are ∼3 Å2 at the lowest values of where the relation is applicable and decrease to about 1/3 to 1/4 of this value when reaches a value just where hydrodynamic drag becomes appreciable (see next section). For comparison, these initial levels are much less than the average cross-sectional area per atom (ΩSi2/3 ∼ 12.8 Å2 in fused SiO2) but more than half the area per bond 5.1+ Å2 (based on CN =4 for Si) at low and decrease markedly over the range of applicability to a small fraction of the bond area. These levels seem reasonable for describing the mechanically-assisted rupture of atomic bonds, although in reality there must be some distribution of barrier strengths. Moreover, for a few samples, especially 6P44 and 6P53c, the data suggest an approach to threshold-like behavior based upon the velocities at low K lying below the straight line on the plots, as is also evident at lower velocities in reported data on soda-lime glasses [42,43] (Fig. 7). For these situations, the actual values of A* measured from the local slopes on the curves also exhibit a further sharper rise in A* at low , signaling a change in mechanism or barrier type or even an approach to threshold like behavior.
Figure 7.
Logarithmic curve showing deviation from the straight line at the slower speeds for highly reactive glasses.
Region II
The transition from the highly stress-dependent to the stress-insensitive plateau region is attributed to shielding of the crack tip from the far-field applied driving force by the development of hydrodynamic surface tractions in the crack wake [33]. This is a result of the viscous behavior of water (or, in this case SBF) at the high shearing rates that develop as the crack walls separate during failure. This hydrostatic closure force increases with crack velocity, and at high velocities, the viscous dissipation accounts for the vast majority of the resistance to fracture. The associated reduction in stress intensity can be described using a weight-function analysis and assuming a capillary traction force to describe the hydrodynamic effects. The shielding stress intensity can be calculated using the following equation [33]:
| (8) |
where η is the viscosity of the SBF (assumed to be 0.692 mPa·s, i.e., that of water at 37 °C), KI is the applied stress intensity, is the predicted velocity based on a power-law fit of the stress-dependent region, and c is the length behind the crack tip over which the hydrostatic traction operates (taken as the length from the crack tip to the notch tip). This stress intensity is then combined with the measured stress-intensity factor, Kmeas, to obtain the near-plateau prediction:
| (9) |
where C and m are obtained by a best fit regression of the stress-dependent growth-rate region (below the plateau) to the equation v = CKm.
Figure 8 shows examples of predicted velocities for select glasses spanning the full range of compositions. It can be seen that the hydrodynamic shielding appears to well describe the stress-independent region of the curve. The effect of hydrodynamic drag becomes discernible above and the plateau behavior appears to be largely independent of the glass composition as would be expected with the dissipation predominantly arising from the viscous drag in the water and the crack speeds beings so high that little corrosion would occur on the back faces of the crack.
Figure 8.
Sample predictions of curves for the stress-independent regime of crack growth using Eqs. 7 and 8.
Threshold behavior
The parent soda-lime glass has been shown to exhibit sharply decreasing crack rates in the curve, at what appears to be a threshold driving force; this becomes apparent below at room temperature and is clear at higher velocities at higher temperatures [30]. Similar behavior is suggested by the available data for the bioactive glasses tested here (Figs. 2 and 7). Theoretical analyses have indicated that both crack-tip blunting [10,40] or even crack healing [54,57] could be operative at these low growth rates. Blunting would lead to non-unique behavior near the threshold. Such behavior has been observed, in which holding the crack at leads to strongly retarded growth rates with for some glasses [9,57,58]. This was argued to be a reflection of leaching rather than blunting by Gehrke et al. [11]. Atomic-force microscopy measurements of the fracture surfaces yields evidence in support of a blunting phenomena [58], as favored by Michalske [6,54,57]. While the current data sets do not capture enough of this portion of the SCCG curve for conclusions to be drawn, it is likely that some or all of these mechanisms are operative in the more highly reactive glasses studied here. Indeed it appears that the crack-growth behavior is converging for the various glasses at the lowest velocities measured, suggesting the more reactive glasses exhibit the onset of threshold-like behavior at higher velocities.
It is potentially important that Gehrke et al. [11] observed a divergence in behavior for slightly more reactive glasses or more acidic liquids; in certain cases no well-defined threshold existed, but instead persistent growth occurred even under very low loads. This was attributed to leaching of alkali species leading to a highly-stressed region which could spontaneously crack [11]. No evidence of such behavior was seen for the glasses tested here. As this or conventional threshold behavior is most important for controlling the lifetime of devices, the behavior at low driving force and low crack velocities warrants further study.
Cyclic fatigue behavior
It is well known that unlike metals, glasses do not have a distinct fatigue mechanism by which crack growth occurs under applied cyclic loading without environmental effects [59-63]. Rather, crack growth proceeds by the SCCG mechanism appropriate for the instantaneously applied loadings experienced at the crack tip. Interestingly, in fluid aqueous environments, the additional effect of hydrodynamic drag can shield the crack tip from the far-field applied loading. This shielding effect depends upon the viscosity of the fluid environment, the frequency of the applied loading and the test geometry. Quantitative theoretical descriptions are not readily available. Nonetheless, an estimate of the shielding effect may be obtained by comparing the measured fatigue-crack growth rates to those predicted by two bounding alternatives. First, by simply integrating the SCCG data over the applied loading cycle, following Evans and Fuller [59], gives:
| (10) |
These predictions, assuming no drag effects, are shown in Fig. 3 where it can be seen that the measured fatigue-crack growth rates are well below those predicted directly from the SCCG data assuming that the crack tip experiences the entire applied driving force cycle. From these predictions, it is clear that hydrodynamic effects are operative in this geometry under the test conditions (e.g., frequency and temperature) used here.
An alternative estimate of the actual crack-tip stress intensity cycle, Ktip(t), with the hydrostatic drag [62] may be made following the methodology outlined in Yi et al. [63]. Here we estimate Ktip(t) by considering a parabolic displacement profile for the crack flank as:
| (11) |
where x is the distance from the initial notch tip to the current crack tip, a is the crack length and E′ is the elastic modulus. Considering a two-dimensional pressure distribution on the flank of the crack yields the following differential equation:
| (12) |
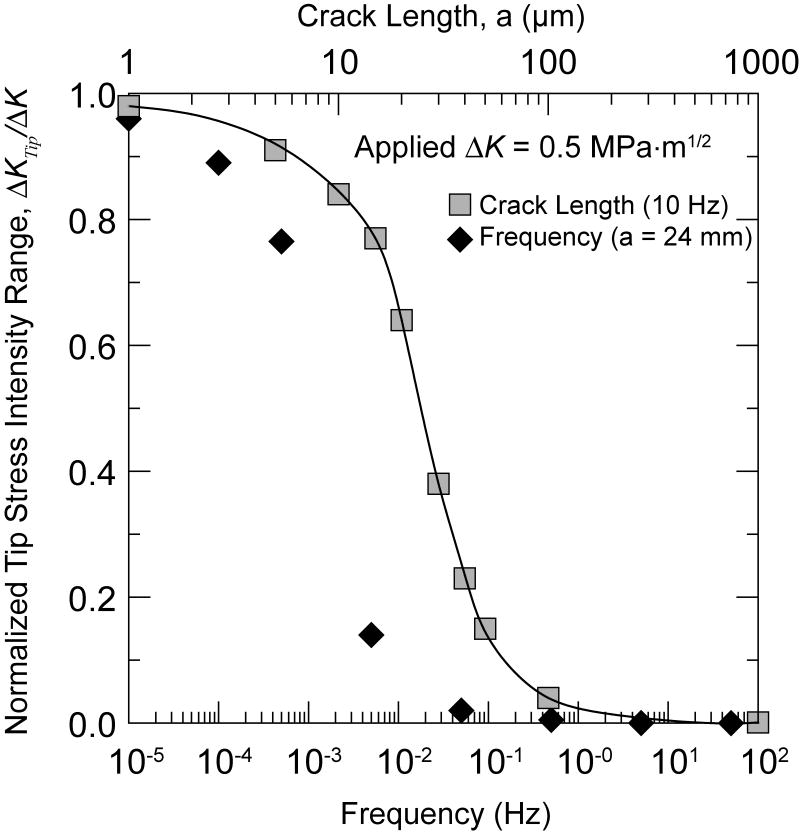
where K(t) is the (time-dependent) applied loading and λ is a function of the crack length, elastic modulus, fluid viscosity, η, and loading frequency, as given in ref. [63]. Results of such calculations, for crack lengths typical of those in the present study, are presented in Fig. 9 where it is clear that Ktip(t) is constant and equal to the mean applied loading, Km, for the test frequencies used, i.e., 10 Hz. A solution for Eq. 9, with Ktip(t)=Km which describes this limit, is also plotted in Fig. 3 where it can be seen that the calculated rates now markedly underpredict the measured fatigue-crack growth data. However, at the lower driving forces and crack velocities, the data approach the limit with no hydrostatic drag, and at the highest velocities the results increasing reflect the drag effects, and should approach the drag-controlled limit. This lack of exact correspondence may reflect the presence of cavitation at the crack tip [63] which would tend to shift the computed results more toward the cyclic data by reducing the shielding effect of the hydrodynamic forces.
Figure 9.
Computed values of normalized crack-tip stress-intensity range vs. frequency of applied loading and vs. crack length for an applied ΔK = 0.5 MPa√m.
Small crack behavior
The crack-growth behavior here shows that both the static SCCG rates at higher velocities and the growth rates under cyclic loading are limited by hydrostatic forces developed in the fluid that causes shielding forces on the crack tip. For natural flaws that would be found in actual biological environments, these drags forces would be smaller owing to the smaller flaw sizes. It can then be expected that the plateau levels of crack growth would be exhibited at much higher velocities than those in Fig. 2. For cyclic loading, the transition between fully relaxed viscous forces, and no effective cycling at the tip depends upon crack length and frequency. Figure 9 also shows computed results of the effective range of ΔK at the crack tip as a function of crack length for 10 Hz cycling rates. It can be seen that for crack lengths less than 10 μm, the Ktip(t) would virtually follow the applied values up to much higher load and crack velocities and the velocities would approach the higher of the two calculated curves in Fig.3. This is especially true for the lower frequencies that would typify most biological loading patterns.
Conclusions
Based on a study of the stress-corrosion crack growth (SCCG) behavior in 37°C simulated body fluid of a series of new bioactive glasses, with compositions listed in Table 1, it can be concluded that:
The aqueous attack of the Si-O network of the glass appears to be the dominant mechanism of SCCG in these bioactive/biocompatible glasses.
Based upon the current data sets, there is a weak but measurable increase in crack-growth rates with increasing bioactivity on the SCCG behavior of the glasses tested in region I, where crack-growth rates are largely controlled by the chemical reactivity.
At higher velocities where hydrodynamic drag limits the crack-growth rates, a simple correction describes the trends, which appear to be independent of glass composition.
Some evidence of a reduction of projected crack-growth rates indicative of the onset of a transition to threshold-like behavior at lower driving forces was found for the most reactive (bioactive) glasses. As this was not seen for the less reactive glasses, the data tended to converge for the various glasses. These observations require further study, as the behavior at low velocity is important for predicting lifetimes.
Crack growth under cyclic fatigue loading was found to be much slower than predicted from simply integrating the expected SCCG velocities assuming that the crack tip experienced the same loading as that applied to the crack. This was found to results from hydrodynamic drag which limits the extent of cycling actually experienced by the crack tip. Such hydrodynamic effects would be smaller for small natural flaws.
Acknowledgments
This work was supported by the National Institutes of Health under grant number NIH/NIDR #1R01DE11289. The authors wish to thank Dr. Jose M. Gomez-Vega for preparing the glass plates and Profs. Bill and Sally Marshall for helpful discussions.
Footnotes
Publisher's Disclaimer: This is a PDF file of an unedited manuscript that has been accepted for publication. As a service to our customers we are providing this early version of the manuscript. The manuscript will undergo copyediting, typesetting, and review of the resulting proof before it is published in its final citable form. Please note that during the production process errors may be discovered which could affect the content, and all legal disclaimers that apply to the journal pertain.
References
- 1.Hench LL. Bioceramics. J Am Ceram Soc. 1998;81(7):1705–1728. [Google Scholar]
- 2.Charles RJ. Static Fatigue of Glass. I. J Appl Phys. 1958;29(11):1549–1553. [Google Scholar]
- 3.Charles RJ. Static Fatigue of Glass. II. J Appl Phys. 1958;29(11):1554–1560. [Google Scholar]
- 4.Hillig WB. In: Modern Aspects of the Vitreous State. MacKenzie JD, editor. Washington, DC: Butterworth, Inc; 1962. pp. 152–194. [Google Scholar]
- 5.Michalske TA, Freiman SW. A molecular interpretation of stress corrosion in silica. Nature. 1982;295(1117):511–512. [Google Scholar]
- 6.Michalske TA, Freiman SW. A Molecular Mechanism for Stress Corrosion in Vitreous Silica. J Am Ceram Soc. 1983;66(4):284–288. [Google Scholar]
- 7.Wiederhorn SM. Influence of Water Vapor on Crack Propagation in Soda-Lime Glass. J Am Ceram Soc. 1967;50(8):407–414. [Google Scholar]
- 8.Wiederhorn SM. A Chemical Interpretation of Static Fatigue. J Am Ceram Soc. 1972;55(2):81–85. [Google Scholar]
- 9.Michalske TA, Bunker BC, Keefer KD. Mechanical Properties and Adhesion of Hydrated Glass Surface Layers. J Non-Cryst Solids. 1990;120(13):126–137. [Google Scholar]
- 10.Charles RJ, Hilling WB. The Kinetics of Glass Failure by Stress Corrosion. Symposium on Mechanical Strength of Glass and Ways of Improving It: Union Scientific Continentale du Verre; Charleroi, Belgium. 1962. pp. 25–29. [Google Scholar]
- 11.Gehrke E, Ullner C, Hahnert M. Fatigue Limit and Crack Arrest in Alkali-Containing Silicate-Glasses. J Mater Sci. 1991;26(20):5445–5455. [Google Scholar]
- 12.Gomez-Vega JM, Saiz E, Tomsia AP. Glass-Based Coatings for Titanium Implant Alloys. J Biomed Mater Res. 1999;46(4):549–559. doi: 10.1002/(sici)1097-4636(19990915)46:4<549::aid-jbm13>3.0.co;2-m. [DOI] [PubMed] [Google Scholar]
- 13.Gomez-Vega JM, Saiz E, Tomsia AP, Oku T, Suganuma K, Marshall GW, et al. Novel bioactive functionally graded coatings on Ti6Al4V. Adv Mater. 2000;12(12):894–898. [Google Scholar]
- 14.Pazo A, Saiz E, Tomsia AP. Silicate Glass Coatings on Ti-Based Implants. Acta Mater. 1998;46(7):2551–2558. [Google Scholar]
- 15.Pavon J, Jimenez-Pique E, Anglada M, Lopez-Esteban S, Saiz E, Tomsia AP. Stress-corrosion cracking by indentation techniques of a glass coating on Ti6Al4V for biomedical applications. J Eur Ceram Soc. 2006;26(7):1159–1169. [Google Scholar]
- 16.Pavon J, Jimenez-Pique E, Anglada M, Saiz E, Tomsia AP. Delamination under Hertzian cyclic loading of a glass coating on Ti6al4v for implants. J Mater Sci. 2006;41(16):5134–5145. [Google Scholar]
- 17.Pavon J, Jimenez-Pique E, Anglada M, Saiz E, Tomsia AP. Monotonic and cyclic Hertzian fracture of a glass coating on titanium-based implants. Acta Mater. 2006;54(13):3593–3603. [Google Scholar]
- 18.Devesa L, Pazo A, Santos C, Martínez A, Guitán F, Moya JS. SiO2-Based Glass/Bone Interfacial Reactions. Acta Mater. 1998;46(7):2559–2563. [Google Scholar]
- 19.Lopez-Esteban S, Saiz E, Fujino S, Oku T, Suganuma K, Tomsia AP. Bioactive glass coatings for orthopedic metallic implants. J Eur Ceram Soc. 2003;23(15):2921–2930. [Google Scholar]
- 20.Saiz E, Goldman M, Gomez-Vega JM, Tomsia AP, Marshall GW, Marshall SJ. In vitro behavior of silicate glass coatings on Ti6Al4V. Biomaterials. 2002;23(17):3749–3756. doi: 10.1016/s0142-9612(02)00109-6. [DOI] [PubMed] [Google Scholar]
- 21.Gomez-Vega JM, Saiz E, Tomsia AP, Marshall GW, Marshall SJ. Bioactive glass coatings with hydroxyapatite and Bioglass (R) particles on Ti-based implants. 1. Processing. Biomaterials. 2000;21(2):105–111. doi: 10.1016/s0142-9612(99)00131-3. [DOI] [PubMed] [Google Scholar]
- 22.Fujino S, Tokunaga H, Hata S, Saiz E, Tomsia AP. Graded glass coatings for Co-Cr implant alloys. J Mater Sci. 2005;40(910):2499–2503. [Google Scholar]
- 23.Card JC, Cannon RM, Saiz E, Tomsia AP, Ritchie RO. Stress Corrosion Cracking in Non-reactive Glass-Metal Interfaces: Copper/Silica. Journal of Applied Physics. 2007 in press. [Google Scholar]
- 24.Pavon J. PhD Thesis. Universitat Politecnica de Catalunya; 2006. Fractura y fatiga por contacto de recubrimientos de vidrio sobre Ti6Al4V para aplicaciones biomedicas. [Google Scholar]
- 25.Bloyer DR, McNaney JM, Tomsia AP. Subcritical crack growth of bioactive glasses in simulated body fluid. Mat Res Soc Symp Proc. 1999;550:355–359. [Google Scholar]
- 26.Bloyer DR, Gomez-Vega JM, Saiz E, McNaney JM, Cannon RM, Tomsia AP. Fabrication and characterization of a bioactive glass coating on titanium implant alloys. Acta Mater. 1999;47(15):4221–4224. [Google Scholar]
- 27.Kokubo T, Takadama H. How useful is SBF in predicting in vivo bone bioactivity? Biomaterials. 2006;27(15):2907–2915. doi: 10.1016/j.biomaterials.2006.01.017. [DOI] [PubMed] [Google Scholar]
- 28.Fichter WB. The stress intensity factor for the double cantilever beam. Int J Fract (Netherlands) 1983;22(2):133–143. [Google Scholar]
- 29.Annual Book of ASTM Standards. Philadelphia PA: American Society for Standards and Testing; 1993. E647-93. Standard Method for Measurement of Fatigue Crack Growth Rates. [Google Scholar]
- 30.Wiederhorn SM, Bolz LH. Stress Corrosion and Static Fatigue of Glass. J Am Ceram Soc. 1970;53(10):543–548. [Google Scholar]
- 31.Barry C, Nicholson PS. Stress Corrosion Cracking of a Bioactive Glass. Adv Ceram Mat. 1988;3(2):127–130. [Google Scholar]
- 32.Michalske TA, Frechette VD. Dynamic Effects of Liquids on Crack Growth Leading to Catastrophic Failure in Glass. J Am Ceram Soc. 1980;63(1112):603–609. [Google Scholar]
- 33.Wiederhorn SM, Freiman SW, Fuller ER, Simmons CJ. Effects of water and other dielectrics on crack growth. J Mater Sci. 1982;17:3460–3478. [Google Scholar]
- 34.Wiederhorn SM, Fuller ER, Jr, Thomson R. Micromechanisms of Crack Growth in Ceramics and Glasses in Corrosive Environments. Metal Sci. 1980;14(89):450–458. [Google Scholar]
- 35.Michalske TA, Bunker BC. Slow Fracture Model Based on Strained Silicate Structures. Journal of Applied Physics. 1984;56(10):2686–2693. [Google Scholar]
- 36.Michalske TA, Bunker BC. A Chemical Kinetics Model for Glass Fracture. J Am Ceram Soc. 1993;76(10):2613–2618. [Google Scholar]
- 37.Kokubo T. Apatite formation on surfaces of ceramics, metals and polymers in body environment. Acta Mater. 1998;46(7):2519–2527. [Google Scholar]
- 38.Hench LL. Bioceramics: From Concept to Clinic. J Am Ceram Soc. 1991;74(7):1487–1510. [Google Scholar]
- 39.DeAza PN, Guitian F, Merlos A, LoraTamayo E, DeAza S. Bioceramics - Simulated body fluid interfaces: pH and its influence of hydroxyapatite formation. J Mater Sci-Mater M. 1996 Jul;7(7):399–402. [Google Scholar]
- 40.Charles RJ. In: Progress in Ceramic Science. Burke JE, editor. New York: Pergamon Press; 1961. pp. 1–38. [Google Scholar]
- 41.Wiederhorn SM. Moisture Assisted Crack Growth in Ceramics. Int J Fract Mech. 1968;4(2):171–177. [Google Scholar]
- 42.Wiederhorn SM, editor. Mechanisms of Subcritical Crack Growth in Glass. New York: Plenum Press; 1978. [Google Scholar]
- 43.Wiederhorn SM. Dependence of Lifetime: Predictions of the Form of the Crack Propagation Equation. In: Taplin DMR, editor. Fracture 1977. New York: Pergamon Press; 1978. pp. 893–901. [Google Scholar]
- 44.Fuller ER, Thomson R. Theory of Chemically Assisted Fracture.2. Atomic Models of Crack-Growth. J Mater Sci. 1980;15(4):1027–1034. [Google Scholar]
- 45.Thomson R. Theory of Chemically Assisted Fracture.1. General Reaction-Rate Theory and Thermodynamics. J Mater Sci. 1980;15(4):1014–1026. [Google Scholar]
- 46.Lawn BR. Atomistic Model of Kinetic Crack Growth in Brittle Solids. J Mater Sci. 1975;10(3):469–480. [Google Scholar]
- 47.Pollet JC, Burns SJ. Thermally Activated Crack-Propagation - Theory. Int J Fract (Netherlands) 1977;13(5):667–679. [Google Scholar]
- 48.Lathabai S, Lawn BR. Fatigue Limits in Noncyclic Loading of Ceramics with Crack-Resistance Curves. J Mater Sci. 1989;24(12):4298–4306. [Google Scholar]
- 49.Lawn BR. An Atomistic Model of Kinetic Crack Growth in Brittle Solids. J Mater Sci. 1975;10:469–480. [Google Scholar]
- 50.Lawn BR, Roach DH, Thomson RM. Thresholds and Reversibility in Brittle Cracks: an Atomistic Surface Force Model. J Mater Sci. 1987;22(11):4036–4050. [Google Scholar]
- 51.Wan KT, Lathabai S, Lawn BR. Crack Velocity Functions and Thresholds in Brittle Solids. J Eur Ceram Soc. 1990;6(4):259–268. [Google Scholar]
- 52.Cook RF. Environmentally-controlled Non-equilibrium Crack Propagation in Ceramics. Mater Sci Eng. 1999;A260:29–40. [Google Scholar]
- 53.Stavrinidis B, Holloway DG. Crack Healing in Glass. Phys Chem Glasses. 1983;24:19. [Google Scholar]
- 54.Michalske TA, Fuller ER., Jr Closure and Repropagation of Healed Cracks in Silicate Glass. J Am Ceram Soc. 1985;68(11):586–590. [Google Scholar]
- 55.Wan KT, Aimard N, Lathabai S, Horn RG, Lawn BR. Interfacial Energy States of Moisture-Exposed Cracks in Mica. J Mater Res. 1990;5(1):172–182. [Google Scholar]
- 56.Wan KT, Lawn BR. Surface Forces at Crack Interfaces in Mica in the Presence of Capillary Condensation. Acta Metall. 1990;38(11):2073–2083. [Google Scholar]
- 57.Michalske TA. The Stress Corrosion Limit: Its Measurement and Implications. In: Bradt RC, Evans AG, Hasselman DPH, Lange FF, editors. Fracture Mechanics of Ceramics, vol 5, Surface Flaws, Statistics and Microcracking. New York: Plenum Press; 1983. pp. 277–289. [Google Scholar]
- 58.Wiederhorn SM, Dretzke A, Rodel J. Near the Fatigue Limit in Glass. 10th International Congress of Fracture; 2001; Honolulu Hawaii. 2001. [Google Scholar]
- 59.Evans AG, Fuller ER. Crack-Propagation in Ceramic Materials under Cyclic Loading Conditions. Metall Trans. 1974;5(1):27–33. [Google Scholar]
- 60.Dauskardt RH, Yu W, Ritchie RO. Fatigue Crack-Propagation in Transformation-Toughened Zirconia Ceramic. J Am Ceram Soc. 1987;70(10):C248–C252. [Google Scholar]
- 61.Ritchie RO. Mechanisms of Fatigue-Crack Propagation in Ductile and Brittle Solids. Int J Fracture. 1999;100(1):55–83. [Google Scholar]
- 62.Tzou JL, Hsueh CH, Evans AG, Ritchie RO. Fatigue Crack Propagation in Oil Environments - II. A Model for Crack Closure Induced by Viscous Fluids. Acta Metall. 1985;33(1):117–127. [Google Scholar]
- 63.Yi KS, Dill SJ, Dauskardt RH. Subcritical crack growth in glasses under cyclic loads: Effect of hydrodynamic pressure in aqueous environments. Acta Mater. 1997;45(7):2671–2684. [Google Scholar]


