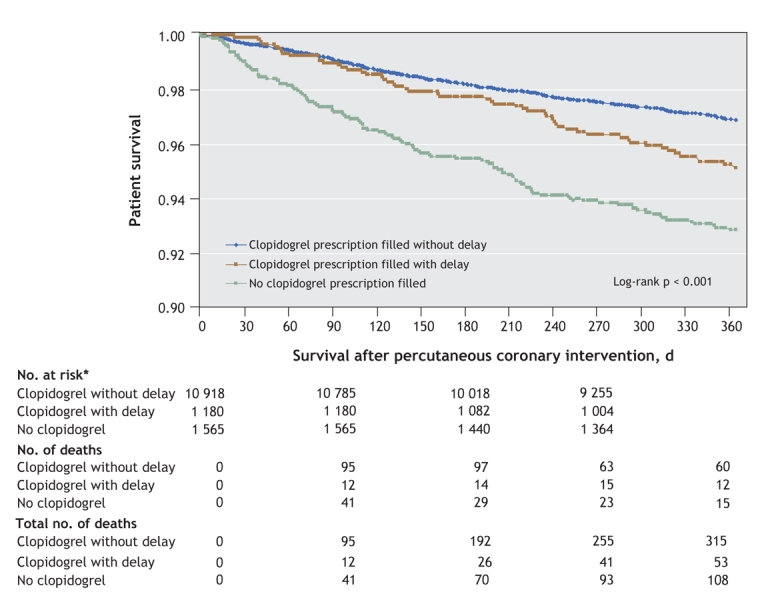
Figure 2: Survival curves for patients who underwent percutaneous coronary intervention with stenting between January 2000 and December 2004. Note: CI = confidence interval. *No. at risk excludes patients who became ineligible for drug coverage during the previous period of follow-up.
