

Abstract
We used the patch-clamp technique to study the voltage-dependent properties of the swelling-activated Cl− current (I Cl,swell) in BC3H1 myoblasts. This Cl− current is outwardly rectifying and exhibits time-dependent inactivation at positive potentials (potential for half-maximal inactivation of +75 mV). Single-channel Cl− currents with similar voltage-dependent characteristics could be measured in outside-out patches pulled from swollen cells. The estimated single-channel slope conductance in the region between +60 and +140 mV was 47 pS. The time course of inactivation was well described by a double exponential function, with a voltage-independent fast time constant (∼60 ms) and a voltage-dependent slow time constant (>200 ms). Recovery from inactivation, which occurred over the physiological voltage range, was also well described by a double exponential function, with a voltage-dependent fast time constant (10–80 ms) and a voltage-dependent slow time constant (>100 ms). The inactivation process was significantly accelerated by reducing the pH, increasing the Mg2+ concentration or reducing the Cl− concentration of the extracellular solution. Replacing extracellular Cl− by other permeant anions shifted the inactivation curve in parallel with their relative permeabilities (SCN− > I− > NO3 − > Cl− >> gluconate). A leftward shift of the inactivation curve could also be induced by channel blockers. Additionally, the permeant anion and the channel blockers, but not external pH or Mg2+, modulated the recovery from inactivation. In conclusion, our results show that the voltage-dependent properties of I Cl,swell are strongly influenced by external pH , external divalent cations, and by the nature of the permeant anion.
Keywords: anion channel, hypotonic cell swelling, kinetic model, voltage dependence
introduction
A chloride current activated by cell swelling (I Cl,swell) has been described in numerous mammalian and nonmammalian cell types (for review, see Nilius et al., 1996; Strange et al., 1996). This current is involved in a number of cellular processes including volume regulation (Hoffmann and Simonsen, 1989; Sarkadi and Parker, 1991; Kubo and Okada, 1992), transport of organic osmolytes (Kirk et al., 1992; Strange and Jackson, 1995), and possibly cell proliferation (Schlichter et al., 1996; Schumacher et al., 1995; Voets et al., 1995, 1997). I Cl,swell in the different cell types shares many properties, including a I− > Br− > Cl− >> gluconate permeability sequence, outward rectification, block by NPPB, and a dependence on intracellular ATP (Nilius et al., 1996). In contrast, large differences have been observed in the rate and extent of current inactivation at depolarizing potentials, which is prominent in many cell types, such as Xenopus oocytes (Ackerman et al., 1994), C6 glioma cells (Jackson and Strange, 1995a ), intestine 407 epithelial cells (Kubo and Okada, 1992), T84 human colonic cancer cells (Worrell et al., 1989), M-1 cortical collecting duct cells (Meyer and Korbmacher, 1996), and osteoblast (Gosling et al., 1995), but very weak or absent in parotid acinar cells (Arreola et al., 1995), endothelial cells (Nilius et al., 1994), T lymphocytes (Schumacher et al., 1995), and skate hepatocytes (Jackson et al., 1996). It is unclear whether these differences in voltage-dependent behavior arise from differences at the level of the channel molecule or from differences in the cellular environment and/or in the experimental conditions.
In this study, we describe the voltage-dependent properties of I Cl,swell in BC3H1 myoblasts. We show that extracellular pH, extracellular Mg2+, the permeant anion, and channel blockers have profound effects on these voltage-dependent properties. These results may help to explain the observed differences between the different cell types and give additional clues to elucidate the molecular nature of the channel proteins underlying I Cl,swell.
materials and methods
Culture of BH3H1 Cells
BC3H1 cells (American Type Culture Collection, Rockville, MD) were grown in DMEM containing 10% fetal calf serum, 2 mM l-glutamine, 100 U/ml penicillin, and 100 mg/liter streptomycin. Cultures were maintained at 37°C in a humidified atmosphere of 10% CO2 in air. The culture medium was exchanged every 48 h. Cells were detached by exposure to 0.5 g/liter trypsin in a Ca2+- and Mg2+-free solution for ∼180 s and reseeded on gelatin-coated cover slips. Cells were used 2–5 d after reseeding.
Solutions
The normal, isotonic bath solution was a modified Krebs solution containing (mM): 150 NaCl, 6 KCl, 1 MgCl2, 1.5 CaCl2, 10 glucose, 10 HEPES, adjusted to pH 7.4 with NaOH. The osmolality, as measured with a vapor pressure osmometer (Wescor 5500 osmometer; Schlag Instruments, Gladbach, Germany), was 320 ± 5 mOsm. The normal hyposmotic solution contained (mM): 82 NaCl, 6 KCl, 1 MgCl2, 1.5 CaCl2, 10 glucose, 10 HEPES, adjusted to pH 7.4 with 1 M NaOH. For anion selectivity experiments, NaCl was replaced by an equimolar amount of NaSCN, NaI, NaNO3, or Na-gluconate. To evaluate the effect of different external Cl− or Mg2+ concentrations, we used a hyposmotic solution containing 90 N-methyl-d-glucamine (NMDG)-Cl,1 10 glucose, and 10 HEPES. External Cl− was then lowered by replacing NMDG-Cl with mannitol. External Mg2+ was increased by replacing NMDG-Cl with MgCl2 in a way that the Cl− concentration remained unaltered. The osmolality of all hyposmotic solutions was adjusted to 200 ± 5 mOsm with mannitol. The internal pipette solution contained (mM): 40 KCl, 100 K+-aspartate, 1 MgCl2, 4 Na2ATP, 0.1 EGTA, 10 HEPES, pH 7.2 with 1 M KOH. Stock solutions of niflumic acid, flufenamic acid (Sigma Chemical Co., St. Louis, MO) and 5-nitro-2-(3-phenylpropylamino)-benzoate (NPPB; Research Biochemicals International, Natick, MA) were made in DMSO (final DMSO concentration ≤0.1%).
Current Measurements
Currents were monitored with an EPC-7 (List Electronic, Lambrecht/Pfalz, Germany) patch clamp amplifier. Patch electrodes had DC resistances between 2 and 4 MΩ. An Ag-AgCl wire was used as reference electrode. In Cl− substitution experiments, a 3-M KCl-agar bridge was used and membrane voltages were corrected for liquid junction potentials if necessary. Whole-cell membrane currents were measured using ruptured patches. Currents were sampled at 1- or 2-ms intervals and filtered at 500 or 200 Hz, respectively. Only patches with series resistances <8 MΩ were retained and between 70 and 80% of the series resistance was compensated to minimize voltage errors. Single-channel currents were sampled at 500-μs intervals and filtered at 500 Hz. Membrane currents under nonswollen conditions were usually small (<2% of the maximal current during cell swelling, see Fig. 1, A and B) and were not subtracted for analysis. The different voltage protocols are described in the figures. Unless stated otherwise, the holding potential was −80 mV, and the frequency of pulse delivery was 0.1 Hz. All experiments were performed at room temperature, between 22 and 25°C.
Figure 1.

Activation of I Cl,swell by hyposmotic cell swelling. (A) Activation of I Cl,swell, measured at +60 mV by superfusion of a BC3H1 cell with the normal hyposmotic solution (horizontal bar). (B) Current– voltage relations obtained at the times indicated in A. (C) Current measured after full activation of I Cl,swell during a 1-s step to +120 mV. (D) An outside-out patch pulled from a swollen cell was held at -80 mV and stepped to +120 mV for 1 s every 1.5 s. Records were sampled at 2 kHz and filtered at 0.5 kHz. Linear leak currents and capacitive currents were eliminated by subtracting blank records. The pipette solution contained Cs+ instead of K+ to avoid contamination by K+ channels. External solution was the NMDG+ solution containing 5 mM Mg2+. (E) Average current from 30 records from this patch. (F) Current amplitude histogram from the same 30 records. The dotted line represents the best fit with the sum of four gaussian functions. Single channel amplitude was 5.0 pA. (G) Single-channel current–voltage relation for the region between +60 and +140 mV. Full line represents a linear fit through the data, yielding a slope conductance of 47 pS. Data points are from two to eight different patches.
Data Analysis
Current voltage relations were constructed from the current during a 5-s voltage ramp from −100 to +120 mV, applied every 15 s. The time course of activation of I Cl,swell was constructed by measuring the average current in a small voltage window around +60 mV in successive traces.
The current traces during voltage steps were fit by a biexponential function:
 |
1 |
where I is current amplitude, A fast and A slow are amplitudes corresponding to the time constants τfast and τslow, and A ss is the steady state component. The first 3 ms after onset of a voltage step were excluded from the fit.
To obtain the voltage dependence of inactivation, we applied prepulses to different voltages and measured the instantaneous current amplitude during a step to a fixed potential of +120 mV. These values, normalized to that after a 1-s test pulse to −120 mV, were plotted as a function of the prepulse potential. This plot yields the voltage dependence of the “apparent” open probability (apparent P open) at the end of the prepulse, assuming that P open equals 1 after 1 s at −120 mV. The cells did not tolerate depolarizing prepulses of several seconds, which were required to obtain a complete steady state. We have therefore used the noninactivating current component A ss, as obtained from the fits to Eq. 1 and normalized to I peak as a measure of the steady state P open. Plots of the steady state P open versus potential were fitted by a Boltzmann function:
 |
2 |
where V1/2 is the membrane potential for half maximal inactivation, k V is the slope factor, and P min is a voltage-independent constant. A fast/I peak and A slow/I peak were calculated to estimate the contribution of the fast and slowly inactivating components.
We used “triple pulse” voltage protocols to obtain the voltage dependence of the recovery from inactivation. The first voltage step, a 1-s step to +120 mV, induced current inactivation. Recovery from inactivation during the second voltage step of variable length and to various voltages, was assessed from the current during a third voltage step to +120 mV. The normalized instantaneous current amplitude at +120 mV plotted versus the preceding potential yields the voltage dependence of the recovery from inactivation, expressed as percent. Dose–response curves were fitted with a Hill equation:
 |
3 |
where C is concentration, EC 50 is the concentration for half-maximal effect, and n is the Hill coefficient.
Relative ion permeabilities (P X/P Cl) were calculated from the shifts in reversal potential induced by the anion substitution using a modified Goldman-Hodgkin-Katz equation:
 |
4 |
where ΔE rev is the shift of the reversal potential, [Cl]n and [Cl]s are the extracellular Cl− concentrations in the normal and anion substituted hyposmotic solutions, and [X]s is the concentration of the substituting anion X. R, T, and F have their usual meanings.
Rate constants were fitted according to Eyring's absolute reaction rate theory, using the equation
 |
5 |
where k V is the rate constant, V is voltage, k o is the rate constant at 0 mV and A determines the voltage sensitivity (see Jackson and Strange, 1995a ).
Fitting of the data with the different models was done using home-written software. The whole cell current can be calculated as I(t) = N · i · P open(t), with N the number of channels and i the single channel conductance. The differential equations describing the kinetic model were solved analytically for each set of rate constants, and P open(t) was calculated. The product N · i was then obtained from a linear regression of the measured current I(t) as a function of P open(t). The simplex method was used to determine a set of rate constants that minimizes the residual sum of squares of the linear regression.
For the simulation of current traces, P open(t) was analytically calculated using the Mathcad plus 6.0 software (Mathsoft, Inc., Cambridge, MA), and values for N · i at the different potentials were estimated from whole-cell data.
All data points represent mean values ± SEM from at least four different cells.
results
Cell-swelling Activates a Chloride Current, ICl,swell
Superfusion of BC3H1 cells with the normal hyposmotic solution caused cell swelling accompanied by a large increase in membrane currents in all the tested cells (Fig. 1 A). Membrane currents returned to basal level after switching back to isosmotic solution (Voets et al., 1997). Current–voltage relations reconstructed from voltage ramps applied during the hyposmotic challenge (Fig. 1 B) show that the swelling-activated current reverses close to ECl (−20 mV). We have previously shown that this current is a Cl− current, I Cl,swell, with an I− > Br− > Cl− >> gluconate anion permeability sequence and that it is efficiently blocked by niflumic acid, flufenamic acid, and NPPB (Voets et al., 1997). This current inactivates during voltage steps to positive potentials >+40 mV (Fig. 1 C). The negative slope of the current–voltage relation seen at very positive potentials (Fig. 1 B) is due to inactivation of the current during the slow voltage ramp.
We observed single-channel Cl− currents in outside-out patches pulled from BC3H1 cells in which I Cl,swell had been previously activated in the whole-cell configuration. Successful patches contained either no (n = 15) or multiple (3–8; n = 17) active channels. This might indicate that these Cl− channels are clustered, as has been proposed by others (Jackson and Strange, 1995b ), or alternatively that some unknown compound needs to be present in the outside-out patch to have channel activity. Fig. 1 D shows some typical single-channel measurements during a voltage step to +120 mV. This outside-out patch initially contained three active channels (Fig. 1 D), (upper trace), but the number of active channels decreased during the experiment and activity vanished after 45 s. The ensemble current (Fig. 1 E) inactivates with a time course similar to that of the current measured in whole-cell mode (Fig. 1 C). The amplitude histogram shows four distinct current levels with a closed peak at 0.0 pA, and open peaks at 4.9, 10.0, and 15.1 pA (Fig. 1 F), indicating a single-channel amplitude of 5 pA at +120 mV. Single-channel currents could be measured during voltage steps to potentials between +60 and +140 mV, and the single-channel amplitudes at these potentials are summarized in Fig. 1 G. The slope conductance, obtained from a linear fit through the data points, was 47 pS, which is close to values obtained in cortical collecting duct cells (55 pS; Meyer and Korbmacher, 1996), C6 glioma cells (57.2 pS; Jackson and Strange, 1995b ), and T84 epithelial cells (50–60 pS; Worrell et al., 1989). A more thorough kinetic analysis of single-channel currents was not feasible due to the rapid loss of channel activity in the outside-out patches.
Characterization of the Voltage-dependent Properties of ICl,swell
The voltage-dependent properties of I Cl,swell were studied after a stable current level was reached, which usually required a hyposmotic challenge of ∼5 min (Fig. 1 A). Fig. 2 A (inset) shows the protocol that was used to study the depolarization-induced inactivation of the current. From a holding potential of −80 mV, 1-s lasting steps to potentials between +30 and +140 mV were applied, followed by a short step to +120 mV. Current inactivation occurred at potentials >+40 mV (Fig. 2 A). Both rate and extent of inactivation increased at more positive potentials. As illustrated in Fig. 2 B, the time course of inactivation was better fitted by a double than by a single exponential. Fitting was not further improved by including a third exponential term, even when pulses of longer duration were fitted (not shown). The time constants of the double exponential fits at various potentials are depicted in Fig. 2 C. The fast time constant, τfast, was only weakly voltage dependent, whereas τslow clearly decreased with stronger depolarizations. The contribution of the fast component increased monotonously (Fig. 2 D) with depolarization, whereas the contribution of the slow component first increased, and then decreased (Fig. 2 E, bell shape). The contribution of the steady state component Ass, which was used to estimate the steady state Popen, was well fitted by a Boltzmann equation with values for V 1/2 of +75 mV and for k V of 14.1 mV (Fig. 2 F). It can be seen that this steady state open probability deviates significantly from the apparent Popen at the end of the 1-s voltage steps.
Figure 2.

Inactivation of I Cl,swell during depolarizing voltage steps. (A) The voltage protocol and resulting current traces showing inactivation of I Cl,swell during depolarizing steps. (B) The current decay during the 1-s step to +140 and +80 mV is shown together with monoexponential (solid line) and biexponential (dotted lines) fits. (C) Time constants τfast (•) and τslow (○) for the double exponential fits at the different potentials. (D and E) Voltage dependence of the relative amplitudes of the fast and slow inactivating components. (F) Popen at the end of the 1-s step (•) and steady state Popen (○). The dotted line represents the best fit with Eq. 2.
Recovery from inactivation was studied using a protocol in which a 1-s voltage step to 120 mV and a second 50-ms voltage step to the same potential were separated by voltage steps to 0, −40, −80, or −120 mV with variable duration (t v; 10–1,000 ms). As illustrated in Fig. 3 A, the peak current during the second step to +120 mV gradually increased, eventually reaching the same peak level as during the first step. The recovery of the current as a function of pulse duration t v and voltage is shown in Fig. 3 B. It is clear that the recovery is significantly accelerated at more negative potentials.
Figure 3.
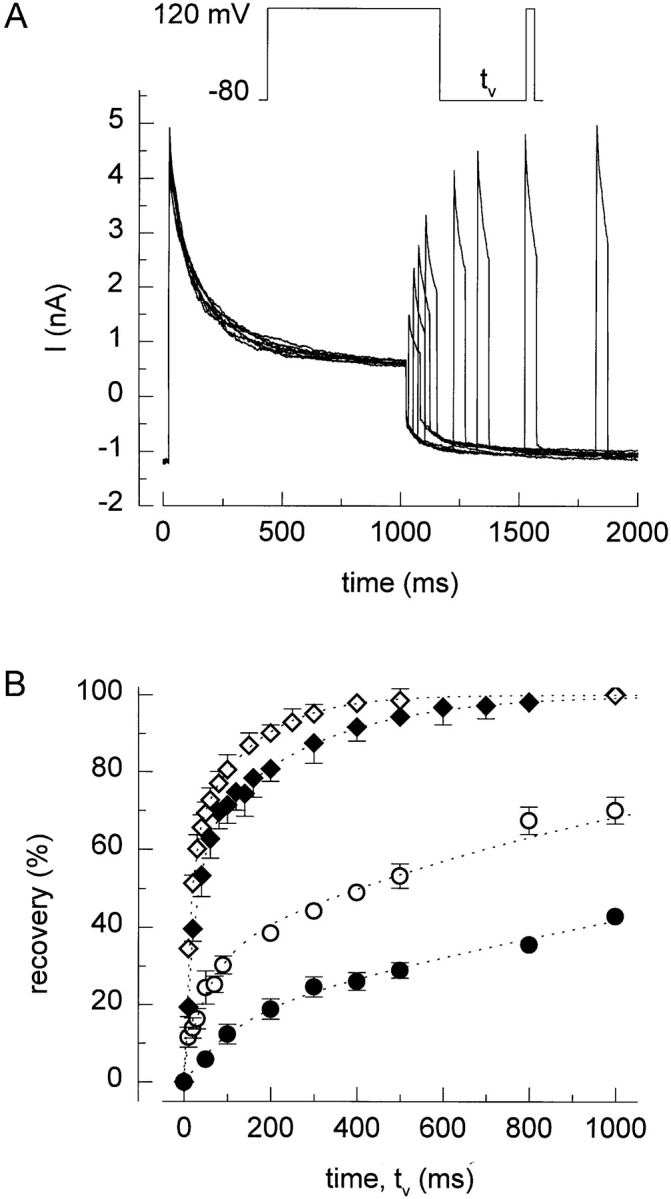
Recovery from inactivation. (A) After current inactivation during a 1-s step to +120 mV, recovery of the current increases as the duration (tv) of the voltage step to −80 mV increases. (B) Time course of current recovery at 0 (•), −40 (○), −80 (♦), and −120 mV (⋄). Dotted lines represent double exponential fit to the data points.
This voltage dependency of the current recovery was also studied with the protocol shown in Fig. 4 A. After a 1-s voltage step to 120 mV, the membrane potential was stepped to potentials between −120 and +20 mV for 500 ms, followed by a 50-ms voltage step to +120 mV. It can be clearly seen that the inward current at potentials more negative than the reversal potential for chloride (ECl = −20 mV) rapidly increases, indicating that inactivated channels reopen at these potentials. Fig. 4 B shows the fraction of the current that has recovered at the end of the 500-ms step as a function of potential. The time course of the currents at potentials (≤−40 mV was better fitted by a double than by a single exponential (Fig. 4 C). Both τslow and τfast were voltage dependent and decreased with more hyperpolarized potentials (Fig. 4 D). Similar values for τslow and τfast were obtained by fitting the data in Fig. 3 B with Eq. 1. Additionally, the relative contributions of the fast and the slow components were voltage dependent, as the contribution of the fast component increased with hyperpolarization (Fig. 4 E).
Figure 4.

Voltage dependence of recovery from inactivation. (A) Voltage protocol and current traces showing the voltage dependence of recovery from inactivation. (B) Recovery during the 500-ms step to the different voltages. (C) Current traces measured during the 500-ms step to −120, −80, and −40 mV are shown together with single exponential (solid lines) and double exponential (dotted lines) fits. (D) Values for τfast, (○) and (•), and τslow, (⋄) and (♦), obtained from fits to current traces as in Fig. 4 C (open symbols) or to the data points in Fig. 3 B (filled symbols). (E) Fractional contribution of the fast component to the recovery from inactivation.
It has been recently proposed that I Cl,swell undergoes steady state inactivation in the negative potential range (V 1/2 at −72 mV), similar to the behavior of voltage-gated Na+ and K+ channels (Braun and Schulman, 1996). Using a similar prepulse protocol as Braun and Schulman (1996), we could observe a decrease in the peak outward current during a voltage step to +120 mV after a prepulse to voltages between −120 and −30 mV (Fig. 5, A and C). Such a decrease of the peak outward current does not, however, necessarily imply a steady state inactivation, as it could also be due to an incomplete recovery of the current during the interpulse interval at holding potential −30 mV. Indeed, when the holding potential between the pulses was changed to −100 mV, allowing a complete recovery from inactivation, the peak outward current at +120 mV was no longer influenced by the preceding potential, even for 6× longer prepulses (Fig. 5 B and C). We therefore conclude that, at least in BC3H1 cells, steady state inactivation in the negative potential range is not present.
Figure 5.
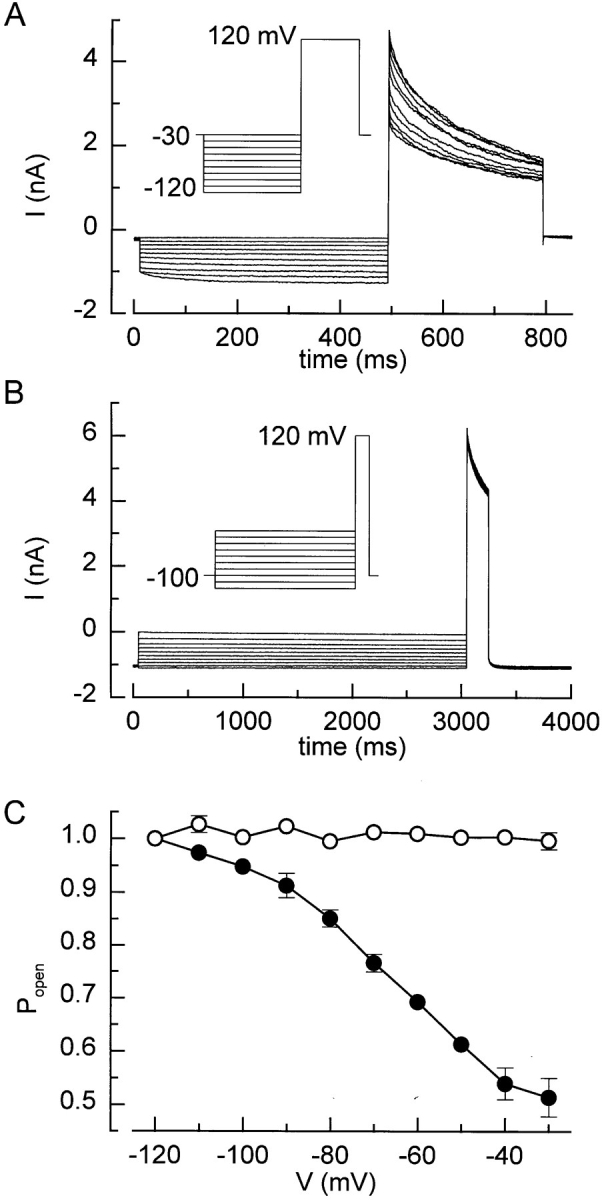
I Cl,swell does not undergo steady state inactivation. (A) From a holding potential of −30 mV, 500-ms prepulses to potentials ranging from −120 to −30 mV were applied, followed by a 300-ms pulse to +120 mV. Frequency of pulse delivery was 0.2 Hz. (B) Same protocol as in A, but the prepulse duration was 3 s and the holding potential was −100 mV. (C) Popen in function of the prepulse for protocol A (•) and B (○).
Evaluation of Kinetic Models
Jackson and Strange (1995a) proposed a simple linear model to describe the voltage-dependent behavior of I Cl,swell in C6 glioma cells. They could simulate the observed whole-cell data by manually adjusting the kinetic parameters of a model with one open and three inactivated states. However, their model predicts a complete inactivation of the current at positive potentials, which is not completely in agreement with their and our experimental data. We were interested to know whether such a simple linear model could describe the voltage-dependent behavior of I Cl,swell in BC3H1 cells and could be used to quantify the effects of modulators on this voltage dependence. We therefore evaluated linear models with one open and two and three closed states by fitting these models to both inactivating and recovering currents. The model with two closed states provided good fits to the inactivation of I Cl,swell at potentials ≥80 mV, but the fits to the recovery from inactivation at potentials ≤−60 mV were relatively poor (Fig. 6 A). Better results were obtained using the model with one open and three closed states (Jackson and Strange, 1995a ), which provided good fits to both inactivation and recovery of I Cl,swell (Fig. 6 B). The rate constants for this model could be reasonably well fitted with Eq. 5 (Fig. 6, C–E), which yielded the parameters of the kinetic model listed in Table I. These parameters were subsequently used to simulate currents traces, which were compared with the experimental data.
Figure 6.

Kinetic models. (A and B) Currents recorded during 1-s voltage steps to +80, +100, +120, and +140 mV as in Fig. 2 A (left) and during 500-ms voltage steps to −60, −80, −100, and −120 mV as in Fig. 5 A (right), were fitted with the indicated models (thin lines). For the curves at positive potentials, we assumed that all the channels were in the open state at the beginning of the voltage step. For the curves at negative potentials, the distribution of channels in the different states was obtained by fitting the preceding 1-s voltage step to +120 mV (see Fig. 5 A). (C–E) Rate constants for the linear model with one open and three closed states, with forward (○) and backward (•) rate constants. The straight lines represent the best fits with Eq. 5. Parameters of these fits are listed in Table I.
Table I.
Parameters of the Kinetic Model
| Rate constant | k 0(s−1) | A(mV−1) | ||
|---|---|---|---|---|
| k 1 | 0.790 | 0.0180 | ||
| k −1 | 51.5 | −0.0131 | ||
| k 2 | 0.199 | 0.0278 | ||
| k −2 | 11.8 | −0.0161 | ||
| k 3 | 0.416 | 0.00887 | ||
| k −3 | 2.61 | −0.0135 |
Simulated traces during 1-s voltage steps from −80 mV to potentials ranging from −120 to +120 mV (Fig. 7 A) strongly resembled the experimental current data (Fig. 7 B; average current from five cells), with similar time courses of current inactivation at positive potentials. The predicted open probabilities at the end of the 1-s voltage steps were also relatively well in agreement with the experimental data, although the model predicts a somewhat lower open probability at the end of the steps to potentials above +120 mV (Fig. 7 C).
Figure 7.

Simulation of current traces. Model currents (A) and average currents from five cells (B) during 1-s voltage steps to potentials ranging from −120 to 120 mV from a holding potential of −80 mV. (C) Comparison of the predicted open probability at the end of the voltage steps (dotted lines) with the experimental data. Model currents (D) and average currents from five cells (E) obtained with the voltage protocol shown in Fig. 4 A. (F) Comparison of the predicted recovery from inactivation (dotted lines) with the experimental data.
Simulated traces using the voltage protocol from Fig. 4 A are shown in Fig. 7 D, along with the experimental data (Fig. 7 E; average current from five cells). It can be clearly seen that, especially at potentials less negative than −80 mV, the current recovers from inactivation to a much lesser extent than predicted by the model. For better comparison, the predicted and experimental recovery from inactivation after 500 ms are summarized in Fig. 7 F.
These results indicate that the linear model with one open and three closed states (Jackson and Strange, 1995a ) provides a good description of the inactivation at positive potentials and of the recovery from inactivation at sufficiently negative potentials, but obviously fails to describe the recovery from inactivation over the whole voltage range. We therefore preferred to use the double exponential fitting instead of this kinetic model to describe the effects of modulators on the voltage- dependent properties of I Cl,swell.
Modulation of the Voltage-dependent Properties of ICl,swell
Effect of pH.
We examined the effect of extracellular pH on the inactivation and recovery of I Cl,swell. Fig. 8 A shows current traces in response to 1-s voltage steps to +120 mV in hyposmotic solutions at pH 6.4, 7.4, and 8.4. The effect of pH on the peak current amplitude is marginal, but lower pH values clearly accelerate the depolarization-induced inactivation. Whereas τfast was not significantly altered (data not shown), τslow was clearly decreased at lower pH (Fig. 8 B). Lower pH values caused a leftward shift of the inactivation curves and a decrease of the slope factor k V (Fig. 8 C). Additionally, the contribution of the fast inactivating component to the total current was increased at lower pH (Fig. 8 D). In contrast, the rate of recovery from inactivation was apparently not affected by external pH (Fig. 8, E and F).
Figure 8.

Effect of extracellular pH. (A) Comparison of the current inactivation during 1-s voltage step to +120 mV at three different external pH values. (B) Slow time constant (τslow) for current inactivation at the different pH values. (C) Steady state inactivation curves at the different extracellular pH values. Eq. 2 fitted to the data points yielded values for V 1/2 of 57, 75, and 86 mV and for k V of 11.4, 14.1, and 16.2 mV at pH 6.4, 7.4, and 8.4, respectively. (D) Voltage and pH dependence of the relative amplitude of the fast inactivating component. (E) Time constants for the recovery from inactivation at different pH values. (F) Voltage and pH dependence of the recovery from inactivation after 500 ms, determined with the same protocol as in Fig. 3 A. Symbols in B–F): •, pH 6.4; ○, pH 7.4; and ♦, pH 8.4.
Effect of Mg2+ and Ca2+.
Extracellular Mg2+ had a similar effect on the voltage-dependent kinetics as extracellular protons. Fig. 9 A shows currents measured in response to 1-s voltage steps to +120 mV in hyposmotic solutions with different Mg2+ concentrations. High Mg2+ concentrations clearly accelerate the depolarization-induced inactivation, with a similar decrease of τslow as with lower pH values (data not shown). A dose– response curve for the inactivation, measured after 1 s at +120 mV is presented in Fig. 9 B. The concentration for half-maximal effect, obtained by fitting the data with Eq. 3 was at 2.2 mM. Increasing external Mg2+ concentration from 0.5 to 20 mM caused a leftward shift of the inactivation curve and a decrease of k V and P min (Fig. 9 C). As for lower pH values, higher Mg2+ concentrations increased the contribution of the fast inactivating component (Fig. 9 D). The rate of recovery from inactivation was again not significantly affected (Fig. 9, E and F). Extracellular Ca2+ also affected the inactivation of the current, albeit with a lower potency. During a 1-s step to +120 mV, the current inactivated to 39 ± 5% of the peak value with 10 mM external Ca2+, compared with 24 ± 3% with 10 mM external Mg2+. No significant changes in the kinetics of the current were observed when Mg2+ in the internal solution was either removed or increased to 5 mM, indicating that Mg2+ acts from the outside.
Figure 9.

Effect of extracellular Mg2+. (A) Comparison of the current inactivation during 1-s voltage step to +120 mV at three different external Mg2+ concentrations. (B) Dose–response curve for the effect of Mg2+ on the current inactivation. The fraction of the current that inactivated during a 1-s step to +120 mV was plotted in a function of the extracellular Mg2+ concentration. The dotted line represents Eq. 3 fitted to the data points with EC50 = 2.2 mM and n = 0.92. (C) Steady state inactivation curves at five different extracellular Mg2+ concentrations. Eq. 2 fitted to the data points yielded values for V 1/2 of 79, 78, 78, 75, and 72 mV and for k V of 19.5, 18.8, 18.5, 13.8, and 10.4 mV at extracellular Mg2+ concentrations of 0.5, 1, 5, 10, and 20 mM, respectively. (D) Voltage and Mg2+ dependence of the relative amplitude of the fast inactivating component. (E) Time constants for the recovery from inactivation at different Mg2+ concentrations. (F) Voltage and Mg2+ dependence of the recovery from inactivation after 500 ms. Symbols in C–F : •, 0.5; ○, 1; ♦, 5; ⋄, 10; and ▪, 20 mM Mg2+.
Effect of external Cl− and other permeant anions.
We examined the effect of different external Cl− concentrations on the voltage-dependent properties of I Cl,swell. As expected for a Cl−-selective current, lowering the external Cl− concentration resulted in a decrease of the outward current and a rightward shift of the reversal potential. Lowering external Cl− also accelerated the depolarization-induced inactivation. In Fig. 10 A, current traces are shown in response to a 1-s step to 120 mV with different external Cl− concentrations. For a better comparison, traces were scaled to an identical current level at the beginning of the step. Inactivation is clearly accelerated at lower Cl− concentrations. Whereas τfast was not significantly altered (data not shown), τslow was clearly decreased at lower Cl− concentrations (Fig. 10 B). Lowering external Cl− caused a leftward shift of the inactivation curve (Fig. 10 C) and an increase of the contribution of the fast inactivating component (Fig. 10 D). Furthermore, the rate of recovery from inactivation was clearly decreased with lower external Cl− concentrations, as can be deducted from the slower time constants (Fig. 10 E) and from the recovery after 500 ms (Fig. 10 F).
Figure 10.

Effect of extracellular Cl−. (A) Current inactivation during 1-s voltage step to +120 mV at three different external Cl− concentrations. Current traces were rescaled for better comparison. (B) Slow time constants for the inactivation at the different external Cl− concentrations. (C) Steady state inactivation curves at three different extracellular Cl− concentrations. Eq. 2 fitted to the data points yielded values for V 1/2 of 63, 68, and 85 mV and for k V of 13.4, 13.7, and 15.4 mV at extracellular Cl− concentrations of 42, 65, and 110 mM. (D) Voltage and Cl− dependence of the relative amplitude of the fast inactivating component. (E) Time constants for the recovery from inactivation at different Cl− concentrations. (F) Voltage and Cl− dependence of the recovery from inactivation after 500 ms. Symbols in C–F: •, 42; ○, 65; and ♦, 110 mM Cl−.
Swelling-activated Cl− channels are not only permeable for Cl−, but also for a number of other inorganic and organic anions. We therefore investigated the effects of a number of anions (with different permeabilities as compared with Cl−) on the voltage-dependent properties of I Cl,swell. Fig. 11 A gives the relative permeabilities of the tested anions, as calculated from the shifts in the reversal potential according to Eq. 4. Fig. 11 B shows current traces in response to 1-s steps to +120 mV with three different external anions, rescaled as in Fig. 10 B. With the less permeant anion gluconate as major charge carrier, inactivation is clearly faster than with Cl−, while with the more permeant anion SCN− the inactivation is significantly slower. In general, the permeant anions shift the inactivation curve in parallel with their permeability (Fig. 11 C). With the most permeant anions (I− and SCN−) as major charge carriers, the contribution of the fast inactivating component becomes almost negligible, resulting in a quasi monoexponential inactivation behavior. On the other hand, external gluconate causes an important increase in the contribution of the fast inactivating component (Fig. 11 D). Furthermore, the rate of recovery from inactivation clearly increased with external gluconate, as compared with Cl− and SCN− (Fig. 11, E and F).
Figure 11.

Effect of anion substitution. (A) Relative permeability of the tested anions, calculated from the shifts in reversal potential. (B) Current inactivation during 1-s voltage step to +120 mV with SCN−, Cl−, and gluconate as major extracellular anions. Current traces were rescaled for better comparison. (C) Steady state inactivation curves with the five different anions. Eq. 2 fitted to the data points yielded values for V 1/2 of 52, 75, 79, 84, and 88 mV, and for k V of 12.6, 14.1, 17.9, 17.8, and 18.6 mV with, respectively, gluconate, Cl−, NO3 −, I−, and SCN−. (D) Voltage and anion dependence of the relative amplitude of the fast inactivating component. (E) Time constants for the recovery from inactivation with different external anions. (F) Effect of different extracellular anions on the recovery from inactivation after 500 ms. Symbols in C–F : •, gluconate; ○, Cl−; ♦, NO3 −; ⋄, I−; and ▪, SCN−.
Effect of channel blockers.
Various drugs are known to inhibit I Cl,swell. Fig. 12 A shows current traces in response to a 1-s step to +120 mV before and during superfusion with a solution containing 250 μM niflumic acid. Niflumic acid not only blocks I Cl,swell in a voltage-independent manner (Voets et al., 1997), but also accelerates the depolarization-induced inactivation (Fig. 12 B). The channel blockade caused a leftward shift of the inactivation curve and an increase in the contribution of the fast inactivating component (Fig. 12, C and D). Furthermore, the rate of recovery was slower in the presence of channel blockers (Fig. 12, E and F). Similar effects on the inactivation of the current were obtained with two other channel blockers, flufenamic acid and NPPB (data not shown).
Figure 12.

Effect of channel blockers. (A) Current measured during 1-s voltage step to +120 mV in the absence and presence of 250 μM niflumic acid. (B) Same traces as in A, but rescaled to illustrate the higher inactivation rate in the presence of the channel blocker. (C) Steady state inactivation curves in the absence and presence of 250 μM niflumic acid. Eq. 2 fitted to the data points yielded values for V 1/2 of 75 and 62 mV and for k V of 14.1 and 12.6 mV in the absence and presence of 250 μM niflumic acid. (D) Voltage and blockers dependence of the relative amplitude of the fast inactivating component. (E) Time constants for the recovery from inactivation in the absence and presence of 250 μM niflumic acid. (F) Effect of 250 μM niflumic acid on the recovery from inactivation after 500 ms. Symbols in B–F : •, control and ○, 250 μM niflumic acid.
discussion
Voltage-dependent Properties of the Swelling-activated Cl− Current in BC3H1 Cells
Swelling-activated Cl− currents with similar permeation properties and pharmacology have been described in numerous cell types (Nilius et al., 1996; Strange et al., 1996). In this study, we focused on the voltage-dependent properties of I Cl,swell in BC3H1 myoblasts. A typical characteristic of this current is its time-dependent inactivation during depolarizing voltage steps. This has been observed in many other cells, although the voltage sensitivity of the inactivation process seems to vary largely between different cell types. Reported values for the midpoint of inactivation are scattered between +40 mV for T84 epithelial cells (Braun and Schulman, 1996), and +105 mV for myeloma cells (Levitan and Garber, 1995), whereas in other cell types inactivation of I Cl,swell seems to be very weak or completely absent. The variability in the composition of the hyposmotic solutions used in the different studies on I Cl,swell may explain some of the differences in voltage-dependent behavior. Standard hyposmotic solutions used in the different studies differ significantly in their content of Mg2+ (between 0 and 5 mM) and Cl− (between 55 and 170 mM), which, as shown in this work, can have profound effects on the inactivation of I Cl,swell. It is also possible that cells with only weak inactivation of I Cl,swell contain Cl− channels with a much lower sensitivity to the different channel modulators. We could indeed show that I Cl,swell in calf pulmonary endothelial cells inactivates to a similar extent as I Cl,swell in BC3H1 cells when the extracellular Mg2+ concentration was increased to 30 or 60 mM (Voets, Droogmans and Nilius, unpublished observation). This indicates that the Mg2+ sensitivity of the Cl− channels in endothelial cells is at least one order of magnitude lower than in BC3H1 cells.
Modulation by Extracellular pH and Divalent Cations
Low extracellular pH has been shown to accelerate the inactivation of I Cl,swell in Xenopus oocytes (Ackerman et al., 1994; Voets et al., 1996), and C6 glioma cells (Jackson and Strange, 1995a ), but did not affect the kinetic properties of this current in M-1 cortical collecting duct cells (Meyer and Korbmacher, 1996) and parotid acinar cells (Arreola et al., 1995). In BC3H1 cells, extracellular pH strongly influenced the kinetic behavior of I Cl,swell without significantly affecting the instantaneous current amplitude. The inactivation curve was shifted to less positive voltage and τslow decreased when the extracellular pH was lowered from 8.4 to 6.4. In contrast, recovery from inactivation seemed to be unaffected by these pH changes.
Increasing the extracellular Mg2+ and/or Ca2+ concentration had a comparable effect on the current inactivation as lowering the pH. Similar results obtained in cervical carcinoma cells led to the hypothesis that the influx of Cl− anions at positive membrane potentials forces the Mg2+ ions and/or protons into a blocking site within the channel pore (Anderson et al., 1995). However, lowering the external Cl− concentration and hence the influx of Cl− anions did not cause the expected decrease in inactivation, but, on the contrary, resulted in a faster and more pronounced inactivation. It seems very unlikely that under these conditions Mg2+ ions can reach a blocking site within the channel, against the large electrical field. We therefore propose that extracellular Mg2+ ions and possibly also protons bind to an extracellular site, likely outside the electrical field, and that this binding enhances the inactivation of the channel.
Modulation by the Permeant Anion and by Channel Blockers
An important finding is that the voltage-dependent properties are dependent on the permeant anion itself. Indeed, lowering the extracellular Cl− concentration caused a shift of the inactivation curve to less positive potentials and of the recovery from inactivation to more negative potentials. Moreover, replacing extracellular Cl− with gluconate, NO3 −, I−, or SCN− caused a shift of the inactivation curve, parallel with the relative permeability of these different anions. The recovery process was also favored when extracellular anions with a higher permeability were present. Similarly, the rate of inactivation of I Cl,swell in M-1 cortical collecting duct cells was shown to decrease when extracellular Cl− was replaced by SCN−, I−, or Br− (Meyer and Korbmacher, 1996). These findings indicate that binding of an extracellular anion to the channel, possibly to a site within the ion-selective channel pore, prevents the channel from closing at depolarizing potentials and favors the reopening at more negative potentials. The observed modulation of the voltage-dependent properties by blockers of I Cl,swell (Gosling et al., 1996) may then result from the fact that these blockers hinder the entering of the anions into the pore.
Comparison with Cloned Cl− Channels
The molecular nature of the channel that underlies I Cl,swell is still far from being resolved (Nilius et al., 1996). Based on several phenotypical similarities between I Cl,swell and the chloride current induced by overexpression in Xenopus oocytes of pICln (Paulmichl et al., 1992), I Cl,swell was proposed to be mediated by a porin-like channel consisting of pICln molecules (Gschwentner et al., 1995; Jackson and Strange, 1995a , 1995b ; Strange et al., 1996). This hypothesis is, however, incompatible with our recent findings that the pICln-induced current is endogenous to Xenopus oocytes but different from I Cl,swell (Buyse et al., 1997; Voets et al., 1996).
Some of the properties of I Cl,swell described in this work are reminiscent of the characteristics of voltage-gated chloride channels belonging to the ClC family (Jentsch et al., 1995). A first point of similarity is the effect of the permeant anion on the kinetic properties. Modulation of the gating of ClC-0 (the major Cl− channel from the Torpedo electric organ) and ClC-1 (the major skeletal muscle Cl− channel) by external Cl− and other permeant anions has been extensively studied (Pusch et al., 1995; Chen and Miller, 1996; Fahlke et al., 1996; Rychkov et al., 1996). It was proposed that Cl− ions can bind to an anion binding site accessible only from the exterior, and that this binding and possibly the movement of the bound Cl− ion within the pore causes the voltage dependency of the gating (Chen and Miller, 1996; Pusch et al., 1995). The third member of the ClC family, the ubiquitously expressed ClC-2, was shown to be activated by cell swelling (Gründer et al., 1992; Thiemann et al., 1992). Additionally, the gating of I Cl,swell and of ClC-0, ClC-1, and ClC-2 is modulated by external pH (Hanke and Miller, 1983; Fahlke et al., 1996; Rychkov et al., 1996; Jordt and Jentsch, 1997). Other biophysical properties of these ClC channels (inward rectification, Cl− > Br− > I− permeability sequence, single-channel conductances below 10 pS) are, however, incompatible with those of I Cl,swell described in this work. It can, however, not be excluded that I Cl,swell is mediated by another (not yet cloned) member of the still expanding ClC family.
Acknowledgments
We thank Drs. J. Eggermont, V. Manolopoulos, and F. Viana for their helpful comments.
This work was supported by the European grant BMH4-CT96-0602 (coordinator B. Nilius).
Abbreviation used in this paper
- NMDG
N-methyl-d-glucamine
references
- Ackerman MJ, Wickman KD, Clapham DE. Hypotonicity activates a native chloride current in Xenopus oocytes. J Gen Physiol. 1994;103:153–179. doi: 10.1085/jgp.103.2.153. [DOI] [PMC free article] [PubMed] [Google Scholar]
- Anderson JW, Jirsch JD, Fedida D. Cation regulation of anion current activated by cell swelling in two types of human epithelial cancer cells. J Physiol (Camb) 1995;483:549–557. doi: 10.1113/jphysiol.1995.sp020605. [DOI] [PMC free article] [PubMed] [Google Scholar]
- Arreola J, Melvin JE, Begenisich T. Volume-activated chloride channels in rat parotid acinar cells. J Physiol (Camb) 1995;484:677–687. doi: 10.1113/jphysiol.1995.sp020695. [DOI] [PMC free article] [PubMed] [Google Scholar]
- Braun S, Schulman H. Distinct voltage-dependent gating behaviors of a swelling-activated chloride current in human epithelial cells. J Physiol (Camb) 1996;495:743–753. doi: 10.1113/jphysiol.1996.sp021630. [DOI] [PMC free article] [PubMed] [Google Scholar]
- Buyse G, Voets T, Tytgat J, De Greef C, Droogmans G, Nilius B, Eggermont J. Expression of human pICln and ClC-6 in Xenopusoocytes induces an identical endogenous chloride conductance. J Biol Chem. 1997;272:3615–3621. doi: 10.1074/jbc.272.6.3615. [DOI] [PubMed] [Google Scholar]
- Chen T-Y, Miller C. Nonequilibrium Gating and Voltage Dependence of the CLC-0 Cl−Channel. J Gen Physiol. 1996;108:237–250. doi: 10.1085/jgp.108.4.237. [DOI] [PMC free article] [PubMed] [Google Scholar]
- Fahlke C, Rosenbohm A, Mitrovic N, George AL, Rüdel R. Mechanisms of voltage-dependent gating in skeletal muscle chloride channels. Biophys J. 1996;71:695–706. doi: 10.1016/S0006-3495(96)79269-X. [DOI] [PMC free article] [PubMed] [Google Scholar]
- Gosling M, Poyner DR, Smith JW. Effects of arachidonic acid upon the volume-sensitive chloride current in rat osteoblast-like (ROS 17/2.8) cells. J Physiol (Camb) 1996;493:613–623. doi: 10.1113/jphysiol.1996.sp021408. [DOI] [PMC free article] [PubMed] [Google Scholar]
- Gosling M, Smith JW, Poyner DR. Characterization of a volume-sensitive chloride current in rat osteoblast-like (ROS 17/2.8) cells. J Physiol (Camb) 1995;485:671–682. doi: 10.1113/jphysiol.1995.sp020761. [DOI] [PMC free article] [PubMed] [Google Scholar]
- Gründer S, Thiemann A, Pusch M, Jentsch TJ. Regions involved in the opening of CIC-2 chloride channel by voltage and cell volume. Nature (Lond) 1992;360:759–762. doi: 10.1038/360759a0. [DOI] [PubMed] [Google Scholar]
- Gschwentner M, Nagl UO, Woll E, Schmarda A, Ritter M, Paulmichl M. Antisense oligonucleotides suppress cell-volume–induced activation of chloride channels. Pflügers Archiv. 1995;430:464–470. doi: 10.1007/BF00373882. [DOI] [PubMed] [Google Scholar]
- Hanke W, Miller C. Single chloride channels from TorpedoElectroplax: activation by protons. J Gen Physiol. 1983;82:25–45. doi: 10.1085/jgp.82.1.25. [DOI] [PMC free article] [PubMed] [Google Scholar]
- Hoffmann EK, Simonsen LO. Membrane mechanisms in volume and pH regulation in vertebrate cells. Physiol Rev. 1989;69:315–382. doi: 10.1152/physrev.1989.69.2.315. [DOI] [PubMed] [Google Scholar]
- Jackson PS, Churchwell K, Ballatori N, Boyer JL, Strange K. Swelling-activated anion conductance in skate hepatocytes: regulation by cell Cl−and ATP. Am J Physiol. 1996;39:C57–C66. doi: 10.1152/ajpcell.1996.270.1.C57. [DOI] [PubMed] [Google Scholar]
- Jackson PS, Strange K. Characterization of the voltage-dependent properties of a volume-sensitive anion conductance. J Gen Physiol. 1995a;105:661–676. doi: 10.1085/jgp.105.5.661. [DOI] [PMC free article] [PubMed] [Google Scholar]
- Jackson PS, Strange K. Single-channel properties of a volume-sensitive anion conductance. Activation occurs by abrupt switching of closed channels to an open state. J Gen Physiol. 1995b;105:643–660. doi: 10.1085/jgp.105.5.643. [DOI] [PMC free article] [PubMed] [Google Scholar]
- Jentsch TJ, Gunther W, Pusch M, Schwappach B. Properties of voltage-gated chloride channels of the ClC gene family. J Physiol (Camb) 1995;482:19S–25S. doi: 10.1113/jphysiol.1995.sp020560. [DOI] [PMC free article] [PubMed] [Google Scholar]
- Jordt S-E, Jentsch TJ. Molecular dissection of gating in the ClC-2 chloride channels. EMBO (Eur Mol Biol Organ) J. 1997;16:1582–1592. doi: 10.1093/emboj/16.7.1582. [DOI] [PMC free article] [PubMed] [Google Scholar]
- Kirk K, Ellory JC, Young JD. Transport of organic substrates via a volume-activated channel. J Biol Chem. 1992;267:23475–23478. [PubMed] [Google Scholar]
- Kubo M, Okada Y. Volume-regulatory Cl−channel currents in cultured human epithelial cells. J Physiol (Camb) 1992;456:351–371. doi: 10.1113/jphysiol.1992.sp019340. [DOI] [PMC free article] [PubMed] [Google Scholar]
- Levitan I, Garber S. Voltage-dependent inactivation of volume-regulated Cl−current in human T84 colonic and B-cell myeloma cell lines. Pflügers Archiv. 1995;431:297–299. doi: 10.1007/BF00410203. [DOI] [PubMed] [Google Scholar]
- Meyer K, Korbmacher C. Cell swelling activates ATP-dependent voltage-gated chloride channels in M-1 mouse cortical collecting duct cells. J Gen Physiol. 1996;18:177–193. doi: 10.1085/jgp.108.3.177. [DOI] [PMC free article] [PubMed] [Google Scholar]
- Nilius B, Eggermont J, Voets T, Droogmans G. Volume-activated Cl−channels. Gen Pharmacol. 1996;27:1131–1140. doi: 10.1016/s0306-3623(96)00061-4. [DOI] [PubMed] [Google Scholar]
- Nilius B, Oike M, Zahradnik I, Droogmans G. Activation of a Cl−current by hypotonic volume increase in human endothelial cells. J Gen Physiol. 1994;103:787–805. doi: 10.1085/jgp.103.5.787. [DOI] [PMC free article] [PubMed] [Google Scholar]
- Paulmichl M, Li Y, Wickman K, Ackerman M, Peralta E, Clapham D. New mammalian chloride channel identified by expression cloning. Nature (Lond) 1992;356:238–241. doi: 10.1038/356238a0. [DOI] [PubMed] [Google Scholar]
- Pusch M, Ludewig U, Rehfeldt A, Jentsch TJ. Gating of the voltage-dependent chloride channel CIC-0 by the permeant anion. Nature (Lond) 1995;373:527–531. doi: 10.1038/373527a0. [DOI] [PubMed] [Google Scholar]
- Rychkov GY, Pusch M, Astill DJ, Roberst ML, Jentsch TJ, Bretag AH. Concentration and pH dependence of skeletal muscle chloride channel ClC-1. J Physiol (Camb) 1996;497:423–435. doi: 10.1113/jphysiol.1996.sp021778. [DOI] [PMC free article] [PubMed] [Google Scholar]
- Sarkadi B, Parker JC. Activation of ion transport pathways by changes in cell volume. Biochim Biophys Acta. 1991;1071:407–427. doi: 10.1016/0304-4157(91)90005-h. [DOI] [PubMed] [Google Scholar]
- Schlichter LC, Sakellaropoulos G, Ballyk B, Pennefather PS, Phipps DJ. Properties of K+ and Cl−channels and their involvement in proliferation of rat microglial cells. Glia. 1996;17:225–236. doi: 10.1002/(SICI)1098-1136(199607)17:3<225::AID-GLIA5>3.0.CO;2-#. [DOI] [PubMed] [Google Scholar]
- Schumacher PA, Sakellaropoulos G, Phipps DJ, Schlichter LC. Small-conductance chloride channels in human peripheral T lymphocytes. J Membr Biol. 1995;145:217–232. doi: 10.1007/BF00232714. [DOI] [PubMed] [Google Scholar]
- Strange K, Emma F, Jackson PS. Cellular and molecular physiology of volume-sensitive anion channels. Am J Physiol. 1996;270:C711–C730. doi: 10.1152/ajpcell.1996.270.3.C711. [DOI] [PubMed] [Google Scholar]
- Strange K, Jackson PS. Swelling-activated organic osmolyte efflux: a new role for anion channels. Kidney Int. 1995;48:994–1003. doi: 10.1038/ki.1995.381. [DOI] [PubMed] [Google Scholar]
- Thiemann A, Gründer S, Pusch M, Jentsch TJ. A chloride channel widely expressed in epithelial and non-epithelial cells. Nature (Lond) 1992;356:57–60. doi: 10.1038/356057a0. [DOI] [PubMed] [Google Scholar]
- Voets T, Buyse G, Tytgat J, Droogmans G, Eggermont J, Nilius B. The chloride current induced by expression of the protein pICln in Xenopusoocytes differs from the endogenous volume-sensitive chloride current. J Physiol (Camb) 1996;495:441–447. doi: 10.1113/jphysiol.1996.sp021605. [DOI] [PMC free article] [PubMed] [Google Scholar]
- Voets T, Szücs G, Droogmans G, Nilius B. Blockers of volume-activated Cl−currents inhibit endothelial cell proliferation. Pflügers Archiv. 1995;431:132–134. doi: 10.1007/BF00374387. [DOI] [PubMed] [Google Scholar]
- Voets T, Wei L, De Smet P, Van Driessche W, Eggermont J, Droogmans G, Nilius B. Down regulation of volume-activated Cl−currents during muscle differentiation. Am J Physiol. 1997;272:C667–C674. doi: 10.1152/ajpcell.1997.272.2.C667. [DOI] [PubMed] [Google Scholar]
- Worrell RT, Butt AG, Cliff WH, Frizzell RA. A volume-sensitive chloride conductance in human colonic cell line T84. Am J Physiol. 1989;256:C1111–C1119. doi: 10.1152/ajpcell.1989.256.6.C1111. [DOI] [PubMed] [Google Scholar]