

Abstract
We have monitored electrical activity, voltage-gated Ca2+ currents, and exocytosis in single rat glucagon-secreting pancreatic A-cells. The A-cells were electrically excitable and generated spontaneous Na+- and Ca2+-dependent action potentials. Under basal conditions, exocytosis was tightly linked to Ca2+ influx through ω-conotoxin-GVIA–sensitive (N-type) Ca2+ channels. Stimulation of the A-cells with adrenaline (via β-adrenergic receptors) or forskolin produced a greater than fourfold PKA-dependent potentiation of depolarization-evoked exocytosis. This enhancement of exocytosis was due to a 50% enhancement of Ca2+ influx through L-type Ca2+ channels, an effect that accounted for <30% of the total stimulatory action. The remaining 70% of the stimulation was attributable to an acceleration of granule mobilization resulting in a fivefold increase in the number of readily releasable granules near the L-type Ca2+ channels.
Keywords: glucagon, Ca2+, secretion
introduction
Glucagon is secreted by the pancreatic A-cells and is the body's major catabolic hormone (Kreymann and Bloom, 1991). The release of glucagon is controlled by nutrients, circulating hormones, and neurotransmitters (Pipeleers et al., 1985; Rorsman et al., 1991; Brunicardi et al., 1995). However, knowledge about the cellular processes involved remains fragmentary. Earlier experiments have demonstrated that pancreatic A-cells are electrically excitable and generate Na+- and Ca2+-dependent action potentials in the absence of glucose (Rorsman and Hellman, 1988). How secretion in the A-cell is related to electrical activity is not known, but, in general, conditions that are associated with stimulation of glucagon release involve an elevation of the cytoplasmic Ca2+ concentration ([Ca2+]i) (Hellman et al., 1994; Berts et al., 1995, 1996). Here we have combined the whole-cell configuration of the patch-clamp technique (both the standard and the perforated patch varieties), microfluorimetry of [Ca2+]i, photorelease of caged compounds, and capacitance measurements to explore the fundamental properties of exocytosis in isolated rat pancreatic A-cells. We thereby provide direct evidence for Ca2+-dependent exocytosis in glucagon-secreting cells. Under basal conditions, exocytosis was tightly correlated with Ca2+ influx through ω-conotoxin–sensitive (N-type) Ca2+ channels. Addition of adrenaline, by binding β-adrenoceptors, produced a fourfold potentiation of depolarization-evoked exocytosis. We demonstrate here that this was the combined effect of the selective stimulation of Ca2+ influx through nifedipine-sensitive L-type Ca2+ channels and a late effect exerted distally to Ca2+ influx, which leads to an apparent “sensitization” of the secretory machinery to increases in [Ca2+]i. The latter effect we attribute to the stimulation of granule mobilization resulting in the translocation of granules from a reserve pool into a readily releasable pool of granules that can be released in response to Ca2+ influx through L-type Ca2+ channels.
materials and methods
Cells
Male Lewis rats were purchased from a commercial breeder (Møllegaard, Lille Skensved, Denmark). The rats were anaesthetized by pentobarbital (100 mg/kg i.p.). After the removal of the pancreas, pancreatic islets were isolated by collagenase digestion. Isolated islets were dispersed into single cells using dispase and pancreatic A-cells separated by fluorescence-activated cell sorting as described elsewhere (Josefsen et al., 1996). Based on the hormonal contents, we estimate that our preparation contains 80% A- and <3% B-cells. This percentage of A-cell agrees favorably with the fraction electrically active cells in the absence of glucose. Cells were plated on plastic Petri dishes (Nunc A/S, Roskilde, Denmark) and, for microfluorometry of [Ca2+]i, on 22-mm glass cover slips and maintained for 2–4 d in RPMI 1640 medium (Gibco BRL, Life Technologies Inc., Gaithersburg, MD) supplemented with 10% fetal calf serum (A.H. Diagnostic, Aarhus, Denmark), 10 U/ml−1 penicillin, and 10 μg/ml−1 streptomycin (both from Gibco BRL, Life Technologies Inc.) at 37°C in a humidified atmosphere.
Electrophysiology
The membrane potential and whole-cell currents displayed in Fig. 1 were recorded using an EPC-9 patch-clamp amplifier and the software Pulse (Heka Elektronik, Lambrecht/Pfalz, Germany). Exocytosis was monitored as changes in membrane capacitance (Neher and Marty, 1982) using an EPC-7 patch-clamp amplifier (List Elektronik, Darmstadt, Germany) and in-house software (Ämmälä et al., 1993b ) written in Axobasic (Axon Instruments, Burlingame, CA). Experiments commenced when two successive depolarizations applied under control conditions evoked the same increase in cell capacitance. Unless otherwise indicated, the interval between the depolarizations was 2 min to avoid depression of exocytosis. In Figs. 1, 4, and 5, leak currents and capacitive transients were removed on-line using a p/4 protocol. Control experiments were conducted after blockage of the Ca2+ channels with Co2+ to determine that the leak current was linear and that the subtraction protocol correctly compensates for the contribution of the leak. In the remaining experiments, the current amplitudes have been corrected for linear leak by taking the current below the zero current level during the depolarizations, which went to 0 mV. It was ascertained that the leak is linear and that it, with the solutions used, reverses around 0 mV. Throughout this study, the zero-current potential of the pipette was adjusted with the pipette in the bath. All experiments except those in Figs. 1 B and 7, in which the standard whole-cell configuration was used, have been performed using the perforated patch whole-cell recording mode (Horn and Marty, 1988). In these experiments, electrical contact with the cell interior was established by the addition of amphotericin B (final concentration: 0.24 mg/ ml) to the pipette solution (Rae et al., 1991).
Figure 1.

Spontaneous electrical activity in isolated rat pancreatic A-cells. (A) Overshooting action potentials generated by single A-cell in the absence of glucose. The dotted horizontal line indicates the zero-voltage level. (B) Voltage-gated inward currents evoked by membrane depolarizations from −90 to −15 mV or −70 to 0 mV as indicated. Presence of voltage-gated Na+ currents and N- and L-type Ca2+ channels revealed by inhibition by tetrodotoxin (0.3 μM) and ω-conotoxin-GVIA (1 μM) observed in the same cell and the inhibition by nifedipine (50 μM) observed in a different cell. Effects of ω-conotoxin-GVIA and nifedipine were tested in the presence of tetrodotoxin.
Figure 4.
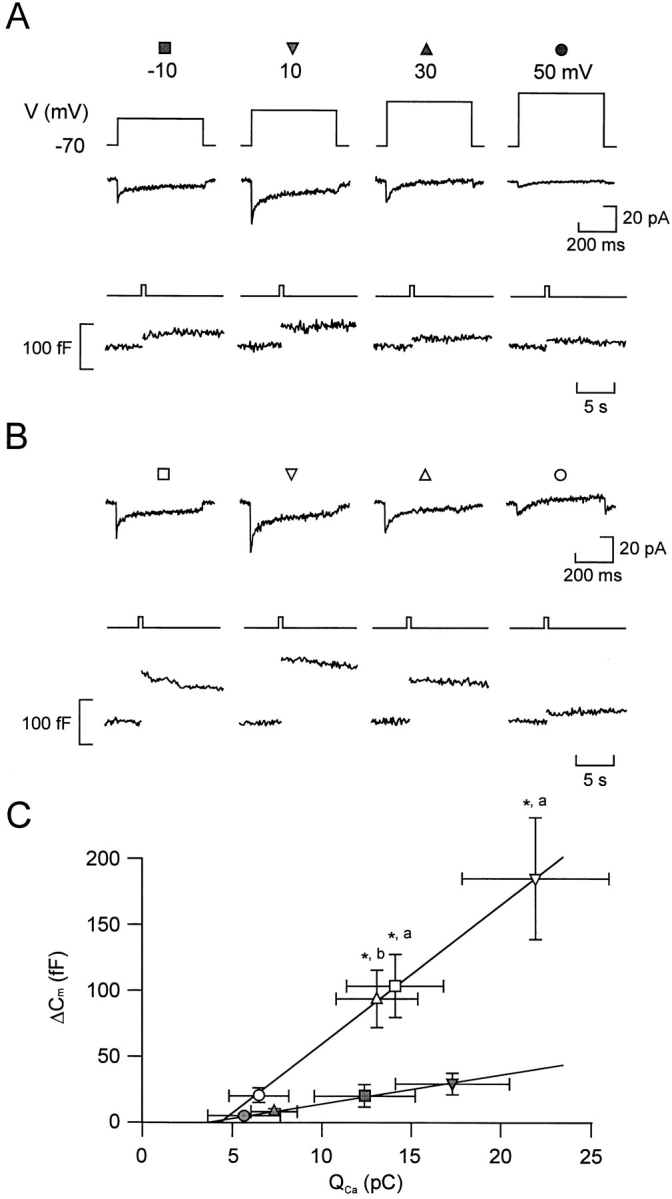
Relationship between Ca2+ entry and exocytosis. Ca2+ currents (middle) and changes in cell capacitance (bottom) evoked by 500-ms depolarizations from −70 to −10, +10, +30, and +50 mV applied at 30-s intervals before (A) and 2 min after (B) the addition of forskolin. (C) Increases in cell capacitance (ΔCm) displayed against the integrated Ca2+ current (Qca) in the absence (filled symbols) and presence (open symbols) of forskolin. The different symbols refer to the responses evoked by 500-ms depolarizations from −70 to −10 (Δ, ▴), +10 (▿, ▾), +30 (□, ▪), and +50 mV (○, •). Data are presented as mean ± SEM of six separate experiments. The lines represent least-squares fit to the mean values. *P < 0.01 (vs. capacitance increase evoked by the depolarization to the same voltage under control conditions) and a P < 0.01 and b P < 0.02 (vs. integrated Ca2+ current elicited by the same depolarization under control conditions).
Figure 5.

Voltage dependence of Ca2+ current amplitude, cytoplasmic Ca2+ transients, and exocytosis. (A). Ca2+ currents (ICa,, second from top), increases in cell capacitance (Cm,, second from bottom), and changes in the cytoplasmic Ca2+ concentration ([Ca2 + ]i) elicited by voltage-clamp depolarizations going from −70 to +50, +30, +10, and −10 mV (top). Depolarizations were 500-ms long and were applied at ∼40-s intervals. (B) Depolarization-evoked integrated Ca2+ currents (QCa ;, ▪), increases in cell capacitance (ΔCm ;, ○), and cytoplasmic Ca2+ (Δ[Ca2 + ]i ;, •) plotted against the voltage during the depolarizing commands.
Figure 7.

Stimulation of exocytosis by photorelease of cAMP at fixed internal [Ca2+]i. Effects of photoreleasing ∼30 μM cAMP from a caged precursor at 0.4 μM (A) and 0.17 μM (B) free intra-cellular Ca2+. The dotted line indicates the extrapolated rate of capacitance increase before the photorelease of cAMP in the presence of 0.4 μM [Ca2+]i. The time at which photolysis of caged cAMP was effected is indicated by the vertical line.
Solutions
The standard extracellular medium consisted of (mM): 118 NaCl, 1.2 MgCl2, 2.6 CaCl2, 5 Hepes (pH 7.4 with NaOH), 5 d-glucose, and 20 TEA-Cl (to block voltage-dependent outward K+ current). In Fig. 1 A, glucose was omitted and TEA-Cl was equimolarly replaced with NaCl. The pipette solution used for all perforated patch recordings, except those in Fig. 1 A, contained (mM): 76 Cs2SO4, 10 NaCl, 10 KCl, 1 MgCl2, and 5 Hepes, pH 7.35. For the membrane potential recording (see Fig. 1 A), the pipette solution consisted of (mM): 76 K2SO4, 10 NaCl, 10 KCl, 1 MgCl2, and 5 Hepes, pH 7.35. The inward voltage-gated currents shown in Fig. 1 B were recorded using the standard whole-cell configuration with a pipette solution containing (mM): 125 CsCl, 10 EGTA, 30 NaOH, 1 MgCl2, 3 Mg-ATP, and 5 Hepes, pH 7.15. In the experiments involving photorelease of caged cyclic AMP, the pipette solution contained (mM): 125 K-glutamate, 30 KOH, 1 MgCl2, 5 or 6.7 CaCl2, 10 EGTA, 3 Mg-ATP, 0.1 caged cyclic AMP (Calbiochem Corp., La Jolla, CA), and 5 Hepes, pH 7.15. The Ca2+/EGTA mixtures yielded calculated free Ca2+ concentrations of 0.17 and 0.4 μM. The efficiency of liberation was assumed to be the same as that for NP-EGTA, which was determined as 30% for a 2-ms flash (340 J) delivered by an XF10 flash apparatus (Hi-Tech Scientific, Salisbury, UK). Photoliberation was effected once the values for the cell capacitance, the series conductance, and the phase angle had been adjusted and a steady state rate of capacitance increase was observed (≥ 1 min after establishing the whole-cell configuration). Tetrodotoxin and nifedipine were from Sigma Chemical Co. (St. Louis, MO) and ω-conotoxin-GVIA was purchased from Alomone Labs. (Jerusalem, Israel). Tetrodotoxin was normally not included in the bath solutions as the rapidly inactivating Na+ current in the vast majority of cells was small and thus did not contribute significantly to the measured integrated current. The β-receptor agonist and antagonist isoprenaline and propanolol were from RBI (Natick, MA) and Rp-8-Br-cAMPS was purchased from Biolog (Hamburg, Germany). All experiments, except those displayed in Fig. 1, which were performed at room temperature (22°C), were conducted at 32–34°C.
[Ca2+]i Measurements
The cytoplasmic free Ca2+ concentration was measured by dual excitation spectrofluorimetry using fura-2 (Fig. 3) as the Ca2+ indicator as described elsewhere (Bokvist et al., 1995) or by dual emission spectrofluorimetry using indo-1 (Rorsman et al., 1992; Fig. 5). The cells were loaded with 0.2 μM fura-2/AM or 0.5 μM indo-1/AM (both from Molecular Probes, Inc., Eugene, OR) for 20–25 min. In the fura-2 recordings, the measurements were carried out using an Axiovert 100 inverted microscope with a Plan-Neofluar 100×/1.30 N.A. objective and a fluorescence imaging system (Ionoptix Inc., Milton, MA). Excitation was effected at 340 and 380 nm, and emitted light was recorded at 510 nm with an interval of 200 ms between each data point. In the indo-1 measurements, an Axiovert 35 microscope (Carl Zeiss Inc., Thornwood, NY) and a 100×/1.3 N.A. objective were used in conjunction with the hard- and software of Ionoptix Inc. Excitation was effected at 355 nm and emitted light detected at 405 and 485 nm, and the sample frequency was 100 Hz.
Figure 3.

β-adrenergic stimulation of Ca2+-dependent glucagon release involves activation of protein kinase A. (A) Simultaneous recordings of Ca2+ currents (second from top) and changes of [Ca2+]i (second from bottom) and membrane capacitance (bottom) evoked by 500-ms depolarizations from −70 to 0 mV (top) before and 2 min after addition of the β-adrenergic agonist isoprenaline. (B) Histograms summarizing the effects of isoprenaline on the amplitude of the [Ca2+]i-transient, the integrated Ca2+-current (QCa), and the depolarization-evoked increase in cell capacitance (ΔCm). (C) Ca2+ currents (middle) and changes in cell capacitance (bottom) evoked by 500-ms depolarizations from −70 to 0 mV before and 2 min after the addition of isoprenaline in the presence of Rp-8-Br-cAMPS (100 μM). In addition, the A-cell had been pretreated with PKA inhibitor for >20 min before the experiment. (D) Lack of effects of isoprenaline on the integrated Ca2+ current (QCa) and the depolarization-evoked increase in cell capacitance (ΔCm) in cells pretreated with Rp-8-Br-cAMPS. In A and C, the dotted lines above the current traces indicate the zero-current level. Data in B and D are mean ± SEM of indicated number (n) of experiments. *P < 0.05; **P < 0.01.
Data Analysis
Data are presented as mean ± SEM and statistical significance evaluated using Student's t test. Throughout the text, effects are quoted as the percentage change, taking the control value as 100%. Thus, stimulation of exocytosis from a basal response of 100–200 f F (an increment of 100 fF) corresponds to a 100% increase, whereas an increase from 10–50 f F (an increment of 40 f F) is equivalent to an enhancement of 400%. This is the reason why the percentage values in some experiments indicate a greater stimulation than that suggested by the actual data presented in the histograms.
results
Rat Pancreatic A-Cells Are Electrically Active in the Absence of Glucose
Fig. 1 A illustrates the electrical activity recorded from a single rat A-cell using the perforated patch whole-cell configuration in the absence of glucose, a condition known to be associated with stimulation of glucagon secretion (Gerich, 1983). Regenerative electrical activity in the absence of glucose was observed in 76% (13 out of 17) cells tested and consisted of overshooting action potentials originating from a membrane potential of −60 mV. This is in keeping with the previous observation of spontaneous electrical activity (seen as “action currents”) recorded in cell-attached patches on isolated A-cells in the absence of glucose (Wesslén et al., 1988). Glucose (20 mM) inhibited electrical activity in eight of nine cells tested (not shown). The inhibition was reversible in the single experiment that lasted long enough for the reversibility to be tested. Insulin (10 nM) did not influence A-cell electrical activity whether it was applied in the absence or presence of glucose. This glucose dependence is precisely that expected for glucagon-secreting A-cells and is opposite that of the insulin-secreting B-cell.
Voltage-clamp recordings using the standard whole-cell configuration revealed that the action potentials involved the activation of a transient tetrodotoxin-sensitive Na+ current (Fig. 1 B, left) and a sustained Ca2+ current composed of both ω-conotoxin-GVIA–sensitive (Fig. 1 B, middle) and nifedipine-blockable (Fig. 1 B, right) components, suggesting the participation of N- and L-type Ca2+ channels. In this study, we investigate the relative contribution of the N- and L-type Ca2+ channels to the whole-cell Ca2+ current and their significance for the initiation of exocytosis.
β-Adrenergic Modulation of Ca2+-dependent Exocytosis in the A-Cell
We next investigated the capacity of Ca2+ influx to evoke exocytosis in the A-cell using the perforated patch technique. Under basal conditions, a membrane depolarization from −70 to 0 mV evoked a Ca2+ current and a small step increase in cell capacitance (Fig. 2 A, left). After stimulation with adrenaline, the same depolarization elicited a much larger capacitance increase. The subsequent gradual return of the capacitance trace towards the initial level we attribute to the retrieval of the secreted granular membranes by endocytosis (Fig. 2 A, right). The depolarizations and increases in cell capacitance were not associated with any changes in cell conductance and the capacitance measurements are accordingly likely to report exocytosis. On average, adrenaline increased depolarization-evoked exocytosis by 325 ± 74% (n = 8), an effect that was associated with 54 ± 12% (n = 6) stimulation of the integrated Ca2+ current (Fig. 2 B). The action of adrenaline was mediated by β-receptors and could be abolished by the β-adrenoreceptor antagonist propanolol (Fig. 2, C–D). By contrast, adrenaline remained an effective potentiator of exocytosis in the presence of the α2-adrenoreceptor antagonist yohimbine (not shown).
Figure 2.

β-adrenergic stimulation of Ca2+-dependent exocytosis in A-cells. (A) Ca2+ currents (second from top), capacitance increases (second from bottom), and membrane conductance (bottom) evoked by 500-ms depolarizations from −70 to 0 mV before and 2 min after the addition of adrenaline. (B) Histograms summarizing the average effects of adrenaline on the integrated Ca2+ current (QCa) and associated increases in cell capacitance (ΔCm). (C) As in A but adrenaline was applied in the presence of the β-adrenergic antagonist propanolol. (D) As in B but data were obtained in the presence of propanolol. In A and C, the dotted lines above the current traces indicate the zero-current level. Data in B and D are mean ± SEM of indicated number (n) of experiments. *P < 0.025; **P < 0.01.
β-Adrenergic Stimulation of Exocytosis Involves Increased [Ca2+]i and Activation of Protein Kinase A
Further support for the involvement of β-adrenoreceptors comes from the finding that the β-agonist isoprenaline (1 μM) mimicked the action of adrenaline and increased both the amplitude of the Ca2+ current and the exocytotic response (Fig. 3 A). Also shown in this recording are the associated changes in [Ca2+]i. It can be noted that stimulation with isoprenaline was associated with a slight increase in the magnitude of the depolarization-evoked [Ca2+]i transient. The mean resting [Ca2+]i was determined as 0.22 ± 0.01 μM (n = 28) and it was not affected by isoprenaline, suggesting that the observed stimulation of exocytosis in rat A-cells did not involve Ca2+ mobilization from intracellular stores (see Johansson et al., 1989; Berts et al., 1996). On average, isoprenaline produced 316 ± 153% stimulation of exocytosis, 50 ± 10% (n = 7) enhancement of the integrated Ca2+ current, and a corresponding 53 ± 13% (n = 6) increase in the amplitude of the depolarization-induced [Ca2+]i transient (Fig. 3 B).
The action of isoprenaline involved cyclic AMP-induced activation of PKA because Rp-8-Br-cAMPS, a selective inhibitor of this kinase (De Wit et al., 1984), abolished the stimulatory effects on both exocytosis and the integrated Ca2+ current (Fig. 3, C–D). Further support for the involvement of cyclic AMP/PKA is provided by the finding that the actions of adrenaline and isoprenaline on exocytosis and the Ca2+ current were mimicked by the adenylate cyclase activator forskolin (not shown here, but see Fig. 4). On average, forskolin (10 μM) increased the Ca2+ current by 51 ± 6% (n = 12) and stimulated exocytosis by 383 ± 58% (n = 12).
PKA-dependent Potentiation of Glucagon Secretion Involves both Stimulation of Ca2+ Influx and a Late Effect
The action of β-adrenergic stimulation on exocytosis (typically >300% enhancement) was associated with 50% acceleration of Ca2+ influx. To estimate how much of the stimulatory action of adrenaline resulted from enhancement of Ca2+ influx, we determined the correlation between Ca2+ entry and exocytosis by measuring the capacitance increases elicited by depolarizations to voltages between −10 and +50 mV (500-ms pulses at 30-s intervals) that result in different integrated Ca2+ currents. The pulse protocol was first applied under control conditions (Fig. 4 A) and subsequently 2 min after the addition of 10 μM forskolin (Fig. 4 B). The relationships between Ca2+ entry and exocytosis in the absence and presence of the PKA activator forskolin are summarized in Fig. 4 C. It is clear that the relationship between the average QCa and Cm, once a certain threshold has been exceeded (compare Seward and Nowycky, 1996), is well described by straight lines both before and after addition of forskolin. However, the slope of the relationship was considerably steeper in the presence of forskolin (11 fF/pC) than under control conditions (2 fF/pC). The latter value indicates that the apparent efficacy of Ca2+ as an initiator of exocytosis increased more than fivefold after activation of PKA. We considered the possibility that there may exist a power relationship between Ca2+ entry and exocytosis. We therefore approximated the individual experiments to either a linear or a power function, taking into account that there exists a variable minimum QCa for exocytosis to be initiated. This analysis indicated that the relationship was best described (as judged by the sum of residuals) by a power function in only one experiment. In the remaining five experiments there was either no difference or the linear function yielded a better fit than the power function. By approximating the data points of each of the six experiments to either a linear or a power relationship, we estimate that 12 ± 7% (power relationship) to 21 ± 15% (linear relationship) of the stimulated exocytosis evoked by the depolarization to −10 mV could be accounted for by the increase in QCa. During a depolarization to +10 mV, the contribution of the Ca2+-dependent component amounted to 13 ± 10% (linear) and 29 ± 22% (power). Based on these estimates, we conclude that the major part (70–90%) of the stimulation of exocytosis obtained by activation of protein kinase A results from mechanisms distinct from elevation of [Ca2+]i.
Relationship between Ca2+ Entry, [Ca2+]i , and Exocytosis
We next determined the relationship between Ca2+ entry, the increase in [Ca2+]i, and exocytosis to ascertain that the linear relationships in Fig. 4 C are not attributable to Ca2+ entry at the more positive voltages being obscured by activation of an outward current, which would lead to an underestimation of the charge entry. As shown in Fig. 5 A, depolarizations to voltages between +50 and −10 mV produced parallel changes in Ca2+ current magnitude, [Ca2+]i, and exocytosis. For all three parameters, the responses were small (if at all detectable) at the most positive voltage. This also enables us to exclude the possibility that Na+ channel gating currents contribute to the depolarization-evoked changes in cell capacitance (compare Horrigan and Bookman, 1994). Depolarizations to more negative voltages produced gradually larger responses and the maxima were obtained during pulses to voltages around +10 mV. Finally, at voltages more negative than +10 mV, the amplitude of the responses became smaller. The relationships between membrane potential and Ca2+ entry (QCa), the increase in cytoplasmic Ca2+ (Δ[Ca2+]i), and exocytosis (ΔCm) are summarized in Fig. 5 B. It is apparent that all three relationships are U-formed with maxima at ∼ +10 mV.
Cyclic AMP Stimulates Exocytosis by Increasing the Size of the Readily Releasable Pool of Granules
We investigated the relationship between the length of the depolarization and exocytosis to estimate the size of the pool of granules that is immediately accessible for release (“readily releasable pool”). The rationale behind this protocol (see Gillis et al., 1996) is that the pool of granules that can be released in response to Ca2+ influx through the Ca2+ channels is limited and that the magnitude of the exocytotic responses, due to the depletion of this pool, saturates with increasing stimulation intensity. The maximum response accordingly provides an estimate of the readily releasable pool of granules. Fig. 6 A shows the capacitance increases observed under basal conditions and 2 min after addition of forskolin. The depolarizations (with durations ranging between 50 and 500 ms) were applied at 30-s intervals. It is clear that the exocytotic responses are related to the length of the depolarizations and that forskolin exerts a pronounced stimulatory action. The data of this and four other experiments are summarized in Fig. 6, B and C. The relationship between pulse duration and QCa is nearly linear for depolarizations ≤300 ms both under control conditions and after the exposure to forskolin. This suggests that most of the rapid inactivation occurs during the initial 50 ms and that this component does not contribute much to the total charge entry. For the 500-ms depolarization, there is some deviation from linearity. This we attribute to a slow component of Ca2+-current inactivation that becomes evident during long depolarizations. The correlation between QCa and ΔCm is illustrated in Fig. 6 C. The superimposed curves were derived by approximating hyperbolic functions (see Fig. 6) to the data obtained for the ≤300-ms depolarizations (i.e., excluding the data points at which Ca2+-current inactivation becomes significant). Whereas it is clear that a hyperbolic function appropriately describes the relationship in the presence of forskolin, this is perhaps not so evident under control conditions. However, this was indeed the case and a hyperbolic function was almost fourfold better than a linear fit as judged by the sum of residuals (1.07 and 4.13 for the hyperbolic and linear functions, respectively). The estimated maximum capacitance increases amounted to 57 ± 15 fF (n = 5) under control conditions and 288 ± 64 fF in the presence of forskolin. Whereas the approximated function correctly predicts the capacitance increase evoked by the 500-ms depolarization in the presence of forskolin, there was some deviation from the fitted hyperbolic function under control conditions. We speculate that this is attributable to Ca2+ serving functions in addition to triggering exocytosis. In chromaffin cells, Ca2+ has been reported to accelerate the refilling of the releasable pool (von Rüden and Neher, 1993). If a similar mechanism exists in the A-cell, it may be more prominent under control conditions where it is superimposed upon release from a much smaller readily releasable pool.
Figure 6.

Increasing pulse duration results in saturation of exocytotic responses. (A) Ca2+ currents (middle) and changes in cell capacitance (bottom) evoked by 100-, 200-, 300-, and 500-ms depolarizations from −70 to 0 mV applied at 30-s intervals before (left) and 2 min after (right) the addition of forskolin. (B) Relationship between pulse duration and integrated Ca2+ current (QCa) in the absence (○) and presence (•) of 10 μM forskolin. The dotted lines are least-squares fits to the mean values of the currents elicited by depolarizations ≤300 ms. Note deviation from linearity at 500 ms. (C) Increases in cell capacitance (ΔCm) displayed against the integrated Ca2+ current (Qca) in the absence (○) and presence (•) of forskolin evoked by depolarization between 50 and 500 ms. The data points have been approximated to the equation ΔCm = ΔCmax * {1 − e−([Q − Qmin]/n)} where ΔCm is the observed capacitance increase, ΔCmax is the calculated maximum capacitance increase, Q is the associated charge entry, Qmin the calculated minimum integrated Ca2+ current required to evoke exocytosis and n is a slope factor. The function was approximated to each experiment and the values of ΔCmax, Qmin, and n calculated for each experiment. The fits were based on the responses to depolarizations ≤300 ms. The curves were drawn using the mean values of these parameters. These were (values obtained in the presence of forskolin given within the parentheses) 57 ± 15 fF (288 ± 64 fF), 0.7 ± 0.2 pC (1.0 ± 0.4 pC), and 7.5 ± 1.8 (3.8 ± 0.9) for ΔCmax, Qmin, and n, respectively. Data are mean ± SEM of five experiments. *P < 0.05; **P < 0.01 (vs. capacitance increase evoked by the same depolarization under control conditions).
Photorelease of Caged Cyclic AMP Accelerates Exocytosis at Constant [Ca2+]i
Direct support for the contribution of late (Ca2+-independent) effects to the total exocytotic response comes from the observation that rapid intracellular application of cAMP (∼30 μM) in standard whole-cell recordings by photorelease from a caged precursor, after a delay of 1.1 ± 0.6 s, resulted in 70% stimulation of exocytosis when [Ca2+]i was clamped at 0.4 μM (Fig. 7 A); from 3.3 ± 0.6 fF/s before to 5.6 ± 1.1 fF/s after addition of cyclic AMP (n = 8; P < 0.01). Cyclic AMP had no stimulatory action when applied in the presence of 0.17 μM [Ca2+]i (Fig. 7 B), a concentration close to the measured resting [Ca2+]i of the A-cell (see above). The rates of capacitance increase before and after photorelease of cAMP at 0.17 μM [Ca2+]i amounted to 3.9 ± 1.2 and 3.3 ± 1.9 fF/s (n = 5, not statistically different), respectively.
Differential Dependence of Exocytosis on Ca2+ Influx through ω-Conotoxin-GVIA– and Nifedipine-sensitive Ca2+ Channels under Basal Conditions and after Activation of PKA
The pancreatic A-cells are equipped with both ω-conotoxin-GVIA–sensitive and nifedipine-blockable Ca2+ channels (Fig. 1); tentatively characterized as N- and L-type Ca2+ channels based on these pharmacological properties. We next explored the relative contribution of the different modalities of Ca2+ influx to depolarization-evoked exocytosis. When applied under control conditions (Fig. 8 A), ω-conotoxin-GVIA (1 μM) reduced the integrated Ca2+ current by 18 ± 7% and exocytosis by 62 ± 5% (P < 0.01; n = 4). When applied at a concentration of 5 μM (Fig. 8 B), nifedipine reduced the integrated Ca2+ current to the same extent (21 ± 2%, P < 0.025) and yet only inhibited exocytosis by 11 ± 3% (P < 0.05; n = 5). Finally, as shown in Fig. 8 C, a 10-fold higher concentration of nifedipine (50 μM), which can be expected to abolish L-type Ca2+-channel activity, reduced the whole-cell Ca2+ current by 68 ± 8% (n = 5; P < 0.005) and exocytosis by 30 ± 7% (n = 5; P < 0.025).
Figure 8.
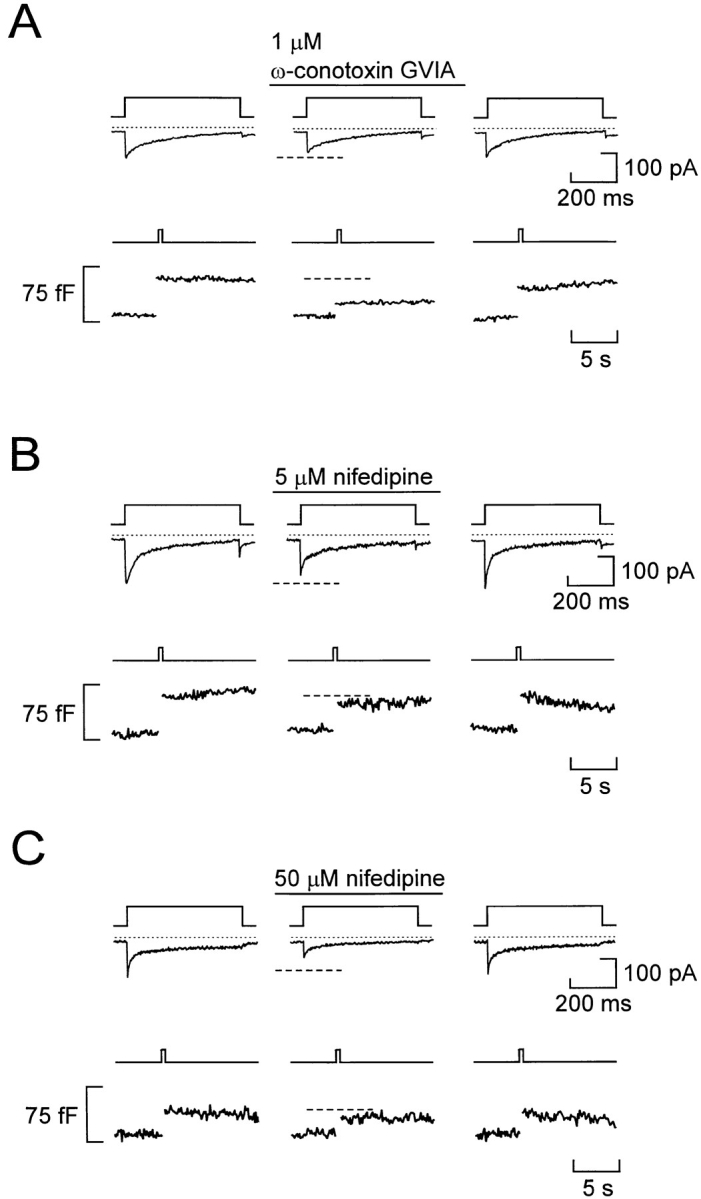
Differential dependence of basal and stimulated exocytosis on Ca2+ influx through N- and L-type Ca2+ channels under basal conditions. (A) Ca2+ currents (middle) and changes in cell capacitance (bottom) evoked by membrane depolarizations from −90 to 0 mV (top) before and after addition of 1 μM ω-conotoxin-GVIA. (B) Same as A but the holding potential was −70 mV and nifedipine (5 μM) was applied. (C) Same as B but nifedipine was applied at a concentration of 50 μM. The holding potential was varied between −90 and −70 mV to prevent possible voltage-dependent inactivation of the ω-conotoxin–sensitive current. However, varying the holding potential does not influence the magnitude of the integrated Ca2+ current. In a series of five experiments, the integrated Ca2+ currents elicited by depolarizations to 0 mV using holding potentials of −90 and −70 mV amounted to 3.1 ± 0.5 and 2.9 ± 0.5 pC, respectively.
A completely different pattern was obtained in the presence of forskolin (Fig. 9). Under these experimental conditions, the inhibitory action of ω-conotoxin-GVIA (1 μM) was less pronounced: the integrated Ca2+ current and exocytosis were reduced by only 12 ± 3% (P < 0.001) and 18 ± 8% (n = 5), respectively (Fig. 9 A). By contrast, addition of the L-type Ca2+-channel antagonist nifedipine (50 μM) resulted in 79 ± 10% (P < 0.05; n = 5) inhibition of the Ca2+ current and 81 ± 4% (P < 0.01; n = 5) reduction of exocytosis (Fig. 9 B). These data suggest that the increased integrated Ca2+ current and exocytotic responses observed in cells stimulated with forskolin or adrenaline results principally from enhancement of the L-type Ca2+ current component. It was ascertained that nifedipine did not itself suppress Ca2+-induced exocytosis in the A-cell by including the antagonist in the high [Ca2+]i pipette solution dialyzing the cell interior in Ca2+ infusion experiments (data not shown).
Figure 9.

L-type Ca2+ channels mediate Ca2+ influx required for exocytosis in forskolin-stimulated A-cells. (A) Ca2+ currents (middle) and changes in cell capacitance (bottom) evoked by membrane depolarizations from −90 to 0 mV (top) before and after addition of 1 μM ω-conotoxin-GVIA. (B) Same as A, but the holding potential was −70 mV; forskolin (10 μM) was present throughout and the effects of 50 μM nifedipine were tested.
discussion
We have investigated the electrophysiological and exocytotic properties of glucagon-secreting rat pancreatic A-cells. In keeping with our earlier observations in guinea-pig pancreatic A-cells, rat A-cells were found to be electrically excitable and generated Na+- and Ca2+-dependent action potentials in the absence of glucose (Rorsman and Hellman, 1988). This study also provides the first direct evidence that glucagon secretion is a Ca2+-dependent process that is initiated by Ca2+ influx through voltage-dependent Ca2+ channels. Here we discuss a few particularly interesting aspects of our findings.
β-Adrenergic Modulation of Ca2+-dependent Exocytosis
We demonstrate that adrenaline potentiates exocytosis in rat pancreatic A-cells by a mechanism involving activation of protein kinase A that is exerted at a level distal to the elevation of [Ca2+]i. Direct evidence for the existence of such an effect comes from the experiments involving flash photolysis of caged cyclic AMP in which acceleration of the exocytosis was observed even when [Ca2+]i was clamped at 0.4 μM. These data are also in keeping with the demonstration that cyclic AMP stimulates Ca2+-evoked glucagon secretion from permeabilized islets (Niki et al., 1986; Hii and Howell, 1987) and is clearly reminiscent of the situation in insulin-secreting B-cells (Ämmälä et al., 1993a ). This points to the interesting possibility that regulation of exocytosis at a late stage may represent a general mechanism by which neuroendocrine cells and neurons tune their exocytotic responses. Indeed, such modulation of the release process has been documented in chromaffin cells (Gillis et al., 1996), pituitary melanotrophs (Zupancic and Zorec, 1994), pituitary somatotrophs (our unpublished observations), and neurons (Yawo, 1996). Although the effects of cyclic AMP on exocytosis are similar in A- and B-cells, it is important to emphasize that adrenergic stimulation has opposite effects on glucagon and insulin secretion. This reflects the activation by adrenaline of different signaling pathways within the glucagon- and insulin-secreting cells. Thus, whereas adrenaline (via binding to β-receptors and stimulation of adenylate cyclase) accelerates exocytosis in the A-cell, it inhibits insulin secretion from isolated pancreatic B-cells (Nilsson et al., 1988; Ullrich and Wollheim, 1988). The latter effect is mediated by α2-receptors and, via activation of pertussis toxin–sensitive G-proteins, culminates in the activation of the protein phosphatase calcineurin (Renström et al., 1996).
Roles of Ca2+ Influx through N- and L-type Ca2+ Channels
Rat A-cells were found to be equipped with two types of Ca2+ current with pharmacological properties, suggesting that they are carried by Ca2+ channels similar to the N- and L-type Ca2+ channels characterized in neurons (for review, see Tsien et al., 1988). Our observation that the effect of ω-conotoxin-GVIA is reversible is not characteristic for its action on neuronal N-type Ca2+ channels where the inhibition is typically irreversible (Plummer et al., 1989).
Given that ω-conotoxin-GVIA and nifedipine at concentrations selected to produce approximately the same degree of inhibition of the Ca2+ current (∼20%) had very different effects on exocytosis under basal conditions, we conclude the ω-conotoxin-GVIA–sensitive (“N-type”) Ca2+ channels mediate the Ca2+ influx that accounts for the tonic (“resting”) release of glucagon. In fact, although 70% of the Ca2+ current flows through L-type Ca2+ channels under these experimental conditions, Ca2+ influx via this pathway only accounts for 30% of secretion. However, these channels become much more important when secretion is stimulated by, for example, β-adrenergic agonists. Under the latter conditions, influx of Ca2+ through L-type Ca2+ channels contribute most (80%) of the Ca2+ required to initiate exocytosis. Such a differential dependence of exocytosis on Ca2+ influx through N- and L-type Ca2+ channels during variations of the secretory demand is similar to that which has previously been documented in chromaffin cells (Artalejo et al., 1994; Lopez et al., 1994).
Activation of PKA Stimulates Exocytosis by Promoting Granule Mobilization
The different effects of the Ca2+ channel blockers under basal conditions and after application of forskolin, a functional analogue of adrenaline, lead us to propose the following model for the control of glucagon secretion by Ca2+ influx under basal conditions (Fig. 10 A). We propose that the N-type Ca2+ channels are closer to the release sites than the L-type Ca2+ channels. This would account for our observation that exocytosis under basal conditions is highly sensitive to inhibition of the Ca2+ current by ω-conotoxin-GVIA. The [Ca2+]i transients resulting from influx through the L-type Ca2+ channels do not extend to the release sites and thus fail to trigger secretion.
Figure 10.

Model explaining the effects of the Ca2+ channel blockers. (A) Under basal conditions, most (65%) of the granules ready for release are localized in the vicinity of the N-type Ca2+ channels and exocytosis of these granules is blocked by addition of ω-conotoxin-GVIA. The shaded areas indicate the domains within which [Ca2+]i rises to concentrations sufficient to trigger exocytosis. Note that there are more L- than N-type Ca2+ channels and the relative scarcity of granules within the domains of the L-type Ca2+ channels. (B) In the presence of forskolin, exocytosis is enhanced because (a) the Ca2+ current is increased and the domains around the L-type Ca2+ channels extend further into the A-cell; and (b) granules that were previously outside the domains have been “mobilized” and brought into closer proximity to the Ca2+ channels. By the combination of these effects, 80% of the releasable granules are now accessed by influx through the nifedipine-sensitive L-type Ca2+ channels. The extent of the domains under control condition is indicated by the dotted lines.
How can activation of protein kinase A (e.g., in response to β-adrenergic stimulation) be envisaged to enhance secretion? We believe that exocytosis is stimulated by the combination of two processes (Fig. 10 B).
First, the integrated Ca2+ current (and thus the amplitude of the [Ca2+]i transient) is increased by 50%. The domain in which [Ca2+]i is sufficiently elevated to trigger exocytosis can therefore be expected to be extended by 73%. The latter value can be derived by assuming that the 50% increase in the whole-cell current (say from 100 to 150 pA; i.e., an increase of 50 pA) results exclusively from a selective stimulation of L-type Ca2+ channel activity. The fraction of the whole-cell current flowing through L-type Ca2+ channels under basal conditions amounts to 68% (68 pA in our example). Accordingly, the relative increase of the L-type Ca2+ current amounts to 73% stimulation (50/68 pA). However, from the linear relationship between Ca2+ influx and exocytosis (Fig. 4), this enhancement can be expected to produce at most 30% of the total stimulatory action.
Secondly, and more importantly, activation of protein kinase A promotes the mobilization of granules from the reserve pool into the readily releasable pool. The experiments in Fig. 6 indicate that the size of this pool is increased fivefold in response to agents that activate PKA. With a conversion factor of 1.25 f F/granule (as expected for a granular diameter of 200 nm; Bishop and Polak, 1991), the maximum increases in cell capacitance derived by varying the pulse duration (55 and 290 f F under basal conditions and after application of forskolin) suggest that activation of PKA increased the readily releasable pool from an initial 45 granules to 230. This increase in pool size corresponds favorably to the apparent increase in “Ca2+ sensitivity” deduced from the data presented in Fig. 4.
Are Mobilized Granules Targeted to the L-type Ca2+ Channels?
One possible model that accounts for our observations is presented in Fig. 10. This model originates from the observation that the percentage inhibition of exocytosis produced by ω-conotoxin-GVIA was reduced to less than one-third (from 65 to 18%) as exocytosis was increased threefold by stimulation with forskolin. This suggests that the same number of granules were released in response to Ca2+ influx through the ω-conotoxin-GVIA–sensitive Ca2+ channels under both experimental conditions. The observed stimulation of exocytosis is therefore likely to be accounted for by Ca2+ influx through the L-type Ca2+ channels. In accordance with this conclusion, the integrated Ca2+ current and exocytosis evoked by 500-ms depolarizations under these experimental conditions were both inhibited by 80% when nifedipine was added. Our data suggest that the stimulation of exocytosis results from an increased number of granules close to the L-type Ca2+ channels (Fig. 6). If the granules had been directed equally to the N- and L-type Ca2+ channels, then the ω-conotoxin-GVIA–sensitive component would amount to 41% (the initial 62% divided by 1.5 to compensate for the increased L-type Ca2+ current); considerably more than the 18% actually observed. We point out that this effect does not result from activation of PKA inhibiting the N-type Ca2+ current. The fractional ω-conotoxin-GVIA– sensitive component admittedly decreased from 18% under control conditions to 12% after stimulation with forskolin, but this can be accounted for entirely by the 50% increase of the total Ca2+ current (i.e., 18%/1.5). These considerations raise the interesting possibility that granules that are mobilized in response to PKA activation are selectively targeted to the L-type Ca2+ channels. It is implicit from this concept that the N- and L-type Ca2+ channels are spatially separated and that their domains of elevated [Ca2+]i do not overlap.
Pathophysiological Significance
The observations that adrenaline stimulates exocytosis in the A-cell and inhibits secretion from the B-cell may finally have implications for the understanding of the pathophysiology of diabetes. It has been reported that diabetic pancreases contain elevated levels of adrenaline (Östenson et al., 1993) and that diabetic A-cells exhibit an exaggerated response to adrenaline (Ahrén et al., 1995). The present finding that β-adrenergic stimulation causes a fourfold enhancement of Ca2+-dependent exocytosis in the A-cells may therefore account for the clinical observation that hypersecretion of glucagon aggravates the hyperglycemia associated with type 2 diabetes (Unger, 1985; Dinneen et al., 1995).
Acknowledgments
This study was supported by the Swedish Medical Research Council, The Danish Diabetes Association, and The Danish Medical Research Council (K. Buschard).
Footnotes
Dr. Ding was on temporary leave from the Department of Physiology, Shiga University, Japan.
S. Barg's, E. Renström's, and P. Rorsman's present address is Department of Physiology and Neuroscience, Sölvegatan 19, S-223 62 Lund, Sweden.
references
- Ahrén B, Stern JS, Gingerich RL, Curry DL, Havel PJ. Glucagon secretory response to hypoglycemia, adrenaline, and carbachol in streptozotocin-diabetic rats. Acta Physiol Scand. 1995;155:215–221. doi: 10.1111/j.1748-1716.1995.tb09966.x. [DOI] [PubMed] [Google Scholar]
- Ämmälä C, Ashcroft FM, Rorsman P. Calcium-independent potentiation of insulin release by cyclic AMP in single β-cells. Nature (Lond) 1993a;363:356–358. doi: 10.1038/363356a0. [DOI] [PubMed] [Google Scholar]
- Ämmälä C, Eliasson L, Bokvist K, Larsson O, Ashcroft FM, Rorsman P. Exocytosis elicited by actions potentials and voltage-clamp calcium currents in individual B-cells. J Physiol (Camb) 1993b;472:665–688. doi: 10.1113/jphysiol.1993.sp019966. [DOI] [PMC free article] [PubMed] [Google Scholar]
- Artalejo CR, Adams ME, Fox AP. Three types of Ca2+channel trigger secretion with different efficacies in chromaffin cells. Nature (Lond) 1994;367:72–76. doi: 10.1038/367072a0. [DOI] [PubMed] [Google Scholar]
- Berts A, Gylfe E, Hellman B. Ca2+oscillations in pancreatic islet cells secreting glucagon and somatostatin. Biochem Biophys Res Commun. 1995;208:644–649. doi: 10.1006/bbrc.1995.1387. [DOI] [PubMed] [Google Scholar]
- Berts A, Ball A, Gylfe E, Hellman B. Suppression of Ca2+ oscillations in glucagon-producing α2-cells by insulin/glucose and amino acids. Biochim Biophys Acta. 1996;1310:212–216. doi: 10.1016/0167-4889(95)00173-5. [DOI] [PubMed] [Google Scholar]
- Bishop, A.E., and J.M. Polak. 1991. The anatomy, organization and ultrastructure of the islets of Langerhans. In Textbook of Diabetes. Vol 1. J. Pickup and G. Williams, editors. Blackwell Scientific Publications, Oxford, UK. pp. 57–71.
- Bokvist K, Eliasson L, Ämmälä C, Renström E, Rorsman P. Co-localization of L-type Ca2+channels and insulin-containing secretory granules and its significance for the initiation of exocytosis. EMBO (Eur Mol Biol Organ) J. 1995;14:50–57. doi: 10.1002/j.1460-2075.1995.tb06974.x. [DOI] [PMC free article] [PubMed] [Google Scholar]
- Brunicardi FC, Shavelle DM, Andersen DK. Neural regulation of the endocrine pancreas. Int J Pancreatol. 1995;18:177–195. doi: 10.1007/BF02784941. [DOI] [PubMed] [Google Scholar]
- De Wit RJ, Hekstra D, Jastorff B, Stec WJ, Baraniak J, van Driel R, van Haastert PJ. Inhibitory action of certain cyclophosphate derivates of cAMP on cAMP-dependent protein kinases. Eur J Biochem. 1984;142:255–260. doi: 10.1111/j.1432-1033.1984.tb08279.x. [DOI] [PubMed] [Google Scholar]
- Dinneen S, Alzaid A, Turk D, Rizza R. Failure of glucagon suppression contributes to postprandial hyperglycaemia in IDDM. Diabetologia. 1995;38:337–343. doi: 10.1007/BF00400639. [DOI] [PubMed] [Google Scholar]
- Gerich, J.C. 1983. Glucose in the control of glucagon secretion. In Handbook of Experimental Pharmacology. Vol. 66/II. P.J. Le-fébvre, editor. Springer Verlag, Berlin. pp. 3–18.
- Gillis KD, Mössner R, Neher E. Protein kinase C enhances exocytosis from chromaffin cells by increasing the size of the readily releasable pool of secretory granules. Neuron. 1996;16:1209–1220. doi: 10.1016/s0896-6273(00)80147-6. [DOI] [PubMed] [Google Scholar]
- Hellman B, Gylfe E, Bergsten P, Grapengiesser E, Lund PE, Dryselius S, Tengholm A, Liu YJ, Eberhardson M, Chow RH. The role of Ca2+in the release of pancreatic-islet hormones. Diabetes Metab. 1994;20:123–131. [PubMed] [Google Scholar]
- Hii CS, Howell SL. Role of second messengers in the regulation of glucagon secretion from isolated islets of Langershans. Mol Cell Endocrinol. 1987;50:37–44. doi: 10.1016/0303-7207(87)90075-x. [DOI] [PubMed] [Google Scholar]
- Horn R, Marty A. Muscarinic activation of ionic currents measured by a new whole-cell recording method. J Gen Physiol. 1988;92:145–159. doi: 10.1085/jgp.92.2.145. [DOI] [PMC free article] [PubMed] [Google Scholar]
- Horrigan FT, Bookman RJ. Releasable pools and the kinetics of exocytosis in adrenal chromaffin cells. Neuron. 1994;13:1119–1129. doi: 10.1016/0896-6273(94)90050-7. [DOI] [PubMed] [Google Scholar]
- Johansson H, Gylfe E, Hellman B. Cyclic AMP raises cytoplasmic calcium in pancreatic α2-cells by mobilizing calcium incorporated in response to glucose. Cell Calcium. 1989;10:205–211. doi: 10.1016/0143-4160(89)90003-1. [DOI] [PubMed] [Google Scholar]
- Josefsen K, Stenvang JP, Kindmark H, Berggren P-O, Horn T, Kjær T, Buschard K. Fluorescence-activated cell sorted rat islet cells and studies of the insulin secretory process. J Endocrinol. 1996;149:145–154. doi: 10.1677/joe.0.1490145. [DOI] [PubMed] [Google Scholar]
- Kreymann, B., and S.R. Bloom. 1991. Glucagon and gut hormones on diabetes mellitus. In Textbook of Diabetes. Vol. 1. J. Pickup and G. Williams, editors. Blackwell Scientific Publications, Oxford, UK. pp. 313–324.
- Lopez MG, Albillos A, Delafuente MT, Borges R, Gandia L, Carbone E, Garcia AG, Artalejo AR. Localized L-type calcium channels control exocytosis in cat chromaffin cells. Pflügers Arch. 1994;427:348–354. doi: 10.1007/BF00374544. [DOI] [PubMed] [Google Scholar]
- Neher E, Marty A. Discrete changes of cell capacitance observed under conditions of enhanced secretion in bovine adrenal chromaffin cells. Proc Natl Acad Sci USA. 1982;79:6712–6716. doi: 10.1073/pnas.79.21.6712. [DOI] [PMC free article] [PubMed] [Google Scholar]
- Nilsson T, Arkhammar P, Rorsman P, Berggren P-O. Inhibition of glucose-stimulated insulin release by α2-adrenoceptor activation is paralleled by both a hyperpolarization and a reduction in cytoplasmic free Ca2+-concentration. J Biol Chem. 1988;263:1855–1860. [PubMed] [Google Scholar]
- Niki I, Tamagawa T, Niki A, Niki H, Koide T, Sakamoto N. Glucagon release dependent on and independent of changes in cytosolic Ca2+: studies using Ca2+-clamped rat pancreatic islets. Biomed Res. 1986;7:291–294. [Google Scholar]
- Östenson CG, Hjemdahl P, Efendic S. Release of catecholamines is increased but does not contribute to the impaired insulin secretion in the perfused pancreata of diabetic rats. Pancreas. 1993;8:34–38. doi: 10.1097/00006676-199301000-00008. [DOI] [PubMed] [Google Scholar]
- Pipeleers D, Schuit F, van Schravendijk CFH, van De Winkel M. Interplay of nutrient and hormones in the regulation of glucagon release. Endocrinology. 1985;117:817–823. doi: 10.1210/endo-117-3-817. [DOI] [PubMed] [Google Scholar]
- Plummer MR, Logothetis EE, Hess P. Elementary properties and pharmacological sensitivities of calcium channels in mammalian peripheral neurons. Neuron. 1989;2:1453–1463. doi: 10.1016/0896-6273(89)90191-8. [DOI] [PubMed] [Google Scholar]
- Rae J, Cooper K, Gates P, Watsky M. Low access resistance perforated patch recordings using amphotericin B. J Neurosci Methods. 1991;37:15–26. doi: 10.1016/0165-0270(91)90017-t. [DOI] [PubMed] [Google Scholar]
- Renström E, Ding WG, Bokvist K, Rorsman P. Neurotransmitter-induced inhibition of exocytosis in insulin-secreting β cells by activation of calcineurin. Neuron. 1996;17:513–522. doi: 10.1016/s0896-6273(00)80183-x. [DOI] [PubMed] [Google Scholar]
- Rorsman P, Hellman B. Voltage-activated currents in guinea-pig pancreatic α2-cells: evidence for Ca2+-dependent action potentials. J Gen Physiol. 1988;91:223–242. doi: 10.1085/jgp.91.2.223. [DOI] [PMC free article] [PubMed] [Google Scholar]
- Rorsman P, Ashcroft FM, Berggren P-O. Regulation of glucagon release from pancreatic A-cells. Biochem Pharmacol. 1991;41:1783–1790. doi: 10.1016/0006-2952(91)90116-m. [DOI] [PubMed] [Google Scholar]
- Rorsman P, Ämmälä C, Berggren P-O, Bokvist K, Larsson O. Cytoplasmic calcium transients due to single action potentials and voltage-clamp depolarizations in mouse pancreatic B-cells. EMBO (Eur Mol Biol Organ) J. 1992;11:2877–2884. doi: 10.1002/j.1460-2075.1992.tb05356.x. [DOI] [PMC free article] [PubMed] [Google Scholar]
- Seward EP, Nowycky MC. Kinetics of stimulus-coupled secretion in dialyzed chromaffin cells in response to trains of depolarizing pulses. J Neurosci. 1996;16:553–562. doi: 10.1523/JNEUROSCI.16-02-00553.1996. [DOI] [PMC free article] [PubMed] [Google Scholar]
- Tsien RW, Libscombe D, Madison DV, Bley KR, Fox AP. Multiple types of neuronal calcium channels and their selective modulation. Trends Neurosci. 1988;11:431–438. doi: 10.1016/0166-2236(88)90194-4. [DOI] [PubMed] [Google Scholar]
- Ullrich S, Wollheim CB. GTP-dependent inhibition of insulin secretion by epinephrine in permeabilized RINm5F cells: lack of correlation between insulin secretion and cyclic AMP levels. J Biol Chem. 1988;263:8615–8620. [PubMed] [Google Scholar]
- Unger RH. Glucagon physiology and pathophysiology in the light of new advances. Diabetologia. 1985;28:574–578. doi: 10.1007/BF00281991. [DOI] [PubMed] [Google Scholar]
- von Rüden L, Neher E. A Ca2+-dependent early step in the release of catecholamines from adrenal chromaffin cells. Science (Wash DC) 1993;262:1061–1065. doi: 10.1126/science.8235626. [DOI] [PubMed] [Google Scholar]
- Wesslén N, Pipeleers D, Van de Winkel M, Rorsman P, Hellman B. Glucose stimulates the entry of Ca2+into the insulin-producing beta cells but not into the glucagon-producing alpha 2 cells. Acta Physiol Scand. 1988;131:230–234. doi: 10.1111/j.1748-1716.1987.tb08231.x. [DOI] [PubMed] [Google Scholar]
- Yawo H. Noradrenaline modulates transmitter release by enhancing the Ca2+sensitivity of exocytosis in chick ciliary presynaptic terminal. J Physiol. 1996;493:385–391. doi: 10.1113/jphysiol.1996.sp021390. [DOI] [PMC free article] [PubMed] [Google Scholar]
- Zupancic G, Zorec R. Cyclic AMP increases the size of unitary exocytotic events in cultured rat melanotrophs. J Physiol. 1994;475P:P136–P137. [Google Scholar]