

Abstract
A method was developed to measure the osmotic water permeability (Pf) of plasma membranes in cell layers and applied to cells and epithelia expressing molecular water channels. It was found that the integrated intensity of monochromatic light in a phase contrast or dark field microscope was dependent on relative cell volume. For cells of different size and shape (Sf9, MDCK, CHO, A549, tracheal epithelia, BHK), increased cell volume was associated with decreased signal intensity; generally the signal decreased 10–20% for a twofold increase in cell volume. A theory relating signal intensity to relative cell volume was developed based on spatial filtering and changes in optical path length associated with cell volume changes. Theory predictions were confirmed by signal measurements of cell layers bathed in solutions of various osmolarities and refractive indices. The excellent signal-to-noise ratio of the transmitted light detection permitted measurement of cell volume changes of <1%. The method was applied to characterize transfected cells and tissues that natively express water channels. Pf in control Chinese hamster ovary cells was low (0.0012 cm/s at 23°C) and increased more than fourfold upon stable transfection with aquaporins 1, 2, 4, or 5. Pf in apical and basolateral membranes in polarized epithelial cells grown on porous supports was measured. Pf bl and Pf ap were 0.0011 and 0.0024 cm/s (MDCK cells), and 0.0039 and 0.0052 cm/s (human tracheal cells) at 23°C. In intact toad urinary bladder, basolateral Pf was 0.036 cm/s and apical membrane Pf after vasopressin stimulation was 0.025 cm/s at 23°C. The results establish light microscopy with spatial filtering as a technically simple and quantitative method to measure water permeability in cell layers and provide the first measurement of the apical and basolateral membrane permeabilities of several important epithelial cell types.
Keywords: water transport, trachea, Fourier optics, aquaporin
introduction
The development of methods to measure the plasma membrane osmotic water permeability of cell layers has been motivated by the identification of a family of molecular water channels (aquaporins) widely expressed in mammalian tissues (for review, see Nielsen and Agre, 1995; Verkman et al., 1996). Water channels have been localized in many epithelia involved in fluid transport, including kidney tubules, airways, and alveoli in lungs, choroid plexus in the brain, and ciliary body in eyes. Although a considerable body of data has been obtained on the molecular biology and expression pattern of water channels, there have been few measurements of the water permeability of epithelial cell plasma membranes. Such functional measurements will be required to determine whether water channels can account quantitatively for the wide variations in water permeability of epithelial cell plasma membranes and to study the regulation of water permeability.
For example, water channels in the lung are thought to mediate transepithelial fluid transport (Matthay et al., 1996). Recent studies have demonstrated high water permeability in bronchial (Folkesson et al., 1996) and alveolar epithelia (Carter et al., 1996). There have been no measurements of water movement in tracheal epithelia, nor have measurements been made of water permeability of individual apical and basolateral plasma membranes in bronchial and alveolar epithelium. The water channel aquaporin-4 has been localized to the basolateral membrane of tracheal epithelia, where it is thought to play a role in maintenance of proper mucosal hydration (Frigeri et al., 1995). It is thus predicted that tracheal epithelial cells have high water permeability; a hypothesis to be tested in this study. Similarly, experiments with the toad urinary bladder led to the formulation of the shuttle hypothesis to account for vasopressin-regulated water permeability (reviewed in Jo and Harris, 1995). This hypothesis predicts that the apical membrane is the rate limiting barrier and that its permeability is modulated by the vasopressin-regulated targeting of water channels to the apical membrane. Although the transepithelial water permeability has been measured in many studies, there is little information about water permeability of the individual plasma membranes.
The determination of water permeability in individual cell membranes in a polarized epithelium can be accomplished by measurement of the time course of cell volume change in response to changes in the osmolarity of perfusate bathing one surface of the cell layer. For epithelial cell layers with high water permeability, the rapid changes in cell volume require a method with high temporal resolution. Several methods have been proposed and evaluated to measure water permeability in immobilized cell layers such as cultured epithelial cells that are grown on glass coverslips. Light scattering from a cell layer was found to provide a qualitative index of cell volume (Echevaria and Verkman, 1992; Fischbarg et al., 1993; McManus et al., 1993). However, the light scattering signal is insensitive to cell volume for many cell types and there is no rigorous basis for predicting the sign and amplitude of volume-dependent signal changes. Strategies to measure cell volume changes have been proposed involving tracking of the z position of fluorescent beads at the cell surface (Crowe and Willis, 1991; Van Driessche et al., 1993; Kao and Verkman, 1994) and cell shape reconstruction by imaging (Kacha-dorian et al., 1985); however, these methods are approximate, too difficult technically for routine use, and have limited data acquisition rates. Recently, accurate determination of the relative volume of cells grown on a transparent support was accomplished by total internal reflection (TIR)1 fluorescence microscopy (Farinas et al., 1995). Cell cytoplasm was stained with a fluorescent indicator such as calcein, and relative cell volume (inversely proportional to indicator concentration) was deduced from the TIR fluorescence from a thin (<200 nm) layer of cytoplasm near the transparent support. Measurement of indicator concentration can also be accomplished by optical sectioning techniques using confocal (Crowe et al., 1995) or partial confocal (Muallem et al., 1992) optics, as well as ion-sensitive electrodes (Alvarez-Leefmans et al., 1995).
We recently introduced an interferometry method to measure cell volume and water permeability in adherent and nonadherent epithelial cell layers (Farinas and Verkman, 1996). Volume changes were shown to alter the optical path length (the product of refractive index and geometric path length) of light passing through a cell layer. An interferometer was used to convert the small changes in optical path length to measurable changes in intensity. Cell membrane osmotic water permeability was determined from the time course of interference signal in response to osmotic gradients. Although interferometry provided the only available method with high temporal resolution to measure water permeability in individual plasma membranes in nonadherent cell layers, a distinct disadvantage of the method was the strong sensitivity of the interference signal amplitude to air currents, temperature gradients, and perfusion chamber pressure, which produced instrument drift and reduced signal-to-noise ratio.
In the present study, a simple method to measure water permeability in cell layers has been developed based on the cell volume–dependent changes in optical path length demonstrated by interferometry. The method was applied to the measurement of plasma membrane osmotic water permeability of epithelial cell layers. Dark field and phase contrast microscopes exploit the technique of spatial filtering to generate images based on optical path length differences in the object. It is demonstrated in the theory section below that the integrated intensity of an image formed by such microscopes is sensitive to volume-dependent changes in optical path length. As shown schematically in Fig. 1, an annulus and condenser are used to illuminate a cell layer in the object plane of a microscope with a cone of light. The cells diffract the light leading to a zero order beam (thick lines emanating from the object) and higher order beams (thin lines). The zero order beam represents the undeviated incident illumination while the higher order beams contain the light diffracted by the cells. The objective focuses the zero order beam at the back focal plane while the higher order beams are focused at the image plane. The zero order beam is localized to a distinct position in the back focal plane (a circle) and thus can be manipulated by spatial filtering (Hecht, 1987). In the dark field microscope, the spatial filtering results in total attenuation of the zero order beam, whereas in the phase contrast microscope the zero order beam is partially attenuated and phase shifted with respect to the higher order beams. Because cell volume affects the relative intensities of the zero and higher order beams, attenuation of the zero order beam leads to cell volume–dependent changes in the light intensity at the image plane. We demonstrate here that this optical phenomenon can be exploited to measure relative cell volume and water permeability using phase contrast or dark field microscopes. The approach was developed theoretically, validated experimentally, and applied to measure water permeability in cells expressing molecular water channels and intact living tissues.
Figure 1.

Measurement of plasma membrane water permeability by spatial filtering microscopy. Schematic of a cell layer in a phase contrast or dark field microscope showing that cell volume-dependent changes in optical path length produce differences in the relative intensity of higher order and zero order beams. Because of attenuation of the zero order beam at the back focal plane of the objective, the light intensity in the image plane depends on cell volume. See text for further details.
Theory
A theory was developed to relate the relative cell volume of a cell layer to the integrated intensity of an image from a dark field or phase contrast microscope. The refractive index of a cell (ncell) depends on relative cell volume (V r) (Farinas and Verkman, 1996)
 |
1 |
where no cell is the refractive index of the cell at V r = 1 and nw is the refractive index of water. The optical path length (OPL(x,y)) through the cell layer of maximum thickness hmax is
 |
2 |
where n p is the perfusate refractive index, h(x,y) is the cell height profile, and A is the field of view. The integral term in Eq. 2 is included because only relative phase differences are important in phase contrast or dark field microscopy, so that the average OPL over the field of view must be zero
 .
.
Assum-ing that cell shape does not change as cell volume changes (h(x,y) = V r h o(x,y)), Eq. 2 becomes
 |
3 |
where havg is the average cell layer height and ho(x,y) is the cell height profile at V r = 1. Eq. 3 indicates that, due to volume-dependent changes in cellular refractive index and cell height, the optical path length of a cell layer depends on the relative cell volume.
Dark field and phase contrast microscopes generate an intensity image (I(x,y)) based on the phase delay, φ(x,y) = (2π/λ) OPL, introduced by the phase object (an object that alters the phase but not the amplitude of the incident light) where λ is the wavelength of light (Goodman, 1968). The predicted image of a thin object formed by a dark field or phase contrast microscope can be calculated using Fourier analysis. The presence of the phase object causes the incident plane wave of unit amplitude, with electric field Eo(x,y) = exp{−iωt} to be modified such that a position-dependent phase delay, exp{iφ(x,y)}, is introduced
 |
4 |
where the real part of Eo(x,y) describes the phase and amplitude of the light at the object plane, ω is angular frequency and t is time. For simplicity, coherent monochromatic light, entrance and exit apertures of infinite extent, and a magnification of unity are assumed. Since only relative phase differences are important, the exp{−iωt} term can be dropped and φ(x,y) was chosen so that
 .
.
For a thin object that introduces a small phase delay [|φ(x,y)| < 1 rad], the exp{iφ(x,y)} term can be approximated by the first three terms of the Taylor's series expansion
 |
5 |
where a is the average value of φ(x,y)2. The first term in Eq. 5 describes the light that passes through the sample without a phase shift (the zero order beam), while the latter terms account for the diffracted light (the higher order beams).
At the back focal plane of the microscope, the electric field is given by the Fraunhoffer approximation and is thus the Fourier transform of the electric field at the object plane (Eq. 5) (Hecht, 1987)
 |
 |
6 |
where E′bfp(u,v) is the electric field at the back focal plane, ℱ{} denotes the Fourier transform, and δ(u,v) is the delta function. Because both φ(x,y) and {φ(x,y)2 − a} are real-valued functions with average values of zero, only the first term in Eq. 6 contributes to the electric field at the origin of the Fourier plane. Both dark field and phase contrast microscopy generate images of phase objects by spatial filtering of the electric field at the back focal plane. The dark field microscope totally attenuates the zero order beam while the phase contrast microscope phase shifts and typically (depending on the objective) attenuates the zero order light relative to the higher order light. The spatial filtering is accomplished at the origin of the Fourier plane (located in the back focal plane of the microscope) since this region contains all of the contribution of the zero order beam. The phase shift and attenuation introduced by the microscope are represented by multiplying the first term in Eq. 6 by the factor T1/2exp(iθ), where θ is the phase shift and T (transmittance) describes the attenuation of the zero order beam. For a dark field microscope, θ = 0 and T = 0, while for the phase contrast microscope, θ = ±π/2 and T > 0. Thus, the electric field intensity just after passing through the back focal plane, E bfp(u,v) is
 |
 |
7 |
At the image plane of the microscope, the electric field, E i(x,y), is the Fourier transform of the electric field at the back focal plane
 |
 |
8 |
The light intensity at the image plane, I(x,y), is the square of the modulus of the electric field at the image plane
 |
 |
9 |
where only terms to second order in φ(x,y) have been retained to be consistent with the original approximation (|φ(x,y)| < 1 rad). The integrated intensity,
 |
 |
10 |
where c is an instrumental constant and the constants,
α1 = cT + α2 (ncell o − nw)2, and α2 = c(4π2/λ2)(1 − T)

do not depend on relative cell volume. Eq. 10 predicts that the integrated intensity is approximately linearly related to relative volume (since nw − np < no cell − nw). The sensitivity of the signal to cell volume changes depends on the difference in refractive indices of water and the perfusate, as well as cell shape and intracellular refractive index. Because the volume-independent term (α1) is smaller for dark field microscopy, the sensitivity should be greater for dark field than for phase contrast microscopy. The integration of the image intensity is accomplished either optically, by measuring the total intensity of the light emerging from the microscope, or numerically, by integrating the pixel intensity of an image. For thick objects, |φ(x,y)| > 1 rad, Eq. 4 can be used directly with Fourier analysis to numerically calculate the volume-dependent changes in transmitted light intensity (Goldstein, 1991).
methods
Cell Culture and Tissue Isolation
The following cell lines were grown on 18-mm diameter round coverglasses: MDCK (CCL 34; American Type Culture Collection, Rockville, MD), CHO-K1 (Cell Culture Facility, University of California, San Francisco), Sf9 (CRL 1711), CAKI-1 (HTB 46), BHK (CRL 6281), astrocytes (HTB 12), and A549 (CCL 185). Cells were grown in DME-H21, Ham's F12K, SFM, McCoy's 5a, DME-H21, Leibovitz's L15, and Ham's F12K media, respectively. All media except SFM were supplemented with 10% fetal calf serum. Cells were maintained at 37°C in a 95% air/5% CO2 incubator, except for Sf9 cells, which were grown at 28°C in an air incubator. Chinese hamster ovary (CHO) cell clones stably expressing rat AQP2 and AQP5 were generated by transfection with the rat coding sequence using plasmid pcDNA3, G418 selection, and clonal analysis as described previously for AQP1 and AQP4 (Ma et al., 1993; Yang et al., 1996). Primary cultures of human tracheal epithelia obtained from autopsy specimens, SK-MES cells (HTB 58; American Type Culture Collection) and MDCK cells were grown on Cyclopore porous supports (0.45 μm; Falcon Labware, Cockeysville, MD)(Yamaya et al., 1992). Cells were generally used when just confluent. Urinary bladders from the toad Bufo marinus were dissected, washed, and mounted as described previously (Farinas and Verkman, 1996).
Instrumentation
Experiments were carried out on an inverted microscope (Diaphot; Nikon, Inc., Melville, NY) equipped with either a phase contrast condenser (LWD; Nikon, Inc.) or a dark field condenser (4029; E. Leitz Wetzlar GmbH, Wetzlar, Germany). Samples were illuminated with a 50-watt tungsten-halogen lamp powered by a stabilized DC power supply (68735; Oriel Corp., Stratford, CA). Unless otherwise specified, samples were illuminated with green light (546 nm) using a broad band interference filter and visualized using a 20× DL positive phase objective (numerical aperture 0.4; Nikon, Inc.). Transmitted light was collected and focused onto a silicon photodiode (PDA50; Thorlabs, Inc., Newton, NJ) or a cooled CCD camera (14-bit, 512 × 512 pixels; Photometrics Ltd., Tucson, AZ). The photodiode signal (0–1 V) was digitized by a 12-bit analog-to-digital converter (Computer Boards, Mansfield, MA) interfaced to a computer.
Cells grown on coverglasses were perfused in a channel-type flow chamber (Farinas et al., 1995). Apical and basolateral surfaces of polarized cells grown on porous supports were perfused using a dual perfusion chamber (Verkman et al., 1992). The same chamber was used with intact epithelial tissue layers except that pins were used to stretch and stabilize the tissue. Solution exchange was accomplished using a 4-way valve (Hamilton Co., Reno, NV). Temperature was controlled using an in-line steel coil immersed in a water bath just proximal to the flow chamber. Perfusate flow was monitored by an in-line flow meter and temperature was monitored by a thermistor.
Solutions and Measurement Protocols
Solutions consisted of PBS (in mM): 137 NaCl, 2.7 KCl, 1.0 KH2PO4, 1.0 Na2HPO4, pH 7.4, 300 mosmol, hypotonic PBS (PBS diluted with specified amounts of distilled water), and hypertonic PBS (PBS containing specified concentrations of NaCl or glycerol). For studies in toad urinary bladder, toad Ringer's solution (in mM): 110 NaCl, 2.5 NaHCO3, 3 KCl, 2 KH2PO4, 1 CaCl2, 5 glucose, pH 7.6, 240 mosmol, was used. In some studies, solutions of specified osmolarities and refractive indices were prepared using combinations of NaCl, mannitol, and raffinose. Solution refractive indices were measured with an Abbe-3L refrac-tometer (Milton Roy, Rochester, NY). Measurements generally involved the continuous collection of transmitted light intensity during cell or tissue perfusion with solutions of specified composition.
Computation of Water Permeability for Cells on Glass Supports
Plasma membrane osmotic water permeabilities (Pf) were calculated from the time course of volume change in response to an osmotic gradient. As seen from Eq. 10, the integrated intensity is approximately proportional to relative cell volume, V r, [I = c1 + c2 V r, where c2 = ΔI/(V rf − 1)]. The rate of volume change, dV r/ dt, is then related to the rate of change of intensity, dI/dt
 |
11 |
where ΔI is the amplitude of the intensity change and V rf is the final volume. For cells grown on glass supports, and assuming that cells act as perfect osmometers [ΠV r = constant, where Π is the osmolarity], V rf = Πo/Πf. The value of dI/dt|t = 0 was determined by least squares fitting of the data (Kinfit; Olis, Inc., Jefferson, GA). The initial rate of cell volume change (dV r/dt|t = 0) is given by dV r/dt|t = 0 = Pf (S/V o) vw ΔΠ where S/V o is the cell surface-to-volume ratio, and v w is the molar volume of water. Surface-to-volume ratios were measured by image reconstruction using confocal microscopy as described previously (Farinas et al., 1995). For cell layers grown on glass supports, it follows that the water permeability coefficient is Pf = Î/ (S/V o vw Πf) where Î = (dI/dt|t = 0 / ΔI) is the rate of signal change normalized to the signal amplitude.
Computation of Water Permeability for Polarized Epithelial Cells
In the case of an epithelial cell layer, both the time course of volume change and the final volume, V rf, are dependent on both the apical and basolateral perfusate osmolarities (Πap and Πbl), as well as the apical Pf ap and basolateral Pf bl water permeability coefficients
 |
12 |
 |
13 |
where Πo is the initial cell osmolarity. Because the volume change depends on both apical and basolateral parameters, two independent measurements are required to calculate Pf ap and Pf bl from measured intensity changes. Eqs. 11–13 can be used to relate the signal to the permeabilities and relative volume. Three distinct experimental protocols are suitable.
The first protocol uses a gradient of varying magnitude applied at any one of the two sides. Combining Eqs. 11–13 (for a change in apical membrane osmolarity)
 |
14 |
A plot of Î versus perfusate osmolarity, Πap, yields a straight line whose slope depends on the permeability on the cis side and whose intercept depends on the permeability at the trans side.
The second protocol uses a gradient applied at each of the two membranes separately. For each membrane, the normalized rate of signal change is related to the water permeabilities by Eq. 14, giving
 |
15 |
 |
16 |
where Πbl = Πap is the perfusate osmolarity applied at each side.
The third protocol uses a measurement of the sum of apical and basolateral permeabilities with a measurement of the ratio of permeabilities. The sum of permeabilities is determined by simultaneously changing the perfusate osmolarity on the apical and basolateral membranes and measuring the normalized rate of signal change. From Eqs. 11–13, the sum of the water permeabilities is related to Î
 |
17 |
Since the signal intensity is proportional to the relative volume, Pf ap/Pf bl is obtained using Eq. 13 and a measurement of the signal amplitude after changing the perfusate osmolarity, Πi, at the apical, and then the basolateral sides (ΔIap and ΔIbl, respectively):
 |
18 |
where r = ΔIap/ΔIbl. Together, Eqs. 17 and 18 yield the apical and basolateral water permeability coefficients.
results
Osmotic Water Transport Measured by Spatial Filtering Microscopy
Initial studies were carried out to validate and optimize the measurement of water permeability in various cell types. Fig. 2 A shows the time course of transmitted light intensity through a monolayer of MDCK cells as the perfusate osmolarity is changed. By bright field microscopy, there was no detectable signal change; however, by either phase contrast or dark field microscopy, there was a gradual decrease in signal intensity as cell volume increased in response to a change in perfusate osmolarity from 300 to 150 mosmol. The signal was reversed upon return of osmolarity to 300 mosmol and the cycle could be repeated multiple times (not shown). The signal increased as cell volume decreased in response to a change in perfusate osmolarity from 300 to 600 mosmol. The time course of integrated intensity (shown for phase contrast microscopy) was temperature dependent (Fig. 2 B) and in agreement with the time course measured for this cell type by TIR microfluorimetry (Farinas and Verkman, 1996). The activation energy calculated from this data, 12 kcal/mol, is consistent with non–channel-mediated transport of water across the plasma membrane. The time over which the transmitted light signal changed was much slower than the solution exchange time shown in Fig. 2 C. Taken together, these results demonstrate that the phase contrast and dark field signals are sensitive to relative cell volume. The amplitude of the phase contrast signal was relatively insensitive to illumination wavelength in the range 500–700 nm (phase objective optimized for 546 nm) (data not shown).
Figure 2.

The integrated intensity in phase contrast or dark field microscopy is dependent on cell volume. (A) The integrated intensity with brightfield, darkfield, or phase-contrast illumination was recorded for an MDCK cell layer bathed in solutions of indicated osmolarities at 23°C. (B) The integrated intensity from a phase contrast microscope was recorded for an MDCK cell layer undergoing osmotic volume changes at the indicated temperatures. (C) The time course of dye solution washout was used to measure the solution exchange time. (D) The phase contrast intensity was measured for the indicated cell types subjected to the specified osmotic gradients. (E) Sf9 cells perfused originally with PBS (300 mosmol) were swollen in hypotonic PBS (150 mosmol). The cells were then switched to PBS containing 150 mM glycerol (300 mosmol total osmolarity) and then back to hypotonic PBS.
Fig. 2 D shows that phase contrast microscopy could be used to study cells of different shapes and sizes. Signal changes for epithelial cells were generally in the range of 10–20% for a twofold change in cell volume, but somewhat smaller for cells of low height such as astrocytes. The excellent signal-to-noise ratio for the transmitted light detection (generally >100:1) permitted measurement of relative cell volume changes as small as 1%. Fig. 2 E demonstrates that solute as well as water permeability can be measured by phase contrast microscopy. After cell swelling in response to hypotonic PBS (decreased signal), addition of glycerol to the hypotonic PBS produced a rapid increase in signal due to osmotic water efflux, followed by a slower decrease in signal as glycerol and water entered the cell. A similar biphasic response was found after glycerol removal.
Images of CHO cells were acquired using the phase contrast microscope (Fig. 3 A). Changing osmolarity from 300 to 600 mosmol caused cell shrinking and a corresponding increase in the brightness of the cells. Changing perfusate osmolarity from 300 to 150 mosmol caused cell swelling and a corresponding decrease in integrated pixel intensity. The details of the change in integrated intensity for individual cells was investigated for Sf 9 cells since they have a simple, nearly radially symmetric shape. Images acquired at 400 mosmol show an increase in intensity of 6% compared with images acquired at 300 mosmol (Fig. 3 B). The change in the radial distribution of intensity was calculated for a representative cell (Fig. 3 B, arrow) and is plotted in Fig. 3 C. The change in intensity occurs throughout the cell until at large radius the background intensity is reached. It follows that the integrated intensity can be measured either by collecting light from the full microscope field and focusing it onto a photodetector, or by integrating the pixel intensity of a recorded image. In the latter case, it is possible to measure the response of individual cells to osmotic gradients.
Figure 3.
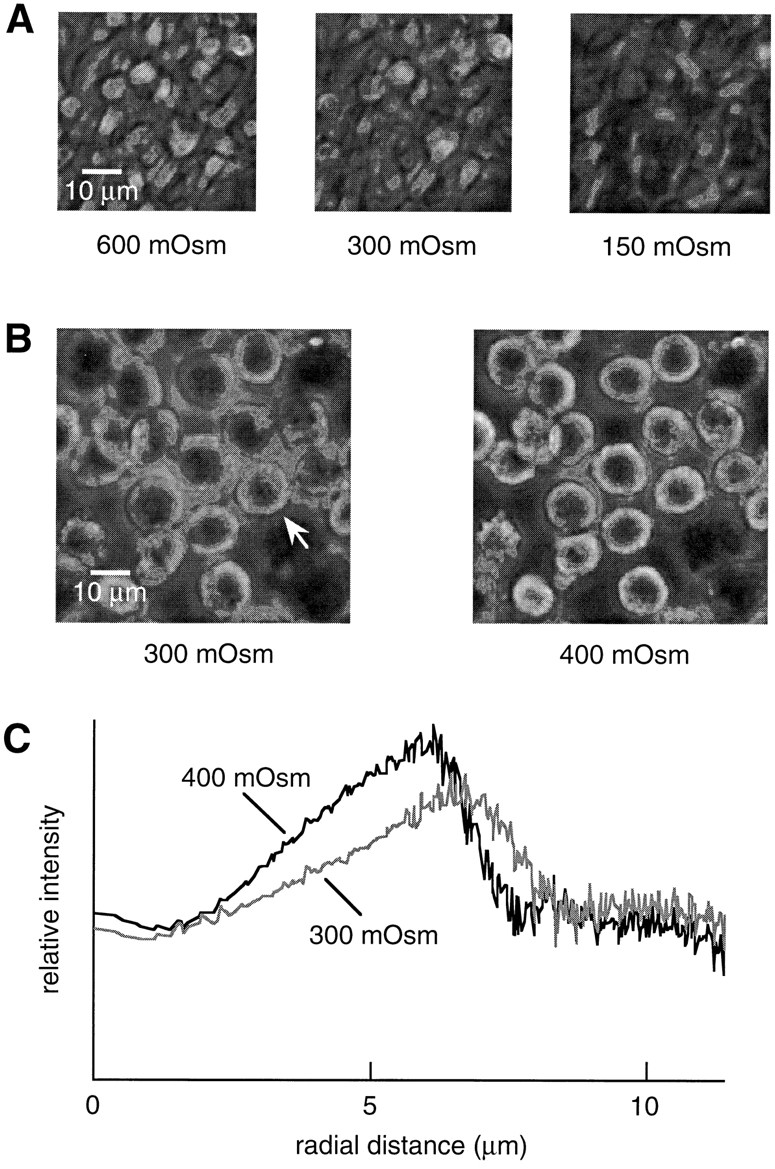
Phase contrast images of CHO cells at 600, 300, and 150 mosmol (A) and Sf9 cells at 300 and 400 mosmol (B). (C) For the cell marked by an arrow in B, the pixel intensity is plotted as a function of radial distance from the center of the cell for images acquired at 300 and 400 mosmol.
Validation of Theory Predictions
The theory developed above explains how the phase contrast or dark field microscope produces a volume-dependent signal. To validate the theory, testable predictions were compared with experimental results. Fig. 4 A shows the dependence of relative signal intensity on relative cell volume predicted by Eq. 10. For a square cell (hmax = 4 μm, np = 1.334, nc = 1.366, nw = 1.3323, surface coverage = 50%) in a phase contrast microscope (θ = π/2, λ = 546 nm, T = 0.09) or a dark field microscope (T = 0), the integrated intensity is approximately a linear function of relative cell volume with a slight upward concavity. While the transmittance of a dark field microscope is 0 and that for a bright field microscope is 1, phase contrast microscopes can have any nonzero value of the transmittance. The sensitivity of the signal to cell volume changes (dI/dV r|V r = 1), increases as the transmittance of the spatial filter decreases (Fig. 4 B). As found experimentally, maximum sensitivity is obtained for a dark field microscope (T = 0) while a bright field microscope (T = 1) is insensitive. The model predicts a weak dependence of signal on the wavelength of light (Fig. 4 C). For a given cell shape, the model predicts that the sensitivity is approximately proportional to the difference between refractive indices of the perfusate and water (Fig. 4 D). Practically, this indicates that for a given volume change the signal size can be increased by increasing the perfusate refractive index. As expected, the sensitivity increases for objects with greater cell heights (Fig. 4 E). The sensitivity differs weakly for different cell shapes (trapezoidal, square, or elliptical) having the same degree of surface coverage (70%) and the same initial cell volume (Fig. 4 F). Taken together, these computations indicate that the details of the microscope (the transmittance and wavelength), the cell type (shape and height), and the perfusate composition (refractive index) affect the sensitivity of the signal to cell volume. However, in all cases a signal that is approximately linearly proportional to relative cell volume is predicted.
Figure 4.

Theory predictions. (A) The relative intensity as a function of relative cell volume was calculated using Eq. 10 for square cells (height = 4 μm, coverage = 50%, n
p = 1.3341, n
cell = 1.366, n
w = 1.3323) viewed with a phase contrast (θ = π/2, λ = 546 nm, T = 0.09) or darkfield microscope (T = 0). (B) The signal sensitivity (dI/ dV
r|V
r = 1) as a function of the transmittance of the spatial filter was calculated for square cells (same parameters as A). The effect of wavelength, λ (C), perfusate refractive index, np (D), and cell height (E) was calculated for square cells viewed with a phase contrast microscope (all other parameters as in A). (F) Cell shape, h(x,y) was varied at constant coverage (70%) and average cell height (3.4 μm) for a phase contrast microscope (parameters as in A). The region |x|, |y| < 100 μm was used to define cell shapes. Trapezoidal [h(x,y) = 5.1 μm if |x|,|y| < 5.17, h(x,y) = 13.35(1 − |x|/ 8.37) if 5.17 < |x| < 8.37 and |y| < |x|, h(x,y) = 13.35(1 − |y|/8.37) if 5.17 < |y| < 8.37 and |x| < |y|, else h(x,y) = 0], square [h(x,y) = 3.4 μm if |x| and |y| < 8.37, else h(x,y) = 0] and elliptical [h(x,y) = 5.1 μm (1 − x2/89.1 − y2/89.1)1/2 if (x2+y2)1/2 < 9.44, else h(x,y) = 0] shapes were used with c = 1/ .
.
Model predictions were confirmed experimentally using a phase contrast microscope. Fig. 5 A shows a calibration of integrated intensity vs. relative cell volume for two cell types, Sf 9 and CHO. Relative cell volume was changed by equilibrating the cells with perfusates of various osmolarities; assuming that cells act as ideal osmometers, the relative cell volume equals the reciprocal relative perfusate osmolarity. The nearly linear (with slight upward concavity) data agrees well with the theoretical predictions (Eq. 10). As expected from Fig. 4, E and F, the taller Sf9 cells show greater sensitivity than the CHO cells. To test the effect of perfusate osmolarity on signal size, Sf9 cells were subjected to the same osmotic gradient (300–400 mosmol) at two different constant refractive indices (np = 1.3363 and 1.3408 for buffers containing 100 mosmol mannitol and 100 mosmol raffinose, respectively). As predicted in Fig. 4 D, Fig. 5 B shows that the signal size increases as the perfusate refractive index increases. The signal size increased by a factor of 2.05 ± 0.2 (mean ± SEM, n = 3), which was not significantly different from the predicted value of 1.87 (P > 0.25).
Figure 5.

(A) Dependence of relative signal intensity on relative cell volume for CHO cells (open circles) and Sf9 cells (filled squares) are plotted as means ± SEM (n = 4). Fitted second order polynomials are shown. (B) Effect of perfusate-refractive index on signal size. Sf9 cells initially at 300 mosmol (containing 100 mM of either mannitol or raffinose with refractive indices of 1.3363 and 1.3408, respectively) were shrunk in a solution at 400 mosmol (containing ≅ 100 mM of either mannitol or raffinose with solution refractive indices of 1.3363 and 1.3408, respectively). The use of mannitol yielded a difference in refractive index between perfusate and water of 0.004, while use of raffinose gave a difference of 0.0085.
Characterization of Aquaporin-expressing Transfected Cells
Water permeability was measured in CHO cells that were stably transfected with several mammalian aquaporins and grown on glass coverslips. Previously, water transport in CHO cells expressing AQP1 and AQP4 was measured by stopped-flow light scattering (Ma et al., 1993; Yang et al., 1996); however, it was difficult to obtain accurate permeabilities because of the cell damage associated with the suspension procedure and cell settling during the course of the measurement. Representative phase contrast intensity data are shown in Fig. 6 A for the response of cells to osmotic gradients (300– 150–300 mosmol) at 24°C. The rate of change of intensity was increased more than fourfold in the transfected cells compared with the control cells. Using Eq. 11 and an (S/V)o of 5,450 cm−1 (Ma et al., 1993), water permeability coefficients were low in control (nontransfected) cells (0.0012 cm/s) and significantly increased for the CHO cells expressing AQPs 1, 2, 4, and 5 (Fig. 6 B).
Figure 6.

Water permeability in stably transfected CHO cells expressing indicated aquaporins. (A) Time course of phase contrast intensity for control and aquaporin-transfected cells upon switching perfusate osmolarity from 300 to 150 mosmol (first arrow) and back to 300 mosmol (second arrow). (B) Calculated water permeability coefficients for CHO cells (mean ± SEM, n = 10).
Water Permeability in Epithelial Cells
As derived in methods, three protocols enable the measurement of individual permeability coefficients in an epithelial cell layer. Fig. 7 shows predictions of the model to demonstrate several principles. Fig. 7 A indicates that as the size of the gradient applied at one side of an epithelium is varied, the amplitude and rate of volume change (and integrated intensity since signal intensity is proportional to relative cell volume) is altered (Pf ap = Pf bl = 0.003 cm/s, Πo = Πbl = 300 mosmol, v w = 0.018 l/mol, S/V o = 2,000 cm−1, Πap as indicated). Fig. 7 B shows that the normalized rate of signal change is linearly dependent on perfusate osmolarity, where the slope depends on the permeability at the cis side and the intercept depends on the permeability of the trans side (first protocol, Eq. 14). If a gradient is applied only to one membrane, Fig. 7 C shows that the rate of change of volume depends on the ratio of permeabilities (shown for change at apical side, Πo = Πbl = 300 mosmol, Πap = 200 mosmol, Pf ap + Pf bl = 0.011 cm/s, Pf ap/Pf bl as indicated). The half-time for volume change is faster if the gradient is applied to the membrane of lower permeability because less water flow must occur to reach the steady state volume. Therefore, measurement of the rate of change of volume after application of a gradient to the apical and then the basolateral membrane provides the individual membrane water permeabilities (second protocol, Eqs. 15 and 16). Fig. 7 C also shows that the total volume change is strongly affected by the ratio of permeabilities. The volume change is greatest when the osmotic gradient is applied at the membrane of higher permeability (Pf ap/ Pf bl = 10). Fig. 7 D shows that simultaneous application of a gradient to both membranes results in a change in volume with a rate determined by the sum of the individual permeabilities (Πo = 300 mosmol, Πap = Πbl = 200 mosmol, S/V o = 2,000 cm−1, Pf ap+Pf bl as indicated). Together, measurements from Fig. 7, C and D yield the individual membrane permeabilities (third protocol, Eqs. 17 and 18).
Figure 7.

Calculated cell volume time course for epithelial cell layers. (A) Effect of the size of the osmotic gradient applied at the apical side of an epithelium. (Πo = Πbl = 300 mosmol, v w = 0.018 l/mole, S/V o = 2,000 cm−1, Pf ap = Pf bl = 0.003 cm/s, and Πap as indicated). (B) Normalized rate of signal change (Î = dI/dt|t = 0/ΔI) as a function of perfusate osmolarity (Pf ap and Pf bl as indicated, other parameters as in A). (C) Effect of ratio of water permeabilities, (Pf ap/Pf bl) on the cell volume time course for an osmotic gradient applied at the apical side (Πo = Πbl = 300 mosmol, Πap = 200 mosmol, Pf ap+Pf bl = 0.011 cm/s, Pf ap/Pf bl as indicated, other parameters as in A). (D) Dependence of the volume time course on the sum of apical and basolateral water permeabilities after simultaneous application of a gradient to both membranes (Πo = 300 mosmol, Πap = Πbl = 200 mosmol, v w = 0.018 l/mole, S/V o = 2,000 cm−1, Pf ap + Pf bl as indicated). See text for explanations.
To determine the osmotic water permeability of the apical and basolateral membranes of an epithelial cell layer, MDCK cells were grown on porous supports. Several porous supports were tested for their optical properties and effective solution exchange when replacing solutions bathing the basal cell surface (through the support). It was found that the Cyclopore porous filter (11 μm thickness, 0.45 μm pore size) did not interfere with the quality of the phase contrast signal. Furthermore, since the Pf ap and Pf bl values measured for AQP5-transfected cells grown on the Cyclopore membranes were equal and high (as in Fig. 6 A), it was concluded that the filter did not introduce a delay in solution mixing for the dual perfusion chamber used here (data not shown). Fig. 8 A shows the time course of phase contrast signal for swelling and shrinking of MDCK cells by replacement of apical and basolateral perfusates. Water permeability coefficients at 23°C were calculated using the three protocols described in methods using measured apical and basolateral surface-to-volume ratios of 2,290 and 2,470 cm−1, respectively. For the first protocol (Eq. 14), Î values were 0.0296 and 0.0857 s−1 for changes of 300–150 and 300–600 mosmol at the apical membrane, and 0.0299 and 0.0564 s−1 for identical changes at the basolateral membrane. Using Eq. 14, the average permeabilities were Pf ap = 0.0024 ± 0.0007 cm/s and Pf bl = 0.0011 ± 0.0007 cm/s. The average ratio of permeabilities was Pf ap/ Pf bl = 2.2. For the second protocol, Î values were 0.0274 and 0.0286 s−1 for osmolarity changes of 300–150 mosmol at the apical and basolateral membranes, respectively, and 0.0604 and 0.0401 s−1 for osmolarity changes of 300–600 mosmol. Using Eqs. 15 and 16, Pf ap = 0.0019 ± 0.0003 cm/s and Pf bl = 0.0009 ± 0.0004 cm/s. The third protocol described in methods was used to measure the relative water permeability coefficients. The ratio of signal changes for apical and basolateral changes was 1.88 for changes in osmolarity from 300 to 150 mosmol, and 1.59 for changes in osmolarity from 300 to 600 mosmol. Eq. 17 gives a ratio of apical-to-basolateral permeabilities Pf ap/Pf bl of 1.94, in agreement with that measured by the first method. The values obtained by the first protocol were used to compute the predicted transepithelial water permeability for the apical and basolateral barriers in series, Pf TE = 0.00075 cm/s, where [Pf TE(S/ V o)TE]−1 = [Pf ap(S/V o)ap]−1 + [Pf bl(S/V o)bl]−1.
Figure 8.

Water permeability in epithelial cell layers. Time course of phase contrast intensity for MDCK cells (A) and human tracheal cells (B) upon switching either apical or basolateral perfusate osmolarity. The response of human tracheal cells derived from normal (top) and cystic fibrosis (bottom) patients is shown. (C) Time course of phase contrast signal intensity for toad urinary bladder epithelium for indicated changes in basolateral and apical perfusate osmolarities in the absence of vasopressin. (D) Effect of changing apical perfusate osmolarity on toad bladder epithelium stimulated with 50 mU/ml vasopressin and with the basolateral membrane coated with oil.
Recent studies have measured the water permeability across the alveolar and small airway epithelial barriers; however, no information has been available for the trachea and larger airways. To measure the water permeability of the apical and basolateral membranes of tracheal epithelia, primary cultures of human trachea were grown on porous supports. Fig. 8 B shows the time course of phase contrast signal for swelling and shrinking of tracheal cells by replacement of apical and basolateral perfusates. Apical and basolateral surface-to-volume ratios of 1,940 and 1,300 cm−1 were measured. Using the first and second protocols, average Pf ap and Pf bl were computed to be 0.0052 and 0.0039 cm/s at 23°C, respectively. The average ratio of permeabilities Pf ap/ Pf bl = 1.3 agrees with that calculated from the third protocol, Pf ap/Pf bl = 1.4. These values were used to calculate the expected transepithelial water permeability for the tracheal epithelium, Pf TE = 0.0022 cm/s. The time course of cell volume change in tracheal epithelial cells was notably faster than that observed for the MDCK cells.
The time course of phase contrast signal for a primary culture of tracheal epithelial cells derived from a cystic fibrosis patient is also shown in Fig. 8 B. Together with the measured apical and basolateral surface-to-volume ratios of 1,770 and 1,480 cm−1, average Pf ap and Pf bl were computed to be 0.0062 and 0.0028 cm/s, respectively. For SK-MES cells, which are a model for lung cystic fibrosis cells, the measured Pf ap and Pf bl at 23°C were 0.0018 and 0.0010 cm/s, respectively.
Vasopressin-regulated Water Permeability in Toad Bladder
The toad urinary bladder has been studied extensively as a model system for vasopressin-regulated water permeability in kidney collecting duct. It has been assumed that water permeability is rate limited at the apical plasma membrane. To measure basolateral and apical membrane water permeability directly, toad urinary bladders were mounted in a perfusion chamber. Fig. 8 C shows the time course of integrated signal in response to a fivefold dilution of basolateral and then apical perfusate in the absence of vasopressin. A volume-dependent change in intensity was seen for changes in basolateral but not apical osmolarity due to a low value of Pf ap/Pf bl. The data can be used to set an upper limit on ΔIap/ΔIbl < 0.02, which, using Eq. 17, gives an upper limit for Pf ap/Pf bl < 0.07. Because the basolateral permeability is much greater than the apical permeability, the apical membrane is essentially impermeable so that a change in basolateral osmolarity was used with Eq. 11 to calculate Pf bl = 0.036 ± 0.007 cm/s at 23°C. To estimate apical membrane water permeability, oil was brushed onto the basal surface to prevent volume flow across this membrane. Under these conditions, toad bladders stimulated with 50 mU/ml of vasopressin showed a change in signal as apical perfusate osmolarity was changed (Fig. 8 D). Eq. 11 gives a value of Pf ap = 0.025 ± 0.009 cm/s at 23°C. From these results, trans-epithelial Pf TE = 0.015 cm/s is computed for the vasopressin-stimulated toad bladder epithelium.
discussion
The goal of this study was to develop a simple, quantitative method to measure plasma membrane water and solute permeabilities in cell layers for application to cells and tissues expressing molecular water channels. The motivation for this study was the limitation of existing methods and the need to make permeability measurements on native and transfected cell cultures of polarized epithelial cells and intact tissues. Based on the principle that the optical path length through a cell layer is sensitive to cell volume (Farinas and Verkman, 1996), we predicted that a phase contrast or dark field microscope would generate an integrated intensity signal that was sensitive to cell volume. The method was effective for permeability measurements in a wide variety of cells of different size and shape cultured on solid or porous supports, as well as in intact epithelial sheets. Phase contrast or dark field microscopy enabled measurement of stable signals with signal-to-noise ratios generally exceeding 100:1. The theoretical basis of the sensitivity of integrated phase contrast signal to cell volume was established and model predictions were validated experimentally. The technical simplicity and high data quality afforded by the phase contrast approach should make it the method of choice for plasma membrane water and solute permeability measurements in cell layers, as well as for studies of cell volume regulation.
The instrumentation required to carry out the permeability measurements includes only a conventional phase contrast or dark field microscope, stabilized monochromatic light source, solid state photodetector, and cell perfusion chamber. Unlike interferometry, high quality phase contrast signals could be obtained with a conventional, incoherent illumination source, although use of a more coherent source would theoretically improve contrast. However, laser speckle pattern would present a potential difficulty. For routine use, an incandescent light source (tungsten-halogen lamp) with a stabilized power supply is recommended because of its superior stability to arc lamps. The high transmitted signal intensities permitted detection by a solid state photodiode. When imaging is not required or microscopes are not available or practical, the method can be implemented by illuminating a cell layer with a laser diode (e.g., a common red laser pointer) and passing the transmitted light through a lens with a small stop placed at its focus to attenuate the zero order light. A second lens is used to focus the higher order beams onto a photodiode. In this way, an inexpensive apparatus could be constructed that uses the principles of spatial filtering to generate volume-dependent signals. Finally, the perfusion chamber is an important component of the instrument. The chamber should permit solution exchange with rapid exchange times, little turbulence to minimize cell trauma, and clear rigid windows for quantitative microscopy. Single and dual channel flow chambers were used that were modeled after chambers designed for in vitro perfusion of isolated kidney tubules. New perfusion chamber designs with millisecond exchange times should permit measurement of fast transport processes with time resolution comparable with stop-flow mixing methods.
The phase contrast method offers considerable advantages over existing methods to measure plasma membrane transport processes in cell layers in terms of technical simplicity and data quality. TIR fluorescence (Farinas et al., 1995) provides accurate relative cell volume values based on dilution of an aqueous-phase fluorescent indicator in the cytoplasm. Interference microscopy (Farinas and Verkman, 1996) provides information about cell shape and absolute cell volume that are not obtainable by phase contrast microscopy. However, unlike TIR, phase contrast microscopy permits measurements on nonadherent cell layers, and unlike interference microscopy, signal detection in phase contrast microscopy is not sensitive to small temperature gradients, air currents, or variations in the fluid layer thickness of the perfusion chamber. Light intensity signals from phase contrast microscopy can be related to cell volume by use of a calibration procedure as in Fig. 4, and the theory (Eq. 10) predicts the functional form of the phase signal vs. cell volume relation. The method shares with the light scattering method (Echevaria and Verkman, 1992; Fischbarg et al., 1993; McManus et al., 1993) the diffraction phenomena to generate an optical, volume-dependent signal. However, compared with light scattering methods, phase contrast microscopy has distinct advantages in terms of applicability to cells of arbitrary shape and size, and the ability to study individual cells by image detection, as well as a rigorous theory that predicts the magnitude and sign of the observed signal changes.
As in interferometry, the theoretical basis for the dependence of integrated intensity on cell volume involves volume-dependent changes in the optical path length through the cells. No extrinsic probe is required; instead, cell volume–dependent changes in intracellular refractive index are used. In interferometry, the optical path length changes are recorded as differences in intensity of interfering reference and sample light beams. In phase contrast and dark field microscopy, the optical path length changes are recorded as differences in integrated intensity due to spatial filtering of the electric field perturbation introduced by the object.
Model predictions concerning the dependence of the integrated phase contrast signal on perfusate refractive index were tested experimentally. It was found that the integrated signal was approximately linearly dependent on the relative cell volume. The sensitivity of the method was cell-type dependent as expected from differences in cell shape and height. Although excellent signals were obtained for most cell types with the measurement protocol used here, certain cell types, including LLC-PK1 cells, showed relatively poor sensitivity of signal to cell volume. For such cases, the sensitivity could be increased by increasing perfusate refractive index, using a shorter wavelength illumination and dark field microscopy. Since the signal amplitudes were generally large and phase contrast microscopes are more common than dark field microscopes, phase contrast microscopy was used for most of the measurements reported here. The theory developed to explain the observed intensity changes was based on diffraction by the whole cell rather than scattering from intracellular structures. Scattering from intracellular structures could also, in principle, give rise to volume-dependent intensity changes in spatially filtering microscopes. That this was not the case is shown by the fact that the sensitivity was increased by increasing the perfusate refractive index. The perfusate refractive index would not be expected to have any effect on sensitivity if scattering from intracellular structures gave rise to the observed signals.
For simplicity, the theory was developed with the assumption that cell volume change does not result in cell shape change. Without this assumption, Eq. 10 must be modified by adding a cell volume–dependent shape dependence to α2: α2′ = f(shape,V r). In general, this dependence can be quite complex, but mathematically it can be treated as a Taylor's series expansion: α2′ = α2 [1 + a1(V r−1) + a2 (V r−1)2 + . . .], where aj are the coefficients of the Taylor's series. The form of the dependence in Eq. 10 remains unchanged if the higher order coefficients of the Taylor's series expansion are small (i.e., aj ≅ 0 for j > 2). As for the case of constant cell shape, the signal is approximately linearly dependent on cell volume and increases as the difference in the refractive index of the perfusate increases. However, the sensitivity of the method now depends not only on the details of cell shape but also on the details of cell shape change. Since the experimental results (Fig. 5) show a nearly linear dependence of signal on cell volume, the assumption that aj ≅ 0 for j > 2 is justified. Therefore, while the precise manner in which cell shape changes affects the sensitivity of the method, the general dependence of the signal on cell volume is still expected to be approximately linear.
The phase contrast method was applied to measure water permeability in CHO cells that were stably transfected with cloned mammalian aquaporins. Stably transfected cell lines were established previously for the erythrocyte water channel (AQP1; Ma et al., 1993) and the mercurial insensitive water channel (AQP4; Yang et al., 1996). In those studies, quantitative measurement of plasma membrane water permeability required cell fractionation and water permeability measurement by stop-flow light scattering because of difficulties associated with light scattering and settling of suspended intact CHO cells. The results here show very high water permeability in the CHO cells expressing AQPs 1 and 4. Transfected CHO cells expressing the vasopressin-sensitive water channel AQP2 and the lung/gland water channel AQP5 were established here and showed a similar increase in water permeability compared with control cells. Interestingly, CHO cells expressed AQP2 constitutively at the plasma membrane in the absence of vasopressin, which is different from the results found for LLC-PK1 (Katsura et al., 1995) and CD8 epithelial cell lines (Valenti et al., 1996). This finding raises the possibility that epithelial cells possess factors that participate in the targeting of AQP2-containing vesicles.
A second application of the phase-contrast method was the analysis of water transport in epithelial cell layers. Several protocols were developed for measurement of the water permeability of the apical and basolateral membranes. The measurement could be made either by applying an osmotic gradient at each side of the epithelium or by varying the magnitude of the gradient applied at a single side. A third protocol could in principle be used to measure the permeabilities, but it is technically difficult because simultaneous application of a gradient to the basolateral and apical surfaces is required. The third protocol is best used to measure the relative permeability values. When applied to MDCK cell layers, low water permeabilities were obtained for the apical and basolateral membranes, with that for the apical membrane higher than that for the basolateral membrane. The different protocols yielded similar permeability values. Previous measurement of transepithelial water permeability for MDCK cysts gave a value of 0.00068 cm/s (Mangoo-Karim and Grantham, 1990), which is similar to that of 0.00075 cm/s predicted here from the measurements of the individual plasma membrane permeabilities. Recently, Timbs and Spring (1996) have measured plasma membrane water permeability of MDCK cells at 37°C and found Pf ap and Pf bl to be 0.0011 and 0.0014 cm/s, respectively. The lower time resolution and the presence of unstirred layers in series with the basolateral membrane in their measurement may explain the somewhat lower values than those found in the present study.
The plasma membrane water permeabilities have been calculated using the nominal surface area of the cells without accounting for infoldings. This is the current practice in the field (Timbs and Spring, 1996; Tripathi and Boulpaep, 1989). The calculated permeability values thus represent an upper bound to the actual permeabilities since invaginations can increase the surface area by three- to fivefold. Cell volume and nominal surface areas were measured by confocal microscopy of fluorescently labeled cells. The results of this method were in agreement with values obtained by interference microscopy (Farinas and Verkman, 1996).
The water permeability of individual plasma membranes in tracheal epithelia was measured using primary cultures of human tracheal epithelial cells cultured on porous supports. Immunolocalization studies show that the molecular water channels AQP3 and AQP4 are expressed at the basolateral membrane of tracheal epithelial cells (Frigeri et al., 1995). Elsewhere in lung, AQP4 is expressed throughout small airways (Frigeri et al., 1995) and aquaporins 1 and 5 in alveoli (Hasegawa et al., 1994; Raina et al., 1995). Functional studies in intact lung (Carter et al., 1996) and isolated microperfused airways (Folkesson et al., 1996) have shown high water permeabilities and evidence of molecular water channels. No information has been available on the water permeability of tracheal epithelia. Pf ap and Pf bl values determined here were 0.0052 and 0.0039 cm/s at 23°C, respectively. The water permeability of the basolateral membrane supports the prediction of a high Pf based on the presence of water channels at this site. It will be interesting to measure Pf in tracheal cells from transgenic knock-out mice lacking AQP4 (Ma et al., 1997). The high water permeability of the apical membrane and the fact that no known water channels have been localized to this membrane suggest that an as yet unidentified water channel may be expressed. The expected transepithelial water permeability for the tracheal epithelium, Pf TE = 0.0022 cm/s, was threefold higher than that for the MDCK cell layer.
Previous measurements on epithelia including mammalian and amphibian proximal tubule and gallbladder gave a ratio of apical to basolateral water permeability less than one (Tripathi and Boulpaep, 1989). Our results represent the first measurements of water permeability of individual plasma membranes in several types of nonleaky epithelia. The results show that the water permeability of the apical membrane is higher than that of the basolateral membrane. This was found for tracheal cells as well as SK-MES cells. The high apical membrane water permeability of tracheal cells may be of physiological importance since it would facilitate the rapid equilibration of the water content of the thin mucus layer in contact with the apical membrane of the tracheal cells. The high water permeability of the apical membrane couples the mucosal extracellular volume to the cell volume, thereby slowing any changes in the mucus water content. The calculated transepithelial water permeability of this tissue is sufficiently high so that water permeability does not limit the rate of water secretion or reabsorption (Novotny and Jakobsson, 1996). The water permeability of epithelial cells derived from normal and cystic fibrosis patients was similar. The abnormal hydration of mucus in cystic fibrosis patients is thus not related to reduced water permeability.
The method was also applied to measure water permeability in intact epithelial tissues. The basolateral membrane osmotic water permeability of toad urinary bladder was measured for the first time. In the unstimulated bladder, the basolateral permeability, Pf bl = 0.036 cm/s, was >14-fold higher than the apical permeability. The measured Pf ap value of 0.025 cm/s for the vasopressin-stimulated bladder is consistent with the value of 0.04 cm/s for a forskolin-stimulated bladder measured by interferometry (Farinas and Verkman, 1996). The calculated value of the transepithelial water permeability Pf TE = 0.015 cm/s for the stimulated bladder is comparable with values measured gravimetrically: 0.023 cm/s (Levine and Kachadorian, 1981) and 0.028 cm/s (Shi et al., 1990). The high basolateral Pf is consistent with the notion that the apical membrane is the predominant barrier to water flow even under conditions of vasopressin stimulation.
Taken together, the results establish light microscopy with spatial filtering as a technically simple and accurate method for measuring osmotic water permeability in cell layers. The method provided the first measurement of apical and basolateral plasma membranes for human tracheal epithelial cell lines grown on porous supports and for the toad urinary bladder.
Acknowledgments
We thank Dr. David Agard for useful discussions regarding phase contrast microscopy, Dr. Walt Finkbeiner for providing tracheal epithelial cultures and advice in culturing cells on porous supports, Drs. Ethan Carter and Neil Emans for help in animal tissue studies, and Drs. Baoxue Yang and B.K. Tamarappoo for AQP2 and AQP5 cell transfections.
This work was supported by grants DK-35124, HL-42368, HL-51854, and DK-43840 from the National Institutes of Health and grant R613 from the National Cystic Fibrosis Foundation. Javier Farinas was a graduate student supported by a predoctoral fellowship from the American Heart Association, California Affiliate and a Krevans Fellowship from UCSF. Megan Moore was a summer research student of the American Heart Association, California Affiliate.
Footnotes
Abbreviations used in this paper: CHO, Chinese hamster ovary; Pf, osmotic water permeability; TIR, total internal reflection.
references
- Alvarez-Leefmans FJ, Altamirano J, Crowe W. Use of ion-selective microelectrodes and fluorescent probes to measure cell volume. Methods Neurosci. 1995;27:361–391. [Google Scholar]
- Carter EP, Matthay MA, Farinas J, Verkman AS. Transalveolar osmotic and diffusional water permeability in intact mouse lung measured by a novel surface fluorescence method. J Gen Physiol. 1996;108:133–142. doi: 10.1085/jgp.108.3.133. [DOI] [PMC free article] [PubMed] [Google Scholar]
- Crowe WE, Willis N. A simple method for monitoring changes in cell height using fluorescent microbeads and an Ussing-type chamber for the inverted microscope. Pflugers Arch. 1991;419:349–357. doi: 10.1007/BF00371117. [DOI] [PubMed] [Google Scholar]
- Crowe WE, Altamirano J, Huerto L, Alvarez-Leefmans FJ. Volume changes in single N1E-115 neuroblastoma cells measured with a fluorescent probe. Neuroscience. 1995;69:283–296. doi: 10.1016/0306-4522(95)00219-9. [DOI] [PubMed] [Google Scholar]
- Echevarria M, Verkman AS. Optical measurement of osmotic water transport in cultured cells: evaluation of the role of glucose transporters. J Gen Physiol. 1992;99:573–589. doi: 10.1085/jgp.99.4.573. [DOI] [PMC free article] [PubMed] [Google Scholar]
- Farinas J, Simenak V, Verkman AS. Cell volume measured in adherent cells by total internal reflection microfluorimetry: application to permeability in cells transfected with water channel homologs. Biophys J. 1995;68:1613–1620. doi: 10.1016/S0006-3495(95)80335-8. [DOI] [PMC free article] [PubMed] [Google Scholar]
- Farinas J, Verkman AS. Cell volume and plasma membrane osmotic water permeability in epithelial cell layers measured by interferometry. Biophys J. 1996;71:3511–3522. doi: 10.1016/S0006-3495(96)79546-2. [DOI] [PMC free article] [PubMed] [Google Scholar]
- Fischbarg J, Li J, Kuang K, Echevarria M, Iserovich P. Determination of volume and water permeability of plated cells from measurements of light scattering. Am J Physiol. 1993;265:C1412–C1423. doi: 10.1152/ajpcell.1993.265.5.C1412. [DOI] [PubMed] [Google Scholar]
- Folkesson H, Matthay M, Frigeri A, Verkman AS. High transepithelial water permeability in microperfused distal airways: evidence for channel-mediated water transport. J Clin Invest. 1996;97:664–671. doi: 10.1172/JCI118463. [DOI] [PMC free article] [PubMed] [Google Scholar]
- Frigeri A, Gropper M, Turck CW, Verkman AS. Immunolocalization of the mercurial-insensitive water channel and glycerol intrinsic protein in epithelial cell plasma membranes. Proc Natl Acad Sci USA. 1995;92:4328–4331. doi: 10.1073/pnas.92.10.4328. [DOI] [PMC free article] [PubMed] [Google Scholar]
- Goldstein DJ. A quantitative computer simulation of microscopic imaging. J Microsc (Oxf) 1991;162:241–253. [Google Scholar]
- Goodman, J.W. 1968. Introduction to Fourier Optics. McGraw-Hill Book Company, San Francisco, CA. pp 287.
- Hasegawa H, Lian S, Finkbeiner W, Verkman AS. Extrarenal tissue distribution of CHIP28 water channels by in situ hybridization and antibody staining. Am J Physiol. 1994;266:C893–C903. doi: 10.1152/ajpcell.1994.266.4.C893. [DOI] [PubMed] [Google Scholar]
- Hecht, E. 1987. Optics. Addison-Wesley Publishing Co., Menlo Park, CA. pp 676.
- Jo I, Harris HW., Jr Molecular mechanisms for the regulation of water transport in amphibian epithelia by antidiuretic hormone. Kidney Int. 1995;48:1088–1096. doi: 10.1038/ki.1995.392. [DOI] [PubMed] [Google Scholar]
- Kachadorian W, Sariban-Sohraby S, Spring K. Regulation of water permeability in toad urinary bladder at two barriers. Am J Physiol. 1985;253:F1210–F1215. doi: 10.1152/ajprenal.1985.248.2.F260. [DOI] [PubMed] [Google Scholar]
- Kao HP, Verkman AS. Tracking of single fluorescent particles in three dimensions: use of cylindrical optics to encode particle position. Biophys J. 1994;67:1291–1300. doi: 10.1016/S0006-3495(94)80601-0. [DOI] [PMC free article] [PubMed] [Google Scholar]
- Katsura T, Verbavatz J-M, Farinas J, Ma T, Ausiello DA, Verkman AS, Brown D. Constitutive and regulated membrane expression of aquaporin-CHIP and aquaporin-2 water channels in stably transfected LLC-PK1 cells. Proc Natl Acad Sci USA. 1995;92:7212–7216. doi: 10.1073/pnas.92.16.7212. [DOI] [PMC free article] [PubMed] [Google Scholar]
- Levine SD, Kachadorian WA. Barriers to water flow in vasopressin-treated toad urinary bladder. J Membr Biol. 1981;61:135–139. doi: 10.1007/BF02007640. [DOI] [PubMed] [Google Scholar]
- Ma T, Frigeri A, Tsai S-T, Verbavatz JM, Verkman AS. Localization and functional analysis of CHIP28k water channels in stably transfected CHO cells. J Biol Chem. 1993;268:22756–22764. [PubMed] [Google Scholar]
- Ma, T., B. Yang, A. Gillespie, E.J. Carlson, C.J. Epstein, and A.S. Verkman. 1997. Generation and phenotype of a transgenic knock-out mouse lacking the mercurial-insensitive water channel aquaporin-4. J. Clin. Invest. In press. [DOI] [PMC free article] [PubMed]
- Mangoo-Karim R, Grantham JJ. Transepithelial water permeability in an in vitro model of renal cysts. J Am Soc Nephrol. 1990;1:278–285. doi: 10.1681/ASN.V13278. [DOI] [PubMed] [Google Scholar]
- Matthay MA, Folkesson H, Verkman AS. Salt and water transport across alveolar and distal airway epithelia in the adult lung. Am J Physiol. 1996;270:L487–L503. doi: 10.1152/ajplung.1996.270.4.L487. [DOI] [PubMed] [Google Scholar]
- McManus M, Fischbarg J, Sun A, Hebert S, Strange K. Laser light-scattering system for studying cell volume regulation and membrane transport processes. Am J Physiol. 1993;265:C562–C570. doi: 10.1152/ajpcell.1993.265.2.C562. [DOI] [PubMed] [Google Scholar]
- Muallem S, Zhang R, Loessberg PA, Star RA. Simultaneous recording of cell volume changes and intracellular pH or Ca2+ concentration in single osteosarcoma cells UMR-106-01. J Biol Chem. 1992;267:17658–17664. [PubMed] [Google Scholar]
- Nielsen S, Agre P. The aquaporin family of water channels in kidney. Kidney Int. 1995;24:1057–1068. doi: 10.1038/ki.1995.389. [DOI] [PubMed] [Google Scholar]
- Novotny JA, Jakobsson E. Computational studies of ion-water flux coupling in the airway epithelium. I. construction of model. Am J Physiol. 1996;270:C1751–C1763. doi: 10.1152/ajpcell.1996.270.6.C1751. [DOI] [PubMed] [Google Scholar]
- Raina S, Preston GM, Guggino WB, Agre P. Molecular cloning and characterization of an aquaporin cDNA from salivary, lacrimal, and respiratory tissues. J Biol Chem. 1995;270:1908–1912. doi: 10.1074/jbc.270.4.1908. [DOI] [PubMed] [Google Scholar]
- Shi L, Wang Y, Verkman AS. Regulation of the formation and water permeability of endosomes from toad bladder granular cells. J Gen Physiol. 1990;96:789–805. doi: 10.1085/jgp.96.4.789. [DOI] [PMC free article] [PubMed] [Google Scholar]
- Timbs MM, Spring K. Hydraulic properties of MDCK cell epithelium. J Membr Biol. 1996;153:1–11. doi: 10.1007/s002329900104. [DOI] [PubMed] [Google Scholar]
- Tripathi S, Boulpaep EL. Mechanisms of water transport by epithelial cells. Quart J Exp Physiol. 1989;74:385–417. doi: 10.1113/expphysiol.1989.sp003288. [DOI] [PubMed] [Google Scholar]
- Valenti G, Frigeri A, Ronco P, D'Ehorre C, Svelto M. Expression and functional analysis of water channels in a stably AQP2-transfected human collecting duct cell line. J Biol Chem. 1996;271:24365–24370. doi: 10.1074/jbc.271.40.24365. [DOI] [PubMed] [Google Scholar]
- Van Driessche W, De Smet P, Raskin G. An automatic monitoring system for epithelial cell height. Pflugers Arch. 1993;425:164–171. doi: 10.1007/BF00374517. [DOI] [PubMed] [Google Scholar]
- Verkman AS, Chao AC, Hartmann T. Hormonal regulation of chloride conductance in cultured polar airway cells measured by a fluorescent indicator. Am J Physiol. 1992;262:C23–C31. doi: 10.1152/ajpcell.1992.262.1.C23. [DOI] [PubMed] [Google Scholar]
- Verkman AS, Van Hoek AN, Ma T, Frigeri A, Skach WR, Mitra A, Tamarappoo BK, Farinas J. Water transport across mammalian cell membranes. Am J Physiol. 1996;270:C12–C30. doi: 10.1152/ajpcell.1996.270.1.C12. [DOI] [PubMed] [Google Scholar]
- Yamaya M, Finkbeiner WE, Chun SY, Widdicombe JH. Differentiated structure and function of cultures from human tracheal epithelium. Am J Physiol. 1992;262:L713–L724. doi: 10.1152/ajplung.1992.262.6.L713. [DOI] [PubMed] [Google Scholar]
- Yang B, Brown D, Verkman AS. The mercurial insensitive water channel (AQP–4) forms orthogonal arrays in stably transfected Chinese hamster ovary cells. J Biol Chem. 1996;271:4577–4580. [PubMed] [Google Scholar]