

Abstract
The mechanism of Cl− ion permeation through single cystic fibrosis transmembrane conductance regulator (CFTR) channels was studied using the channel-blocking ion gluconate. High concentrations of intracellular gluconate ions cause a rapid, voltage-dependent block of CFTR Cl− channels by binding to a site ∼40% of the way through the transmembrane electric field. The affinity of gluconate block was influenced by both intracellular and extracellular Cl− concentration. Increasing extracellular Cl− concentration reduced intracellular gluconate affinity, suggesting that a repulsive interaction occurs between Cl− and gluconate ions within the channel pore, an effect that would require the pore to be capable of holding more than one ion simultaneously. This effect of extracellular Cl− is not shared by extracellular gluconate ions, suggesting that gluconate is unable to enter the pore from the outside. Increasing the intracellular Cl− concentration also reduced the affinity of intracellular gluconate block, consistent with competition between intracellular Cl− and gluconate ions for a common binding site in the pore. Based on this evidence that CFTR is a multi-ion pore, we have analyzed Cl− permeation and gluconate block using discrete-state models with multiple occupancy. Both two- and three-site models were able to reproduce all of the experimental data with similar accuracy, including the dependence of blocker affinity on external Cl− (but not gluconate) ions and the dependence of channel conductance on Cl− concentration. The three-site model was also able to predict block by internal and external thiocyanate (SCN−) ions and anomalous mole fraction behavior seen in Cl−/SCN− mixtures.
Keywords: voltage-dependent block, anomalous mole fraction, cystic fibrosis
INTRODUCTION
Cystic fibrosis is caused by mutations in a single gene, that encoding the cystic fibrosis transmembrane conductance regulator (CFTR)1 (Riordan et al., 1989). Although CFTR is a member of the ATP-binding cassette family of transport proteins (Higgins, 1995) and has been reported to act as a modulator of other membrane proteins (Schwiebert et al., 1995; Stutts et al., 1995), it is also itself a Cl− ion channel (Anderson et al., 1991; Kartner et al., 1991; Tabcharani et al., 1991; Bear et al., 1992). Indeed, several specific amino acids have been shown to contribute to the pore of the CFTR Cl− channel (Anderson et al., 1991; Sheppard et al., 1993; Tabcharani et al., 1993; Akabas et al., 1994; McDonough et al., 1994; Cheung and Akabas, 1996; Linsdell et al., 1997). In some cases, mutations within the pore that compromise channel activity may lead to cystic fibrosis (Welsh and Smith, 1993).
In spite of this information on the physical location of the CFTR Cl− channel pore, little is known about the permeation properties of even wild-type CFTR. The CFTR Cl− channel is permeable both to halides (permeation sequence PI > PBr > PCl > PF; Tabcharani et al., 1997) and to polyatomic anions (Linsdell et al., 1997), and also to some small uncharged molecules (Hasegawa et al., 1992). The dimensions of the largest permeant ions suggest a minimal pore diameter of ∼5.3 Å (Linsdell et al., 1997). The pore may be blocked by the arylaminobenzoate compounds diphenylamine-2-carboxylate and flufenamic acid from either side of the membrane (McCarty et al., 1993), by intracellular disulfonic stilbenes (Linsdell and Hanrahan, 1996b ) and, with a much lower affinity, by large intracellular anions such as glutamate and gluconate (Linsdell and Hanrahan, 1996a ). CFTR has previously been modeled only as a single-ion pore (Overholt et al., 1993, 1995), even though there is good evidence that it can hold more than one ion at a time (Tabcharani et al., 1993; Linsdell and Hanrahan, 1996a ). The ability to hold more than one ion simultaneously is thought to be an important part of the permeation mechanism in cation channels, since it allows channels to achieve selectivity by selective ion binding, but still permits rapid ionic fluxes due to electrostatic repulsion between ions bound in the pore (Almers and McCleskey, 1984; Hess and Tsien, 1984; Neyton and Miller, 1988; Yang et al., 1993). A similar multi-ion mechanism may be involved in Cl− permeation through CFTR (Tabcharani et al., 1993).
We have used the impermeant blocking ion gluco-nate to examine Cl− permeation through single CFTR channels. Channel block by intracellular gluconate is modulated by both intracellular and extracellular Cl− concentrations, consistent with competition between intracellular Cl− and gluconate for a common binding site, and with repulsion between extracellular Cl− and intracellular gluconate within the pore. Single channel current–voltage relationships in the absence and presence of intracellular gluconate were modeled using discrete-state models containing two or three sites that may be multiply occupied. Both models were able to replicate the effects of gluconate on Cl− permeation and also account for the dependence of single channel conductance on symmetrical Cl− concentration. The three-site model was also able to predict all of the effects of SCN− on CFTR permeation previously described for both wild-type and R347D CFTR (Tabcharani et al., 1993). (A preliminary report of this work has appeared, Linsdell and Hanrahan, 1996c.)
METHODS
Electrophysiological Recordings and Analysis
All experiments were carried out on Chinese hamster ovary cells stably expressing the human wild-type CFTR gene (Tabcharani et al., 1991, 1997; Chang et al., 1993). Single channel recordings were made using the excised, inside-out patch configuration of the patch clamp technique, as described elsewhere (Tabcharani et al., 1997). Since experiments were designed to test the conduction properties of CFTR under a range of different conditions, a large number of different bath (intracellular) and pipette (extracellular) solutions were used. Experiments with different solutions were carried out on different patches. Solutions contained various concentrations of NaCl and/or Na·gluconate (or N -methyl-d -glucamine [NMDG] gluconate in Fig. 2), as described in the individual figure legends. In addition, all solutions contained 2 mM MgCl2 and 10 mM TES (N -tris[hydroxymethyl]methyl-2-aminoethanesulfonate)buffer, and were adjusted to pH 7.4 by addition of NaOH or HCl. In many cases, the total osmolarity of the intracellular solution is expected to be far greater than that of the extracellular solution, although this did not seem to compromise the stability of excised patches. Current traces were filtered at 50 Hz using an eight-pole Bessel filter (Frequency Devices, Inc., Haverhill, MA), and digitized at 250 Hz.
Figure 2.

Different intracellular cations do not affect gluconate block. Mean single channel i/V relationships were constructed from three to seven patches with symmetrical 150 mM NaCl plus 150 mM Na · gluconate (•) or NMDG·gluconate (□) in the intracellular solution.
Outward currents (carried by Cl− influx) are ascribed a positive sign and shown as upward deflections of the current trace. Single channel i/V relationships have been corrected for measured liquid junction potentials of between −4 and +6 mV that exist between dissimilar pipette and bath solutions. Voltage-dependent channel block was analyzed using the Woodhull (1973) method and also using the two-site multiple occupancy model. For the Woodhull method, current remaining in the presence of blocker was expressed as a fraction of the control, unblocked current (i/i 0), and plotted as a function of membrane potential. The data were then fitted by the equation
 |
1 |
where [B] is the blocker concentration and Kd(V) is the voltage-dependent dissociation constant, the voltage dependence of which is given by
 |
2 |
where z′ is the apparent valency of the blocking ion, that is the real valency (−1) multiplied by δ, the fraction of the membrane electric field experienced by the blocking ion. In most cases, blocker affinity is expressed as K d(−100), which has previously been suggested to provide an accurate measure of affinity in this case (Linsdell and Hanrahan, 1996a ). The electrical distance of
the blocking site in the two-site model was also calculated by setting the rate constant for transitions of the blocker between sites to ∼0 s−1 and allowing the electrical distance of the inner blocking site to vary as a fitted parameter.
Experiments were carried out at room temperature (22 ± 1°C). Mean values are presented as mean ± SEM, except where stated otherwise. For graphical presentation of mean values, error bars represent ±SEM; where no error bars are shown, this is smaller than the size of the symbol.
Modeling of Energy Barrier Profiles
For a pore with two distinct ion binding sites, in the presence of both Cl− and gluconate, there exist nine distinct equilibrium states and 28 transition rates (see scheme SI), where Cl represents a site occupied by a Cl− ion, G represents a site occupied by a gluconate ion, and 0 represents a vacant site. With three binding sites, this increases to 27 distinct equilibrium states and 92 rate constants. The complexity of such models necessitates simplifying assumptions, such as fixing the locations of ion binding sites. Although Eyring Transition State Theory (Eyring et al., 1949) does not apply to condensed phases, it can be useful when thinking about ion permeation and is practical for fitting data because it reduces hundreds of free parameters to a manageable kinetic scheme. In the present study, we modeled a range of experimental data using the AJUSTE program described by Alvarez et al. (1992). This program uses energy barriers rather than kinetic constants as fitting parameters so that microscopic reversibility would not have to be imposed as a constraint. To reduce the dependence on Eyring assumptions, more general rate constants were then calculated for all the allowable transitions between occupancy states in two- and three-site models with the membrane potential set at 0 mV. Rate constants for transitions between any two states i and j in a two- (9 occupancy states) and three- (28 occupancy states) site model were calculated as
 |
4 |
Scheme I.

where E p and E w are the energies at the starting site, w, and the peak being traversed, p, and Δw,p is the electrical distance between this site and peak. This equation gave the rate constant when the pore contains only one ion; for a multi-occupied pore, the rate constant was multiplied by a factor due to ionic repulsion within the pore, given by
 |
5 |
where A is an ion–ion repulsion parameter obtained from the fits; Δp,w2 is the electrical distance from the peak being traversed, p, to the location of a second ion, w2, and Δw,w2 is the electrical distance between the starting well, w, and w2. For a three-site pore containing three ions, the transition rate constant will be multiplied by two expressions of the kind given in Eq. 5, one for each bound ion that interacts with the ion undergoing a transition.
Current–voltage relationships obtained under various conditions of intra- and extracellular Cl− and gluconate (see Figs. 1, 3, 5, and 8) were modeled using two or three sites. Adjustable parameters in the models were the energies at the sites and peaks between the sites, their respective positions in the membrane electric field, and an interaction parameter used to model ion– ion repulsion within the pore (A in Eq. 5), which was assumed to decrement with 1/distance (Alvarez et al., 1992). Physical interpretation of such models is limited by the simplifying assumptions that the barriers and wells are located at the same positions for both Cl− and gluconate and are unaffected when multiple sites are occupied (see discussion). Internal and external surface charges were both fixed at zero in this model; it has previously been suggested that surface charge has little effect on Cl− permeation in CFTR (Linsdell et al., 1997), and allowing surface charge to vary had a negligible effect on the goodness of fit of the model. For the modeling, all ion concentrations were converted to activities, calculated using the modified Debye-Hückel equation (Bates, 1973). However, for clarity, all values quoted in the text and in figures (except Fig. 8 C) are absolute concentrations. Other details of the modeling procedure are as described elsewhere (Alvarez et al., 1992; Ravindran et al., 1992).
Figure 1.

Voltage and concentration dependence of intracellular gluconate block of single CFTR Cl− channels. (A) Single CFTR channel currents recorded from inside-out membrane patches at a potential of −90 mV, using symmetrical 150 mM NaCl plus 0, 75, or 300 mM intracellular Na · gluconate. The line on the left indicates the closed state of the channel. Intracellular gluconate causes a rapid block of the channel, leading to a reduction in mean channel amplitude (Linsdell and Hanrahan, 1996a ). (B) Mean single channel i/V relationships constructed using symmetrical 150 mM NaCl plus 0 (○), 25 (▾), 75 (▵), 150 (•), and 300 (□) mM intracellular Na·gluconate. Voltage-dependent block by gluconate leads to a reduction of inward, but not outward, current. Each point represents the mean of data from 3–12 patches. (C) Fraction of control current remaining (i/i 0) in the presence of different concentrations of gluconate at −100 mV. Each point represents the mean of data from four to six patches. The points have been fitted by Eq. 6, giving a K d for gluconate of 176.9 mM.
Figure 3.

Dependence of gluconate block on extracellular anions. Mean single channel i/V relationships were constructed from 3–12 patches with 150 mM NaCl (○) or 150 mM NaCl plus 150 mM Na · gluconate (•) in the intracellular solution, and 150 mM NaCl (A), 40 mM NaCl (B), or 150 mM Na·gluco-nate (C) in the extracellular solution.
Figure 5.

Dependence of gluconate block on intracellular Cl− concentration. Mean single channel i/V relationships were constructed from 3–12 patches with 150 mM NaCl (○) or 150 mM NaCl plus 150 mM Na·gluconate (•) in the intracellular solution, under conditions of high (150 mM; top) or low (40 mM; bottom) extracellular NaCl concentrations, and with intracellular NaCl concentrations of 150 (A and D), 300 (B), and 40 (C) mM.
Figure 8.

Dependence of CFTR conductance on symmetrical Cl− concentration, fit by two- and three-site models. (A and B) Mean single channel i/V curves constructed using data from 3–12 patches with symmetrical NaCl concentrations of 15 (♦), 30 (▵), 40 (▾), 45 (□), 75 (▪), 150 (○), and 400 (•) mM. In A, lines represent the predictions of the two-site model while in B, lines represent the predictions of the three-site model. (C) Dependence of conductance (γ) on symmetrical Cl− activity. Each point represents the mean of data from 3–11 patches. The lines represent model predictions.
RESULTS
Properties of the Block of CFTR by Intracellular Gluconate
Previously, we showed that high concentrations of the impermeant anion gluconate caused a rapid, voltage-dependent block of CFTR Cl− channels when applied to the intracellular, but not extracellular, face of the membrane (Linsdell and Hanrahan, 1996a ). A more detailed examination of the concentration dependence of gluconate block is presented in Fig. 1. Addition of 25–300 mM Na· gluconate to the intracellular solution caused a reduction of single channel amplitudes at negative, but not at positive, potentials (Fig. 1 B). The concentration dependence of block at −100 mV is shown in Fig. 1 C. The fraction of the control current remaining in the presence of gluconate (i/i 0) is shown as a function of gluconate concentration. The data have been fit by the equation:
 |
6 |
where K d is the dissociation constant and [Gluc] is the intracellular gluconate concentration. The fit of the data shown in Fig. 1 C suggests that a single gluconate ion blocks the channel with a K d of 176.9 mM at −100 mV.
Although all of the effects of intracellular Na·gluconate shown in Fig. 1 and described previously (Linsdell and Hanrahan, 1996a ) can be explained in terms of voltage-dependent block by gluconate ions, it remains a formal possibility that the high concentrations of Na+ that are added along with the gluconate also have some effect on Cl− permeation through CFTR channels. This is particularly troubling since several Cl− channels have been shown to have a considerable Na+ permeability (Franciolini and Petris, 1992). However, addition of 150 mM NMDG·gluconate to the intracellular solution had identical blocking effects on single CFTR channel currents as 150 mM Na·gluconate (Fig. 2), indicating that these effects are independent of the cation added and wholly due to the addition of gluconate.
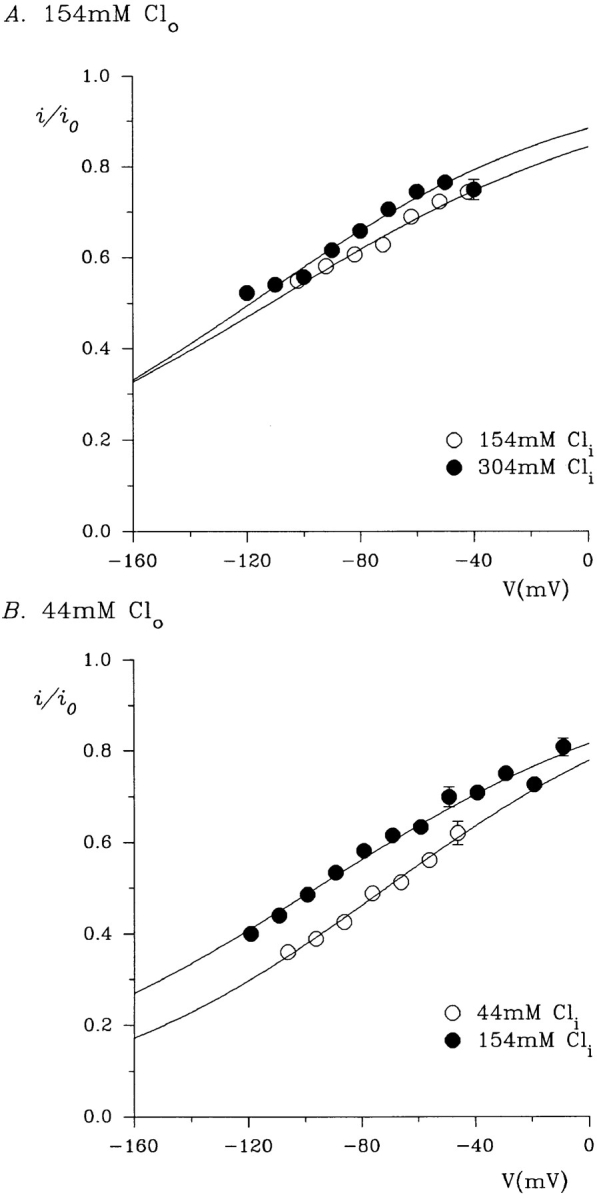
An interesting property previously noted of gluconate block of single CFTR channels was its apparent dependence on external Cl− concentration (Linsdell and Hanrahan, 1996a ). We have reexamined this effect using a gluconate concentration of 150 mM, close to the K d at −100 mV described in Fig. 1 C. Reducing the external Cl− concentration from 154 to 44 mM led to a significant increase in the affinity of gluconate block without altering its voltage dependence (Figs. 3 and 4, and Table I), consistent with the hypothesis that extracellular Cl− ions can enter the pore of the CFTR Cl− channel and repel bound gluconate ions from their blocking site (Linsdell and Hanrahan, 1996a ). Replacing all of the extracellular Cl− with 150 mM gluconate led to a further increase in affinity (Figs. 3 C and 4, and Table I). This suggests that extracellular gluconate ions cannot substitute for Cl− in repelling intracellular gluconate ions from the pore, a situation different from that for tetraethylammonium (TEA) blockade of cloned K+ channels, where external TEA ions, although impermeant, can repel internal TEA ions from the channel pore (Newland et al., 1992). Ionic repulsion occurring within an ion channel pore, such as that seen between intracellular gluconate and extracellular Cl−, is strong evidence for a multi-ion pore capable of holding at least two ions simultaneously (Hille, 1992).
Figure 4.

Effect of extracellular anions on the affinity of gluco-nate block. Data from Fig. 3 were analyzed using the Woodhull (1973) model of voltage-dependent block, as described in methods. Each point represents the mean of data from three to six patches with 150 mM NaCl (○), 40 mM NaCl (•), and 150 mM Na·gluconate (□) in the extracellular solution. The data have been fitted by Eq. 1 using the mean parameters given in Table I. A similar value for electrical distance of the gluconate block was obtained by setting the gluconate flux to ∼0 and allowing the electrical distance to be an adjustable parameter during model fits (see results).
Table I.
Affinity and Voltage Dependence of Block by 150 mM Intracellular Gluconate under Different Ionic Conditions
| Intracellular [Cl−]/mM | z′ | K d(−100)/mM | ||||
|---|---|---|---|---|---|---|
| Effect of extracellular [Cl−] | ||||||
| External anion | ||||||
| 154 mM Cl− (n = 5) | 154 | −0.38 ± 0.02 | 179 ± 4 | |||
| 44 mM Cl− (n = 5) | 154 | −0.39 ± 0.02 | 140 ± 3* | |||
| 150 mM gluconate (n = 5) | 154 | −0.41 ± 0.04 | 113 ± 9‡ | |||
| Effect of intracellular [Cl−] | ||||||
| Extracellular [Cl−]/mM | ||||||
| 154 (n = 5) | 154 | −0.38 ± 0.02 | 179 ± 4 | |||
| 154 (n = 4) | 304 | −0.43 ± 0.03 | 206 ± 2§ | |||
| 44 (n = 5) | 44 | −0.45 ± 0.03 | 90 ± 2 | |||
| 44 (n = 5) | 154 | −0.39 ± 0.02 | 140 ± 3‖ |
z′ and apparent affinity at −100 mM (K d(−100)) were calculated for individual patches as described in Figs. 4 and 6. Significant differences, as determined using the two-tailed t test, are indicated as follows:
significantly different from 154 mM Cl− 0/154 mM Cl− i (P < 0.001);
significantly different from 44 mM Cl− 0/154 mM Cl− i (P < 0.02);
significantly different from 154 mM Cli/154 mM Cli (P < 0.002);
significantly different from 44 mM Clo/44 mM Cli (P < 0.01).
We have also studied the effects of intracellular Cl− concentration on gluconate block, both at high (154 mM) and low (44 mM) extracellular Cl− concentrations (Fig. 5). In both cases, increasing the intracellular Cl− concentration significantly decreased the affinity of gluconate block (Fig. 6, Table I). This effect is consistent with intracellular Cl− and gluconate ions competing for a common binding site in the pore of the channel; when intracellular Cl− concentration is increased, intracellular gluconate ions will be less likely to enter the pore and reach their blocking site, and the apparent affinity of the block will therefore be decreased.
Figure 6.
Effect of intracellular Cl− concentration on the affinity of gluconate block, under conditions of high (150 mM; A) and low (44 mM; B) extracellular NaCl concentration. Data from Fig. 5 were analyzed using the Woodhull (1973) model of voltage-dependent block, as described in methods. Each point represents the mean of data from three to six patches. (A) Intracellular NaCl concentrations of 150 (○) and 300 (•) mM. (B) Intracellular NaCl concentrations of 40 (○) and 150 (•) mM. The data have been fitted by Eq. 1 using the mean parameters given in Table I.
Three-Barrier, Two-Site, Double-Occupancy Model for the CFTR Cl− Channel Pore
Since the pore of the CFTR Cl− channel appears to be able to hold more than one ion at a time (Tabcharani et al., 1993; Linsdell and Hanrahan, 1996a ; see above), we used our results to develop a two-site model.
Since intracellular gluconate appears to interact with a site ∼40% of the way through the membrane electric field from the inside (Table I), and gluconate ions bound at this site may interact with Cl− ions entering the pore from the outside (see above), we constrained the inner energy well to be at 40% of the electrical distance through the channel. This was quite arbitrary since the electrical position of ion binding sites in a multi-ion pore may depend on pore occupancy, rather than being fixed as assumed by our model. The Woodhull model used to estimate the electrical distance of gluconate binding does not take into account the kind of ion–ion interactions that we imagine are occurring within the pore. Nevertheless, a similar distance of 0.43 was obtained from the two-site multiple-occupancy model by setting the central energy barrier for the blocker gluconate to a very high value and allowing the electrical distance of the gluconate blocking site to vary. The site near the extracellular end of the channel and all energy peaks between the sites were allowed to vary during the modeling procedure.
The parameters of the model, as described in methods, were optimized by simultaneously fitting i/V relationships obtained under 20 different sets of ionic conditions (see Figs. 1, 3, 5, 8). The best fit rate constants are presented in Table II. This model was able to accurately describe the i/V relationships obtained experimentally under all conditions studied in this paper (Fig. 7), as well as the dependence of channel conductance on symmetrical Cl− activity (Fig. 8, A and C).
Table II.
Rate Constants for Allowable Transitions in the Two-Site Model for CFTR
| Transition | Rate constant | Transition | Rate constant | |||
|---|---|---|---|---|---|---|
| s−1 | s−1 | |||||
| OO→CO | 6.34 × 10⁹ | OC→CC | 5.00 × 10⁹ | |||
| CO→OO | 3.11 × 10⁶ | CC→OC | 6.22 × 10⁶ | |||
| OO→OC | 5.30 × 10⁹ | OC→GC | 2.92 × 10⁵ | |||
| OC→OO | 3.88 × 10⁶ | GC→OC | 7.74 × 10³ | |||
| CO→OC | 1.50 × 10⁷ | GO→GC | 4.19 × 10⁹ | |||
| OC→CO | 2.23 × 10⁷ | GC→GO | 7.76 × 10⁶ | |||
| OO→GO | 3.70 × 10⁵ | GG→GO | 8.8 | |||
| GO→OO | 3.87 × 10³ | GO→GG | 306 | |||
| OO→OG | 388 | OG→GG | 2.92 × 10⁵ | |||
| OG→OO | 4.4 | GG→OG | 7.74 × 10³ | |||
| OG→GO | 88.3 | OG→CG | 5.01 × 10⁹ | |||
| GO→OG | 80.7 | CG→OG | 6.22 × 10⁶ | |||
| CO→CC | 4.19 × 10⁹ | CO→CG | 306 | |||
| CC→CO | 7.76 × 10⁶ | CG→CO | 8.8 |
Rate constants were calculated from the free energy profiles computed using the AJUSTE program (Alvarez et al., 1992; see methods). Electrical distance of the first site (δ) was fixed at 0.4 from the cytoplasmic side. The position of the second site and all energy levels were allowed to vary during the fitting procedure. C, chloride ion; G, gluconate ion; O, empty site. The fitted ion–ion repulsion parameter was 0.28 ± 0.01RT. The weighted sum of squared differences between the experimental data and values predicted by the model (SUMSQ) was 0.2804 pA2 over the 220 individual i/V points used.
Figure 7.

Comparison of experimental data with theoretical values predicted by the two-site model. Each of the i/V relationships A–F are reproductions of those given in Figs. 1, 3, and 5 as follows: A, Fig. 1 B ; B, Figs. 3 A and 5 A; C, Figs. 3 B and 5 D ; D, Fig. 3 C; E, Fig. 5 B; F, Fig. 5 C. In each case, symbols represent the experimental data, and the lines are the theoretical curves calculated from the two-site model.
The rationale for modeling CFTR as a multi-ion pore was based mainly on the dependence of the affinity of gluconate block on extracellular Cl− concentration (Figs. 3 and 4, and Table I). This key finding was also reproduced by the two-site model. As shown in Fig. 9, this model predicts that the K d for 150 mM intracellular gluconate increases linearly as a function of extracellular Cl− concentration, although the predicted relationship is not as steep as the observed dependence on extracellular Cl−. The two-site model also predicts that intracellular gluconate block is independent of extracellular gluconate concentration (Fig. 9), indicating that in this model extracellular gluconate is effectively excluded from the pore.
Figure 9.

Both two- and three-site models predict a dependence of intracellular gluconate blocking affinity on extracellular Cl− concentration. Symbols represent mean experimental data, taken from Table I, for the K d(−100) for block by intracellular gluconate with 150 mM NaCl plus 150 mM Na · gluconate in the intracellular solution, and either 40 or 150 mM NaCl (○) or 150 mM Na · gluconate (•) in the extracellular solution. Lines show the theoretical dependence of K d(−100) measured under these conditions as a function of either extracellular Cl− concentration (solid lines) or extracellular gluconate concentration (dashed lines), calculated from the two- and three-site models.
Four-Barrier, Three-Site, Multi-Occupancy Model for the CFTR Cl− Channel Pore
Although our experiments with gluconate offer evidence for only two ion binding sites within the pore of CFTR, there is other strong evidence for an ion binding site located <40% of the distance across the transmembrane electric field. Intracellular thiocyanate (SCN−) ions block Cl− permeation through CFTR by binding to a site ∼20% of the way through the electric field (Tabcharani et al., 1993; see below). SCN− block is not seen in a pore mutant form of CFTR, R347D (Tabcharani et al., 1993), suggesting that this amino acid may contribute to the SCN− binding site. Since R347D also has a Cl− conductance of only ∼50% of wild-type CFTR, it was suggested that R347 also contributes to a Cl− ion binding site in the pore (Tabcharani et al., 1993).
To better understand the effects of SCN− on CFTR, we were interested to see if our data could be fit by a three-site, multi-occupancy model with sites located 20 and 40% across the membrane electric field (corresponding to SCN− and gluconate binding sites), and a third well located more extracellularly (to explain repulsion of bound gluconate ions by extracellular Cl−). Of course, the choice of these electrical distances are subject to the same caveats described above for the two-site model. Other parameters of the model, as described in methods, were optimized by fitting the same data as used above to construct the two-site model. The 92 rate constants for allowable transitions among 28 occupancy states with Cl− and gluconate are presented in Table III.
Table III.
Rate Constants for Allowable Transitions in the Three-Site Model for CFTR
| Transition | Rate constant | Transition | Rate constant | Transition | Rate constant | |||||
|---|---|---|---|---|---|---|---|---|---|---|
| OCG→GCG | 4.35 × 10⁵ | GCO→OCO | 2.39 × 10⁶ | GOG→OOG | 2.10 × 10⁶ | |||||
| GCG→OCG | 6.78 × 10⁶ | OCG→COG | 1.58 × 10⁸ | OOG→GOG | 7.64 × 10⁵ | |||||
| GCG→GCO | 1.69 × 10³ | COG→OCG | 1.21 × 10⁸ | OGG→OGO | 1.26 × 10³ | |||||
| GCO→GCG | 496 | GCO→GOC | 2.90 × 10⁷ | OGO→OGG | 213 | |||||
| CCO→CCC | 6.72 × 10⁹ | GOC→GCO | 1.65 × 10⁷ | OGO→GGO | 5.12 × 10⁵ | |||||
| CCC→CCO | 1.12 × 10⁷ | COO→OCO | 2.69 × 10⁸ | GGO→OGO | 2.39 × 10⁶ | |||||
| CCC→OCC | 3.21 × 10⁷ | OCO→COO | 1.36 × 10⁸ | OGO→OGC | 8.62 × 10⁹ | |||||
| OCC→CCC | 1.31 × 10¹⁰ | OCO→OOC | 5.79 × 10⁶ | OGC→OGO | 8.37 × 10⁶ | |||||
| CCG→CCO | 1.69 × 10³ | OOC→OCO | 2.47 × 10⁷ | GOG→GOO | 815 | |||||
| CCO→CCG | 496 | COO→COG | 800 | GOO→GOG | 801 | |||||
| CCO→COC | 2.90 × 10⁷ | COG→COO | 813 | CGG→CGO | 1.69 × 10³ | |||||
| COC→CCO | 1.65 × 10⁷ | COO→OOO | 1.03 × 10³ | CGO→CGG | 6.71 × 10⁹ | |||||
| COC→OCC | 1.21 × 10⁸ | OOO→COO | 2.71 × 10¹⁰ | CGC→CGO | 1.12 × 10⁷ | |||||
| OCC→COC | 1.58 × 10⁸ | OOC→OOO | 4.04 × 10⁶ | CGO→CGC | 6.71 × 10⁹ | |||||
| OCC→GCC | 4.35 × 10⁵ | OOO→OOC | 1.39 × 10¹⁰ | CGC→OGC | 3.22 × 10⁷ | |||||
| GCC→OCC | 6.78 × 10⁶ | OOC→GOC | 7.63 × 10⁵ | OGC→CGC | 1.31 × 10¹⁰ | |||||
| CCG→OCG | 3.21 × 10⁷ | GOC→OOC | 2.18 × 10⁶ | GGC→OGC | 6.78 × 10⁶ | |||||
| OCG→CCG | 1.31 × 10¹⁰ | COG→OOG | 7.64 × 10¹⁰ | OGC→GGC | 4.35 × 10⁵ | |||||
| OCO→CCO | 1.55 × 10¹⁰ | OOG→COG | 2.30 × 10¹⁰ | OGG→CGG | 1.31 × 10¹⁰ | |||||
| CCO→OCO | 1.13 × 10⁷ | OOO→OOG | 1.03 × 10³ | CGG→OGG | 3.22 × 10⁷ | |||||
| COC→COO | 5.41 × 10⁶ | OOG→OOO | 609 | OGG→GOG | 3.22 × 10³ | |||||
| COO→COC | 1.08 × 10¹⁰ | OOO→GOO | 8.98 × 10⁵ | GOG→OGG | 1.15 × 10⁶ | |||||
| OOC→COC | 1.16 × 10⁸ | GOO→OOO | 7.70 × 10⁵ | GGO→GOG | 13.1 | |||||
| COC→OOC | 1.03 × 10⁷ | GOO→GOC | 1.08 × 10¹⁰ | GOG→GGO | 5.61 × 10³ | |||||
| OCO→OCC | 8.62 × 10⁹ | GOC→GOO | 5.41 × 10⁶ | GGC→GGO | 1.12 × 10⁷ | |||||
| OCC→OCO | 8.37 × 10⁶ | COG→CGO | 5.61 × 10³ | GGO→GGC | 6.71 × 10⁹ | |||||
| GCO→GCC | 6.72 × 10⁹ | CGO→COG | 65.4 | OGG→GGG | 4.35 × 10⁵ | |||||
| GCC→GCO | 1.12 × 10⁷ | GOC→OGC | 1.15 × 10⁶ | GGG→OGG | 6.75 × 10⁶ | |||||
| OCG→OCO | 1.26 × 10³ | OGC→GOC | 3.23 × 10³ | GGO→GGG | 496 | |||||
| OCO→OCG | 635 | OGO→CGO | 1.55 × 10¹⁰ | GGG→GGO | 1.69 × 10³ | |||||
| OCO→GCO | 5.12 × 10⁵ | CGO→OGO | 1.13 × 10⁷ |
Rate constants were calculated as for the two-site model in Table II, except the electrical distance (δ) of the first two sites were fixed at 0.2 and 0.4, respectively, from the cytoplasmic side. All rate constants have the units second−1. C, chloride ion; G, gluconate ion; O, empty site. The electrical distance of the third site (final δ = 0.69), all energies, and the ion–ion repulsion parameter (0.68 ± 0.01RT) were allowed to vary during the fitting procedure. The SUMSQ value (see Table II) was 0.2867 pA2, indicating that this model fit the data marginally less well than the two-site model shown in Table II.
The three-site model was able to describe the i/V relationships obtained with different mixtures of Cl− and gluconate (Fig. 10) and the dependence of channel conductance on symmetrical Cl− activity (Fig. 8, B and C) with a similar accuracy to that achieved by the two-site model (see above). The three-site model also predicted that the K d for gluconate block should increase linearly as a function of extracellular Cl−, but not gluconate concentration (Fig. 9); this prediction appears to describe the experimental data somewhat more closely than that of the two-site model.
Figure 10.

Comparison of experimental data with theoretical values predicted by the three-site model. Symbols represent the same experimental data shown in Fig. 7, and lines are the theoretical curves calculated from the three-site model.
Modeling SCN− Block and Permeation
Since the barrier models developed above were both able to describe the multi-ion pore effects seen in gluconate block of CFTR, we wanted to test whether they could also reproduce the earlier evidence that CFTR is a multi-ion pore, namely the anomalous mole fraction dependence of channel conductance seen in symmetrical Cl−/SCN− mixtures (Tabcharani et al., 1993). To model the effects of SCN−, the parameters obtained for Cl− (Tables II and III) were kept and new ones describing SCN− movement in the pore were constructed by simultaneously fitting three sets of results (see Tabcharani et al., 1993, for details): block by low concentrations of internal SCN− (Figs. 11 A and 12 A), block by low concentrations of external SCN− (Figs. 11 B and 12 B), and conductance in different symmetrical Cl−/ SCN− mixtures (Figs. 11, C and D, and 12, C and D). The two-site model was able to predict the block by internal (Fig. 11 A) and external SCN− (Fig. 11 B) with some success, but could not simultaneously describe the anomalous mole fraction dependence of conductance (Fig. 11, C and D). In contrast, the three-site model was able to reproduce all of the experimental results presented, including the anomalous mole fraction behavior (Fig. 12).
Figure 11.

Comparison of experimental data with theoretical values predicted by the two-site model. (A–C) Mean single channel i/V relationships constructed using symmetrical 150 mM NaCl (○), and when intracellular (A), extracellular (B), or symmetrical (C) Cl− has been partly replaced, in an equimolar fashion, by 0.5 (▵), 1 (•), 5 (□), 10 (▪), or 150 (▾) mM SCN−. (D) Dependence of mean channel conductance on SCN− mole fraction. See Tabcharani et al. (1993) and Linsdell et al. (1997) for experimental details. In each case, symbols represent the experimental data, and the lines are the predictions of the two-site model.
Figure 12.

Comparison of experimental data with theoretical values predicted by the three-site model for wild-type CFTR. Symbols represent the same experimental data as shown in Fig. 11, and lines are the predictions of the three-site model.
Three-Site, Multi-Occupancy Model for R347D CFTR
Block of CFTR by internal SCN−, and the anomalous mole fraction dependence of conductance seen in Cl−/ SCN− mixtures are lost in the low conductance pore mutant R347D CFTR (Tabcharani et al., 1993). We wanted to see if the three-site model developed above for SCN− could be modified to describe the permeation properties of R347D CFTR. The results of the fitting procedure are presented as free energy profiles to facilitate comparison between mutant and wild-type CFTR (see methods for assumptions). As shown in Fig. 13, specific changes in the height of the second barrier and both adjacent wells near the cytoplasmic end of both the Cl− and SCN− energy profiles were able to reproduce the reduction in Cl− conductance (Fig. 13 C), loss of blockade by 10 mM internal SCN− (Fig. 13 C), and the loss of anomalous mole fraction behavior (Fig. 13 D) seen in R347D CFTR.
Figure 13.

A three-site energy profile for R347D CFTR. (A and B) Best fit energy profiles for Cl− (A) and SCN− (B) in wild-type (solid lines) and R347D CFTR (dashed lines). (C) The three-site model of Fig. 13, A and B predicts the reduced conductance of R347D in symmetrical 150 mM NaCl (○) and the lack of block by 10 mM intracellular SCN− (•). (D) Loss of anomalous mole fraction dependence of conductance in R347D. See Tabcharani et al. (1993) for experimental details. In each case, symbols represent the experimental data and lines are the predictions of the three-site model.
DISCUSSION
The effects of the impermeant blocking ion gluconate reveal several features of the mechanism of ion permeation through the CFTR Cl− channel. The block is only seen when gluconate is added to the intracellular solution (Linsdell and Hanrahan, 1996a ), indicating that the blocking site is accessible only from the cytoplasmic side of the membrane. The voltage and Cl− dependence of the block indicate that the blocking site is within the channel pore (Linsdell and Hanrahan, 1996a ; see above). Furthermore, the fact that gluconate block is partly relieved by increasing the concentration of Cl− ions on the opposite side of the membrane (Figs. 3 and 4, and Table I) suggests the presence of repulsive ion–ion interactions within the pore. In the present model, this is assumed to be due to the presence of multiple ion binding sites within the pore of CFTR.
All of the evidence that CFTR is a multi-ion pore (the dependence of intracellular gluconate block on extracellular Cl− concentration described above, and the anomalous mole fraction behavior seen in mixtures of the permeant ions Cl− and SCN−; Tabcharani et al., 1993) can be explained by assuming there are two anion binding sites within the pore. Indeed, a two-site model fits all of our data for Cl− and gluconate very well (Figs. 7 and 8). In the two-state model, gluconate blocks because it enters the pore readily from the cytoplasmic side (3.7 × 10⁵ s−1), but does not jump to the other site significantly (80.7 s−1), and leaves the blocking site slowly (3.87 × 10³ s−1). The i/V data are fit equally well by a three-site model (Figs. 8 and 10) based on the assumption that intracellular SCN− and gluco-nate may block the channel by binding to different sites (see above). In the three-site model, the block arises because the rate constant for the outward movement of gluconate ions from the central site is 440,000-fold slower than for Cl−. Both models were also able to reproduce the classical multi-ion pore behavior exhibited by gluconate block; namely, the reduction in blocker affinity caused by increasing the permeant ion concentration on the opposite side of the membrane (Fig. 9). Our present results do not indicate how many Cl− ions may reside in the CFTR channel pore simultaneously; such estimates would require other experimental techniques (Hodgkin and Keynes, 1955; Stampe and Begenisich, 1996).
One interesting difference between model predictions is the reduction in conductance at high Cl− concentrations predicted by the two- but not the three-site model (Fig. 8 C). A conductance maximum such as that shown in Fig. 8 C is expected from multi-ion pore theory; in fact, the three-site model also predicts a conductance maximum (12 pS) at a symmetrical Cl− activity of ∼2,000 mM (not shown). However, to date, such a phenomenon has only been observed experimentally in K+ channels (Villarroel et al., 1988; Lu and MacKinnon, 1994) and in gramicidin channels (Hladky and Haydon, 1972; Finkelstein and Andersen, 1981). The conductance behavior of CFTR in very high symmetrical Cl− concentrations has not previously been examined, although higher concentrations than those used in Fig. 8 are possible using lipid bilayer recording techniques.
The three-site model was also able to reproduce the effects of SCN− on permeation in CFTR (Fig. 12), although the two-site model could not simultaneously predict SCN− block and anomalous mole fraction behavior (Fig. 11). It must be noted that this in itself does not prove the existence of a third ion binding site in the pore; both these models were developed to model gluconate block and subsequently modified to model SCN− permeation, and it is possible that a different two-site model developed from scratch could reproduce all of the effects of SCN− described above. This could be a valid approach if, for example, the energy peaks and wells experienced by Cl−, gluconate, and SCN− ions were not located at the same electrical distances through the pore, as is assumed in all our models. As noted above, the electrical distance of one site probably depends on the presence of other ions within the pore. Indeed, the notion of a finite number of discrete sites may be overly specific; anions could partition into the pore during permeation without interacting preferentially at particular sites. The sites identified using voltage-dependent blockers would then simply be points at which those blocking ions become stuck due to their large size or, in the case of SCN−, due to a hydrophobic interaction that may not constitute a site for Cl−. Nevertheless, the ability of the three-site model to reproduce all of our present results on Cl− permeation, gluconate block, SCN− block, and SCN− permeation suggest it may be useful in future investigations of permeation in the CFTR Cl− channel. The fact that specific modifications of the model can also reproduce the effects of the pore mutation R347D (Fig. 13) also suggest it may serve as a useful starting point in structure– function studies. We note, however, that the simplifying assumptions used in developing such models limit their usefulness to heuristic explanations rather than true physical models of ion movements in the pore. A more self-consistent physical representation would rely on accurate modeling of the electric field; e.g., using Poisson-Nernst-Planck theory (Eisenberg, 1996).
Although all of our experimental data can be explained by a model in which there are two Cl− binding sites within the CFTR channel pore, the three-site model is also of particular interest since three different amino acid residues in the sixth membrane spanning region (TM6) of CFTR have been suggested, on the basis of mutagenesis experiments, to contribute to Cl− binding sites in the pore. As mentioned above, R347 has been suggested to contribute both to a Cl− binding site and to the site at which intracellular SCN− blocks Cl− permeation (Tabcharani et al., 1993). Mutation of another positively charged amino acid, K335, which is located close to the extracellular end of TM6, alters halide selectivity (Anderson et al., 1991) and channel conductance (Tabcharani et al., 1993). Between these two positively charged amino acids lies S341, which has been shown to interact with the channel blocker diphe-nylamine-2-carboxylate (McDonough et al., 1994). The mutation S341A also severely reduces channel conductance, suggesting that this amino acid also interacts with permeating Cl− ions (McDonough et al., 1994). Interestingly, the voltage dependence of diphenylamine-2-carboxylate block suggests that it experiences ∼40% of the transmembrane electric field (McCarty et al., 1993; McDonough et al., 1994), similar to that felt by intracellular gluconate (Table I). R347, K335, and S341 have each been shown to be accessible to hydrophilic molecules after mutation to cysteine residues (Cheung and Akabas, 1996), consistent with their lining the channel pore.
As a working hypothesis, it is tempting to correlate these three putative Cl− binding sites (R347, S341, and K335) with the sites in our model; however, this is highly speculative. If mutation of these amino acids disrupts ion binding sites within the pore, then the barrier models presented here may provide a useful framework for interpreting the effects of the mutations and guide further structure/function analysis of the CFTR pore.
Acknowledgments
We thank Dr. Osvaldo Alvarez (University of Chile, Santiago, Chile) for providing the AJUSTE computer program and for patiently instructing us in its use, Drs. Xiu-Bao Chang and John R. Riordan for providing Chinese hamster ovary cells expressing wild-type CFTR, and Jie Liao for maintaining the cell cultures.
This work was supported by the Canadian Cystic Fibrosis Foundation (CCFF), Medical Research Council (MRC, Canada), and National Institute of Diabetes and Digestive and Kidney Diseases. P. Linsdell is a CCFF postdoctoral fellow. J.W. Hanrahan is an MRC (Canada) Scientist.
Footnotes
Abbreviations used in this paper: CFTR, cystic fibrosis transmembrane conductance regulator; NMDG, N -methyl-d-glucamine.
REFERENCES
- Akabas MH, Kaufmann C, Cook TA, Archdeacon P. Amino acid residues lining the chloride channel of the cystic fibrosis transmembrane conductance regulator. J Biol Chem. 1994;269:14865–14868. [PubMed] [Google Scholar]
- Almers W, McCleskey EW. Non-selective conductance in calcium channels of frog muscle: calcium selectivity in a single-file pore. J Physiol (Cambr) 1984;353:585–608. doi: 10.1113/jphysiol.1984.sp015352. [DOI] [PMC free article] [PubMed] [Google Scholar]
- Alvarez O, Villarroel A, Eisenman G. Calculation of ion currents from energy profiles and energy profiles from ion currents in multibarrier, multisite, multioccupancy channel model. Methods Enzymol. 1992;207:816–854. doi: 10.1016/0076-6879(92)07058-v. [DOI] [PubMed] [Google Scholar]
- Anderson MP, Gregory RJ, Thompson S, Souza DW, Paul S, Mulligan RC, Smith AE, Welsh MJ. Demonstration that CFTR is a chloride channel by alteration of its anion selectivity. Science (Wash DC) 1991;253:202–205. doi: 10.1126/science.1712984. [DOI] [PubMed] [Google Scholar]
- Bates, R.G. 1973. Determination of pH: Theory and Practice. 2nd ed. John Wiley & Sons, Inc., New York. 479pp.
- Bear CE, Li C, Kartner N, Bridges RJ, Jensen TJ, Ramjeesingh M, Riordan JR. Purification and functional reconstitution of the cystic fibrosis transmembrane conductance regulator (CFTR) Cell. 1992;68:809–818. doi: 10.1016/0092-8674(92)90155-6. [DOI] [PubMed] [Google Scholar]
- Chang X-B, Tabcharani JA, Hou Y-X, Jensen TJ, Kartner N, Alon N, Hanrahan JW, Riordan JR. Protein kinase A (PKA) still activates CFTR chloride channel after mutagenesis of all 10 PKA consensus phosphorylation sites. J Biol Chem. 1993;268:11304–11311. [PubMed] [Google Scholar]
- Cheung M, Akabas MH. Identification of cystic fibrosis transmembrane conductance regulator channel-lining residues in and flanking the M6 membrane-spanning segment. Biophys J. 1996;70:2688–2695. doi: 10.1016/S0006-3495(96)79838-7. [DOI] [PMC free article] [PubMed] [Google Scholar]
- Eisenberg RS. Computing the field in proteins and channels. J Membr Biol. 1996;150:1–25. doi: 10.1007/s002329900026. [DOI] [PubMed] [Google Scholar]
- Eyring H, Lumry R, Woodbury JW. Some applications of modern rate theory to physiological systems. Rec Chem Prog. 1949;10:100–114. [Google Scholar]
- Finkelstein A, Andersen OS. The gramicidin A channel: a review of its permeability characteristics with special reference to the single-file aspect of transport. J Membr Biol. 1981;59:155–171. doi: 10.1007/BF01875422. [DOI] [PubMed] [Google Scholar]
- Franciolini F, Petris A. Transport mechanisms in chloride channels. Biochim Biophys Acta. 1992;1113:1–11. doi: 10.1016/0304-4157(92)90031-5. [DOI] [PubMed] [Google Scholar]
- Hasegawa H, Skach W, Baker O, Calayag MC, Lingappa V, Verkman AS. A multifunctional aqueous channel formed by CFTR. Science (Wash DC) 1992;258:1477–1479. doi: 10.1126/science.1279809. [DOI] [PubMed] [Google Scholar]
- Hess P, Tsien RW. Mechanism of ion permeation through calcium channels. Nature (Lond) 1984;309:453–456. doi: 10.1038/309453a0. [DOI] [PubMed] [Google Scholar]
- Higgins CF. The ABC of channel regulation. Cell. 1995;82:693–696. doi: 10.1016/0092-8674(95)90465-4. [DOI] [PubMed] [Google Scholar]
- Hille, B. 1992. Ionic Channels of Excitable Membranes. 2nd ed. Sinauer Associates, Inc., Sunderland, MA. 607 pp.
- Hladky SB, Haydon DA. Ion transfer across lipid membranes in the presence of gramicidin A. Biochim Biophys Acta. 1972;274:294–312. doi: 10.1016/0005-2736(72)90178-2. [DOI] [PubMed] [Google Scholar]
- Hodgkin AL, Keynes RD. The potassium permeability of a giant nerve fibre. J Physiol (Cambr) 1955;128:61–88. doi: 10.1113/jphysiol.1955.sp005291. [DOI] [PMC free article] [PubMed] [Google Scholar]
- Kartner N, Hanrahan JW, Jensen TJ, Naismith AL, Sun S, Ackerley CA, Reyes EF, Tsui L-C, Rommens JM, Bear CE, Riordan JR. Expression of the cystic fibrosis gene in non-epithelial invertebrate cells produces a regulated anion conductance. Cell. 1991;64:681–691. doi: 10.1016/0092-8674(91)90498-n. [DOI] [PubMed] [Google Scholar]
- Linsdell P, Hanrahan JW. Flickery block of single CFTR chloride channels by intracellular anions and osmolytes. Am J Physiol. 1996a;270:C628–C634. doi: 10.1152/ajpcell.1996.271.2.C628. [DOI] [PubMed] [Google Scholar]
- Linsdell P, Hanrahan JW. Disulphonic stilbene block of cystic fibrosis transmembrane conductance regulator Cl−channels expressed in a mammalian cell line, and its regulation by a critical pore residue. J Physiol (Cambr) 1996b;496:687–693. doi: 10.1113/jphysiol.1996.sp021719. [DOI] [PMC free article] [PubMed] [Google Scholar]
- Linsdell P, Hanrahan JW. Modeling CFTR as a multi-ion pore. Pediatr Pulm (Suppl) 1996c;13:220. . (Abstr.) [Google Scholar]
- Linsdell P, Tabcharani JA, Rommens JM, Hou Y-X, Chang X-B, Tsui L-C, Riordan JR, Hanrahan JW. Permeability of wild-type and mutant CFTR chloride channels to polyatomic anions. J Gen Physiol. 1997;110:355–364. doi: 10.1085/jgp.110.4.355. [DOI] [PMC free article] [PubMed] [Google Scholar]
- Lu Z, MacKinnon R. A conductance maximum observed in an inward-rectifier potassium channel. J Gen Physiol. 1994;104:477–486. doi: 10.1085/jgp.104.3.477. [DOI] [PMC free article] [PubMed] [Google Scholar]
- McCarty NA, McDonough S, Cohen BN, Riordan JR, Davidson N, Lester HA. Voltage-dependent block of the cystic fibrosis transmembrane conductance regulator Cl−channel by two closely related arylaminobenzoates. J Gen Physiol. 1993;102:1–23. doi: 10.1085/jgp.102.1.1. [DOI] [PMC free article] [PubMed] [Google Scholar]
- McDonough S, Davidson N, Lester HA, McCarty NA. Novel pore-lining residues in CFTR that govern permeation and open-channel block. Neuron. 1994;13:623–634. doi: 10.1016/0896-6273(94)90030-2. [DOI] [PubMed] [Google Scholar]
- Newland CF, Adelman JP, Tempel BL, Almers W. Repulsion between tetraethylammonium ions in cloned voltage-gated potassium channels. Neuron. 1992;8:975–982. doi: 10.1016/0896-6273(92)90212-v. [DOI] [PubMed] [Google Scholar]
- Neyton J, Miller C. Discrete Ba2+ block as a probe of ion occupancy and pore structure in the high-conductance Ca2+-activated K+channel. J Gen Physiol. 1988;92:569–586. doi: 10.1085/jgp.92.5.569. [DOI] [PMC free article] [PubMed] [Google Scholar]
- Overholt JL, Hobert ME, Harvey RD. On the mechanism of rectification of the isoproterenol-activated chloride current in guinea-pig ventricular myocytes. J Gen Physiol. 1993;102:871–895. doi: 10.1085/jgp.102.5.871. [DOI] [PMC free article] [PubMed] [Google Scholar]
- Overholt JL, Saulino A, Drumm ML, Harvey RD. Rectification of whole cell cystic fibrosis transmembrane conductance regulator chloride current. Am J Physiol. 1995;268:C636–C646. doi: 10.1152/ajpcell.1995.268.3.C636. [DOI] [PubMed] [Google Scholar]
- Ravindran A, Kwiecinski H, Alvarez O, Eisenman G, Moczydlowski E. Modeling ion permeation through batrachotoxin-modified Na+channels from rat skeletal muscle with a multi-ion pore. Biophys J. 1992;61:494–508. doi: 10.1016/S0006-3495(92)81854-4. [DOI] [PMC free article] [PubMed] [Google Scholar]
- Riordan JR, Rommens JM, Kerem B, Alon N, Rozmahel R, Grzelczak Z, Zielenski J, Lok S, Plavsik N, Chou J-L, et al. Identification of the cystic fibrosis gene: cloning and characterization of complementary DNA. Science (Wash DC) 1989;245:1066–1073. doi: 10.1126/science.2475911. [DOI] [PubMed] [Google Scholar]
- Schwiebert EM, Egan ME, Hwang T-H, Fulmer SB, Allen SS, Cutting GR, Guggino WB. CFTR regulates outwardly rectifying chloride channels through an autocrine mechanism involving ATP. Cell. 1995;81:1063–1073. doi: 10.1016/s0092-8674(05)80011-x. [DOI] [PubMed] [Google Scholar]
- Sheppard DN, Rich DP, Ostedgaard LS, Gregory RJ, Smith AE, Welsh MJ. Mutations in CFTR associated with mild-disease-form Cl−channels with altered pore properties. Nature (Lond) 1993;362:160–164. doi: 10.1038/362160a0. [DOI] [PubMed] [Google Scholar]
- Stampe P, Begenisich T. Unidirectional K+ fluxes through recombinant Shaker potassium channels expressed in single Xenopusoocytes. J Gen Physiol. 1996;107:449–457. doi: 10.1085/jgp.107.4.449. [DOI] [PMC free article] [PubMed] [Google Scholar]
- Stutts MJ, Canessa CM, Olsen JC, Hamrick M, Cohn JA, Rossier BC, Boucher RC. CFTR as a cAMP-dependent regulator of sodium channels. Science (Wash DC) 1995;269:847–850. doi: 10.1126/science.7543698. [DOI] [PubMed] [Google Scholar]
- Tabcharani JA, Chang X-B, Riordan JR, Hanrahan JW. Phosphorylation-regulated Cl−channel in CHO cells stably expressing the cystic fibrosis gene. Nature (Lond) 1991;352:628–631. doi: 10.1038/352628a0. [DOI] [PubMed] [Google Scholar]
- Tabcharani JA, Linsdell P, Hanrahan JW. Halide permeation in wild-type and mutant CFTR chloride channels. J Gen Physiol. 1997;110:341–354. doi: 10.1085/jgp.110.4.341. [DOI] [PMC free article] [PubMed] [Google Scholar]
- Tabcharani JA, Rommens JM, Hou Y-X, Chang X-B, Tsui L-C, Riordan JR, Hanrahan JW. Multi-ion pore behaviour in the CFTR chloride channel. Nature (Lond) 1993;366:79–82. doi: 10.1038/366079a0. [DOI] [PubMed] [Google Scholar]
- Villarroel A, Alvarez O, Eisenman G. A maximum in conductance occurs for the large Ca2+-activated K+ channel at high Rb+concentration. Biophys J. 1988;53:259a. (Abstr.) [Google Scholar]
- Welsh MJ, Smith AE. Molecular mechanisms of CFTR chloride channel dysfunction in cystic fibrosis. Cell. 1993;73:1251–1254. doi: 10.1016/0092-8674(93)90353-r. [DOI] [PubMed] [Google Scholar]
- Woodhull AM. Ionic blockage of sodium channels in nerve. J Gen Physiol. 1973;61:687–708. doi: 10.1085/jgp.61.6.687. [DOI] [PMC free article] [PubMed] [Google Scholar]
- Yang J, Ellinor PT, Sather WA, Zhang J-F, Tsien RW. Molecular determinants of Ca2+ selectivity and ion permeation in L-type Ca2+channels. Nature (Lond) 1993;366:158–161. doi: 10.1038/366158a0. [DOI] [PubMed] [Google Scholar]