Abstract
This is a quantitative model of control of Ca2+ release from the sarcoplasmic reticulum in skeletal muscle, based on dual control of release channels (ryanodine receptors), primarily by voltage, secondarily by Ca2+ (Ríos, E., and G. Pizarro. 1988. NIPS. 3:223–227). Channels are positioned in a double row array of between 10 and 60 channels, where exactly half face voltage sensors (dihydropyridine receptors) in the transverse (t) tubule membrane (Block, B.A., T. Imagawa, K.P. Campbell, and C. Franzini-Armstrong. 1988. J. Cell Biol. 107:2587–2600). We calculate the flux of Ca2+ release upon different patterns of pulsed t-tubule depolarization by explicit stochastic simulation of the states of all channels in the array. Channels are initially opened by voltage sensors, according to an allosteric prescription (Ríos, E., M. Karhanek, J. Ma, A. González. 1993. J. Gen. Physiol. 102:449–482). Ca2+ permeating the open channels, diffusing in the junctional gap space, and interacting with fixed and mobile buffers produces defined and changing distributions of Ca2+ concentration. These concentrations interact with activating and inactivating channel sites to determine the propagation of activation and inactivation within the array. The model satisfactorily simulates several whole-cell observations, including kinetics and voltage dependence of release flux, the “paradox of control,” whereby Ca2+-activated release remains under voltage control, and, most surprisingly, the “quantal” aspects of activation and inactivation (Pizarro, G., N. Shirokova, A. Tsugorka, and E. Ríos. 1997. J. Physiol. 501:289–303). Additionally, the model produces discrete events of activation that resemble Ca2+ sparks (Cheng, H., M.B. Cannell, and W.J. Lederer. 1993. Science (Wash. DC). 262:740–744). All these properties result from the intersection of stochastic channel properties, control by local Ca2+, and, most importantly, the one dimensional geometry of the array and its mesoscopic scale. Our calculations support the concept that the release channels associated with one face of one junctional t-tubule segment, with its voltage sensor, constitute a functional unit, termed the “couplon.” This unit is fundamental: the whole cell behavior can be synthesized as that of a set of couplons, rather than a set of independent channels.
Keywords: ion channels, sarcoplasmic reticulum, calcium release, signal transduction
INTRODUCTION
Contraction of skeletal muscle is activated by Ca2+ released from the sarcoplasmic reticulum (SR)1 in response to depolarization of the sarcolemma propagated to its invaginations, the transverse (t) tubules. The depolarization is detected by voltage sensors (dihydropyridine receptors, DHPRs) in the t-tubule membrane, and the signal is transmitted to SR Ca2+ release channels (ryanodine receptors, RyRs) at triad junctions between t-tubules and SR release terminals. Transmission of this signal takes place by a mechanical or allosteric interaction between the DHPRs and RyRs (Schneider and Chandler, 1973; Ríos et al. 1993; Nakai et al., 1996). In recent years, it has become increasingly accepted that Ca2+-induced Ca2+ release (CICR) (Endo et al., 1970; Ford and Podolski, 1970; Fabiato, 1985) also plays a significant role in skeletal excitation–contraction coupling (Ríos and Pizarro, 1988; Klein et al., 1996). This progress in the understanding of function has taken place in parallel with the increasingly precise definition of the junction structure (reviewed by Franzini-Armstrong, 1997). In particular, the alternation of release channels in apparent contact with DHPRs and others devoid of this interaction has suggested that two kinetic phases in the waveform of Ca2+ release flux under voltage clamp correspond to the existence of two different control mechanisms (Ríos and Pizarro, 1988; Shirokova et al., 1996).
Despite this progress, existing models are incomplete, as they do not take into account channel dynamics or structural constraints for diffusion of Ca2+ in the junctional region. Because release channels have a center-to-center spacing of ∼30 nm (Block et al., 1988), Ca2+ microdomains are expected to play an important role in CICR. The openings of these channels are random, and the durations of these openings are comparable with the diffusional time constants within the microdomains. The interaction among release channels must therefore be a dynamic, stochastic process. In this paper, we describe a computational method, based on Monte Carlo simulation, that makes it possible to analyze the full stochastic dynamics of channel arrays and calcium at the triad junction, and present the results of applying this method to a simplified model of the junction.
The model of Shirokova et al. (1996) took into account interactions within a linear array that copied the double row geometry of feet in junctional SR, but for expediency restricted calculations to 28 release channels. In the present simulations, we restrict the array to 60 channels, but this is done to represent the fact that t-SR junctions are of finite length, comprising finite linear segments of t-tubule-facing release channels as they pass close to an individual myofibril. These junctional segments are separated by nonjunctional segments in spaces between myofibrils. With model simulations, it is shown that these portions functionally separate junctional segments, preventing the propagation of Ca2+-mediated activity. Thus, the finite number of channels becomes a crucial property of the array, and an effective determinant of its behavior.
EXPERIMENTAL METHODS
The core of the paper is a comparison of simulations and data. In most cases, data are presented in the form of kinetic records of Ca2+ release, or its associated permeability under various patterns of voltage clamp depolarization. This is the most suitable form for comparison with the simulations, most of which assumed constant unitary currents for the release channels. Ca2+ release flux is derived from Ca2+ transients measured with Ca2+-sensitive dyes in fast twitch skeletal muscle fibers of the frog under voltage clamp. The methods for measuring Ca2+ transients and deriving Ca2+ release flux have been described in detail (Brum et al., 1988; González and Ríos, 1993; Shirokova and Ríos, 1996) and are representative of methods used, with variations, in many other laboratories. Even though their absolute magnitude may not be accurately determined, due to alterations in dye properties introduced by the cytoplasmic medium, the release kinetics and the relationships between their different phases have been confirmed with different methods. Release permeability is derived from Ca2+ release flux by normalization to SR Ca2+ content (as described by Shirokova et al., 1995). SR Ca2+ content is in turn derived either by direct emptying of the releasable Ca2+ (Shirokova and Ríos, 1996) or by a depletion correction method (Schneider et al., 1987) applied to the records of Ca2+ release flux. The experimental data shown here are reproduced from published work.
RESULTS
Calcium Release, Results of Stimulation
In this section, we present data, previously published in most cases, that exemplifies the salient features of Ca2+ release in skeletal muscle (usually frog) under voltage clamp conditions. The figures displaying the data are paired with figures displaying simulation results, described in a later section.
Time and voltage dependence of release flux.
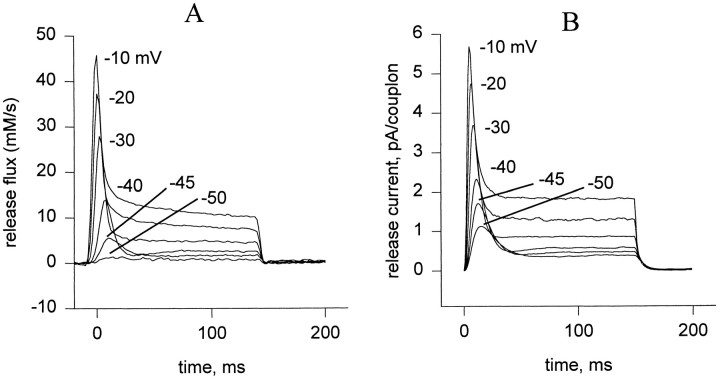
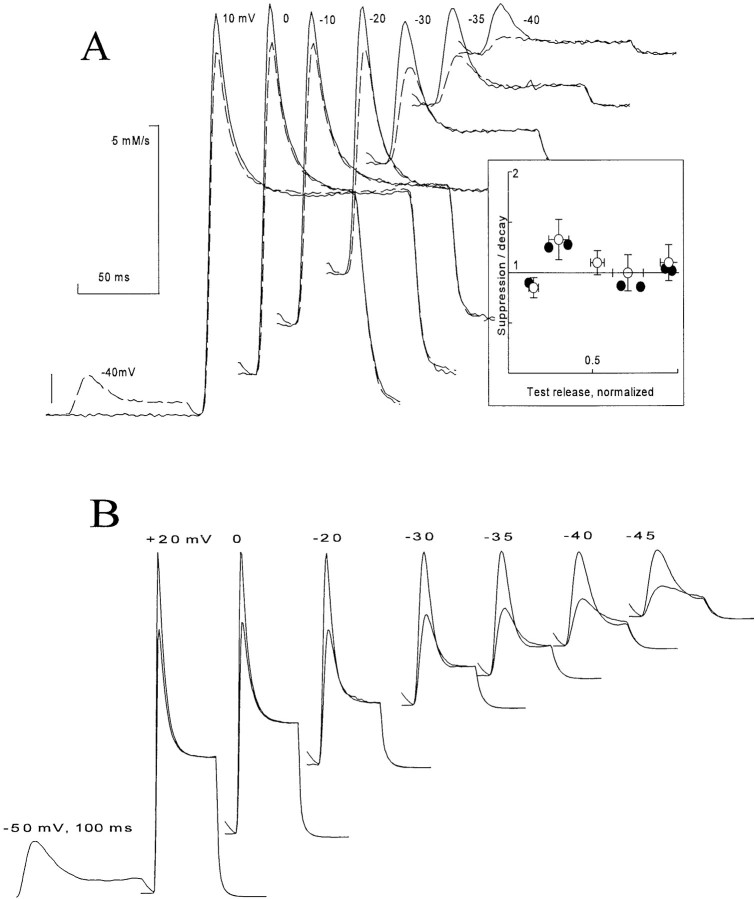
Fig. 1 A shows a typical family of records of Ca2+ release permeability during 100-ms depolarizations from a holding potential of −90 mV to various step potentials. There is a transient release phase, which decays to a plateau of sustained release (Baylor et al., 1983; Melzer et al., 1984, 1987). The plateau continues for the duration of the depolarization and terminates rapidly when the muscle is repolarized. Several features are noteworthy: (a) the steady release increases monotonically with voltage; (b) the peak of the transient release increases monotonically with voltage, but the ratio of the peak to steady release is largest at intermediate potentials (Shirokova et al., 1996); (c) the kinetics of the peak component change with increasing voltage so that, when superimposed, the transients “stack” with near contact between different curves on the descending limb of the transient; (d) there is “record crossing;” in the low voltage range it is possible for release elicited at a given voltage to be greater at certain times than that elicited at a greater voltage; (e) in a narrow range of voltages (here at ∼−40 mV), an oscillation, consisting of an undershoot followed by an overshoot, follows decay from the peak of release. This oscillation of release is associated with the presence of an oscillation in the delayed phases of intramembrane charge movement (Shirokova et al., 1994).
Figure 1.
(A) Ca2+ release flux in response to step depolarizations to the indicated voltages. Slack frog fiber, belonging to the set studied in Shirokova et al., 1996. At the time when the records were obtained, the releasable calcium in the SR was estimated to be 5 mM (referred to accessible cytoplasmic volume). (B) Simulation, discussed below.
The records shown were obtained by normalizing the flux by the continuously decaying releasable Ca content in the SR (estimated with a longer duration record, not shown). Under the assumption that the sole driving force for release is the concentration gradient, and that this in turn is proportional to the total releasable SR calcium, the records are proportional to a release permeability of the SR membrane. Under these simple assumptions, this permeability is proportional to the average open probability in the ensemble of release channels (Shirokova et al., 1995).
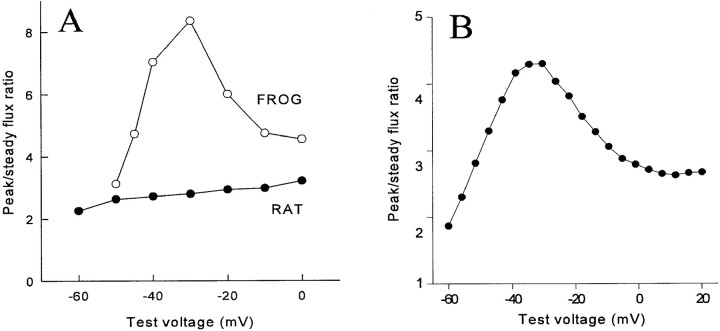
The ratio of the peak to steady release flux varies as a function of voltage, as plotted in Fig. 2 A. In frog muscle, there is a pronounced peak at potentials near −30 mV. Interestingly, in rat muscle, this ratio was found to be nearly independent of voltage (Shirokova et al., 1996).
Figure 2.
(A) The ratio of peak to steady release flux as a function of voltage in muscle from frog and rat. The frog data correspond to the release records in Fig. 1 A and others not shown. Modified from Shirokova et al. (1996). (B) Simulation, discussed below.
Stability and control.
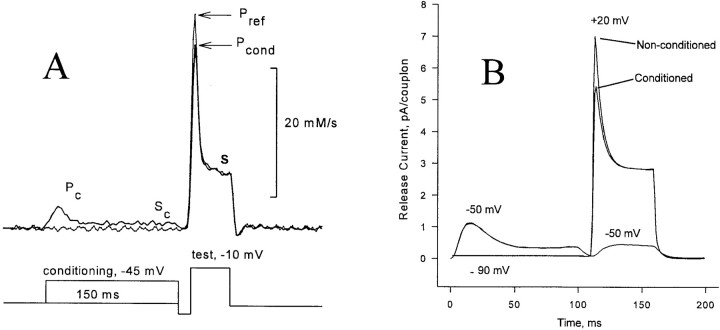
As shown in Fig. 3 A, Ca2+ release flux remains, at all times, under the control of voltage and can be terminated at any time by repolarization. This observation is paradoxical if CICR is responsible for a significant portion of release flux, since CICR is intrinsically self reinforcing, and might be expected to lead to an autonomously evolving response once triggered by voltage-dependent Ca2+ release.
Figure 3.
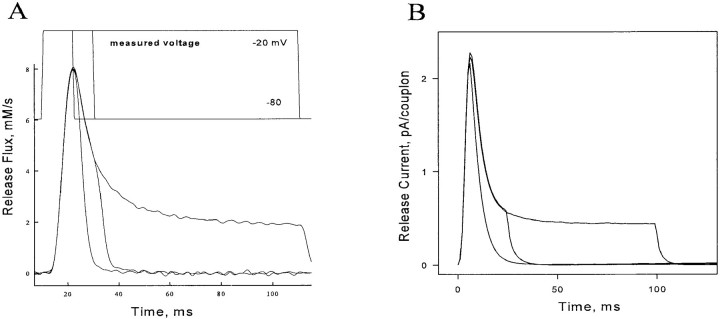
(A) Ca2+ release can be terminated by repolarization at any time. (top) Recorded voltage. (bottom) Release flux. Pizarro, G., N. Shirokova, and E. Ríos, unpublished results. (B) Simulation, discussed below.
Inactivation and “quantal” release.
The decay of the transient component of release is interpreted as the result of channel inactivation. The phenomenon has been studied extensively and is believed to be mediated by an increase in [Ca2+]i (Schneider and Simon, 1988; Simon et al., 1991; Jong et al., 1993) in general agreement with the inactivation by Ca2+ that has been demonstrated for release channels in lipid bilayers (Ma et al., 1988). As recently shown, however, the inactivation revealed by a two-pulse protocol (Fig. 4 A, modified from Pizarro et al., 1997) has an unexpected property: after a small conditioning depolarization, a small test pulse will not elicit any transient release, but a large test pulse will elicit a transient that is only slightly diminished by the earlier conditioning. This strong dependence of fractional inactivation on test voltage is not expected if the transient release is produced by a homogeneous group of release channels whose availability is being measured by the test pulse.
Figure 4.
(A) “Simon's Paradox”: a small conditioning pulse elicits release that inactivates fully, but fails to suppress release by a large test pulse. Modified from Pizarro et al. (1997). (B) Simulation, discussed below.
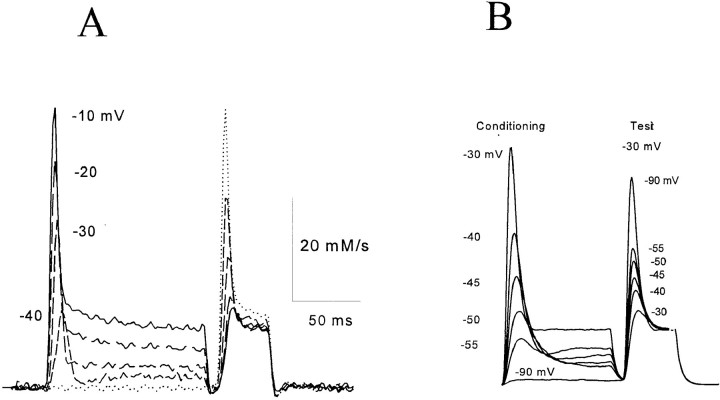
Figs. 5 A and 6 A (also from Pizarro et al., 1997) demonstrate that “Simon's paradox” is a special case of a more general property. In general, a conditioning pulse will totally suppress the transient release elicited by a test pulse of lower voltage. The transient elicited by a larger test pulse is suppressed by an amount (not fraction) roughly equal to the amount by which the release transient decayed during the conditioning pulse. In other words, the system behaves as though each larger voltage incrementally activates and then inactivates a separate pool of channels not accessible to lower voltages. The data would be well explained by a totally inhomogeneous model in which each release channel is labeled with a particular voltage at which it becomes activated. A similar property has been demonstrated for release from SR vesicular fractions, induced by chemical agonists (Dettbarn et al., 1994). This phenomenon has been named ‘quantal release' after a similar property of activation of IP3 receptors by IP3 (Muallem et al., 1989).
Figure 5.
(A) An arithmetic rule of inactivation: the suppression determined by a conditioning pulse on the release elicited by a test pulse is approximately equal to the decay during the conditioning release. Modified from Pizarro et al. (1997). (B) Simulation, discussed below.
Figure 6.
(A) A small conditioning pulse suppresses a later release by a roughly constant amount, approximately equal to the decay during the conditioning release, regardless of the test voltage. Modified from Pizarro et al. (1997). (B) Simulation, discussed below.
Effect of diffusible buffers.
A crucial test of any model of control that includes CICR is that it ought to be possible to suppress release by means of Ca2+ buffers that interrupt the Ca2+ signal. The work in skeletal muscle up to 1993 was reviewed by Schneider (1994). The effects observed are at once complex and contradictory. One laboratory observed mainly an inhibition of the peak of Ca2+ release by the buffers fura-2, BAPTA (1,2-bis(2-aminophenoxyethane)-N,N,N ′,N ′-tetraacetic acid) and fura-2 analogs (Jacquemond et al., 1991; Csernoch et al., 1993), but not when the extrinsic buffer was the dye quin-2 (Dey et al., 1996). Another laboratory observed more complex effects, consisting in a potentiation of release induced by single action potentials when the dye fura-2 was increased in a low concentration range, followed by inhibition when the dye was increased beyond 1 mM (Pape et al., 1993). The same group reported a major potentiation by fura-2 of the steady release in voltage clamp conditions, and only observed inhibition of steady release at concentrations of fura above 3 mM (Jong et al., 1993). The results are clearer in suspensions of extracts from muscle homogenates, in which BAPTA drastically reduces the release flux induced by depolarization of resealed t-tubule vesicles (Anderson and Meissner, 1995).
In our own experiments, we found major effects, especially on release elicited by low voltage pulses (Ríos et al., 1994). In experiments in which there were no extrinsic Ca2+ buffers other than fura-2 (Tsugorka, A., manuscript submitted for publication), we found that at 3 mM the dye reversibly suppressed Ca2+ release. The plateau release component was reduced, especially at low voltages. The transient release component was affected more strongly than the plateau, and could be completely suppressed. The suppressive effect of fura-2 was partially overcome by depolarizing to higher voltages.
Spontaneous events.
The application of confocal microscopy to skeletal muscle has resulted in the observation of transient elevations in [Ca2+]i that are also spatially localized (Tsugorka et al., 1995). They have been termed Ca2+ sparks (Klein et al., 1996) by analogy with the discrete events of cardiac muscle (Cheng et al., 1993), even though they are briefer and smaller in amplitude and spatial magnitude. In support of a dual control mechanism for Ca2+ release, at least some (Klein et al., 1996) and perhaps all (Shirokova and Ríos, 1997) of these sparks appear to be activated by cytoplasmic Ca2+. Their amplitude appears not to depend strongly on pulse voltage and is described as being distributed around a single mode at 0.8 U resting fluorescence (Lacampagne et al., 1996). Whether these events correspond to the aperture of one or multiple channels is not known, but in cardiac muscle there is increasing evidence for a multichannel origin of sparks (Parker et al., 1996; Blatter et al., 1997).
One difficulty in comparing measured sparks with model predictions is that observed sparks are local increases in fluorescence, the interpretation of which in terms of Ca2+ release permeability is only tentative, in skeletal (Tsugorka et al., 1995) as well as in cardiac muscle (Blatter et al., 1997). An additional difficulty is that the measuring process, usually by confocal microscopy in line scan mode, gives an incomplete spatio-temporal picture of the phenomenon (as discussed by Ríos and Stern, 1997; Shirokova and Ríos, 1997; and Pratusevich and Balke, 1996). In spite of these difficulties, from these ongoing studies emerges the concept that release should be at least in part accounted for in terms of openings of single channels or small groups that are Ca2+-mediated and stereotyped: brief in duration (several milliseconds), originating at spots whose size is beyond resolution, of an amplitude roughly equivalent to a real average increase in Ca2+ of ∼100 nM. To this picture, some evidence was added recently of the existence of a second mode of release, composed by events smaller than sparks, and probably not mediated by Ca2+ (Shirokova and Ríos, 1997).
Biophysical Model
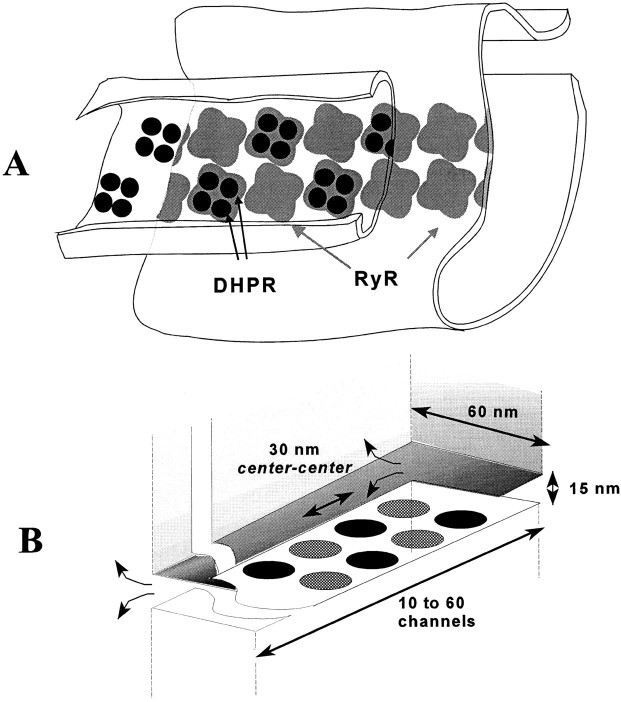
The biophysical model is based on a proposal of Ríos and Pizarro (1988). Ultrastructural studies (reviewed by Franzini-Armstrong, 1997) show that release channels are located in a dense array on the SR release terminals apposed to the t-tubule, positioned so as to form a double strip along the length of the t-tubule (Fig. 7 A). The length of such contiguous arrays or EC coupling units (Franzini-Armstrong and Jorgensen, 1994) ranges from 0.2 to 0.9 μm (average 0.42 μm) in the ileofibularis and semitendinosus muscles of the frog (F. Protasi and C. Franzini-Armstrong, personal communication). The distances between junctional units, 0.1 μm on average, are spanned by nonjunctional t-tubule segments that are bare and wavy. Assuming for the frog the same geometry of channel arrays that applies elsewhere, between 10 and 60 release channels, 28 on average, should be present on each side of a junctional unit. On the t-tubular face of the junction, dihydropyridine receptors are located in tetrads (Franzini-Armstrong and Nunzi, 1983), positioned so that alternate release channels are directly apposed to a DHPR tetrad (Fig. 7 A). Ríos and Pizarro (1988) proposed that a tetrad of voltage-sensitive DHPR molecules allosterically activates the release channel opposite to it (“V channel”), while the alternate channels that are not in contact with a voltage sensor (“C channels”) are controlled by Ca2+, binding to putative activating and inactivating sites on the RyR. Ca2+ released via release channels of either type can diffuse in the junctional cleft to activate and inactivate other channels. In particular, Ca2+ released from V channels in response to depolarization can trigger release of Ca2+ from nearby C channels, which amplifies the release flux. Because the released Ca2+ can induce further release, CICR is an intrinsically self-reinforcing phenomenon, and yet the experimental data (see above) show that the release flux is a smoothly graded function of voltage and that repolarization can terminate release at any time. This paradox requires, at the least, that there be some mechanism to terminate release from C channels. The usual assumption is that C channels inactivate, either in response to Ca2+ binding to an inactivating site or fatefully, as a consequence of activation.
Figure 7.
(A) Relationship between voltage sensors (dihydropyridine receptor tetrads) and release channels in amphibian and mammalian skeletal muscle (modified from Block et al., 1988). (B) The idealized geometry of a couplon as used in the model. Circles represent Ca2+-releasing regions of alternating voltage controlled (V) and Ca2+ controlled (C) channels, which release Ca2+ into the junctional cleft bounded by the t-tubule membrane above and SR membrane below. Diffusion in the cleft was calculated in a two-dimensional approximation, ignoring vertical gradients. Diffusion of Ca2+ and dye across the edges of the rectangular cleft (curved arrows) was modeled by a resistive boundary condition (see Appendix). Note: dimensions in the plane of the cleft in ultrastructural data are actually 12% larger than those used in the simulation. This would correspond to a slight rescaling of the assumed diffusion coefficients.
To turn these prescriptions into a concrete model, we specified (a) the gating schemes of the V and C channels, (b) the permeation kinetics of these channels, and (c) the geometry of the junction and conditions of Ca2+ diffusion and binding therein. The specific assumptions used in obtaining the simulation results are detailed below. Because the simulations demonstrate that it is sufficient with blockade or inactivation of a single C channel to interrupt Ca2+-mediated interaction between channels on both sides of the inactivated one, the groups of channels on one face of one junctional strip turn out to be effectively functionally independent, both from adjacent junctional t-tubule segments and from the channels on the other face of the junctional segment. To stress the fundamental nature of the result, we name this functional unit (the set of release channels on one face of one junctional strip, together with its associated voltage sensors and other triadic proteins) a couplon. There are two couplons per junctional segment of t-tubule.
Mathematical Model
We assume that the gating of an individual channel can be described by a Markov scheme. At any moment, the channel is in one of a finite number of discrete states, with transitions between states taking place instantaneously and at random. The rates of these transitions are determined only by the initial state and by external variables such as membrane potential and [Ca2+]. We then treat the entire array of channels in one couplon as a single stochastic object. A state of the array (macrostate) is specified by giving the (instantaneous) states of each of its constituent channels. A macrostate S is therefore an n-tuple of the form
 |
1 |
where the s i stand for particular states of the ith channel in the array of n V and C channels, with the V channels numbered first, and n = 2N. Since transitions of the channels are assumed to take place instantaneously, every transition of the macrostate is due to a change in the state of exactly one individual channel. The rate of such a macrostate transition is simply the rate of the corresponding transition of the single channel computed for the local conditions of ion concentration and membrane potential at that channel. Letting PS denote the occupation probability of macrostate S, this reasoning gives the master equation for the array
 |
2 |
where S is written in terms of channel states s i, and r (i) ss′ is the transition rate from state s i to s i ′ in the appropriate (V or C) single channel gating scheme, evaluated in the local environment of the ith channel.
The master equation (Eq. 2) is not complete because the r (i)s depend implicitly on local [Ca2+], which is itself a stochastic variable, since its sources are the unitary Ca2+ fluxes through whichever channels of the array are open at a given instant. The width w of the junctional strip is ∼70 nm, so the diffusional time constant w2/D for free Ca2+ is ∼8 μs. This is short compared with most channel gating events so, under many conditions (as will be justified below), the local [Ca2+] will be in a steady state while the array remains in a particular macrostate. When this is true, the rate coefficients rss′ take constant values, determined uniquely by the macrostate, so the entire system is a memoryless, discrete-state, continuous-time Markov process. In this case, the dynamics of the macrostate probability P, and therefore of any ensemble-averaged variables (e.g., total release flux) can be determined by solving Eq. 2. In the more general case, the macrostate of the channel array is coupled to the fluctuating [Ca2+] in the junctional cleft, which is governed by a system of reaction–diffusion equations. These are stochastic partial differential equations. In principle, it is possible to construct a master equation describing this entire system, but it appeared to us that the basic properties of the model could be explored through the simpler approach first. The technique for analyzing the full system with dynamic diffusion and buffering reactions is described in Appendix.
The concise notation of Eq. 2 is misleading. When the number of channels and the number of states of each channel are both small, it is straightforward to construct the master equations by hand. For slightly larger numbers, the process can be automated using computer algebra (M.D. Stern, unpublished results). However, for the case considered below, in which the V channel gating scheme has 10 states, the C channel at least 4 states, and there are 30 channels of each type, the number of macrostates is 1.15 × 1048! (A small numbers example is given in Appendix.) Fortunately, the transition rate matrix of the system is quite sparse: for this same model there are at most 150 possible destination states reachable in a single transition from any given macrostate (the range of the second sums in Eq. 2). This makes it practical to analyze the system by the technique of Monte Carlo simulation.
The Monte Carlo technique is, in concept, very simple. The states of all channels, and the distribution in the junctional cleft of Ca2+ and other relevant chemical species (e.g., bound calcium, magnesium, etc.) are explicitly simulated, and the timing and destination of all stochastic transitions are selected by means of random numbers. In this way, a single realization of the entire stochastic process, covering a finite time period (e.g., the duration of a single voltage clamp protocol) is constructed. The simulation is repeated to give many different realizations of the process, which are ensemble averaged to construct statistics of the underlying physical system. This is demanding computationally, and it is necessary to make approximations and to optimize the Monte Carlo algorithm in various ways to make the problem tractable. A number of tests indicate that the needed approximations are not more troublesome than the considerable experimental uncertainty still remaining. Details of the algorithm are given in Appendix.
Details of the Biophysical Model
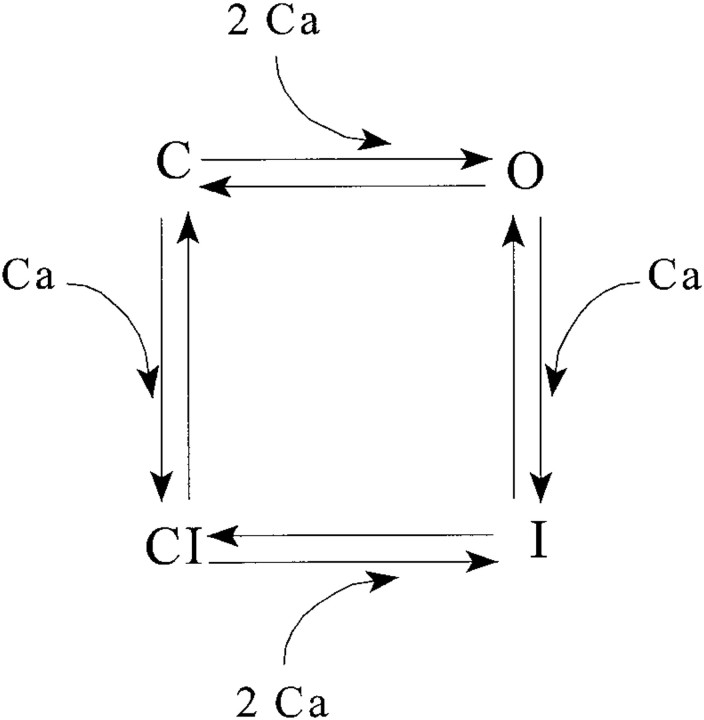
For the simulations presented here, we limited the problem to models of the Ríos and Pizarro (1988) type described above, but the algorithm is applicable to any model consisting of small clusters of ion channels coupled by gradients of a diffusible messenger, and it should be relatively straightforward to apply it to cardiac junctions, with their wider, two-dimensional arrays of channels. The V channels and their coupled DHPR voltage sensors were described by the 10-state allosteric model of Ríos et al. (1993), which approximately accounts for many observed features of gating charge movement and their relationship to the steady component of Ca2+ release. Although there is a rapidly increasing body of data on the gating of the skeletal ryanodine receptor in synthetic lipid bilayers, a gating scheme that summarizes and explains all of this data will probably be complex (e.g., Meissner et al., 1997). For the simulations in this paper, we used instead a simple, four-state, “cartoon” gating scheme for the C channels. The channel was assumed to have two gates operating in series: activation, opened by the simultaneous, cooperative binding of two Ca2+ ions, and inactivation, closed by the binding of a single Ca2+ ion. This gives the state scheme in Fig. 8. This scheme was chosen as a minimal representation of the basic phenomena of calcium activation and inactivation. We did not attempt to incorporate the interesting phenomenon of “adaptation” (Gyorke and Fill, 1993) since the time scales of this phenomenon in vivo remain controversial, and the only simple gating scheme that (approximately) reproduces their results (Keizer and Levine, 1996) was designed to represent the cardiac release channel, and does not include strong steady state calcium inactivation, which is observed in the skeletal channel.
Figure 8.
The simplified gat-ing scheme assumed for Ca2+-activated release (C) channels. Rate constants and their values are in Table I.
For most of the computations, we assumed that open release channels of each type pass a constant unitary current (i.e., effects of SR calcium content and cytosolic ion concentrations on channel permeation were neglected) and the balance between SR calcium release and reuptake by the SR Ca2+ pump was not explicitly considered. To explain the high ratios of peak to steady release flux observed experimentally, it was helpful (though probably not essential) to assume that the unitary current of the C channel is larger than that of the V channel. Because of many indications that the phenomena are determined by large local calcium gradients, the global cytosolic calcium dynamics and its effect on channel gating were neglected in all but one example. For simplicity, we ignored any effect of Ca2+ on the effective membrane potential seen by the voltage sensor, and its putative consequence (Pizarro et al., 1991), the Iγ phase of charge movement (Adrian and Peres, 1977). Ca2+ transport in the junctional cleft was approximated as two dimensional, as detailed below. Two types of Ca2+ binding were considered. Fixed (nondiffusible) Ca2+ buffer, representing putative high density, low affinity binding sites on negatively charged membrane phospholipids (Post and Langer, 1992) was approximated as fast and nonsaturable; i.e., as an increase in the (constant) apparent volume of distribution of Ca2+ per unit geometrical volume of the cleft. Exogenous high affinity diffusible buffer (e.g., fura-2) was treated explicitly by means of reaction–diffusion equations (see Appendix). The Ca2+-free and -bound dyes were assumed to have the same diffusion coefficient, so that [Dye]+[Dye:Ca] = constant (permitting the number of reaction–diffusion variables to be reduced by one, to great computational advantage).
Parameter values.
Model parameters are summarized in Table I. Unless specified otherwise, the total number of channels, 2N, was 60. The V and C channel unitary currents were taken to be 0.1 and 0.3 pA, respectively. These values are small compared with the unitary current suggested on the basis of lipid bilayer studies of the isolated skeletal ryanodine receptor (Tinker et al., 1992). Our choice is based on the estimate of 3 pA for release current intensity underlying large Ca2+ sparks in cardiac muscle (Blatter et al., 1997), together with the assumption, substantiated in the same paper, that cardiac sparks reflect the activation of multiple channels. Changes in the absolute scale of the unitary currents can be compensated by changes in the affinities of the Ca2+-binding sites on the C channel. We chose the latter to fit the model roughly to the observations, so there is considerable latitude in the actual value of the unitary current. The ON rate constant of the activating site on the C channel (k o) was chosen, as explained in discussion, to account for the peak/plateau ratio and speed of the transient phase of release. We found it difficult to account for these features unless the model operated in a regime in which the chain of C channels is highly regenerative. The values for the C channel rate constants are discussed at greater length in discussion. The V channel parameters were taken from the original model of Ríos et al. (1993), with time-dimensioned rate constants increased by a factor of 2. The diffusion coefficient of free Ca2+ was taken to be 5 × 10⁻⁶ cm2 s−1, only modestly reduced by tortuosity factors from the free-solution value (7.8 × 10⁻⁶ cm2 s−1, Ríos and Stern, 1997). The effects of buffering, which are sometimes accounted for by use of a much smaller apparent diffusion coefficient (Ríos and Stern, 1997), were explicitly incorporated into the computation, as described.
Table I.
Model Parameters and Their Values
| Parameter | Meaning | Value | ||
|---|---|---|---|---|
| k o | Activating on rate | 1013 M−2 s−1 | ||
| k o− | Activating off rate | 500 s−1 | ||
| k i | Inactivating on rate | 2 × 10⁻⁶ M−1s−1 | ||
| k i− | Inactivating off rate | 20 s−1 | ||
| i V | V channel unitary current | 0.1 pA | ||
| i C | C channel unitary current | 0.3 pA | ||
| D ca | Ca2+ diffusion coefficient | 5 × 10⁻⁶ cm2 s−1 | ||
| D fura | Effective fura-2 diffusion coefficient | 10−7 cm2 s−1 | ||
| k on | Fura-2 on rate | 5 × 10⁸ M−1 s−1 | ||
| k off | Fura-2 off rate | 90 s−1 | ||
| K d | Fura-2 equilibrium constant | 180 nM | ||
| Couplon width | 60 nm | |||
| Junctional gap thickness | 15 nm | |||
| Channel spacing | 30 nm |
Parameters of the voltage sensor and its interaction with the release channel are as in Ríos et al. (1993), with rate constants of the voltage sensor increased by a factor of 2. Geometry illustrated in Fig. 7 B.
Mathematical details.
The dynamics of the system were explicitly simulated, using discretized differential equations for the diffusion problem and random numbers to generate the stochastic channel transitions. Two very different cases had to be considered. The simplest and most useful simulation assumed that there was no diffusible buffer present. In that case, it was possible to obtain essentially the same results assuming that [Ca2+] is in steady state during the interval between channel gating events (i.e., changes instantly upon channel gating), as by calculating concentrations dynamically (which requires 100-fold more computation time). When a large concentration of a diffusible buffer was included in the model, the steady state assumption was no longer valid and a dynamic, more involved simulation had to be devised. Substantial increase in computational speed might be obtainable with the rapid buffering approximation (Wagner and Keizer, 1994) and treating total calcium (bound and free) as the diffusing species, with back calculation of free calcium (Smith et al., 1996). However, for high affinity calcium buffers, the applicability of the rapid buffering approximation on the length scale of the single release channel is borderline at best, even for diffusion-limited reaction kinetics (Stern, 1992b), so we chose to fully include all kinetic effects in these simulations. The details of these procedures are given in Appendix.
Simulation of Ca2+ sparks.
The Monte Carlo algorithm was also used to generate a catalog of Ca2+ release events occurring during prolonged holding at a constant negative potential, to be compared with the “Ca2+ sparks” observed using confocal microscopy (Cheng et al., 1993; Tsugorka et al., 1995; Klein et al., 1996). To facilitate the comparison, the Ca2+ release flux of each detected event was used as the source for a time-dependent reaction–diffusion computation simulating the spatio-temporal distribution of Ca:fluo-3 in the presence of a nondiffusible, high affinity buffer simulating Ca2+ binding sites on myofilaments and other cellular proteins. This computation was carried out in one effective space dimension, using spherically symmetrical geometry discretized into 25 concentric shells filling a sphere of radius 3 μm. This discretization reduced the problem to a system of 100 ordinary differential equations, which were integrated by Adams or Gear methods (dynamically selected, depending on the stiffness of the equations). Amplitude and duration statistics of the resulting fluorescence sparks were compiled for 10,000 events.
Hardware and software.
Generation of FORTRAN code from symbolic templates (see Appendix) was done using Macsyma 2.1 (Macsyma Inc., Arlington, MA). Partial differential equations for steady state calcium transport in the junctional cleft were solved by the Galerkin finite element method with adaptive gridding, using the program PDEase (Macsyma Inc.). The differential equations describing the allosteric V channel model (Ríos et al., 1993) were set up and solved using the modeling language MLAB (Civilized Software, Bethesda, MD). Integration of large systems of stiff differential equations within the Monte Carlo algorithm was done using public domain FORTRAN source code of the routine DDRIV3 (Kahaner, D.K., National Bureau of Standards, and Sutherland, C.D., Los Alamos National Laboratory, 1985), obtained from the Guide to Available Mathematical Software of the U.S. National Institute of Standards and Technology, adapted for the use of sparse matrix methods. Macsyma, PDEase, and MLAB were run on a Pentium Pro 200 MHz workstation (Digital Equipment Corp., Maynard, MA). The Monte Carlo simulations themselves were run either on an AlphaServer 2100 4/275 using VMS FORTRAN (Digital Equipment Corp.), or on the Pentium Pro workstation (using Lahey Fortran 90 v3.0; Lahey Computer Systems, Inc., Incline Village, NV), which was only slightly slower than the Alpha.
Calcium Release: Results of Simulation
Ca2+ diffusion at the junction.
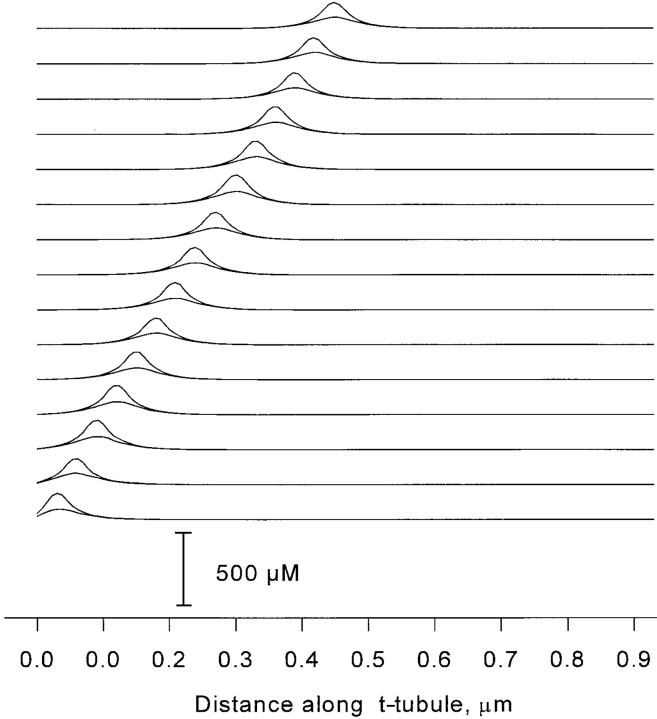
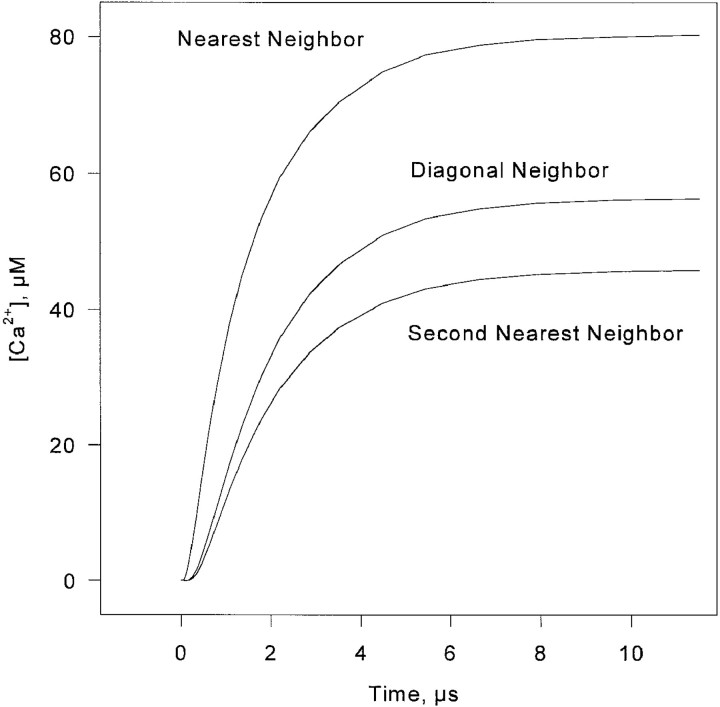
Fig. 9 shows the steady state microdomains of [Ca2+], computed assuming a 1-pA release current passing through one release channel of a 900-nm couplon (30 C and 30 V channels). [Ca2+] is plotted along the line of centers of the release channels in the same row as the source channel, as well as in the opposite row, for every source position up to the center of the couplon. At distances beyond the radius of the source channel, [Ca2+] declines roughly exponentially. The reason for this rapid fall-off, as compared with the 1/r dependence of a localized source in three dimensions, or the even slower log(r) in two dimensions, is that the spread of Ca2+ along the junction is dominated by loss from the edges of the cleft into the free cytosolic space. Fig. 10 shows the approach to steady state of the time-dependent diffusion gradient coupling one channel to its near neighbors. The speed with which this happens makes the steady state calculation essentially correct in the time scale of gating, when calcium buffers can be neglected.
Figure 9.
Steady state Ca2+ microdomains created by 1-pA release at each of 15 release channel sites along one row of the couplon. The stacked pairs of plots represent the calcium profiles along the length of the couplon, when the (constant) calcium source is located at different channel positions. In each pair, the larger values are concentrations along the line of centers of the releasing channels, and the lower values correspond to the line of centers of the channels on the other row. These numbers were rescaled by the actual unitary currents (0.1 for V channels, 0.3 for C channels) to give the local [Ca2+] coupling coefficients used in the simulations.Figure 9. Steady state Ca2+ microdomains created by 1-pA release at each of 15 release channel sites along one row of the couplon. The stacked pairs of plots represent the calcium profiles along the length of the couplon, when the (constant) calcium source is located at different channel positions. In each pair, the larger values are concentrations along the line of centers of the releasing channels, and the lower values correspond to the line of centers of the channels on the other row. These numbers were rescaled by the actual unitary currents (0.1 for V channels, 0.3 for C channels) to give the local [Ca2+] coupling coefficients used in the simulations.
Figure 10.
Time dependence of Ca2+ microdomain concentration after opening of a release channel, as seen at the locations of nearby release channels. A reference source current of 1 pA is assumed; actual [Ca2+] scales in proportion to the source unitary current.
Consistency of the model.
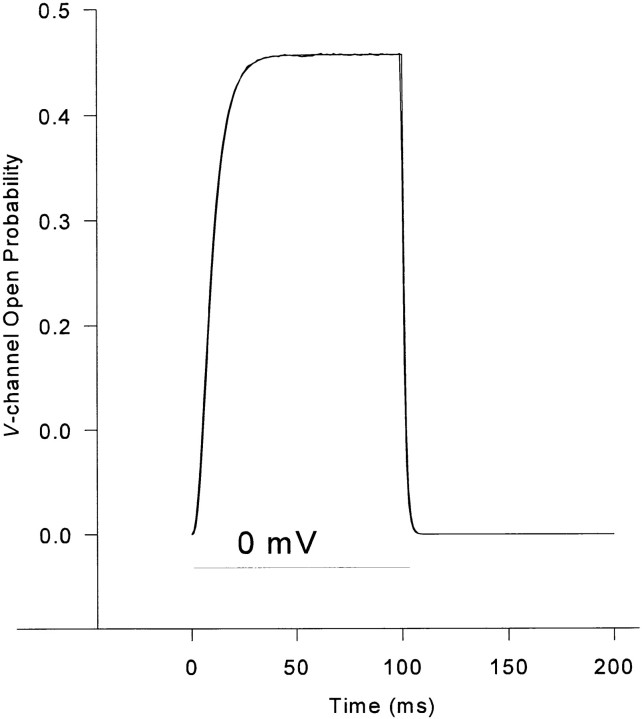
As a check on the correctness of the algorithm and programming, we compared the V channel open probability generated by the Monte Carlo simulation with that predicted by the single-channel master equation. The Monte Carlo algorithm was used to simulate a couplon consisting of 60 (30 V and 30 C) channels. Since the V channels in our simplified model are controlled only by voltage, the gating of each V channel is statistically independent of the others. The ensemble-averaged number of open V channels, as a function of time during a step depolarization, should be equal to 30 times the P o of a single V channel, as computed by integrating the nine independent differential equations of the allosteric model (Ríos et al., 1993). The latter were set up and solved using the modeling language MLAB. Fig. 11 shows the V channel P o during a step to 0 mV for 100 ms, computed by the two methods. The perfect overlap is strong evidence of the correctness of both algorithms. With the exception of Fig. 14, all simulations shown represent the ensemble average of 1,000–10,000 individual, independent Monte Carlo trials, and so may be compared with whole cell measurements (which add the contributions of a physical ensemble of asynchronous stochastic release units). What constitutes a “release unit” is considered in discussion; from a practical point of view, it should be the smallest unit that behaves (approximately) in a statistically independent manner and whose average behavior is representative of the physiologic processes of importance. Our results indicate that, in skeletal muscle, the channel grouping that we termed a couplon has these properties.
Figure 11.
V channel open probability, computed by the Monte Carlo simulation or by direct integration of the differential equations of the allosteric model. The two curves essentially superimpose. Procedural details given in text.
Figure 14.
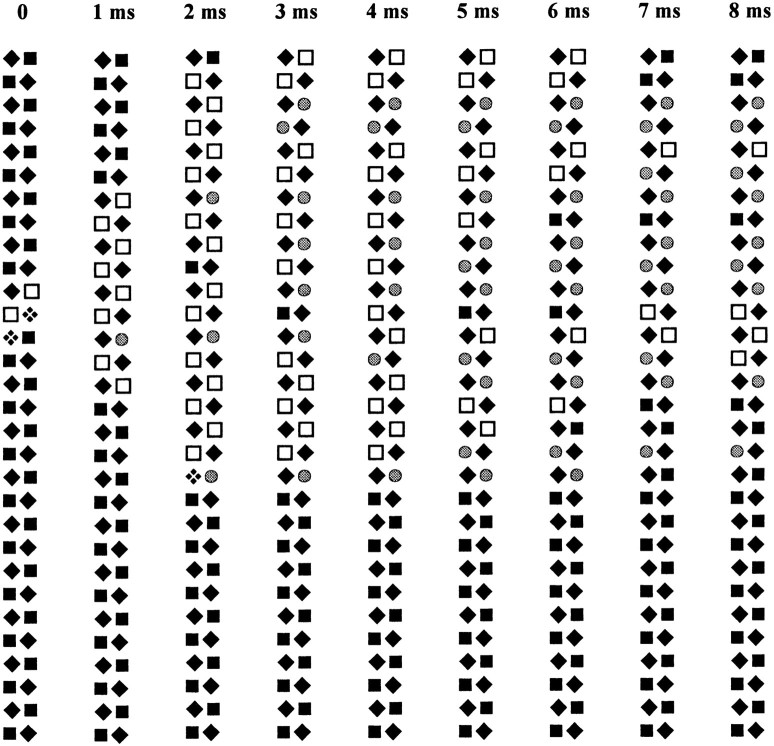
A series of “snapshots” of a 60-channel couplon at 1-ms intervals during a depolarization to −50 mV. A coincident opening of two neighboring V channels triggers C channel openings, which then propagate as a wave along the length of the couplon until stopped by random inactivation events. Solid diamond, closed V channel; solid square, closed C channel; checkered diamond, open V channel; open square, open C channel; gray circle, inactivated C channel.
Time and voltage dependence of release flux.
The total Ca2+ release flux computed for 100-ms step depolarizations to various potentials, assuming steady state diffusional couplings, is shown in Fig. 1 B. Of the five qualitative kinetic properties of the release waveform, listed earlier, the simulations reproduce the first four extremely well. Peak and steady components are present. At all but the lowest voltages, V channel openings are frequent and may overlap within a couplon, triggering frequent release that involves multiple C channels by a locally regenerative process (see below). At the onset of the pulse, the events are more likely to involve large portions of the couplon, and their statistical overlap gives rise to a strong peak. Later in the pulse, the C channel array is largely inactivated and contributes much less, so that flux reaches a plateau. The variable ratio of peak and plateau is well reproduced and will be considered below. The simulation reproduces intriguingly well the stacking noted in the experimental records, with near contact between different curves on the descending limb of the transient. It also features the crossing noted in the experimental records at low voltage. It reproduces, to some extent, the oscillation observed experimentally at −40 mV. This is surprising given the evidence (provided by Shirokova et al., 1994) that the oscillation is a consequence of Iγ, a phenomenon not contemplated in the present model.
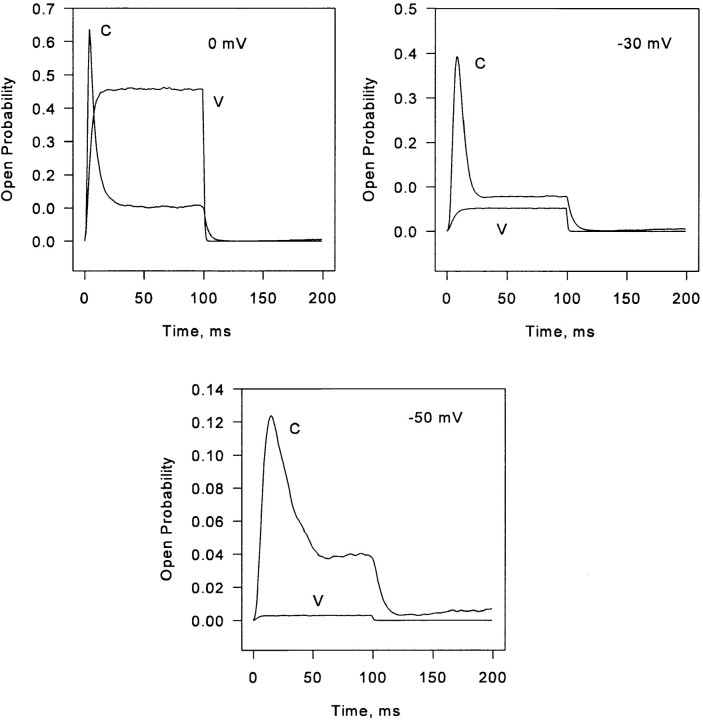
The ratio of the peak to the plateau is plotted as a function of voltage in Fig. 2 B. The model reproduces the bell-shaped voltage dependence found in amphibian skeletal muscle. The apparent mechanism of this dependence in the model is that, at low voltages, V channel openings are brief and sparse, and trigger large and infrequent C channel events, contributing mainly to the plateau. At intermediate voltages, steady release continues to increase proportionally with V channel activation, while peak release increases more than proportionally, largely as a consequence of better synchronization of the first V activations during a pulse. As suggested by Shirokova et al. (1996), at positive potentials, essentially all C channels have already been recruited and inactivated by the frequent, overlapping V events, so the peak/plateau ratio falls again. Fig. 12 shows C and V open probabilities plotted separately at several voltages. The nature of the ensemble inactivation of C channels at low and intermediate voltages is discussed further below in connection with quantal release.
Figure 12.
V and C channel open probabilities plotted separately for three pulse voltages. How these relate to peak and steady release levels is considered in discussion.
Stability and control.
As shown in Fig. 3 B, the simulated release has the control property seen experimentally; it can be terminated by repolarization at any time. Additionally, as shown in the previous section, the simulated release flux is smoothly graded with voltage (further evidence of stability and controllability). This was surprising; the parameters chosen result in a highly regenerative C channel array, which might make the release, once triggered, evolve out of control. The resolution of this paradox is that, while individual regenerative events are large and autonomous (see the next section), they are brief, being terminated by local inactivation. The ensemble release function is built up by statistical recruitment of events, controlled by the duration and first latency of the triggering V channel events. Repolarization does not stop sparks already in process, but it terminates their recruitment. Therefore, the kinetics of turn-off of release upon repolarization is limited by the average kinetics of decay of individual sparks. In this respect, this model resembles the “cluster bomb” version of the local control model proposed for cardiac E-C coupling (Stern, 1992a).
Effect of array length.
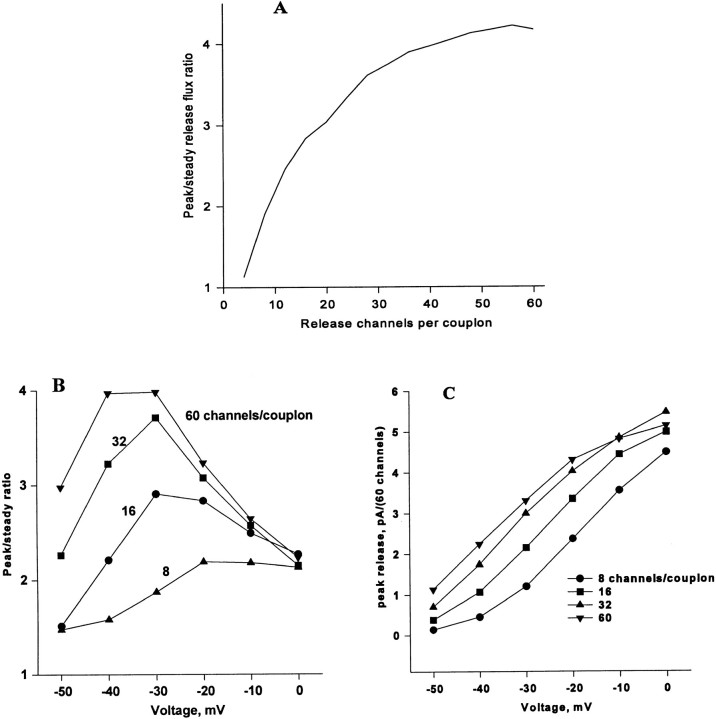
Because the behavior of the model depends critically on multichannel interactions, one would expect that the length of the junctional array had a significant effect, even on dimensionless parameters such as the peak/steady-release ratio. Fig. 13 A shows that this is in fact the case. Holding all other parameters constant, the peak/steady ratio increases monotonically with the length of the array. In Fig. 13, B and C, the voltage dependence of peak and peak/ steady ratio are shown for several different couplon lengths. The maximum of peak/steady release shifts to higher voltages as the couplon is shortened, because more V channel openings are required to guarantee synchronous firing of (almost) every couplon to produce the peak. At still higher voltages, little further recruitment of couplons can take place, so the ratio falls. This analysis sheds new light on the concept of redundance, or overlap of activating domains proposed by Shirokova et al. (1996) as the explanation for the descending branch in the bell shaped voltage dependence of peak/steady release. Saturation will occur when there are sufficiently many V channel openings to guarantee a triggering event in every couplon. The overlap is therefore one of domains of influence of V channels; in a highly regenerative model, these may be substantially larger than the actual Ca2+ microdomains produced by an open V channel.
Figure 13.
Effects of couplon length. (A) Variation of the peak/steady release ratio as a function of couplon length. (B) Peak release current and (C) peak/steady ratio as a function of pulse voltage at four couplon lengths. Current is scaled up, in all cases, to a 60-channel couplon. The simulations illustrate one of the effects of conditioning pulses, which is to reduce the length of excitable patches. This in turn shifts the voltage dependence of peak release and moves the maximum peak/steady ratio to higher voltages.
These couplon length effects show that, even for moderately large numbers of channels, the junction does not behave like a homogeneous, macroscopic chemical system. This may be due to the linear geometry of the array, which makes even highly regenerative events vulnerable to extinction by random inactivation. The observation of especially active (“eager”) triads (Blatter et al., 1996) might be explained by the natural dispersion in the length of junctional t-tubule segments, which in the frog range from 0.2 to 1 μm.
Two-pulse protocols: quantal release.
With the set of parameters found to best reproduce the peak/plateau ratio, the model gave a surprisingly good account of quantal inactivation. As shown in the simulation panels of Figs. 4–6, a small conditioning depolarization can abolish the transient release in response to an immediately subsequent small test depolarization, while only modestly diminishing the peak release in response to a large test depolarization. Overall, the relationship between decay of the conditioning release and suppression of subsequent test release is fairly similar to the data, except that the model overestimates the degree of suppression at the highest test potentials (Fig. 5 B).
We understood this property as resulting from the effects of couplon length, demonstrated in Fig. 13, and the stochastic properties of the model. One individual realization of the model during a depolarization to −50 mV is in Fig. 14 (C channels are represented by squares, or circles when inactivated). At this potential, there are few V channel openings, most of which, being brief, fail to trigger any C channel activity. Occasionally, a longer opening, or coincident openings of neighboring V channels, will cause the opening of a C channel. This usually triggers a regenerative wave of C channel openings, which propagates along the couplon in both directions, until stopped by a random C channel inactivation event. These individual regenerative events are large but brief, being terminated by inactivation, and they are infrequent and spread out in time so that, in the ensemble average, they produce only a small, somewhat broad, transient release peak. Repeated triggering events find some parts of the array still inactivated, and have a lower probability of exciting a regenerative event. When they occur, such events are also smaller than those occurring in a “virgin” couplon. Eventually, a steady state balance is reached between rare, regenerative events that inactivate more C channels, and repriming of the C channels during the intervals between these events. This accounts for the plateau phase of release, and results in a state in which the array consists of a dynamic mosaic of excitable patches, separated by “firebreaks” of inactivated C channels.
A result of conditioning is therefore to reduce the excitable patch length; the larger the conditioning voltage, the smaller the excitable patch length. As shown in Fig. 13, reducing couplon length (or excitable patch length) diminishes the peak relative to the plateau (Fig. 13 A), and shifts the threshold voltage required to produce a substantial peak to more positive values (Fig. 13, B and C). Thus is generated one of the ingredients of the quantal release pattern: the higher the conditioning voltage, the higher the test voltage required to elicit a release peak (Fig. 13 B). This occurs because the peak is generated by synchronous recruitment of all the channels in many excitable patches; the shorter the excitable patches, the higher the voltage required to guarantee that a V channel opening will “hit” in almost every excitable patch. Another ingredient is the approximate constancy of the suppression (the reduction in test release peak, induced by a conditioning) at all test voltages. Fig. 13 B shows that the reduction in couplon length (or excitable patch length) causes an almost parallel shift of the voltage dependence of peak release to higher voltages. This implies that a conditioning pulse, which reduces the excitable patch length, will cause a reduction in peak of about the same magnitude at all test voltages.
To make quantal behavior possible, the crucial property of the model is that C channel activation takes the form of regenerative events that are locally triggered. When the array has been broken up into isolated patches, a given C channel can only be opened if a triggering V channel event happens to hit in its patch. As a result of this “target area” effect, the probability per unit time of opening of a given C channel depends on the number of other C channels available. This effect is the main reason that Markovian models of the single channel are inadequate (the responsivity of the C channel depends on the size of the surrounding patch). This effectively gives the channel access to “analog” information about the size of the previous conditioning pulse that is stored in the array as a whole. Quantal behavior in the model is therefore a collective, mesoscopic phenomenon, depending on the presence of a moderate number of stochastically coupled channels and on the linear geometry of the array, which favors the termination of unifocally triggered regenerative events before they have excited the entire collection of C channels. As discussed by Pizarro et al. (1997), there are heterogeneous channel population models and homogeneous channel memory models that explain quantal release. The couplon model provides a third explanation, in which the system has memory (of the size of the conditioning depolarization) not stored in any one channel, but in the fraction and distribution of inactivated channels in the array as a whole.
Effect of diffusible buffers.
We simulated the effects of a buffer with the fast reactivity of fura-2 (Fig. 15). There is uncertainty regarding kinetic properties of dyes inside cells, where they are largely bound to protein components (Zhao et al., 1996). It is not known to what extent these dyes penetrate into the junctional cleft, and to what extent their diffusion there is limited by binding and tortuosity factors. For the simulations, we assumed that fura-2 was present at a concentration of 3 mM, and that all of it reacted with free solution kinetics, k on = 5 × 10⁸ M−1 s−1 (Naraghi and Neher, 1997), and K d = 180 nM (Grynkiewicz et al., 1985). The diffusion coefficient was taken to be 10 μm2 s−1, which is comparable with values observed experimentally for calcium indicators in muscle myoplasm (Harkins et al., 1993).
Figure 15.
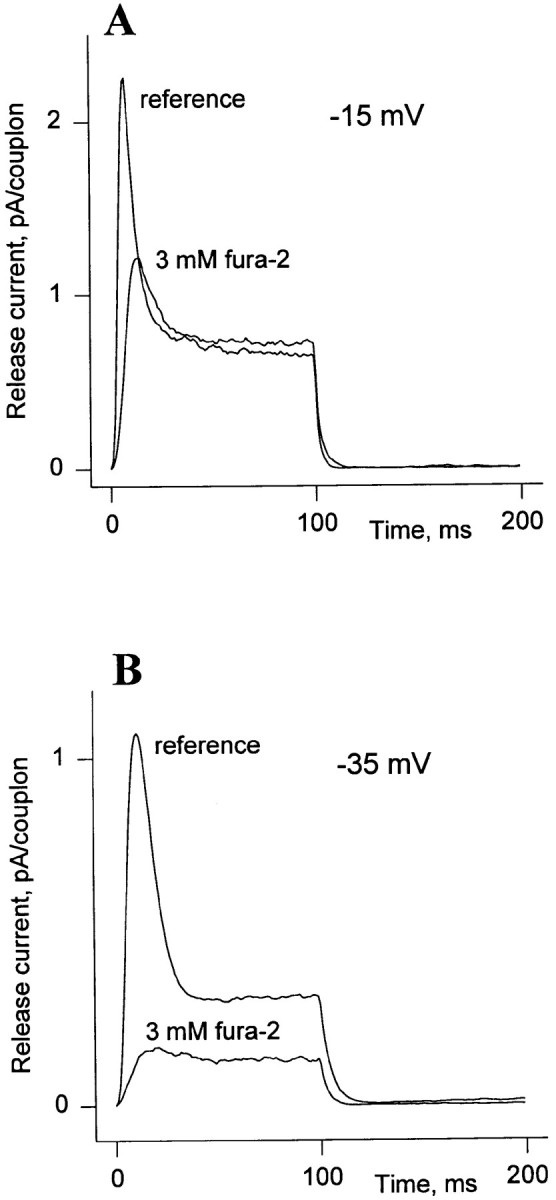
Simulation of the effects of 3 mM fura-2 (28 channels/couplon, kinetic parameters in Table I). The diffusible buffer diminishes the peak of release more strongly than the plateau, and its effects can be partially overcome by depolarizing to a higher voltage.
The buffer suppressed both the peak and the plateau of release flux, but the peak was suppressed more, at lower concentrations of buffer, and could be completely abolished. The effect was partially reversed by depolarization to a higher voltage, which restored the plateau almost completely, leaving the peak partly suppressed. These features reproduce the qualitative pattern of fura-2 effects that we have observed experimentally. The onset of simulated buffer effects appeared to be rather abrupt as a function of concentration; consistent with the fact that the buffer is interrupting a (locally) regenerative process.
Fixed buffer effects.
In cardiac muscle, anionic phospholipids in the inner leaflet of the sarcolemma present a high density of low affinity Ca2+-binding sites (effective K d ≅ 1 mM, Post and Langer, 1992). If such sites are present at the triad junction of skeletal muscle, they might affect the operation of CICR. Steady state diffusion gradients are not affected by nondiffusible buffers, since the amount of calcium bound to the buffer is constant. However, fixed buffers might affect the validity of the steady state approximation by increasing the diffusional time constant. As a rough approximation, we modeled these binding sites as a fast, nonsaturable buffer, equivalent to an increase in the effective volume of distribution of Ca2+ per unit area of the junction. When this buffering factor was less than an order of magnitude, release flux computed by the dynamic diffusion algorithm was nearly indistinguishable from that computed assuming steady state diffusion (Fig. 16 A), confirming the applicability of the steady state diffusion approximation in the absence of buffers. Since the dynamic-diffusion calculation requires roughly 100-fold more computation time, most of our simulations were done using steady state diffusion.
Figure 16.
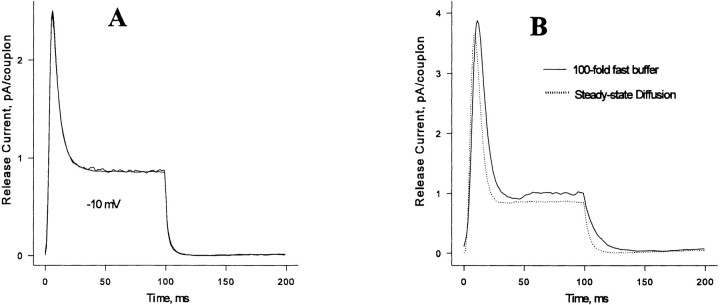
(A) Release flux from a 28-channel couplon computed by the steady state diffusion approximation or with time-dependent diffusion (superimposed). (B) Effect of fixed buffer on release flux from a 28-channel couplon pulsed to −30 mV. Details in text.
Fixed buffer equivalent to a 100-fold increase in Ca2+ distribution volume (roughly the amount proposed by Post and Langer, 1992) produced a modest effect on Ca2+ release, particularly at lower voltages (Fig. 16 B). Although the fixed buffer delayed the peak of release flux, it unexpectedly increased the amplitude of the peak. This is because fixed buffering has two contradictory effects. By buffering transient local [Ca2+] increases produced by openings of neighboring channels, buffer is expected to reduce CICR. However, by increasing the residence time of Ca2+ in the junctional cleft, fixed buffer makes it possible for a C channel to “see” the remnant of its own released Ca2+ after it has closed. To explore the latter effect, we constructed a simplified model consisting of a single C channel with only two states, closed and open, with an opening activated by two Ca2+ ions, and with the permeating Ca2+ flux entering into a single, open compartment containing the Ca2+ sensing site of the channel, which represents the junctional Ca2+ domain locally in equilibrium with fixed buffer (Fig. 17 A). As shown in Fig. 17 B, when Ca2+ permeation is turned on, it causes bursting of the channel even though the channel itself has only two states. This is due to reopening of the channel in response to the buffered pool of recently released Ca2+. In the full model, this process enhances CICR in the presence of fixed buffering sites. This shows that bursting behavior of a single channel cannot be taken as evidence regarding the gating scheme when the permeating ion can modulate the channel.
Figure 17.
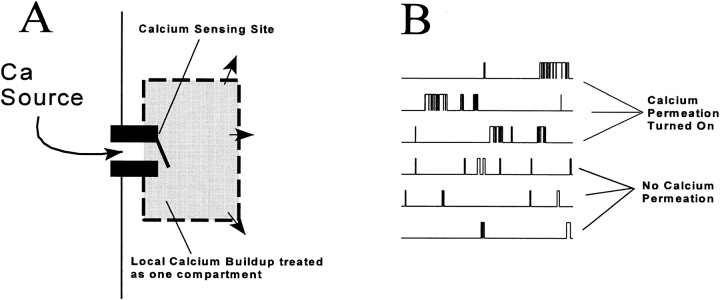
(A) Simplified one-channel model to demonstrate the effect of permeating Ca2+ on C channel gating. (B) Permeation of Ca2+, in the presence of fixed buffer sites, causes bursting of C channels because they can be reactivated by a residual Ca2+ microdomain, built up during the previous opening.
Discrete events.
As already seen with Fig. 14, the couplon model produces discrete activation events. Comparing discrete events generated by a stochastic model with observed Ca2+ sparks is difficult, because event selection issues dominate both theory and experiment. For the model, the question is what events to consider as sparks. We chose the strategy of simulating a junction at −70 mV under continuous observation for a prolonged period and collecting all events that included a C channel opening. This definition screens out the large number of brief V channel openings that do not trigger any CICR event, nearly all of which would be undetectable experimentally. To calculate a fluo-3 signal that could be compared with experiment, we then collected release flux in a time window from 10 ms preceding the event until 40 ms after its onset (defined as the first C channel opening), and integrated the fluo-3 transport equations for each of these events to determine the fluorescence that would have been observed.
For the experimental data, the selection problem is more difficult. The apparent amplitude and duration of a spark depend on its location relative to the scan line of the confocal microscope. Ca2+ release events are localized at the Z line (actually a plane) where the triads are found. With a confocal scan line parallel to the longitudinal fiber axis, the number of events expected increases with the area of the Z plane; that is, roughly proportionally with the square of the distance from the scan line. At the same time, the apparent “magnitude” of these events is expected to decrease rapidly with transverse displacement of the scan line from the center of release, as a result of fluo-3 diffusion and the enhanced spatial resolution of the confocal microscope. Under very general hypotheses, it can be shown that the distribution of detected spark amplitudes should be nonmodal, the number of small events increasing monotonically down to the limit of detection (E. Ríos and M.D. Stern, unpublished results). On the other hand, sparks are experimentally identified by eye, in combination with some simple objective criterion of amplitude and spatial or temporal extent. The sparks collected in this way, by different experimental groups, in either skeletal or cardiac muscle, generally show a clear modal amplitude distribution. The explanation for this state of affairs is unclear; when more automated methods of detecting sparks are employed, the number of small sparks counted increases, leading to a distribution more skewed to smaller amplitudes (H. Cheng, personal communication). It is possible, therefore, that the shape of the spark amplitude distribution is dominated by some kind of selection effect. As a practical matter, how to compare the statistics of computed events with those of observed sparks must be considered an unsolved problem. Here we present the statistics of fluorescence events as they would be observed when perfectly centered on the scan line, without any microscope distortion or aliasing by finite temporal sampling rate. Specifically, the amplitude is defined by averaging the fluo-3 fluorescence radially (not volume weighted) out to a distance of 1 μm from the release site, and over a 7-ms time window centered on the peak of the resulting function. The duration is defined as the full width at half magnitude (FWHM) of the radially integrated fluorescence as a function of time.
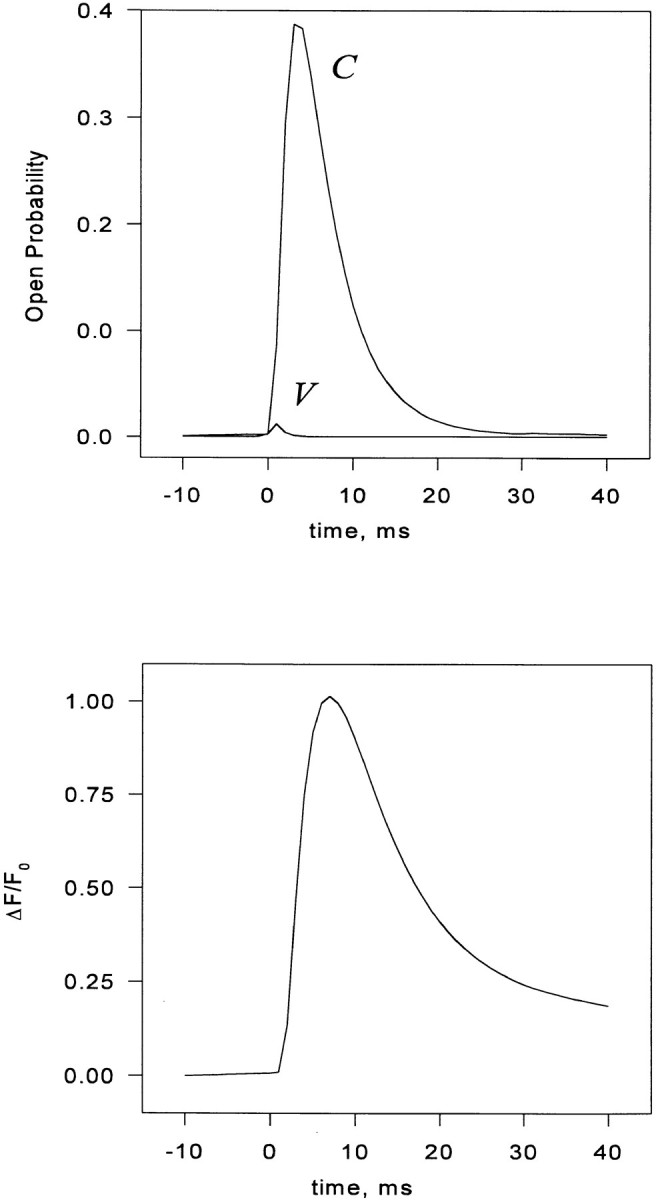
Histograms of amplitude and duration of 10,000 C channel events at a holding potential of −70 mV, for a 28-channel couplon with the same model parameters used in the calculations of voltage dependence and quantal release above, are shown in Fig. 18. About one third of C channel events are very small and brief, probably corresponding to a single opening that fails to cause regenerative CICR. The remainder have a broad, skewed, modal distribution of “true” amplitudes, extending to sizable values of F/F 0 (spark fluorescence normalized to background fluorescence), that for this couplon size are not much greater than those observed experimentally. Couplons of 60 channels give instead sparks with a mode of F/F 0 at about three. Fig. 19 shows the ensemble-averaged V and C release fluxes, and the ensemble average of fluo-3 fluorescence as a function of time. Note that ensemble averaging synchronized by the detection event (first C channel opening) has resolved a correlated component of V release that begins before the index event and peaks at t = 0; this is the ensemble average of those V channel events that triggered the detected C channel openings. No such precise synchronization of the onset times of sparks is possible experimentally.
Figure 18.
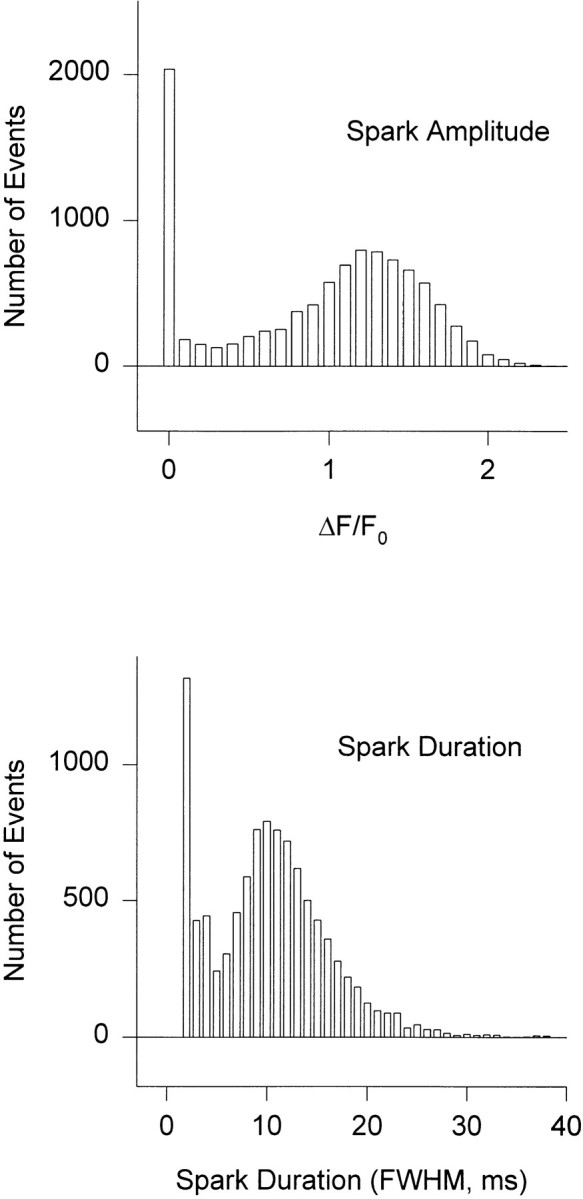
Histogram of event amplitudes (top) and durations (bottom) at −70 mV. 28-channel couplon with other parameters given in Table I.
Figure 19.

(top) V and C channel release flux, ensemble averaged over 10,000 events, identified by the opening of a C channel. The beginning of the C channel opening defines time 0. (bottom) Fluo-3 fluorescence, ensemble averaged over the same set of events.
Effects of global calcium dynamics.
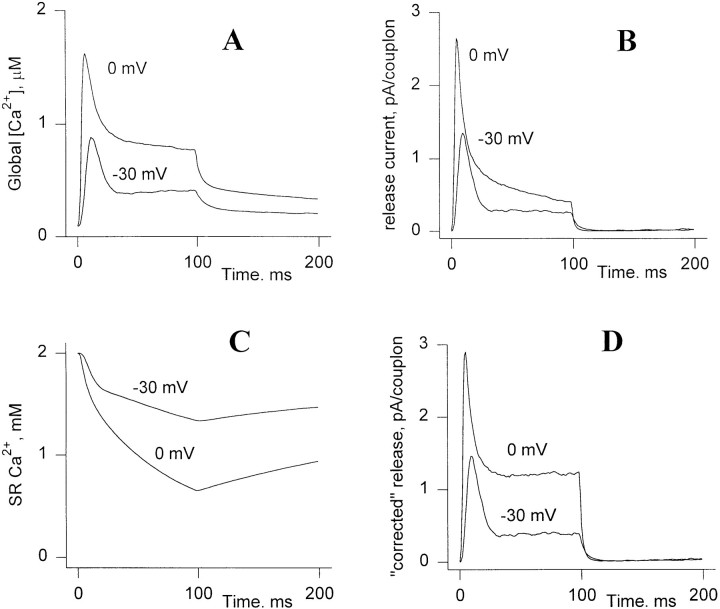
The simulations shown above were all done neglecting the dynamics of the global myoplasmic and SR calcium pools. Short of a full consideration of such dynamics, which would involve the introduction of many new processes and their corresponding parameters, we present here an example of such a computation. This simulation confirms that global effects can be largely ignored, while at the same time showing how they may become important at extremes of SR depletion.
The dynamics of the model (28 channels/couplon) were computed using the steady state simulation as above, except that the global myoplasmic [Ca2+] used in computing the boundary condition at the edge of the couplon was determined dynamically, using the ensemble-averaged couplon release as source, and the removal model of Brum et al. (1988a). This model (used here with parameters as in Fig. 2 of González and Ríos, 1993) describes Ca2+ removal from the myoplasmic solution, including the effects of EGTA, troponin, parvalbumin, Mg:parvalbumin, and the SR Ca2+ pump. The unitary currents were made proportional to SR calcium content, which was, in turn, dynamically determined by the balance between couplon release and SR uptake. Based on evidence and arguments of Shirokova and Ríos (1996), as well as for simplicity, any intraluminal diffusion delay between uptake and releasable pools was neglected. The density of couplons was 4.8 μm−3 (calculated multiplying the average area density of junctional t-tubules in a Z disk, as computed on an image of Peachey and Eisenberg, 1978; and the number of Z disks per unit length in a slack fiber).
Fig. 20 shows the results of such a computation, for pulses to −30 and 0 mV, starting from an intra-SR calcium content equivalent to 2 mM in accessible myoplasmic water. Most importantly, the couplon arrays at this physiologic density are stable, as they should be, in spite of the feedback due to the presence of global myoplasmic [Ca2+]. At −30 mV, couplon release flux is similar to that computed from the model neglecting global Ca2+ dynamics. At 0 mV, on the other hand, as observed experimentally, there is an obvious decay of the “plateau” phase of the release curve, due to SR depletion. However, when the release flux is corrected à la Schneider et al. (1987) for the effect of depletion normalizing by remaining SR calcium content, the resulting curves (Fig. 20 D) are similar to those obtained from the local model (and to experimental observations after depletion correction). This is, however, somewhat fortuitous; it depends on the fact that ensemble-averaged C channel open probability is relatively insensitive to the magnitude of the unitary currents over this range, because of compensating effects on local feedback gain and local Ca2+-dependent inactivation. For smaller values of starting SR calcium content, the reduction of positive feedback dominates, so that the “corrected” release flux remains decreasing in the plateau region (not shown). This implies that the practice of fitting estimated initial SR calcium content to obtain a horizontal plateau (Schneider et al., 1987), is adequate in many cases but not generally justifiable in the context of the couplon model.
Figure 20.
Release computations incorporating the effects of SR depletion and global cytosolic calcium. (A) Global cytosolic [Ca2+] during depolarizations to two voltages. (B) Ca2+ release current, showing at the higher voltage a slow decaying phase, due to SR depletion during the pulse. (C) SR calcium content during the two pulses, expressed as equivalent concentration in accessible myoplasmic water. (D) Release corrected for depletion; i.e., divided by the fraction of SR calcium content remaining. The qualitative features of the corrected release are similar to the results of the model when the global calcium pool is neglected (e.g., Fig. 1).
DISCUSSION
Ca2+ release channels at the skeletal muscle triad junction are clustered into dense one-dimensional arrays. Therefore, for Ca2+-induced Ca2+ release to play a role in E–C coupling, the physiology of the junction must involve complicated stochastic interactions among release channels and Ca2+ microdomains. We have developed a numerical technique to simulate such systems and applied these methods to a simplified model of the triad junction proposed by Ríos and Pizarro (1988). While the present simulations tackle complicated interactions among channels that had never been considered quantitatively before, they are still naive in assuming a simplified gating scheme for the release channels, omitting such factors as competition of Mg2+ for Ca2+ binding sites on the channel and the effects of electric fields within the electrical double layers at the junction, and simplifying the ultrastructural anatomy in computationally convenient ways. There is nothing, save increased computation time, to prevent all these aspects from being included, but to do so would involve a large number of choices, most of them arbitrary at this time. Consequently, the model has not been objectively “fitted” to data, and little weight should be placed on the values of the parameters that reproduce the experimental observations. In the following, we discuss in greater detail the basis for some of the qualitative and quantitative aspects of the model, as well as their significance.
Regenerative Property
When this model was originally proposed in 1988, it was assumed that the V channels release Ca2+ in response to the voltage sensors, and the released Ca2+ triggers further release from the immediately adjacent C channels. The interaction among C channels themselves was not specified. The same idea, that the C channels can be considered in isolation, appears in more recent presentations of these schemes (Klein et al., 1996). The best parameters in the present implementation describe a regime in which the C channel array is highly regenerative. We do not know if this is a necessary feature of the model. Certainly, the uniqueness of the parameters is not established, as there is a large parameter space to be explored. But within the basic model structure it is very difficult to achieve a high peak/plateau ratio in a nonregenerative way. The significance of this is enhanced by another finding from our simulations, that a highly regenerative regime is perfectly compatible with tight control of macroscopic release by voltage, and with gradation of inactivation (the quantal property) by the conditioning voltage. This is because much of the gradation and detailed control arises by statistical recruitment of individually regenerative release events. Even with 60 channels, the linear junction does not behave like a macroscopic excitable medium.
Unitary Currents
The use of a 3:1 ratio of C to V channel unitary current was made to permit large values of the peak/plateau ratio. The relationship among these parameters can be understood by reference to an idealized “maximally regenerative” model. In this model, the opening of any V channel triggers an instantaneous regenerative opening of all C channels, which then close within a short time by inactivation. Then the largest possible ratio of ensemble-averaged C to V release will be roughly the ratio of the amounts of calcium released during one of these events, which is
 |
3 |
where nC is the number of C channels, iC and iv are the unitary currents, τC is the duration of the regenerative C event (roughly the inactivation time), and τv is the duration of a V opening. The inactivation time is constrained above by the fairly short duration of the observed release transient, so the only way to increase the maximum peak/plateau ratio is to increase the number of C channels, to speed up the V channel kinetics, or to increase the ratio of unitary currents. For the actual model, the peak/plateau ratio falls well short of the limiting value given by Eq. 3, largely because of the contribution of noninactivated C channels to the plateau. Interestingly, at very negative potentials, the openings of V channels become very brief, so that Eq. 3 is no longer a significant constraint, and the C channel release dominates the plateau. The variable incidence of C channel flux on the steady release clearly discredits one of the hypotheses of the Ríos and Pizarro model, that the plateau reflects V channel activity.
The assumption of unequal V and C channel unitary currents could probably be avoided by taking greater liberties with the structure of the V channel model, or by permitting unequal numbers of V and C channels. It is noteworthy that ligand-binding studies have not demonstrated in any species the 1:2 stoichiometry between voltage sensors and release channels indicated by ultrastructural data and assumed here, but have generally shown an excess of ryanodine binding sites (reviewed by Shirokova et al., 1996). The location and function of these possible extra release channels has not been determined.
Ca2+ Sites
The effective dissociation constant of the activating site of the C channel was 10 μM, which is in the range expected from lipid bilayer data (Meissner, 1994), while the K d for inactivation, also 10 μM, is one or two orders of magnitude lower than in bilayers. This is of little concern, because the rate of Ca2+ inactivation of a channel is likely to be dominated by the Ca2+ released by that same channel, and the associated concentration could be much larger if the inactivating site lay close to a release pore. The choice of parameter values of the Ca2+ channel binding sites was made even less significant by the omission of Mg2+ as a competitive ligand at both sites.
The model was also kept simple by assuming V channels to be neither activated nor inactivated by Ca2+. The absence of inactivation is required to maintain a plateau of release, which, in spite of not being solely contributed by V channels, does derive its constancy from the sustained V flux. The absence of activation by Ca2+ is at this time a matter of modeling convenience, and there is some evidence to the contrary in bilayer experiments (Tripathy and Meissner, 1996).
What is the use of such a model? Insofar as it succeeds in reproducing the salient features of the experimental data, it shows that these features could be explained by mechanisms of this type, and may be a consequence of the simple features included. In this regard, as shown by the comparisons above, the model succeeds much better than what could have been expected. Additionally, by examining the individual realizations generated by the simulation, and by generating statistics not experimentally accessible, one gains an intuitive understanding of how the model duplicates the experimental phenomena. Despite the considerable experience of the authors with models of E–C coupling, many of the properties of this model were discovered serendipitously and “explained” after the fact. This shows that the properties of such mesoscopic systems are difficult to intuit from single-channel reasoning, and that the effort to do so is likely to miss or distort important collective phenomena. Thus, while the success of the model does not prove that its explanations of the experimental phenomena are the correct ones, it suggests that any alternative explanations must consider interactions within an array of channels.
The phenomenon of quantal release (Pizarro et al., 1997) is a case in point. The most direct explanation of the experimental data is that “release units” are widely heterogeneous in their responses to voltage. If this heterogeneity were at the level of the voltage sensor, it would conflict with everything known about voltage- operated channels. Our simulations show that quantal behavior can be produced as a collective phenomenon of arrays of interacting channels, which we did not suspect a priori. The way in which the model approximates quantal release depends upon the nonlinear relationship between the distribution of inactivated channels, which reduces excitable patch length, and the “threshold” for triggering a regenerative release. It also appears to depend upon the fact that the topology of the array is one-dimensional (or singly connected), which permits highly regenerative events to self-extinguish before all excitable channels have been consumed. The quantal release properties predicted by this model are therefore probably not robust upon parameter changes. The model does show, however, that there is an explanation that does not invoke any ad hoc mechanism. Any alternative explanation of quantal behavior must now be shown to work in the context of interacting channel arrays.
The couplon model suggests new and unexpected features not limited to quantal behavior. For example, a second ryanodine receptor isoform (RyR3, Giannini et al., 1992; Hakamata et al., 1992) is present in mammalian skeletal muscle at a comparatively minor density. It is relevant to point out that a minor isoform may disproportionately alter the E–C coupling function, provided that its responsiveness is lower, by interrupting the regenerative propagation within the couplon as it reduces the length of excitable patches.
It is likely that the best tests of the type of models presented here will come from comparing predictions to observations of microscopic Ca2+ release. The latter can directly probe the stochastic processes, critical to the model, providing independent constraints on model parameters, and tests sensitive to features that do not prominently affect macroscopic release flux (e.g., the details of V channel gating at very negative potentials). Microscopic observations may require revisions of the model, but are unlikely to change our main conclusion, that the basic unit of E–C coupling is the interacting array of release channels. This, after all, is already implied strongly by the ultrastructure of skeletal muscle.
Acknowledgments
We are grateful to Natalia Shirokova (Rush University, Chicago, IL), Alexander Tsugorka (Bogomoletz Institute, Kiev, Ukraine), and Heping Cheng (National Institute of Aging, Baltimore, MD) for allowing us to use their unpublished work; to Feliciano Protasi and Clara Franzini-Armstrong (University of Pennsylvania, Philadelphia, PA) for determining the distribution of junctional unit lengths in frog muscle, and to all of the above for helpful discussions.
APPENDIX
Mathematical Implementation of Stochastic and Deterministic Simulations
Monte Carlo algorithm for steady state diffusion.
The operation of the simulation algorithm is explained first for the case in which local [Ca2+] is assumed to be in steady state during the interval between channel gating events, and no diffusible buffer is present. In this case, the system is a true Markov process, and the simulation method is similar to the method of Gillespie (1976), using particular computational optimizations because of the large size of the system. The method for the more general case, which has not, to our knowledge, been described before, is presented in the following section. In any given macrostate, the local [Ca2+]i at any point in the junctional cleft, and, in particular, near the Ca2+ binding sites of the C channels, is a linear superposition of contributions from whichever channels are open in that macrostate. The diffusional coupling coefficients depend only on the geometry and can be determined once and for all by solving a linear, steady state diffusion problem.
Once these coefficients are in hand, the system is initialized in a starting macrostate (generally the one with all channels in the resting, closed state), simulated time (t) is initialized to zero, and the array of local [Ca2+] is initialized to the resting cytosolic value (10−7 M). The basic Monte Carlo time-step loop is then entered. For a true Markov process, the dwell time in any given macrostate is exponentially distributed with a mean life time 1/r tot, where r tot is the sum of the rates of all possible transitions leaving that macrostate; i.e., the double sum in parentheses in Eq. 2. Using the value of the membrane potential V(t) and the array of local Ca2+ concentrations, each single channel rate that contributes to r tot is evaluated from the single channel gating scheme of the V or C channel.
For example, if we assume a simplified model, with two V channels, each with four states: C0, C1, O0, O1, where the letter indicates closed (C) or open (O) and the number indicates the state of the allosterically coupled voltage sensor, and two C channels with the four states shown in Fig. 8, then there are 44 = 256 macrostates, one of which would be (C0,O1,C,C), with the second V channel open. The possible macrostates reachable from this state are (C1,O1,C,C), (O0,O1,C,C), (C0,O0,C,C), (C0,C1,C,C), (C0,O1,O,C), (C0,O1,CI,C), (C0,O1,C,O), and (C0,O1,C,CI). The transition rate to the state (C0,O1,O,C), which involves opening of the first C channel, has a value of k o (iVdV2C1 + [Ca2+]cyto)2, where iV is the V channel unitary current and dV2C1 is the diffusional coupling coefficient from the second V channel to the first C channel. The cumulative sums of these rates (for the full model) are tabulated in an array R as the program loops successively through all accessible transitions of each of the channels. The final sum is r tot. The dwell time of the macrostate is then chosen as an exponentially distributed random variable by means of the transformation
 |
4 |
where r is a random number uniformly distributed between 0 and 1. The contribution of the current macrostate dwell is then added into the accumulating ensemble averages of output variables (e.g., C and V channel open probabilities, total release flux, etc.), making a contribution to each time bin of these averages in proportion to the fraction of the time bin spent in that macrostate. The time variable is then advanced to the time of the next macrostate transition, t + Δt.
Next, the destination macrostate of that transition is determined as follows. The new macrostate is reached by changing the state of one of the individual channels. The probability that a particular transition s → s′ occurs is equal to rss ′/r tot. A new uniform random number r is generated, and the transition is chosen with the correct probability by locating from the list of all the possible transitions (indexed by j) the one for which R(j) < rr tot < R(j + 1), where R is the monotonically increasing array of tabulated partial sums of transition rates previously saved. The required index j is located rapidly from among the (up to) 150 possibilities by a bisection method (note that the order in which the partial sums were accumulated in the array R is immaterial, as long as one keeps track of which transition corresponds to a particular index j in the array). The operation of this step may be most easily visualized by thinking of r tot as a line segment made up of subsegments of length R(j) − R(j − 1), each corresponding to one possible transition. The number rr tot is a point dropped randomly onto this line segment, which has exactly the required probability of falling on the subsegment corresponding to any particular transition. Once the new macrostate has been selected, it replaces the current state. If the transition involved the opening or closing of a channel, the array of local Ca2+ concentrations is updated by adding or subtracting the appropriate column of the diffusional coupling matrix.
This basic time-step loop is then repeated until t has been advanced past the maximum time being simulated (typically 200 ms). Because of the stochastic nature of t, the number of time steps required will be different for each realization. The entire routine is iterated for a large number of realizations (typically 1,000–10,000) to accumulate reliable estimates of the ensemble-averaged output variables.
Monte Carlo algorithm for non–steady state diffusion.
Treating the diffusion of Ca2+ and/or Ca2+ buffers dynamically introduces two major complications. The first is that the partial differential equations governing Ca2+ transport, which are time-dependent and, in the presence of buffers, nonlinear, must be integrated (in some discretized form) at each Monte Carlo time step. This greatly increases the computational burden. The second complication is that the transition rates, which are functions of local [Ca2+], are no longer constant even while the system remains in a single macrostate. This means that the overall stochastic process is not a true memoryless Markov process, because the transition rates depend on information stored in the evolving Ca2+ distribution. In particular, the dwell time in a given macrostate is not exponentially distributed and depends on the prior history of the process. This could be dealt with by making the Monte Carlo time steps very small (compared with the shortest macrostate dwell time and the fastest time scale of the diffusion process), and then allowing a (tiny) chance for the channels to change state at each time step, while the diffusion equations are integrated. This was essentially the simulation method used for the original cardiac cluster bomb model (Stern, 1992a), but it is not very accurate and, for a large “stiff” system with dwell times ranging from microseconds to seconds, it would be so inefficient as to be impractical. Instead, we developed a transformation method that separates the deterministic (diffusion) and stochastic (channel state) parts of the problem and transforms the stochastic part to a problem equivalent to the one already dealt with above.
Let p(t) be the cumulative distribution of dwell times in a given macrostate S; i.e., the probability that the system remains in the macrostate S for a time longer than t . The decrease in p during the interval from t to t + dt is simply the probability that the system leaves S during that interval. This, in turn, is the product of p, the probability that the system, starting in macrostate s, remains in the same macrostate at time t, with the conditional probability that the system, in state S at t, makes a transition during dt, which is r tot · dt . The cumulative distribution p therefore obeys the differential equation
 |
5 |
The solution of Eq. 5 is
 |
6 |
where we suppose, for the moment, that r tot (t) is a known function. Now let x stand for the integral in the exponent
 |
7 |
Then the cumulative distribution of dwell time is simply
 |
8 |
.
Since r tot is always positive, x is a monotonically increasing function of t, so P is also the cumulative distribution of x. In other words, the function x(t) could be inverted to give t(x), which, when substituted into the distribution function of t, yields the distribution p(t(x)) given by Eq. 8, implying that x is an exponentially distributed random variable with unit mean. From Eq. 7, it follows that x obeys the differential equation
 |
9 |
.
We now consider x to be the independent variable and rewrite Eq. 9 as
 |
10 |
In this way, we have made an implicitly defined transformation from t to the independent variable x, which is exponentially distributed (the case that we already know how to handle). We choose a realization of x as an exponentially distributed random number of unit mean by the prescription x = −log(r), where r is, as before, a uniform random number in the unit interval, and calculate t, the time of the next macrostate transition, by integrating Eq. 10. In reality, r tot is not a known function of t. It is, instead, a complicated function of a system of variables yi that include the (discretized) junctional [Ca2+], buffers, and any other “analog” variables that participate in calcium dynamics. These variables satisfy a system of n differential equations
 |
11 |
obtained by discretizing the reaction–diffusion equations. Using Eq. 10, we can rewrite Eq. 11 with x as the independent variable
 |
12 |
where r tot is implicitly a function of the yi since it is a summation of available single-channel transition rates that depend, at the least, on local [Ca2+] values.
Eq. 12, together with Eq. 10, form an autonomous system of n + 1 differential equations that are integrated from x = 0 to x = −log(r). This advances t to the time of the next macrostate transition. The destination of that transition is determined, as before, by comparing individual transition rates rss ′ to rr tot, where r is a second uniform random number. Since the choice among competing transitions is made at the time that the transition actually occurs, the correct rates for the comparison are the ones evaluated at the transition time; i.e., at the end of the integration of the differential system (Eqs. 10 and 12). The new macrostate becomes the current state and the time-step loop is ready to be repeated. Integration of the differential system has automatically updated t and the local calcium variables.
For each realization, this algorithm requires hundreds or thousands of Monte Carlo time steps, each of which requires integration of a large system of differential equations. These equations are, in general, stiff, due to the range of different time scales present in a diffusion problem, the possibly large ratio of buffer concentration to free Ca2+, and the fact that the dwell times are often long compared with the time constants of the differential system (i.e., the diffusion problem is near steady state during much of the time). For the algorithm to succeed, the differential equation solver must be absolutely stable. We used the Gear implicit method (Gear, 1971) with adaptive step size and order (up to five). Because the sources of the diffusion equations change discontinuously each time a channel opens or closes, we found that it was more efficient to reinitialize the differential equation solver at each Monte Carlo step, rather than to carry over the accumulated estimates of derivatives, as would be done in integrating a smooth differential system. The computation time of the Gear differential equation solver is dominated by the computation and inversion of the jacobian matrix. This time was minimized by computing the jacobian analytically, and by the use of sparse matrix techniques taking advantage of the structure of the system of Eqs. 10 and 12.
Reaction–diffusion problem.
For the steady state diffusion model, the distribution of [Ca2+] in the junctional cleft was computed, with each channel, in turn, as source, using the Galerkin finite element method with adaptive gridding. The location on the RyR tetramer of the Ca2+ release site(s) is not known. For convenience, we treated Ca2+ release as a diffuse source spread over a 30-nm–diameter disk representing the foot process. It is possible that such diffuse release actually occurs, since the foot is known to be a porous structure (Orlova et al., 1996) and the assumption of release from a single pore requires a permeation model whose rate constants exceed the diffusion limit (Tinker, 1992). This diffuse release approximation probably does not greatly affect the coupling between distinct channels, but the contribution of released Ca2+ to local [Ca2+] at the activation and inactivation sites of the same C channel could be much larger than we calculated if the release is localized at a site close to the sensing sites. Since the actual location of these sites is unknown, we did not attempt to correct the coefficients coupling the calcium binding sites of a channel to its own release flux. The possible error in self-coupling may be partially compensated by the choice of affinities for the activation and inactivation sites of the C channel. These were selected empirically to give rough correspondence with the data. In particular, since the self calcium makes the largest contribution to the inactivation process, a smaller affinity at the inactivation site would be required if the self-coupling were larger.
A substantial fraction of the volume of the junctional cleft is occupied by the foot processes of the release channels. These are loosely packed polypeptides (Orlova et al., 1996) and it is not known to what extent they are permeable to Ca2+. Because of this and the other uncertainties in the geometry and Ca2+ transport properties of the junction, we considered it acceptable to treat the cleft as two-dimensional to simplify the diffusion computation. Free Ca2+ was assumed to diffuse throughout the cleft with a diffusion coefficient of 500 μm2 s−1 (free solution value 780, Wang, 1953). We considered the possibility that the effective Ca2+ distribution volume might be increased by a factor of up to 100 by the presence of high density, low affinity binding sites on the membranes bounding the cleft (Post and Langer, 1992). These fixed binding sites have no effect on the steady state diffusion problem, but were included in some of the computations done with time- dependent diffusion. Their effects were reassuringly small (see Fig. 16). We also carried out calculations that included a high affinity diffusible buffer (modeled as fura-2 or calcium green).
Peskoff et al. (1992) have treated the case of calcium transport at a two-dimensional cardiac junction. As boundary condition, they assumed that [Ca2+] attains the global cytosolic value at the edge of the junction. Three-dimensional computations with the finite element method show that this is not correct: there is a substantial diffusion resistance to the expansion of the [Ca2+] gradient from the edge of the cleft to “infinity” (Ríos and Stern, 1997). We approximated this effect by using the boundary condition that the diffusional flux escaping from the edge of the junction be proportional to the boundary concentration (for each diffusible species). The proportionality coefficient D was estimated by treating the edge of the junction as a line source, and requiring that the edge concentration be equal to the concentration produced by such a source at a distance equal to the height of the cleft, h = 15 nm. Since the steady state diffusion pattern for a line source of infinite length diverges logarithmically with distance, it was necessary to assume that the concentration reaches cytosolic background at some finite distance R max, which was taken as the length scale of the junctional strip (1 μm). This gives
 |
13 |
where D is the diffusion coefficient of the species in question.
For the case of dynamic diffusion, our geometrical approximations were even cruder. Rather than using the finite element method, the junction was partitioned into square compartments, each containing one channel, with the diffusion resistances between adjacent squares and from the boundary of the cleft to infinity lumped at the boundaries of the compartments. For a 60-channel array and one diffusible buffer, this method of discretization still requires integration of a system of 121 differential equations for each Monte Carlo time step. For comparison purposes, some of the static-diffusion simulations were done using coupling coefficients computed with this coarse discretization rather than the finite element method. The coarse grid gave a somewhat more rapid decay of the diffusional coupling coefficients with distance than did the full finite element calculation, but the difference is probably minor in comparison with the uncertainties in the location of release pores and Ca2+ binding sites on the channel. It should be emphasized that none of these approximations in the Ca2+ transport problem are intrinsic to the Monte Carlo algorithm itself. All of the approximations could be dispensed with by running the program on a supercomputer, if an improved knowledge of the ultrastructure warranted it.
Symbolic program template.
For computational efficiency, the Monte Carlo algorithm was constructed to minimize the need for subroutine calls in the innermost loops, and uses the channel states themselves as pointers to blocks of code that compute the transition rates leaving the current state as a function of local Ca2+. This avoids time wasted testing the state of each channel and summing the rates of nonexistent transitions, but it embeds the information that specifies the underlying physical model diffusely throughout the source code, requiring the program to be rewritten to accommodate any change in the gating schemes of the C and V channels. To hasten this process, the Monte Carlo algorithm was written as a program template in the symbolic algebraic language Macsyma. When run, this Macsyma program systematically prompts the user to enter the allowed transitions and transition rates of the V and C channel gating schemes in the form of symbolic algebraic expressions. It then uses this information to generate a FORTRAN program which, when compiled and run, carries out the simulation algorithm for this particular model.
Calcium transport equations.
All the computations above depend on reaction–diffusion or calcium-transport equations that describe the balance of Ca2+ and other relevant chemical species on various spatial and temporal scales. These are summarized here for reference (see Stern and Ríos, 1997).
The local balance of calcium in an infinitesimal volume, subject to diffusion and source and reaction fluxes is given by
 |
14 |
The fast buffer (representing low affinity binding sites) was assumed to be always in equilibrium with [Ca2+], and was, for convenience, approximated as being linear, so that the amount of calcium (moles/physical volume) bound to these buffers is B f [Ca2+], where B f is a constant. The net flux of calcium supplied by fast buffers is therefore
 |
15 |
so that Eq. 14 can be rearranged to
 |
16 |
Similar considerations give the transport equations for diffusible buffer species B (free buffer) and B:Ca (buffer bound to calcium)
 |
17 |
 |
18 |
where the diffusion coefficient of both buffer species has been assumed to be the same and slow buffer flux stands, in all cases, for the net flux of the calcium binding reaction, in the direction of dissociation
 |
19 |
Since the diffusion coefficients of free and bound buffer are assumed to be equal, one can add Eqs. 17 and 18 to show that the total amount of buffer satisfies a homogeneous Fick diffusion equation. Since there are no sources of buffer (on the time scale of interest), this means that total buffer BT is constant in space and time, which allows Eq. 17 to be eliminated by the substitution [B] = B T − [B:Ca].
The above transport equations are solved, in different approximations, on several different length scales. In the junctional cleft, sources represents the instantaneous local release flux of calcium from whichever release channels are open; pumps are neglected (consistent with the fact that the pump is located mainly in the nonjunctional cisternal membrane and longitudinal tubules), and the variables are assumed to be independent of position in the direction of the height of the cleft. The effect of events outside the cleft is summarized by a resistive boundary condition at the edges of the cleft, as discussed above. When diffusible buffers are not present in high concentration, the time derivatives are neglected (steady state approximation), giving a constant distribution of [Ca2+] in the cleft during the dwell time in any one macrostate.
For the computation of spark fluorescence, the couplon is treated as a point source of calcium, and the reaction–diffusion equations are solved in spherically symmetrical geometry extending 3 μm from the source. Within the couplon itself, the buffer-free steady state approximation is used, which is justifiable since the concentration of dye used to observe sparks is generally only 50–100 μM, and necessary to compute a statistically meaningful number of sparks in an acceptable time. For convenience, uptake by the SR pump was neglected in the spark computations; its contribution to the dissipation of sparks is small compared with diffusion (H. Cheng and G. Smith, personal communication).
In all of the above cases, the local and global balance between release and reuptake of SR calcium was ignored; global cytosolic and luminal [Ca2+] were assumed constant, the local recirculation of calcium from the longitudinal to the cisternal SR was ignored, and the back-reaction of local cytosolic calcium (in the inner region of the spark) on the couplon was accounted for, roughly, by the resistive boundary condition at the edges of the couplon.
The neglected effects of SR calcium transport fall into three classes. (a) Local diffusion gradients within the SR of a single channel are probably of little significance; they should be comparable in absolute magnitude to the gradients within the junction, which are a small fraction of the luminal [Ca2+]. (b) Local depletion of the SR stores of individual couplons may need to be considered more carefully in future versions of the model; experimental results (Shirokova and Ríos, 1996) show that the SR pool is well mixed in the time scale of junctional events. (c) Global dynamics of cytosolic and luminal [Ca2+] need to be considered for quantitative results at large depolarizations lasting more than tens of milliseconds. As shown in results, we have performed example computations incorporating the effects of global cytosolic [Ca2+] and SR depletion, which show that there are no unexpected qualitative effects when the SR calcium load is normal at the start of a depolarization.
Footnotes
M.D. Stern was supported in part by grants from the National Heart, Lung and Blood Institute, and National Institute of Arthritis and Musculoskeletal and Skin Diseases (NIAMS), G. Pizarro by a grant from the Consejo Nacional de Investigaciones Científicas y Técnicas, Uruguay, and E. Ríos by grants from the Muscular Dystrophy Association, the American Heart Association, and NIAMS.
Abbreviations used in this paper: CICR, Ca2+-induced Ca2+ release; DHPR, dihydropyridine receptor; RyR, ryanodine receptor; SR, sarcoplasmic reticulum; t-tubule, transverse tubule.
REFERENCES
- Adrian RH, Peres A. A gating signal for the potassium channel? . Nature (Lond) 1977;267:800–804. doi: 10.1038/267800a0. [DOI] [PubMed] [Google Scholar]
- Anderson K, Meissner G. T-tubule depolarization-induced SR Ca2+ release is controlled by DHP receptor and Ca2+-dependent mechanisms in cell homogenates from rabbit skeletal muscle. J Gen Physiol. 1995;105:363–384. doi: 10.1085/jgp.105.3.363. [DOI] [PMC free article] [PubMed] [Google Scholar]
- Baylor SM, Chandler WK, Marshall MW. Sarcoplasmic reticulum calcium release in frog skeletal muscle fibers estimated from arsenazo III calcium transients. J Physiol (Camb) 1983;344:625–666. doi: 10.1113/jphysiol.1983.sp014959. [DOI] [PMC free article] [PubMed] [Google Scholar]
- Blatter LA, Hüser J, Ríos E. Sarcoplasmic reticulum Ca2+ release flux underlying Ca2+sparks in cardiac muscle. Proc Natl Acad Sci USA. 1997;94:4176–4181. doi: 10.1073/pnas.94.8.4176. [DOI] [PMC free article] [PubMed] [Google Scholar]
- Blatter LA, Tsugorka A, Shirokova N, Ríos E. Eager triads in skeletal muscle: heterogeneous distribution of voltage-elicited Ca2+release revealed by confocal microscopy. Biophys J. 1996;70:A235. [Google Scholar]
- Block BA, Imagawa T, Campbell KP, Franzini-Armstrong C. Structural evidence for direct interaction between the molecular components of the transverse tubule/sarcoplasmic reticulum junction in skeletal muscle. J Cell Biol. 1988;107:2587–2600. doi: 10.1083/jcb.107.6.2587. [DOI] [PMC free article] [PubMed] [Google Scholar]
- Brum G, Ríos E, Stefani E. Effects of extracellular calcium on the calcium movements of excitation contraction coupling in skeletal muscle. (Appendix by G. Brum, E. Rios, and M.F. Schneider.) . J Physiol (Camb) 1988;398:441–473. doi: 10.1113/jphysiol.1988.sp017052. [DOI] [PMC free article] [PubMed] [Google Scholar]
- Cheng H, Cannell MB, Lederer WJ. Calcium sparks: elementary events underlying excitation–contraction coupling in heart muscle. Science (Wash DC) 1993;262:740–744. doi: 10.1126/science.8235594. [DOI] [PubMed] [Google Scholar]
- Csernoch L, Jacquemond V, Schneider MF. Microinjection of strong calcium buffers suppresses the peak of calcium release during depolarization in frog skeletal muscle fibers. J Gen Physiol. 1993;101:297–333. doi: 10.1085/jgp.101.2.297. [DOI] [PMC free article] [PubMed] [Google Scholar]
- Dettbarn C, Gyorke S, Palade PT. Many agonists induce “quantal” Ca2+release or adaptive behavior in muscle ryanodine receptors. Mol Pharmacol. 1994;46:502–507. [PubMed] [Google Scholar]
- Dey SK, Klein MG, Schneider MF. SR calcium release determination in quin-2 buffered frog cut skeletal muscle fibers. Biophys J. 1996;70:A166. [Google Scholar]
- Endo M, Tanaka M, Ogawa Y. Calcium induced release of calcium from the sarcoplasmic reticulum of skinned skeletal muscle fibres. Nature (Lond) 1970;228:34–36. doi: 10.1038/228034a0. [DOI] [PubMed] [Google Scholar]
- Fabiato A. Time and calcium dependence of activation and inactivation of calcium-induced release of calcium from the sarcoplasmic reticulum of a skinned canine cardiac Purkinje cell. J Gen Physiol. 1985;85:247–289. doi: 10.1085/jgp.85.2.247. [DOI] [PMC free article] [PubMed] [Google Scholar]
- Ford LE, Podolsky RJ. Regenerative calcium release within muscle cells. Science (Wash DC) 1970;167:58–59. doi: 10.1126/science.167.3914.58. [DOI] [PubMed] [Google Scholar]
- Franzini-Armstrong C. Ryanodine receptors of striated muscles: a complex channel capable of multiple interactions. Physiol Rev. 1997;77:699–729. doi: 10.1152/physrev.1997.77.3.699. [DOI] [PubMed] [Google Scholar]
- Franzini-Armstrong C, Jorgensen AO. Structure and development of E–C coupling units in skeletal muscle. Annu Rev Physiol. 1994;56:509–534. doi: 10.1146/annurev.ph.56.030194.002453. [DOI] [PubMed] [Google Scholar]
- Franzini-Armstrong C, Nunzi G. Junctional feet and particles in the triads of a fast-twitch muscle fibre. J Muscle Res Cell Motil. 1983;4:233–252. doi: 10.1007/BF00712033. [DOI] [PubMed] [Google Scholar]
- Gear, C.W. 1971. Numerical Initial Value Problems in Ordinary Differential Equations. Prentice-Hall, Englewood Cliffs, NJ.
- Giannini G, Clementi E, Ceci R, Marziali G, Sorrentino V. Expression of a ryanodine receptor-Ca2+channel that is regulated by TGF-β. Science (Wash DC) 1992;257:91–94. doi: 10.1126/science.1320290. [DOI] [PubMed] [Google Scholar]
- Gillespie DT. A general method for numerically simulating the stochastic time evolution of coupled chemical reactions. J Comp Phys. 1976;22:403–434. [Google Scholar]
- González A, Ríos E. Perchlorate enhances transmission in skeletal muscle excitation–contraction coupling. J Gen Physiol. 1993;102:373–421. doi: 10.1085/jgp.102.3.373. [DOI] [PMC free article] [PubMed] [Google Scholar]
- Grynkiewicz G, Poenie M, Tsien RY. A new generation of Ca2+indicators with greatly improved fluorescence properties. J Biol Chem. 1985;260:3440–3450. [PubMed] [Google Scholar]
- Gyorke S, Fill M. Ryanodine receptor adaptation: control mechanism of Ca2+-induced Ca2+release in heart. Science (Wash DC) 1993;263:986–988. doi: 10.1126/science.8387229. [DOI] [PubMed] [Google Scholar]
- Hakamata Y, Nakai J, Takeshima H, Imoto K. Primary structure and distribution of a novel ryanodine receptor/calcium release channel from rabbit brain. FEBS Lett. 1992;312:229–235. doi: 10.1016/0014-5793(92)80941-9. [DOI] [PubMed] [Google Scholar]
- Harkins AB, Kurebayashi N, Baylor SM. Resting myoplasmic free calcium in frog skeletal muscle fibers estimated with Fluo-3. Biophys J. 1993;65:865–881. doi: 10.1016/S0006-3495(93)81112-3. [DOI] [PMC free article] [PubMed] [Google Scholar]
- Jacquemond V, Csernoch L, Klein M, Schneider MF. Voltage-gated and calcium-gated calcium release during depolarization of skeletal muscle fibers. Biophys J. 1991;60:867–873. doi: 10.1016/S0006-3495(91)82120-8. [DOI] [PMC free article] [PubMed] [Google Scholar]
- Jong D-S, Pape PC, Chandler WK, Baylor SM. Reduction of calcium inactivation of sarcoplasmic reticulum calcium release by fura-2 in voltage-clamped cut twitch fibers from frog muscle. J Gen Physiol. 1993;102:333–370. doi: 10.1085/jgp.102.2.333. [DOI] [PMC free article] [PubMed] [Google Scholar]
- Keizer J, Levine L. Ryanodine receptor adaptation and CICR-dependent Ca2+oscillations. Biophys J. 1996;71:3477–3487. doi: 10.1016/S0006-3495(96)79543-7. [DOI] [PMC free article] [PubMed] [Google Scholar]
- Klein MG, Cheng H, Santana LF, Jiang Y-H, Lederer WJ, Schneider MF. Two mechanisms of quantized calcium release in skeletal muscle. Nature (Lond) 1996;379:455–458. doi: 10.1038/379455a0. [DOI] [PubMed] [Google Scholar]
- Lacampagne A, Lederer WJ, Schneider MF, Klein MG. Repriming and activation alter the frequency of stereotyped discrete Ca2+release events in frog skeletal muscle. J Physiol (Camb) 1996;497:581–588. doi: 10.1113/jphysiol.1996.sp021791. [DOI] [PMC free article] [PubMed] [Google Scholar]
- Ma J, Fill M, Knudson CM, Campbell KP, Coronado R. Ryanodine receptor of skeletal muscle is a gap junction-type channel. Science (Wash DC) 1988;242:99–102. doi: 10.1126/science.2459777. [DOI] [PubMed] [Google Scholar]
- Meissner G. Ryanodine receptor/Ca2+release channels and their regulation by endogenous effectors. Annu Rev Physiol. 1994;56:485–508. doi: 10.1146/annurev.ph.56.030194.002413. [DOI] [PubMed] [Google Scholar]
- Meissner G, Ríos E, Tripathy A, Pasek DA. Regulation of skeletal muscle Ca2+ release channel (Ryanodine receptor) by Ca2+and monovalent cations and anions. J Biol Chem. 1997;272:1628–1638. doi: 10.1074/jbc.272.3.1628. [DOI] [PubMed] [Google Scholar]
- Melzer W, Ríos E, Schneider MF. Time course of calcium release and removal in skeletal muscle fibers. Biophys J. 1984;45:637–641. doi: 10.1016/S0006-3495(84)84203-4. [DOI] [PMC free article] [PubMed] [Google Scholar]
- Melzer W, Ríos E, Schneider MF. A general procedure for determining calcium release in frog skeletal muscle. Biophys J. 1987;51:849–864. doi: 10.1016/S0006-3495(87)83413-6. [DOI] [PMC free article] [PubMed] [Google Scholar]
- Muallem S, Pandol SJ, Beeker TG. Hormone-evoked calcium release from intracellular stores is a quantal process. J Biol Chem. 1989;264:205–212. [PubMed] [Google Scholar]
- Nakai J, Dirksen RT, Nguyen HT, Pessah IN, Beam KG, Allen PD. Enhanced dihydropyridine receptor channel activity in the presence of ryanodine receptor. Nature (Lond) 1996;380:72–75. doi: 10.1038/380072a0. [DOI] [PubMed] [Google Scholar]
- Naraghi M, Neher E. In vitro binding kinetics of calcium chelators as revealed by temperature-jump relaxation. Biophys J. 1997;72:A367. [Google Scholar]
- Orlova EV, Serysheva II, van Heel M, Hamilton SL, Chiu W. Two structural configurations of the skeletal muscle calcium release channel. Nat Struct Biol. 1996;3:547–552. doi: 10.1038/nsb0696-547. [DOI] [PubMed] [Google Scholar]
- Pape PC, Jong D-S, Chandler WK, Baylor SM. Effect of fura-2 on action-potential stimulated calcium release in cut twitch fibers from frog muscle. J Gen Physiol. 1993;102:295–332. doi: 10.1085/jgp.102.2.295. [DOI] [PMC free article] [PubMed] [Google Scholar]
- Parker I, Zang WJ, Wier WG. Ca2+ sparks involving multiple Ca2+release sites along Z-lines in rat heart cells. J Physiol (Camb) 1996;497:31–38. doi: 10.1113/jphysiol.1996.sp021747. [DOI] [PMC free article] [PubMed] [Google Scholar]
- Peachey LD, Eisenberg BR. Helicoids in the T system and striations of frog skeletal muscle seen by high voltage electron microscopy. Biophys J. 1978;22:145–154. doi: 10.1016/S0006-3495(78)85480-0. [DOI] [PMC free article] [PubMed] [Google Scholar]
- Peskoff A, Post JA, Langer GA. Sarcolemmal calcium binding sites in heart. II. Mathematical model for diffusion of calcium release from the sarcoplasmic reticulum into the diadic region. J Membr Biol. 1992;129:59–69. doi: 10.1007/BF00232055. [DOI] [PubMed] [Google Scholar]
- Pizarro G, Shirokova N, Tsugorka A, Ríos E. “Quantal” calcium release operated by membrane voltage in frog skeletal muscle. J Physiol (Camb) 1997;501:289–303. doi: 10.1111/j.1469-7793.1997.289bn.x. [DOI] [PMC free article] [PubMed] [Google Scholar]
- Pizarro G, Csernoch L, Uribe I, Rodríguez M, Ríos E. The relationship between Q and Ca release from the sarcoplasmic reticulum in skeletal muscle. J Gen Physiol. 1991;97:913–947. doi: 10.1085/jgp.97.5.913. [DOI] [PMC free article] [PubMed] [Google Scholar]
- Post JA, Langer GA. Sarcolemmal calcium binding sites in heart. I. Molecular origin in “gas-dissected” sarcolemma. J Membr Biol. 1992;129:49–57. doi: 10.1007/BF00232054. [DOI] [PubMed] [Google Scholar]
- Pratusevich VP, Balke CW. Factors shaping the confocal image of the calcium spark in cardiac muscle cells. Biophys J. 1996;71:2942–2957. doi: 10.1016/S0006-3495(96)79525-5. [DOI] [PMC free article] [PubMed] [Google Scholar]
- Ríos E, Stern MD. Calcium in close quarters: microdomain feedback in excitation–contraction coupling and other cell biological phenomena. Annu Rev Biophys Biomol Struct. 1997;26:47–82. doi: 10.1146/annurev.biophys.26.1.47. [DOI] [PubMed] [Google Scholar]
- Ríos E, Shirokova N, Pizarro G. Suppression of Ca release in skeletal muscle fibers by high affinity Ca indicators is voltage dependent. Biophys J. 1994;66:A339. [Google Scholar]
- Ríos E, Karhanek M, Ma J, González A. An allosteric model of the molecular interactions of excitation–contraction coupling in skeletal muscle. J Gen Physiol. 1993;102:449–482. doi: 10.1085/jgp.102.3.449. [DOI] [PMC free article] [PubMed] [Google Scholar]
- Ríos E, Pizarro G. Voltage sensors and calcium channels of excitation–contraction coupling. News Physiol Sci. 1988;3:223–227. [Google Scholar]
- Schneider MF, Chandler WK. Voltage dependent charge movement in skeletal muscle: a possible step in excitation–contraction coupling. Nature (Lond) 1973;242:244–246. doi: 10.1038/242244a0. [DOI] [PubMed] [Google Scholar]
- Schneider MF, Simon BJ. Inactivation of calcium release from the sarcoplasmic reticulum in frog skeletal muscle. J Physiol (Camb) 1988;405:727–745. doi: 10.1113/jphysiol.1988.sp017358. [DOI] [PMC free article] [PubMed] [Google Scholar]
- Schneider MF, Simon BJ, Szucs G. Depletion of calcium from the sarcoplasmic reticulum during calcium release in frog skeletal muscle. J Gen Physiol. 1987;392:167–192. doi: 10.1113/jphysiol.1987.sp016775. [DOI] [PMC free article] [PubMed] [Google Scholar]
- Schneider MF. Control of calcium release in functioning skeletal muscle fibers. Annu Rev Physiol. 1994;56:463–484. doi: 10.1146/annurev.ph.56.030194.002335. [DOI] [PubMed] [Google Scholar]
- Shirokova N, Pizarro G, Ríos E. A damped oscillation in the intramembranous charge movement and calcium release flux of frog skeletal muscle fibers. J Gen Physiol. 1994;104:449–477. doi: 10.1085/jgp.104.3.449. [DOI] [PMC free article] [PubMed] [Google Scholar]
- Shirokova N, González A, Ma J, Shirokov R, Ríos E. Properties and roles of an intramembranous charge mobilized at high voltages in frog skeletal muscle. J Physiol (Camb) 1995;486:385–400. doi: 10.1113/jphysiol.1995.sp020820. [DOI] [PMC free article] [PubMed] [Google Scholar]
- Shirokova N, García J, Pizarro G, Ríos E. Ca2+release from the sarcoplasmic reticulum compared in amphibian and mammalian skeletal muscle. J Gen Physiol. 1996;107:1–18. doi: 10.1085/jgp.107.1.1. [DOI] [PMC free article] [PubMed] [Google Scholar]
- Shirokova N, Ríos E. Small event Ca2+ release: a probable precursor of Ca2+sparks in frog skeletal muscle. J Physiol (Camb) 1997;502:3–11. doi: 10.1111/j.1469-7793.1997.003bl.x. [DOI] [PMC free article] [PubMed] [Google Scholar]
- Shirokova N, Ríos E. Activation of Ca2+release by caffeine and voltage in frog skeletal muscle. J Physiol (Camb) 1996;493:317–339. doi: 10.1113/jphysiol.1996.sp021386. [DOI] [PMC free article] [PubMed] [Google Scholar]
- Simon BJ, Klein MG, Schneider MF. Caffeine slows turn-off of calcium release in voltage clamped skeletal muscle fibers. Biophys J. 1989;55:793–797. doi: 10.1016/S0006-3495(89)82878-4. [DOI] [PMC free article] [PubMed] [Google Scholar]
- Simon BJ, Klein MG, Schneider MF. Calcium dependence of inactivation of calcium release from the sarcoplasmic reticulum in skeletal muscle fibers. J Gen Physiol. 1991;97:437–471. doi: 10.1085/jgp.97.3.437. [DOI] [PMC free article] [PubMed] [Google Scholar]
- Smith GD, Wagner J, Keizer J. Validity of the rapid buffering approximation near a point source of calcium ions. Biophys J. 1996;70:2527–2539. doi: 10.1016/S0006-3495(96)79824-7. [DOI] [PMC free article] [PubMed] [Google Scholar]
- Stern MD. Theory of excitation–contraction coupling in cardiac muscle. Biophys J. 1992a;63:497–517. doi: 10.1016/S0006-3495(92)81615-6. [DOI] [PMC free article] [PubMed] [Google Scholar]
- Stern MD. Buffering of calcium in the vicinity of a channel pore. Cell Calcium. 1992b;13:183–192. doi: 10.1016/0143-4160(92)90046-u. [DOI] [PubMed] [Google Scholar]
- Tinker A, Lindsay ARG, Williams AJ. A model for ionic conduction in the ryanodine receptor channel of sheep cardiac muscle sarcoplasmic reticulum. J Gen Physiol. 1992;100:495–517. doi: 10.1085/jgp.100.3.495. [DOI] [PMC free article] [PubMed] [Google Scholar]
- Tripathi A, Meissner G. Sarcoplasmic reticulum lumenal Ca2+ has access to cytosolic activation sites of skeletal muscle Ca2+release channel. Biophys J. 1996;70:1–16. doi: 10.1016/S0006-3495(96)79831-4. [DOI] [PMC free article] [PubMed] [Google Scholar]
- Tsugorka A, Ríos E, Blatter LA. Imaging elementary events of calcium release in skeletal muscle cells. Science (Wash DC) 1995;269:1723–1726. doi: 10.1126/science.7569901. [DOI] [PubMed] [Google Scholar]
- Wagner J, Keizer J. Effects of rapid buffers on Ca2+ diffusion and Ca2+oscillations. Biophys J. 1994;67:447–456. doi: 10.1016/S0006-3495(94)80500-4. [DOI] [PMC free article] [PubMed] [Google Scholar]
- Wang JH. Tracer-diffusion in liquids. IV. Self-diffusion of calcium ion and chloride ion in aqueous calcium chloride solutions. J Am Chem Soc. 1953;75:1769–1770. [Google Scholar]
- Zhao M, Hollingworth S, Baylor SM. Properties of Tri- and Tetracarboxylate Ca2+indicators in frog skeletal muscle fibers. Biophys J. 1996;70:896–916. doi: 10.1016/S0006-3495(96)79633-9. [DOI] [PMC free article] [PubMed] [Google Scholar]


