

Abstract
Permeation, gating, and their interrelationship in an inwardly rectifying potassium (K+) channel, ROMK2, were studied using heterologous expression in Xenopus oocytes. Patch-clamp recordings of single channels were obtained in the cell-attached mode. The gating kinetics of ROMK2 were well described by a model having one open and two closed states. One closed state was short lived (∼1 ms) and the other was longer lived (∼40 ms) and less frequent (∼1%). The long closed state was abolished by EDTA, suggesting that it was due to block by divalent cations. These closures exhibit a biphasic voltage dependence, implying that the divalent blockers can permeate the channel. The short closures had a similar biphasic voltage dependence, suggesting that they could be due to block by monovalent, permeating cations. The rate of entering the short closed state varied with the K+ concentration and was proportional to current amplitude, suggesting that permeating K+ ions may be related to the short closures. To explain the results, we propose a variable intrapore energy well model in which a shallow well may change into a deep one, resulting in a normally permeant K+ ion becoming a blocker of its own channel.
Keywords: ROMK channel, barium, rubidium, cesium, oocyte
introduction
Inwardly rectifying K+ (Kir)1 channels provide a simple model system for the study of permeation and gating mechanisms. These channels open and close spontaneously through processes that are not strongly voltage dependent. They have a relatively simple predicted subunit structure and share some homology with voltage-gated K+ channels (for recent reviews, see Jan and Jan, 1997; Nichols and Lopatin, 1997). Kir channels consist of four subunits, where each subunit is comprised of two transmembrane domains (M1 and M2) separated by a short extracellular loop. Both the NH2 and COOH termini are believed to be cytoplasmic. The extracellular loop contains a highly conserved K+ channel “signature” sequence, GYG, that forms the selectivity filter (Doyle et al., 1998).
In 1993, the first inwardly rectifying K+ channel, ROMK1 (Kir1.1a), was cloned from a cDNA library of the rat kidney outer medulla using the expression cloning technique (Ho et al., 1993). Subsequently, ROMK2 (Kir1.1b) and ROMK3 (Kir1.1c), the splice variants of ROMK1, were cloned from a rat kidney cDNA library by expression cloning and homology search, respectively (Zhou et al., 1994; Boim et al., 1995). ROMK channels are believed to constitute the secretory K+ channels in the cortical collecting tubule (Palmer et al., 1997).
In a previous study of ROMK2 (Chepilko et al., 1995), single-channel kinetics were well described by one open and two closed states. The mean lifetime of the shorter closed state was ∼1 ms, while the less frequent (∼1%) longer closed state had a mean lifetime of ∼40 ms. The results of the present study indicate that the long-lived closed state represents block by a permeating divalent cation, whereas the short-lived closed state may result from block by a permeating K+ ion. To explain these results, we propose a model in which a shallow energy well within the pore converts to a deep one, trapping a K+ ion and transiently closing the channel.
methods
Expression of ROMK2
The plasmids containing ROMK2 (GenBank accession No. L29403) were linearized with NotI restriction enzyme and transcribed in vitro with T7 RNA polymerase in the presence of the GpppG cap using mMESSAGE mMACHINE kit (Ambion Inc., Austin, TX). Synthetic cRNA was dissolved in water and stored at −70°C before use. Stage V-VI oocytes were obtained by partial ovariectomy of female Xenopus laevis (Xenopus-I, Ann Arbor, MI), anesthetized with tricaine methanesulfonate (1.5 g/liter, adjusted to pH 7.0). Oocytes were defolliculated by incubation in OR2 solution (82.5 mM NaCl, 2 mM KCl, 1 mM MgCl2, and 5 mM HEPES, pH 7.5 with NaOH) containing 2 mg/ml collagenase type II and 2 mg/ml hyaluronidase type II (Sigma Chemical Co., St. Louis, MO) for 90 min, and another 90 min in a fresh enzyme solution at 23°C. Oocytes were injected with 0.5–1 ng cRNA and incubated at 19°C in 2× diluted Leibovitz medium (Life Technologies, Inc., Grand Island, NY) for 1–4 d before measurements were made. For patch-clamp experiments, oocytes were subjected to a hypertonic shrinking solution containing 200 mM sucrose, thereby allowing the vitelline membrane to be easily removed.
Electrophysiology
The compositions of all the pipette and bath solutions are given in Table I. Patch-clamp pipettes were pulled from glass using a three-stage process and were coated with Sylgard. Pipette resistances were 1–3 MΩ. Currents were recorded with a patch-clamp amplifier (either an EPC-7; List Electronic, Darmstadt, Germany, or an 8900; Dagan Corp., Minneapolis, MN) and stored, unfiltered, on videotape. For off-line analysis, current records were replayed from videotape, filtered at 1 kHz, and sampled at 5 kHz, using an Atari-based data acquisition system (Instrutech Corp., Mineola, NY). Construction of open and closed time histograms and fitting with exponential distributions were carried using the TAC program (Sigworth and Sine, 1987).
Table I.
The Compositions of the Bath and the Pipette Solutions (Millimolar)
| Solution | KCl | CaCl2 | MgCl2 | EDTA | X | HEPES | ||||||
|---|---|---|---|---|---|---|---|---|---|---|---|---|
| Bath | 110 | 2 | 1 | — | — | 5 | ||||||
| Control | 110 | — | — | — | — | 5 | ||||||
| 110 K+ | 110 | — | — | 5 | — | 5 | ||||||
| pH 6.4 | 110 | — | — | 5 | pH 6.4 | 5 | ||||||
| 10 Li+ | 110 | — | — | 5 | LiCl 10 | 5 | ||||||
| 10 Na+ | 100 | — | — | 5 | NaCl 10 | 5 | ||||||
| 1 Cs+ | 110 | — | — | 5 | CsCl 1 | 5 | ||||||
| 0.1 Cs+ | 110 | — | — | 5 | CsCl 0.1 | 5 | ||||||
| 0.01 Cs+ | 110 | — | — | 5 | CsCl 0.01 | 5 | ||||||
| 10 Rb+ | 110 | — | — | 5 | RbCl 10 | 5 | ||||||
| 110 Rb+ | — | — | — | 5 | RbCl 110 | 5 | ||||||
| 0.5 Ba2+ | 110 | — | — | — | BaCl2 0.5 | 5 | ||||||
| 0.05 Ba2+ | 110 | — | — | — | BaCl2 0.05 | 5 | ||||||
| 0.005 Ba2+ | 110 | — | — | — | BaCl2 0.005 | 5 | ||||||
| 500 K+ | 500 | — | — | 5 | — | 5 | ||||||
| 10 K+ | 10 | — | — | 5 | NMDG 100 | 5 |
Missed Event Correction
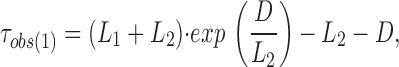
To correct for missed events, we adopted the method of Blatz and Magleby (1986). With EDTA in the pipette solution, ROMK2 showed one open and one closed state. Without EDTA, there are two closed states. However, the second closed state is long enough (>20 ms) that it will not contribute to missed events. Eq. 16 of Blatz and Magleby (1986) was rearranged as:
 |
1 |
where τobs(1) is the decay time constant for the observed state (1) intervals, L 1 is the true time constant of state (1), L 2 is the true time constant of state (2), and D is the dead time (in our case, 0.16 ms for a filter frequency of 1 kHz). A similar expression is obtained for τobs(2) by substituting state (2) for (1) and state (1) for (2). These two equations were used to solve for the true open- and closed-time constants.
Data Analysis
The interaction of divalent blocking ions with the channel was analyzed using Woodhull's kinetic scheme (Woodhull, 1973) (Scheme I).
The blocking rate, k block, is given by:
 |
2 |
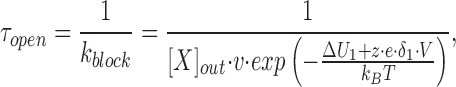
where [X]out and [X]in are the external and internal concentrations of the blocker. The second term in the right hand side is small relative to the first when blockers are added only to the extracellular (pipette) solution or when there is a large negative voltage across the patch. Since the latter condition applied, we consider only blocking from outside. The rate of crossing the energy barrier, k d, can be described by the Kramers' diffusion theory (Kramers, 1940). Therefore, the mean open time, τopen, is given by:
 |
3 |
where ν represents the Kramers' preexponential factor that depends on the friction felt by the ion and the angular frequencies of the energy minimum and maximum. Because these values are not known, ν is assumed to be 2.8 × 10⁸ s−1 as in the Ca2+-release channel (Chen et al., 1997). k B is the Boltzmann constant, T the absolute temperature, ΔU 1 the voltage-independent component of the activation energy for the energy barrier, δ1 the fractional electrical distance to the peak of the barrier, z the equivalent charge on the blocker, e the electronic charge, and V the applied voltage across the membrane (see Fig. 12).
Figure 12.

A variable intrapore energy well model. (A) Two energy wells, designated c and e, in the pore of ROMK2. Both are shallow such that most K+ ions pass through the channel easily (left). However, when the inner well (e) deepens, a permeating K+ ion is trapped (right). (B) Energy profiles for K+ trapped in the deep well at 0, −100, and −300 mV (top) under the condition of 110 K+ solution. The fractional distance refers to the fraction of the transmembrane electric field sensed, with the extracellular and intracellular boundaries set at 0 and 1, respectively. (C) Energy barriers as a function of voltage under the condition of 110 K+ solution. As the membrane potential becomes more negative, the heights of the outer (ΔU 2, solid line) and inner (ΔU 3, broken line) barrier increase and decrease, respectively. A trapped ion preferentially crosses the outer barrier between 0 and −110 mV and the inner barrier between −110 and −300 mV (dotted line).
To describe a hypothetical block by highly permeant cations such as K+, it was necessary to modify Eq. 3 in two ways. First, the concentration of the putative blocking ion is replaced by an effective concentration factor, A. In the energy profile shown in Figs. 12 and 13, this corresponds to the occupancy of a site (c) separated from the outer solution and the inner pore by barriers b and d, respectively. An additional probability factor, F, is incorporated to indicate that a blocking event is not obligatory when the ion reaches the binding site, but occurs only a small fraction of the time. The rationale for these modifications is outlined in the discussion. Therefore,
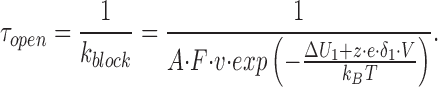 |
4 |
Figure 13.

Hypothetical mechanism for the variable energy well. The pore of ROMK2 has a binding site comprised of four identical elements that can move in a radial direction. The elements may move toward a cation occupying the binding site to coordinate and trap the ion, closing the channel.
The F value of (2.8 × 10⁵)−1 was used for K+ block because there is a short closure for approximately every 2.8 × 10⁵ ions passing through the channel.
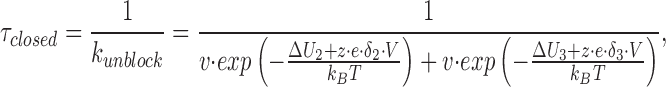
The unblocking rate, k unblock, for Ba2+ block is given by:
 |
5 |
Therefore, the mean closed time, τclosed, is given by:
 |
6 |
where ΔU 2 and ΔU 3 represent voltage-independent components of the activation energies from the well to the left (outside) barrier and the right (inside) barrier, respectively. δ2 and δ3 represent the fractional electrical distances from the well to the left (outside) barrier and the right (inside) barrier, respectively (see Fig. 12).
For analysis of K+ block with different concentrations of external K+, the same equation was used except that ΔU 3 was allowed to vary with the K+ concentration. Our interpretation is that as the external K+ concentration increases, occupancy of the outer binding site (Fig. 12, c) by K+ raises the energy of an ion in the energy well (e) through electrostatic repulsion, decreasing the height of the energy barrier for exit from the well.
When there are two closed states, the k block of short and long closures are calculated as:
 |
7 |
and
 |
8 |
where F short closed represents the fraction of short closed events out of total closed events.
The effect of pipette Cs+ on the current–voltage relationship of ROMK2 channels was analyzed with the equation
 |
9 |
where i(Cs,V) and i(0,V) are the currents in the presence and absence of Cs+. K i is the inhibition constant when V = 0, and δ is the electrical distance to the Cs+-binding site.
Fitting data to equations was done with the solver program of Excel (Microsoft Corp., Redmond, WA).
results
ROMK2 Has One Open and Two Closed States
ROMK2 channels were expressed by injecting cRNA into Xenopus oocytes, and patch-clamp recordings of single channels were obtained in the cell-attached mode. The kinetics in the cell-free inside-out mode were similar (Choe et al., 1997), but were not studied in detail because the channels were less stable in this configuration. Both pipette and bath solutions contained 110 mM KCl. Fig. 1 A shows typical single channel current traces under the control solution condition. Consistent with previous studies (Chepilko et al., 1995; Zhou et al., 1996; Choe et al., 1997; Palmer et al., 1997), the channel openings were interrupted by both long and short closures.
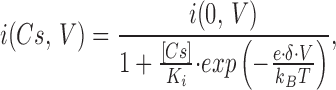
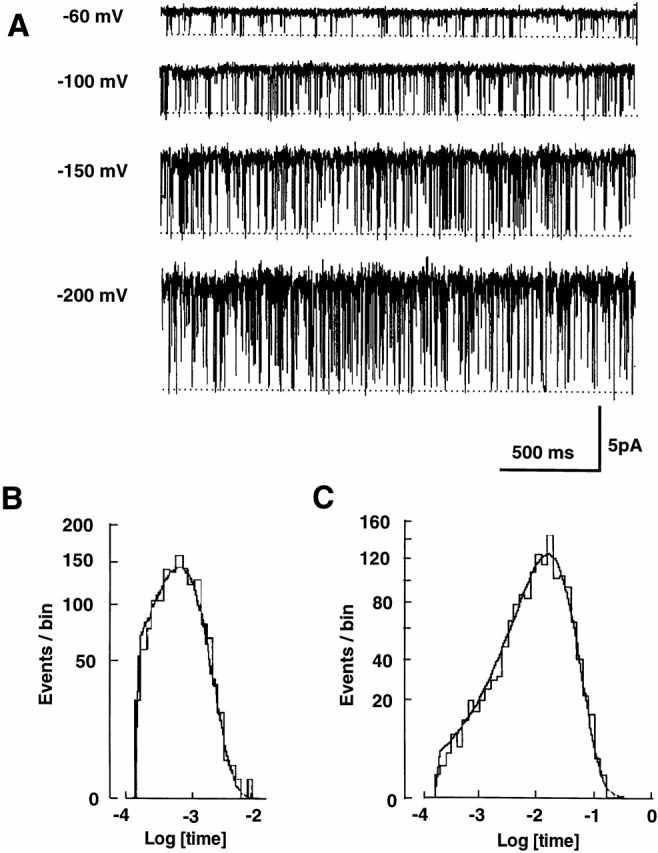
Figure 1.
ROMK2 has two closed and one open states. (A) Single-channel K+ currents in a cell-attached patch from a Xenopus oocyte expressing ROMK2. Pipette solution contained the control solution. High bath K+ (110 mM) depolarized oocytes, and the voltage at the left of each record is the negative of the applied pipette potential and is presumed to approximate the potential difference across the patch (oocyte relative to pipette). Upward deflections from the closed state (dashed line) correspond to inward K+ current. The long closures at −120 mV appear to be longer than those at −80 and −200 mV. (B) Histogram of closed times at −100 mV. The histogram is fit with two exponential distributions with time constants of 1.4 and 47 ms. 99% of closures are accounted for by the short time constant. (C) Histogram of open times at −100 mV. The histogram is fit with one exponential distribution with a time constant of 17 ms.
The closed-time histograms confirmed this observation (Fig. 1 B), as the histograms were fit well with two discrete exponential distributions. The averages of the best fit values of the mean closed times at −100 mV were 1.5 ± 0.1 and 71 ± 8 ms (n = 3), where the short closed events accounted for 99% of the closed events. Qualitatively similar results were obtained at all tested voltages (−20 to −300 mV).
In Fig. 1 C, an open-time histogram at −100 mV was well fit with a single exponential distribution, suggesting one open state, consistent with previous studies. The average of the best-fit values of the mean open time after correction for missed events was 14.1 ± 1.0 ms (n = 3) at −100 mV. The open-time histograms at all tested voltages (−20 to −300 mV) were well described with single-exponential distributions (data not shown).
Two Closed States Have Biphasic Voltage Dependence
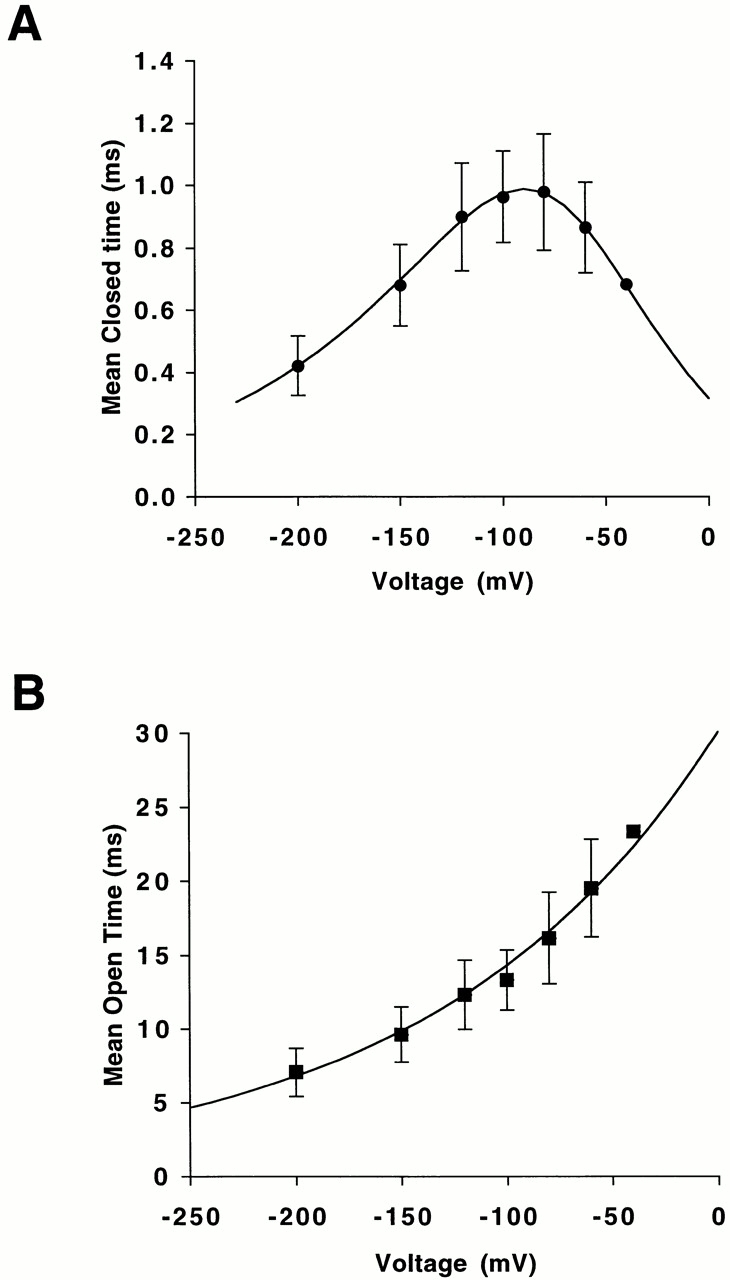
The mean closed times of ROMK2 exhibit a biphasic voltage dependence (Fig. 2 A). As the membrane potential was made more negative, both the short and long closed times increased, reaching maxima at −100 and −120 mV, respectively, and then decreased. The voltage dependence of long closed times was steeper than that of short closed times (Fig. 2 A). In contrast, the mean open time, τopen, of ROMK2 showed a monotonic voltage dependence, increasing as the potential becomes more positive (Fig. 2 B).
Figure 2.

Voltage dependence of mean closed and open time. (A) Closed times. The smooth lines are fitted lines with Eq. 6. The best-fit values for the long closed state are ΔU 2 = 15 kBT, δ2 = −0.30, ΔU 3 = 20 kBT, and δ3 = 0.26 (top line). The best-fit values for the short closed state are ΔU 2 = 12 kBT, δ2 = −0.33, ΔU 3 = 15 kBT, and δ3 = 0.33 (bottom line). Data represent means ± SEM for five to eight experiments. (B) Open times. The line is fitted with Eq. 4. The best fit values were ΔU 1 = 3 kBT and δ1 = 0.24. The value of A was set to 0.90 based on the result of Fig. 10 C. Data represent means ± SEM for five to eight experiments.
The Long Closed State
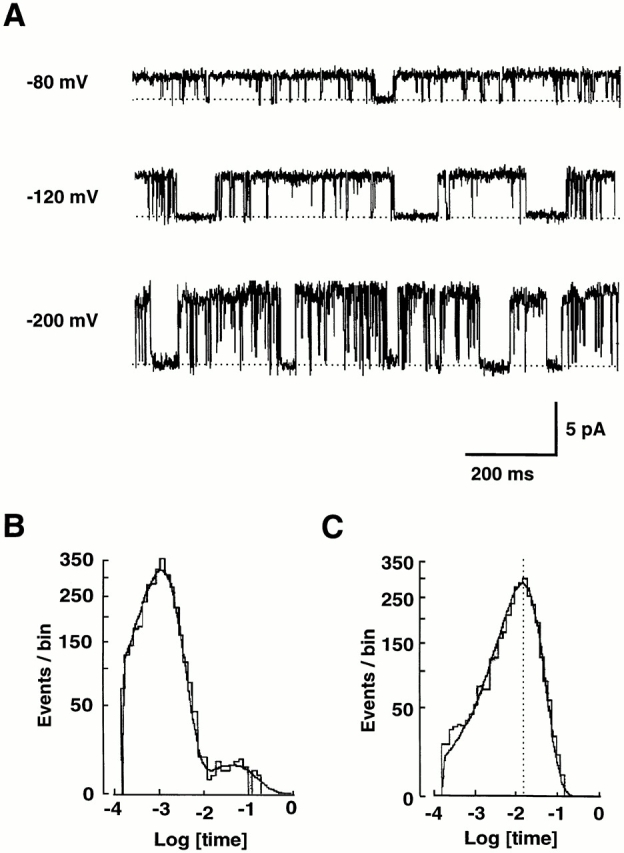
A similarity in the lifetime of Ba2+ block and the long closed time of ROMK2 (in the nominal absence of divalent cations) warranted further investigation of divalent ion block (Zhou et al., 1996). We began by adding different concentrations of Ba2+ to the pipette solution (Fig. 3 A). Ba2+ increased the number of long closures, but the closed-time histograms were still well described by two exponentials (Fig. 3 B). The longer of these two closed states was similar in duration but more frequent than the long closed states observed without addition of Ba2+. The open-time histogram was fit with a single exponential (Fig. 3 C).
Figure 3.
Ba2+ increases the number of long closures. (A) Single-channel K+ currents with 0.5, 0.05, and 0.005 mM Ba2+ in the pipette. The voltage was −60 mV in each case. (B) Histogram of closed times with 0.05 mM Ba2+ at −60 mV. The line represents the best fit with two exponential distributions with time constants of 0.9 ms (31% of closures) and 31.5 ms (69% of closures). (C) Histogram of open times with 0.05 mM Ba2+ at −60 mV. The line represents the best fit with one exponential with a time constant of 5.4 ms. (D) Blocking rates, k block, and unblocking rates, k unblock, as a function of Ba2+ concentration at −60 mV. k block was calculated with Eq. 8. The line for the k block is the best fit with the function, k block = A · [Ba2+]o, where A is 1.94 · 106 s−1 M−1. k unblock was obtained from the inverse of long closed time. The line for the k unblock represents the mean value of 29 s−1. Data are from four, four, and six experiments with 0.5, 0.05, and 0.005 mM Ba2+, respectively.
The pattern of the Ba2+-induced closures was consistent with a bimolecular block (Fig. 3 D), where k block is proportional to [Ba2+], and k unblock is independent of [Ba2+]. The k block with 0.005 mM Ba2+ at −60 mV was 17 s−1, which is much larger than the value of 0.3 s−1 obtained with control solution, indicating that most of the long closures were due to Ba2+ block even at the lowest concentration used.
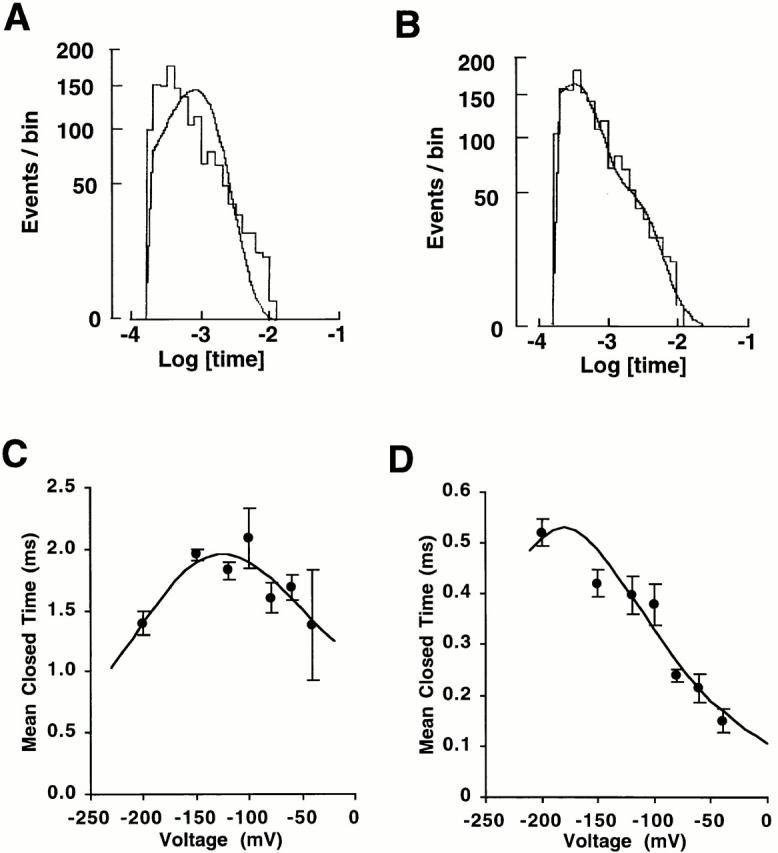
Fig. 4 A shows current traces of ROMK2 at different voltages with 0.005 mM Ba2+. Histograms of closed and open times were fit well with two exponentials (Fig. 4 B) and a single exponential (Fig. 4 C), respectively. The on rate for Ba2+ block was monotonically increased by hyperpolarization with an exponential voltage dependence (Fig. 4 D). The Ba2+-induced closed times showed a biphasic voltage dependence (Fig. 4 E).
Figure 4.
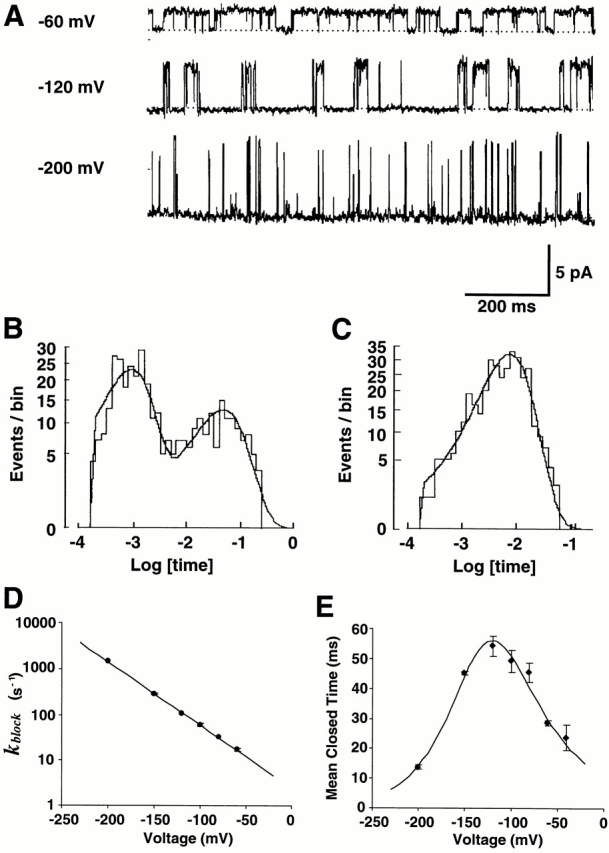
Ba2+ shows biphasic voltage-dependent off rates. (A) Single-channel K+ currents with 0.005 mM Ba2+ solution in the pipette. There are more long closures compared with those with control solution as shown in Fig. 1 A. The durations of long closures at −120 mV appear to be longer than those at −60 and −200 mV. (B) Histogram of closed times with 0.005 mM Ba2+ at −100 mV. The line represents the best fit with two exponential distributions with time constants of 1.0 ms (63% of closures) and 49.8 ms (37% of closures). (C) Histogram of open times with 0.005 mM Ba2+ at −100 mV. The line represents the best fit with one exponential with a time constant of 8.5 ms. (D) Blocking rates of Ba2+ as a function of voltage. Eq. 3 was used to fit the data. The best-fit values were ΔU 1 = 6 kBT and δ1 = 0.40. Data represent means ± SEM for three to six experiments. (E) Mean dwell time of long closures as a function of voltage. The data were fit with Eq. 6 (solid line). The values of the best fit were ΔU 2 = 15 kBT, δ2 = −0.24, ΔU 3 = 21 kBT, and δ3 = 0.28.
The similarities in the biphasic voltage dependence of the long closures seen under control conditions and those of Ba2+ block suggested that the former might also represent block by a divalent cation. To test this idea, we added 5 mM EDTA to the pipette solution. Under these conditions, long closed events were rarely seen (Fig. 5 A). Histograms of closed (Fig. 5 B) and open (Fig. 5 C) times at −100 mV could be well described by a single exponential distribution. The average time constants were 1.0 ± 0.1 ms for the closed time and 13.4 ± 2.0 ms for the open time (n = 6) at −100 mV. These values are similar to those obtained in the absence of EDTA, indicating that the main effect of the chelator was on the long closed times. Histograms at all voltages studied (−40 to −200 mV) could be fit with single exponential distributions. The short closed and open times were biphasic and monotonic functions of voltage, respectively (Fig. 6, A and B).
Figure 5.
EDTA eliminates long closures. (A) Single channel K+ currents with 5 mM EDTA in the 110 K+ solution. The long closures were rarely seen. (B) Closed-time histogram at −80 mV. The histogram was fit well with one exponential distribution with a time constant of 1.0 ms. (C) Open-time histogram at −80 mV. The histogram was fit well with one exponential distribution with a time constant of 17 ms.
Figure 6.
Voltage dependence of mean closed and open time with EDTA. (A) Closed times. The lines are fit with Eq. 6. The best-fit values were ΔU 2 = 12 kBT, δ2 = −0.24, ΔU 3 = 15 kBT, and δ3 = 0.42. Data represent means ± SEM for three to six experiments except −40 mV (n = 1). (B) Open times. The line is obtained from Eq. 4. The best-fit values are ΔU 1 = 3.3 kBT and δ1 = 0.20. The value of A was set to 0.90 based on the result of Fig. 10 C. Data are from the same experiments as in A.
These results are consistent with the idea that divalent cations that contaminate the water supply or the reagent-grade chemicals used for the solutions induce the long closed state. It is likely that Ba2+ itself is the main blocker since the long closures also disappeared in the presence of SO4 2−, which forms an insoluble complex with Ba2+ (data not shown). Contaminant Ba2+ ion has been shown to affect the gating of Ca2+-dependent K+ channel (hslo) (Diaz et al., 1996).
The Short Closed State Represents Block by a Permeating K+ Ion
Since both the long and short closed times have biphasic voltage dependence and the long closed state seems to represent block by divalent cation(s), we suspected that the short closures might also be a blocked state. The voltage dependence of the short closed time is less steep than that of the long closed time, which suggests that the short closed events could result from block by monovalent, rather than divalent, cation(s).
If the putative blocker is a contaminant monovalent cation, then the affinity for the blocking agent must be high because the concentration of the contaminant would be small and the blocking rate is fast. Therefore, if a particular monovalent cation were the blocking ion, addition of 10 mM concentration of that cation to the pipette solution should have a large effect on gating.
We considered as candidate blockers the nine monovalent monatomic cations in nature, H+, Na+, Li+, K+, Rb+, Cs+, Fr+, Ag+, and Tl+. Ag+ and Tl+, however, are unlikely to be the putative blockers because they are poorly soluble in Cl−-containing solutions and substitution of NO3 − for Cl− did not affect ROMK2 kinetics (Chepilko et al., 1995). Fr+ exists only as an unstable isotope. We tested the effects of H+, Na+, Rb+, and Cs+ ions on the gating of ROMK2. Adding either H+ (pH 6.4), Na+ (10 mM), or Li+ (10 mM) to the pipette solution had minimal effects on the gating kinetics (data not shown).
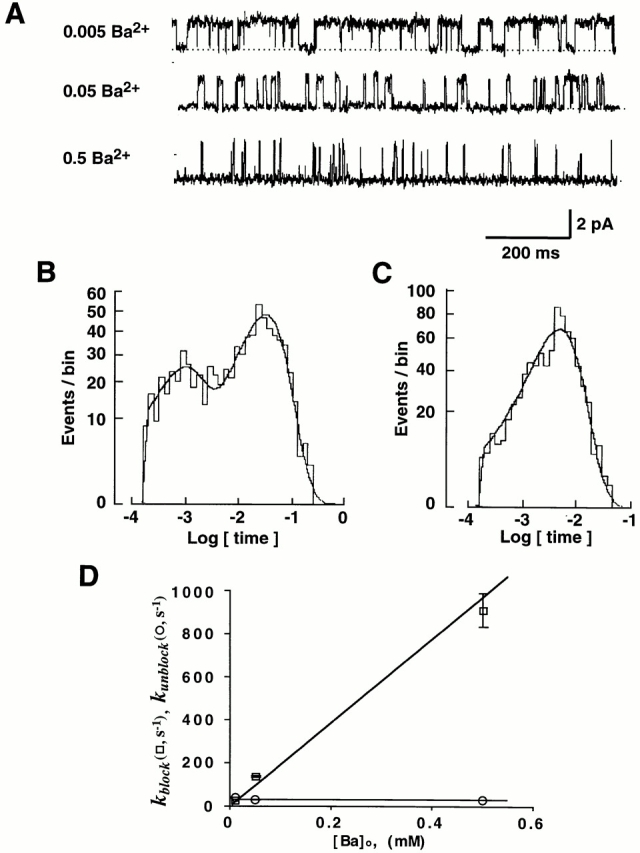
With a mixture of Rb+ (10 mM) and K+ (110 mM) in the pipette solution, the closed-time histograms required two exponential distributions even in the presence of EDTA (Fig. 7, A and B); the time constants were 0.4 ± 0.04 and 2.1 ± 0.25 ms at −100 mV (n = 3). The longer closed time showed a biphasic voltage dependence (Fig. 7 C), but the shorter one had a monotonic voltage dependence up to −200 mV (Fig. 7 D). We hypothesized that the closed state with biphasic voltage dependence results from K+ ion block, whereas the other closed state represents block by Rb+. To test this idea, we investigated the kinetics with 110 mM Rb+ alone in the pipette solution. Under these conditions, the closed times could be fit to a single exponential (Fig. 8 A) with monotonic voltage dependence up to −200 mV (Fig. 8 B). Therefore, the monotonic voltage-dependent closed state seen with the K+–Rb+ mixture can be attributed to Rb+ interaction with the channel. In fact, the apparent monotonic voltage dependence may actually be a biphasic voltage dependence with the maximum shifted to a hyperpolarized voltage beyond our range of measurement rather than a fundamental difference between the mechanisms involving Rb+ and K+. Since the Rb+ kinetics are distinguishable from those of the K+, Rb+ cannot be the putative contaminant ion in the K+ solution. However, these results provide further evidence that ROMK2 gating is affected by the permeating ions.
Figure 7.
10 mM Rb+ + 110 mM K+ solution in the pipette. (A) Closed-time histogram at −100 mV. A single exponential did not adequately describe the histogram. (B) A good fit to the data in A was obtained with two exponential distributions with time constants of 0.3 ms (74%) and 1.9 ms (26%). (C) Voltage dependence of longer short closed times. The values of the best fit obtained with Eq. 6 were ΔU 2 = 13 kBT, δ2 = −0.10, ΔU 3 = 16 kBT, and δ3 = 0.18. Data from three experiments. (D) Voltage dependence of shorter short closed times. The values of the best fit obtained with Eq. 6 were ΔU 2 = 10 kBT, δ2 = −0.15, and ΔU 3 = 16 kBT. δ3 was set to be 0.2. Data from three experiments.
Figure 8.

Effect of Rb+ only (110 Rb+) solution in the pipette. (A) Closed-time histogram at −100 mV. The histogram was well described by one exponential distribution with a time constant of 0.65 ms. (B) Voltage dependence of closed times. The values of the best fit obtained with Eq. 9 were ΔU 2 = 11 kBT, δ2 = −0.15, and ΔU 3 = 17 kBT. δ3 was set to be 0.2. Individual data from two experiments are shown.
When Cs+ (1 mM) was added to the pipette solution, both the conductance and the kinetics were altered (Fig. 9 A). At low voltage, the effects were small; however, at hyperpolarizing voltages the mean open times with Cs+ were larger than what was seen with K+ alone (except at −150 mV) (Fig. 9 B). If Cs+ were responsible for the short closed state, the mean open times should decrease under these conditions. Cs+ can therefore be ruled out as a cause of the short closures. We also noticed that, at hyperpolarizing voltages with Cs+ in the pipette solution, the single-channel currents were smaller than those with K+ alone (Fig. 9 C), suggesting that Cs+ might be a fast blocker.
Figure 9.

The effect of Cs+ on the mean open time and single channel current. (A) Currents with 1 mM Cs+ solution in the pipette. (B) Voltage dependence of mean open time. Data from four to five experiments. (C) Voltage dependence of single channel current. The line is the best fit with Eq. 10 to the data from −20 to −120 mV. Best fit values were K i = 16.4 mM and δ = 0.60. Data from four to five experiments.
The above experiments left K+ itself as the leading candidate for the blocking ion producing the short closures. We tested this idea by examining the effects of a high (500 mM) and a low (10 mM) concentration of K+ in the pipette solution (Fig. 10 A). In the low K+ solution, 100 mM K+ was replaced by an equimolar amount of N-methyl-d-glucamine (NMDG+). In all cases, the closed-time histograms were fit well with single-exponential distributions (data not shown). Increasing external K+ concentration shortened the mean open times at all voltages (Fig. 10 B). These results support the idea that permeating K+ ions may induce closure of the pore under some conditions.
Figure 10.

Effect of K+ concentration on the gating of ROMK2. (A) Single channel K+ currents with 10, 110, and 500 K+ solutions in the pipette. V = −120 mV. (B) Mean open times with 10 (▪), 110 (•), and 500 (▴) K+ solutions in the pipette plotted as functions of voltage. The data were fit with Eq. 4. The best fit values were ΔU 1 = 3.4 kBT and δ1 = 0.20. The values of A for 500, 110, and 10 K+ were 1.37, 0.90, and 0.42, respectively. Data points represent 3 (500 K+), 3 (10 K+), and 5–13 (110 K+) experiments. (C) Mean closed times with 10 (▪), 110 (•), and 500 (▴) K+ in the pipette plotted as functions of voltage. The 110 K+ data contain data from experiments with 110 K+, 1 Cs+, 0.1 Cs+, 0.01 Cs+, 10 Na+, and 10 Li+ solution. The data were fit simultaneously with Eq. 6. The best fit values are ΔU 2 = 12 kBT, δ2 = −0.24, and δ3 = 0.42. The values of ΔU 3 are 14, 15, and 18 kBT for 500, 110, and 10 K+, respectively. Data points represent 3 (500 K+), 3 (10 K+), and 5–13 (110 K+) experiments.
As indicated in Fig. 10 C, higher K+ concentrations were also associated with shorter mean closed times, particularly at hyperpolarizing voltages. In all cases, the mean closed times showed a biphasic voltage dependence, but higher levels of K+ shifted the maxima toward more positive potentials. These results suggest that external K+ can decrease the stability of the closed state by repelling a blocking ion (in this case K+ itself) from its site within the pore.
When the rates of entering the short closed state (ordinate of Fig. 11) were plotted as a function of voltage for a variety of conditions, the scatter in the data suggested that conformational changes induced by voltage do not adequately explain the ROMK kinetics (Fig. 11 A). However, when the same parameter is plotted as a function of current amplitude, the data fall close to a straight line (Fig. 11 B). Thus, the rates of entering the short closure correlate better with ion flow through the channel than with the membrane potential itself.
Figure 11.

Rate of entering the short closed state as functions of voltage (A) and current amplitude (B). Symbols are 110 K+ (♦), 500 K+ (□), 10 K+ (▴), 1 Cs+ (○), 0.1 Cs+ (▪), 0.01 Cs+ (▵), 10 Na+ (×), and 10 Li+ (⋄). The straight line in B is a linear regression line with slope of 23 and y intercept of 17 (correlation coefficient = 0.985).
discussion
Biphasic Voltage Dependence Indicates that the Blocking Ion Is Permeable
The biphasic voltage dependence of both the long and short closed times of ROMK2 does not conform to a simple picture of transitions involving a single energy barrier. One explanation is that the closures represent blocks of the channel by ions that permeate the pore. The channel can then reopen (unblock) in two ways, assuming that the blocking ion can leave the pore either toward the extracellular fluid or toward the cytoplasm.
This idea has several precedents. Hydrogen ions were shown to block and permeate the sodium channel of squid giant axon (Begenisich and Danko, 1983). Ba2+, Sr2+, Ca2+, and Mn2+ were classified as permeant blockers of Ca2+ channels (Lansman et al., 1986). Ba2+ can block and dissociate to the other side of high conductance Ca2+-activated K+ channels (Neyton and Miller, 1988). Na+ blocks the delayed rectifier K+ channel but permeates the channel at large depolarizing potentials (French and Wells, 1977).
The Long Closed State Represents Block by a Divalent Cation
Two observations suggest that the long closed events are divalent cation blocking events: (a) Ba2+ added to the pipette solution increases the frequency but not the duration or the voltage dependence of long closures, and (b) 5 mM EDTA added to the pipette solution to chelate divalent cations virtually eliminated the long closed events. Since we did not add a divalent cation to the control solution, the long closures most likely result from contaminants in the water supply or the stock chemicals. Ba2+ itself is the most likely candidate since the long closures also disappeared in the presence of SO4 2−. To explain the long closures observed under control conditions, the solutions would have to contain ∼0.1 μM Ba2+. This mechanism could explain why long closures were not observed in studies from another laboratory (Wang et al., 1990).
Previous studies show that both native and cloned inwardly rectifying channels are blocked by extracellular divalent cations; i.e., Mg2+, Ca2+, Ba2+, and Sr2+ (Hagiwara et al., 1978; Sakmann and Trube, 1984; Ho et al., 1993; Kubo et al., 1993; Robertson et al., 1996). At the single-channel level, extracellular Mg2+ produced long closed events in an inwardly rectifying K+ channel of aortic endothelial cells (Elam and Lansman, 1995).
The biphasic voltage dependence of the Ba2+-blocked state (and, by inference, the long-closed state seen under control conditions) can be explained qualitatively using the simple Woodhull scheme described in the methods. The parameters derived from this model suggest that Ba2+ binds to a site within the pore, located ∼64% of the way through the electric field (δ1 − δ2 in Table II). Since the height of the barrier to the outside (ΔU 2) is smaller than that to the inside (ΔU 3), in the absence of an applied voltage, Ba2+ dissociates to the extracellular fluid more readily than to the cytoplasm (Table II).
Table II.
Best-Fit Parameters of Energy Profiles for Short and Long Closures
K+ Ion as a Gating Particle
The similarity in the biphasic voltage dependence of the short and long closed times implies that the short closures may also represent blocked states. Two observations support the idea that short closures result from block by monovalent, rather than divalent, cations. First, EDTA does not decrease the number of short closed events. Second, the voltage dependence of the short closed times is less steep than the long closed times, consistent with a lower charge on the blocking particle (Fig. 2 A).
Several lines of evidence further suggest that permeant K+ ions may block the channel. First, the rate of entry into the short-closed state was dependent on the concentration of K+ in the pipette. At any given voltage, elevating external K+ increased the blocking rate (Fig. 10). Unlike the case with Ba2+, however, the rate of block was not directly proportional to the K+ concentration, possibly indicating that K+ must pass through a second, saturable binding site (see below).
Second, mixtures of Rb+ (10 mM) and K+ (110 mM) in the pipette solution produced a two-exponential closed-time distribution, even in the presence of EDTA (Fig. 7). When Rb+ ions are substituted for K+ ions (110 Rb+ solution), biphasic short closures disappear and only monotonic short closures are left (Fig. 8). These results are consistent with the idea that K+ and Rb+ are the blockers for biphasic and monotonic short closures, respectively. However, the closed-state lifetimes with the mixture of K+ and Rb+ are larger and smaller, respectively, compared with the lifetimes observed with K+ or Rb+ alone, suggesting that K+ and Rb+ interact within the pore.
Third, 1 mM Cs+ in the pipette solution reduced both the single channel current amplitudes and the rate of channel closure (Fig. 9). This is consistent with the idea that Cs+ restricts the movement of K+ through the pore as well as the accessibility of K+ to the putative blocking site. However, at large negative voltages (−150 mV), Cs+ itself may reach the blocking site and decrease the mean open time.
The idea that permeant K+ ions can block the channel by interacting at sites within the pore could explain previous findings that the kinetics of ROMK2 channels depend in a striking fashion on the nature of the conducted ion (Chepilko et al., 1995; Palmer et al., 1997). Both Tl+ and NH4 + produced unique kinetic patterns when they were the major conducting species. Gating with Rb+ as the conducting ion is also different from that with K+, as shown in Fig. 8. This suggests that each ion interacts in different ways with sites within the channel to determine both permeation and gating.
K+ vs. Ba2+ Block
Like the Ba2+-blocked state, the short closed state can be described by a Woodhull model (see methods). The location of the putative monovalent blocking site within the electric field of the membrane is not precisely the same as that estimated for Ba2+ (Table II). However, given the simplifications that are likely to be involved in using the Woodhull scheme and the likelihood that the electric field is steep near the selectivity filter, it is possible that the sites of interaction of K+ and Ba2+ are physically close to each other, if not identical.
One difference between the effects of Ba2+ and K+ is that for Ba2+ the rate of block is proportional to the extracellular concentration (Fig. 3 D), whereas for K+ a 50-fold increase in concentration augments the rate of closure by only three- to fourfold (Fig. 10 C). This could be explained if K+ gained access to the blocking site through a second binding site (Figs. 12 c and 13 c) located toward the extracellular side of the blocking site. The rate of block at each voltage would then reach a limiting value as the outer site became saturated. This is represented formally by replacing the concentration of the blocking ion in Eq. 3 with an effective concentration term, A, in Eq. 4.
A Variable Intrapore Energy Well Model
Obviously, an ion that permeates the pore at high rates cannot be an obligatory blocker of the channel. To explain the block, we propose the existence of a variable energy well (Fig. 12). In this model, the pore normally has a shallow energy well for K+ ions, permitting rapid conduction. However, the shallow well can be converted to a deep one, thereby trapping K+ and blocking ion flow long enough to be detected as a channel closure. A term, F, was introduced to account for the low probability of the K+ ion's inducing a closure in Eqs. 5 and 6.
We do not know what triggers the change in the depth of the well. Clearly, the closing rate is not a simple function of voltage (Fig. 11 A). Nor does the gating appear to be directly controlled by the electrochemical gradient for K+, as suggested by experiments on the cardiac KATP channel (Zilberter et al., 1988). For instance, Cs+, which changes the K+ current through the channel but not the driving force, reduces the closing rate. The finding that the rate of closure is proportional to the current over a fairly wide range of conditions suggests that the change in the channel is triggered when an ion passes a certain part of the pore. There would be a fixed probability of the change in the energy profile with each ion passage.
A Possible Structural Mechanism Underlying the Variable Energy Profile
A simple physical model describing the variable energy profile is shown in Fig. 13. This picture is compatible with a recently reported x-ray crystal structure of the bacterial K+ channel KcsA (Doyle et al., 1998). The cation-binding sites within the selectivity filter have components with a partial negative charge or dipole. The side chains of the outer binding site in the selectivity filter of the KcsA channel make hydrogen bonds and van der Waals contacts with the pore helix, forming a rigid pore structure. However, the region around the inner binding site might be flexible so that it can move into and out of the pore.
Since K+ channels are formed with four identical subunits, the movable site may consist of four symmetrically placed elements. Without ions in the pore, the most stable conformation is with the sites retracted and the pore open. When a positively charged ion is near the site, they move toward the ion to form a stable complex. Considering the rates of ion movement through the pore and the rates of closure, the flexible binding sites would move into the pore only occasionally: on average, once for every 2.8 × 10⁵ K+ ions passing through the channel. Precedents for such a mechanism can be found in enzymes such as hexokinase (McDonald et al., 1979; Bennett and Steitz, 1980) and citrate synthase (Remington et al., 1982) in which large scale, low frequency vibration of two lobes about a hinge axis can occur, closing around a substrate.
Comparison with Other Channels
There have been several previous reports suggesting that the energy profile in the pore may change under the influence of permeant ions. Läuger pointed out that rate constants of transitions between conformational substates may depend on ion occupancy of the pore because of the strong electrostatic interaction between an ion and polar groups of the binding site (Läuger, 1985). Open channel noise was explained by fluctuation of energy barriers in gramicidin A channels (Heinemann and Sigworth, 1990) and nicotinic ACh receptors (Sigworth, 1985). More recently, a fluctuating barrier model was adopted to explain rectifying conductance substates in a large conductance Ca2+- activated K+ channel (Moss and Moczydlowski, 1996).
Many ion channels show short closures that fall in the range of submilliseconds to a few milliseconds. These include nicotinic ACh receptors (Colquhoun and Sakmann, 1981), Ca2+-activated cation channels (Yellen, 1982), and G-protein-gated K+ channels (Slesinger et al., 1995). Voltage-gated K+ and Na+ channels also undergo frequent short closures when their inactivation is removed (Hoshi et al., 1990; Kellenberger et al., 1997). Even anion channels such as the ClC-0 channel, the voltage-dependent Cl− channel from Torpedo electric organ, show short closures that are also linked to ion permeation (Hanke and Miller, 1983). The permeant ion–induced closures described here may be quite prevalent in nature.
Scheme I.

Acknowledgments
We thank Dr. Olaf S. Andersen for critical comments on the manuscript.
This work was supported by National Institutes of Health grants DK-27847 (to L.G. Palmer) and DK-46950 (to H. Sackin).
Abbreviation used in this paper
- Kir channel
inwardly rectifying K+ channel
Footnotes
Henry A. Lester served as Guest Editor for this article
references
- Begenisich T, Danko M. Hydrogen ion block of the sodium pore in squid giant axons. J Gen Physiol. 1983;82:599–618. doi: 10.1085/jgp.82.5.599. [DOI] [PMC free article] [PubMed] [Google Scholar]
- Bennett WS, Jr, Steitz TA. Structure of a complex between yeast hexokinase A and glucose. II. Detailed comparisons of conformation and active site configuration with the native hexokinase B monomer and dimer. J Mol Biol. 1980;140:211–230. doi: 10.1016/0022-2836(80)90103-5. [DOI] [PubMed] [Google Scholar]
- Blatz AL, Magleby KL. Correcting single channel data for missed events. Biophys J. 1986;49:967–980. doi: 10.1016/S0006-3495(86)83725-0. [DOI] [PMC free article] [PubMed] [Google Scholar]
- Boim MA, Ho K, Shuck ME, Bienkowski MJ, Block JH, Slightom JL, Yang Y, Brenner BM, Hebert SC. ROMK inwardly rectifying ATP-sensitive K+channel. II. Cloning and distribution of alternative forms. Am J Physiol. 1995;268:F1132–F1140. doi: 10.1152/ajprenal.1995.268.6.F1132. [DOI] [PubMed] [Google Scholar]
- Chen D, Xu L, Tripathy A, Meissner G, Eisenberg B. Permeation through the calcium release channel of cardiac muscle. Biophys J. 1997;73:1337–1354. doi: 10.1016/S0006-3495(97)78167-0. [DOI] [PMC free article] [PubMed] [Google Scholar]
- Chepilko S, Zhou H, Sackin H, Palmer LG. Permeation and gating properties of a cloned renal K+channel. Am J Physiol. 1995;268:C389–C401. doi: 10.1152/ajpcell.1995.268.2.C389. [DOI] [PubMed] [Google Scholar]
- Choe H, Zhou H, Palmer LG, Sackin H. A conserved cytoplasmic region of ROMK modulates pH sensitivity, conductance, and gating. Am J Physiol. 1997;273:F516–F529. doi: 10.1152/ajprenal.1997.273.4.F516. [DOI] [PubMed] [Google Scholar]
- Colquhoun D, Sakmann B. Fluctuations in the microsecond time range of the current through single acetylcholine receptor ion channels. Nature. 1981;294:464–466. doi: 10.1038/294464a0. [DOI] [PubMed] [Google Scholar]
- Diaz F, Wallner M, Stefani E, Toro L, Latorre R. Interaction of internal Ba2+ with a cloned Ca2+-dependent K+ (hslo)channel from smooth muscle. J Gen Physiol. 1996;107:399–407. doi: 10.1085/jgp.107.3.399. [DOI] [PMC free article] [PubMed] [Google Scholar]
- Doyle DA, Cabral JM, Pfuetzner RA, Kuo A, Gulbis JM, Cohen SL, Chait BT, MacKinnon R. The structure of the potassium channel: molecular basis of K+conduction and selectivity. Science. 1998;280:69–77. doi: 10.1126/science.280.5360.69. [DOI] [PubMed] [Google Scholar]
- Elam TR, Lansman JB. The role of Mg2+ in the inactivation of inwardly rectifying K+channels in aortic endothelial cells. J Gen Physiol. 1995;105:463–484. doi: 10.1085/jgp.105.4.463. [DOI] [PMC free article] [PubMed] [Google Scholar]
- French RJ, Wells JB. Sodium ions as blocking agents and charge carriers in the potassium channel of the squid giant axon. J Gen Physiol. 1977;70:707–724. doi: 10.1085/jgp.70.6.707. [DOI] [PMC free article] [PubMed] [Google Scholar]
- Hagiwara S, Miyazaki S, Moody W, Patlak J. Blocking effects of barium and hydrogen ions on the potassium current during anomalous rectification in the starfish egg. J Physiol (Camb) 1978;279:167–185. doi: 10.1113/jphysiol.1978.sp012338. [DOI] [PMC free article] [PubMed] [Google Scholar]
- Hanke W, Miller C. Single chloride channels from Torpedo electroplax. Activation by protons. J Gen Physiol. 1983;82:25–45. doi: 10.1085/jgp.82.1.25. [DOI] [PMC free article] [PubMed] [Google Scholar]
- Heinemann SH, Sigworth FJ. Open channel noise. V. Fluctuating barriers to ion entry in gramicidin A channels. Biophys J. 1990;57:499–514. doi: 10.1016/S0006-3495(90)82566-2. [DOI] [PMC free article] [PubMed] [Google Scholar]
- Ho K, Nichols CG, Lederer WJ, Lytton J, Vassilev PM, Kanazirska MV, Hebert SC. Cloning and expression of an inwardly rectifying ATP-regulated potassium channel. Nature. 1993;362:31–38. doi: 10.1038/362031a0. [DOI] [PubMed] [Google Scholar]
- Hoshi T, Zagotta WN, Aldrich RW. Biophysical and molecular mechanisms of Shakerpotassium channel inactivation. Science. 1990;250:533–538. doi: 10.1126/science.2122519. [DOI] [PubMed] [Google Scholar]
- Jan LY, Jan YN. Cloned potassium channels from eukaryotes and prokaryotes. Annu Rev Neurosci. 1997;20:91–123. doi: 10.1146/annurev.neuro.20.1.91. [DOI] [PubMed] [Google Scholar]
- Kellenberger S, West JW, Scheuer T, Catterall WA. Molecular analysis of the putative inactivation particle in the inactivation gate of brain type IIA Na+channels. J Gen Physiol. 1997;109:589–605. doi: 10.1085/jgp.109.5.589. [DOI] [PMC free article] [PubMed] [Google Scholar]
- Kramers HA. Brownian motion in a field of force and the diffusion model of chemical reactions. Physica. 1940;7:284–304. [Google Scholar]
- Kubo Y, Baldwin TJ, Jan YN, Jan LY. Primary structure and functional expression of a mouse inward rectifier potassium channel. Nature. 1993;362:127–133. doi: 10.1038/362127a0. [DOI] [PubMed] [Google Scholar]
- Lansman JB, Hess P, Tsien RW. Blockade of current through single calcium channels by Cd2+, Mg2+, and Ca2+. Voltage and concentration dependence of calcium entry into the pore. J Gen Physiol. 1986;88:321–347. doi: 10.1085/jgp.88.3.321. [DOI] [PMC free article] [PubMed] [Google Scholar]
- Läuger P. Ionic channels with conformational substates. Biophys J. 1985;47:581–590. doi: 10.1016/S0006-3495(85)83954-0. [DOI] [PMC free article] [PubMed] [Google Scholar]
- McDonald RC, Steitz TA, Engelman DM. Yeast hexokinase in solution exhibits a large conformational change upon binding glucose or glucose 6-phosphate. Biochemistry. 1979;18:338–342. doi: 10.1021/bi00569a017. [DOI] [PubMed] [Google Scholar]
- Moss GW, Moczydlowski E. Rectifying conductance substates in a large conductance Ca2+-activated K+channel: evidence for a fluctuating barrier mechanism. J Gen Physiol. 1996;107:47–68. doi: 10.1085/jgp.107.1.47. [DOI] [PMC free article] [PubMed] [Google Scholar]
- Neyton J, Miller C. Potassium blocks barium permeation through a calcium-activated potassium channel. J Gen Physiol. 1988;92:549–567. doi: 10.1085/jgp.92.5.549. [DOI] [PMC free article] [PubMed] [Google Scholar]
- Nichols CG, Lopatin AN. Inward rectifier potassium channels. Annu Rev Physiol. 1997;59:171–191. doi: 10.1146/annurev.physiol.59.1.171. [DOI] [PubMed] [Google Scholar]
- Palmer LG, Choe H, Frindt G. Is the secretory K+ channel in the rat CCT ROMK? . Am J Physiol. 1997;273:F404–F410. doi: 10.1152/ajprenal.1997.273.3.F404. [DOI] [PubMed] [Google Scholar]
- Remington S, Wiegand G, Huber R. Crystallographic refinement and atomic models of two different forms of citrate synthase at 2.7 and 1.7 Å resolution. J Mol Biol. 1982;158:111–152. doi: 10.1016/0022-2836(82)90452-1. [DOI] [PubMed] [Google Scholar]
- Robertson BE, Bonev AD, Nelson MT. Inward rectifier K+ currents in smooth muscle cells from rat coronary arteries: block by Mg2+, Ca2+, and Ba2+ . Am J Physiol. 1996;271:H696–H705. doi: 10.1152/ajpheart.1996.271.2.H696. [DOI] [PubMed] [Google Scholar]
- Sakmann B, Trube G. Voltage-dependent inactivation of inward-rectifying single-channel currents in the guinea-pig heart cell membrane. J Physiol (Camb) 1984;347:659–683. doi: 10.1113/jphysiol.1984.sp015089. [DOI] [PMC free article] [PubMed] [Google Scholar]
- Sigworth FJ. Open channel noise. I. Noise in acetylcholine receptor currents suggests conformational fluctuations. Biophys J. 1985;47:709–720. doi: 10.1016/S0006-3495(85)83968-0. [DOI] [PMC free article] [PubMed] [Google Scholar]
- Sigworth FJ, Sine SM. Data transformations for improved display and fitting of single-channel dwell time histograms. Biophys J. 1987;52:1047–1054. doi: 10.1016/S0006-3495(87)83298-8. [DOI] [PMC free article] [PubMed] [Google Scholar]
- Slesinger PA, Reuveny E, Jan YN, Jan LY. Identification of structural elements involved in G protein gating of the GIRK1 potassium channel. Neuron. 1995;15:1145–1156. doi: 10.1016/0896-6273(95)90102-7. [DOI] [PubMed] [Google Scholar]
- Wang WH, White S, Geibel J, Giebisch G. A potassium channel in the apical membrane of rabbit thick ascending limb of Henle's loop. Am J Physiol. 1990;258:F244–F253. doi: 10.1152/ajprenal.1990.258.2.F244. [DOI] [PubMed] [Google Scholar]
- Woodhull AM. Ionic blockage of sodium channels in nerve. J Gen Physiol. 1973;61:687–708. doi: 10.1085/jgp.61.6.687. [DOI] [PMC free article] [PubMed] [Google Scholar]
- Yellen G. Single Ca2+-activated nonselective cation channels in neuroblastoma. Nature. 1982;296:357–359. doi: 10.1038/296357a0. [DOI] [PubMed] [Google Scholar]
- Zhou H, Chepilko S, Schutt W, Choe H, Palmer LG, Sackin H. Mutations in the pore region of ROMK enhance Ba2+block. Am J Physiol. 1996;271:C1949–C1956. doi: 10.1152/ajpcell.1996.271.6.C1949. [DOI] [PubMed] [Google Scholar]
- Zhou H, Tate SS, Palmer LG. Primary structure and functional properties of an epithelial K channel. Am J Physiol. 1994;266:C809–C824. doi: 10.1152/ajpcell.1994.266.3.C809. [DOI] [PubMed] [Google Scholar]
- Zilberter Y, Burnashev N, Papin A, Portnov V, Khodorov B. Gating kinetics of ATP-sensitive single potassium channels in myocardial cells depends on electromotive force. Pflügers Arch. 1988;411:584–589. doi: 10.1007/BF00582382. [DOI] [PubMed] [Google Scholar]