

Abstract
When attached to specific sites near the S4 segment of the nonconducting (W434F) Shaker potassium channel, the fluorescent probe tetramethylrhodamine maleimide undergoes voltage-dependent changes in intensity that correlate with the movement of the voltage sensor (Mannuzzu, L.M., M.M. Moronne, and E.Y. Isacoff. 1996. Science. 271:213–216; Cha, A., and F. Bezanilla. 1997. Neuron. 19:1127–1140). The characteristics of this voltage-dependent fluorescence quenching are different in a conducting version of the channel with a different pore substitution (T449Y). Blocking the pore of the T449Y construct with either tetraethylammonium or agitoxin removes a fluorescence component that correlates with the voltage dependence but not the kinetics of ionic activation. This pore-mediated modulation of the fluorescence quenching near the S4 segment suggests that the fluorophore is affected by the state of the external pore. In addition, this modulation may reflect conformational changes associated with channel opening that are prevented by tetraethylammonium or agitoxin. Studies of pH titration, collisional quenchers, and anisotropy indicate that fluorophores attached to residues near the S4 segment are constrained by a nearby region of protein. The mechanism of fluorescence quenching near the S4 segment does not involve either reorientation of the fluorophore or a voltage-dependent excitation shift and is different from the quenching mechanism observed at a site near the S2 segment. Taken together, these results suggest that the extracellular portion of the S4 segment resides in an aqueous protein vestibule and is influenced by the state of the external pore.
Keywords: Shaker potassium channel, fluorescence quenching, pore conformational changes
introduction
The Shaker potassium channel, which has served as a model for understanding the behavior of voltage-gated ion channels, opens in response to depolarized potentials to allow potassium flow (Timpe et al., 1988). Opening and closing of the channel is controlled by the channel's voltage sensor, whose movement is reflected by the gating current (Armstrong and Bezanilla, 1973; Bezanilla et al., 1991). Recent studies have shown that this gating current is generated in part by the movement of charged residues in the S2 and S4 segments across the transmembrane electric field (Seoh et al., 1996; Aggarwal and MacKinnon, 1996). Conformational changes associated with the voltage sensor have also been measured using extrinsic fluorescent probes attached to specific sites near the S4 segment (Mannuzzu et al., 1996; Cha and Bezanilla, 1997).
Previous fluorescence studies of proteins have used measurements of anisotropy and quencher accessibility to answer questions about the fluorophore's environment (reviewed by Eftink, 1991). Fluorescence anisotropy measures the rotational mobility of the fluorophore and reflects the fluorophore's environmental constraints. For instance, the anisotropy of fluorophore dissolved in glycerol is very high, consistent with a viscous environment. Fluorescence-quenching studies with various molecules such as D2O and iodide have been used to examine fluorophore exposure to the aqueous environment. By modulating the state of the protein and measuring changes in fluorescence quenching, state-specific accessibilities of particular residues can be determined.
Understanding the mechanism of fluorescence quenching can also yield information about the fluorophore's environment. For instance, changes in fluorescence intensity can be caused by reorientation of the fluorophore's transition dipole, leading to a concomitant change in absorption cross-section (Andreev et al., 1993). Shifts in the excitation spectrum of the dye, which can be caused by fluorophore–fluorophore interactions, can lead to changes in absorption at particular excitation wavelengths and a corresponding change in emission (Burghardt et al., 1996). Changes in the hydrophobicity of the fluorophore's environment can lead to changes in fluorophore quenching. Finally, nearby protein residues can also interact with and quench the fluorophore. By delineating the specific mechanism of quenching in the Shaker potassium channel, a better understanding of the conformational changes near the S4 segment can be obtained.
We report here that the fluorescence changes in the extracellular region of the S4 segment are affected by different substitutions in the pore. This result was unexpected because interactions between the S4 segment and external pore have not previously been observed. The external application of tetraethylammonium (TEA)1 and agitoxin to a conducting version of the channel also affects the fluorescence quenching through an interaction with the pore. This effect is seen as the elimination of a fluorescence component whose voltage dependence coincides with ionic activation, but whose kinetics are slower. This result suggests that there are conformational changes coupled to channel opening that affect the extracellular portion of the S4 segment and are blocked by TEA or agitoxin.
To better interpret these results, we turned to other techniques to determine the environmental properties of the fluorophore. The modulation of the fluorescence by pH and collisional quenchers, along with anisotropy measurements, indicates that the fluorophore may be interacting with a pH-titratable protein vestibule. This idea is supported by a recent study that suggested that narrow vestibules that line the S4 segment permit the passage of protons but exclude cysteine-reactive reagents (Starace et al., 1997). These experiments necessitated the development of a new optical technique based on an upright microscope and a water-immersion objective. This technique enabled measurements of fluorescence polarization and increased the efficiency of light collection by a factor of >10 over the previous cut-open oocyte epifluorescence setup.
Although the idea of fluorescence quenching by protein residues was substantiated by these results, several other mechanisms that do not involve protein quenching were tested as possible mechanisms for the signal seen near the S4 segment. Although the quenching mechanism near the S4 segment does not appear to involve a reorientation of the fluorophore, a change in environmental hydrophobicity, or a voltage-dependent excitation shift, a site near the S2 segment does undergo a voltage-dependent excitation shift. Thus, other regions of the protein may undergo different changes in environment.
By combining information from the study of the W434F and T449Y Shaker constructs with other measurements, we propose that the voltage-dependent fluorescence quenching of tetramethylrhodamine maleimide (TMRM) near the S4 segment is modulated by the state of the external pore. In addition, properties of the fluorophore indicate the presence of a nearby protein vestibule that lines the extracellular region of the S4 segment.
materials and methods
Modified Cut-Open Oocyte Epifluorescence Setup
The measurement of gating currents were made using the cut-open oocyte technique for spatial voltage homogeneity and fast temporal resolution (Stefani et al., 1994). To make polarization and anisotropy measurements possible and improve the efficiency of light collection, the experimental setup was modified from an inverted microscope with fiber optic (Cha and Bezanilla, 1997) to an upright microscope with a water-immersion objective (Fig. 1). Using this microscope, the intensity of light, as measured at the photodiode or at the CCD, achieved levels more than 10× what was measured with the fiber optic configuration. This difference was due in part to light loss from the coupling between the fiber optic and the oocyte surface, and also from the coupling between the inverted microscope objective and the fiber optic. The water-immersion objective's field of view matched the 600-μm-diameter oocyte surface visible in the top cut-open chamber, and the objective's numerical aperture was larger than that of the optics used in the inverted microscope setup.
Figure 1.
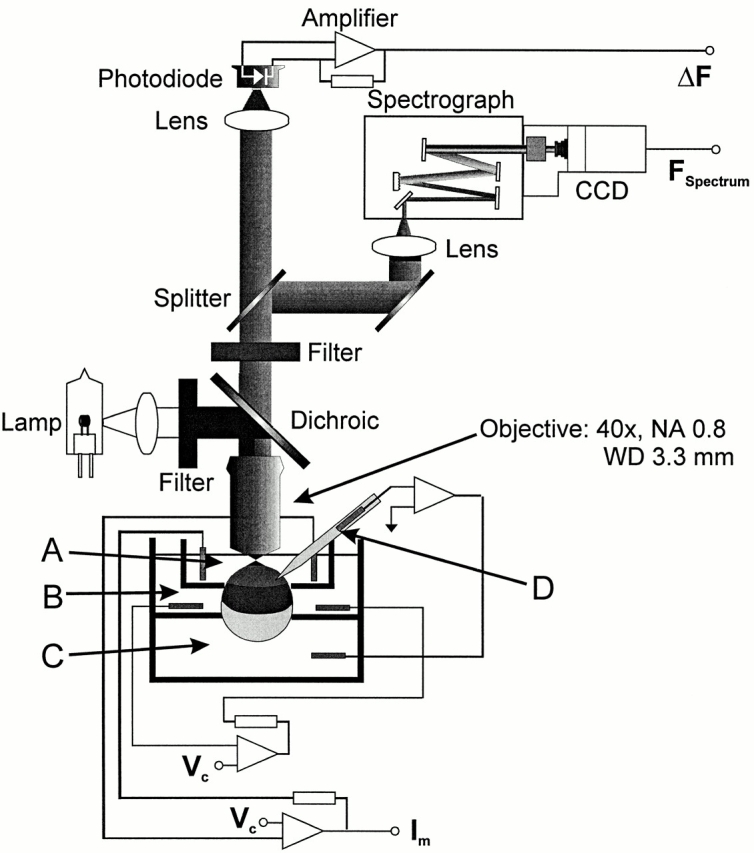
Cut-open oocyte epifluorescence setup modified for polarization measurements. In this upright microscope configuration, the excitation light is produced by a tungsten lamp, filtered, reflected by a dichroic mirror, and coupled directly to the surface of the oocyte by the objective. Because of its narrow taper at the tip and long working distance (WD) of 3.3 mm, the water-immersion objective, with a magnification of 40× and numerical aperture (NA) of 0.8, can be focused directly on the oocyte surface while permitting microelectrode access to the surface. The emitted fluorescence passes through the objective, dichroic mirror, and emission filter, and is sent by an optical splitter to a photodiode for intensity measurements or spectrograph and CCD for spectral measurements. An integrating patch clamp amplifier is used for low noise amplification of the photocurrent. The cut-open oocyte chamber is made up of a top (A), middle (B), and bottom (C) chamber, with a microelectrode (D) that completes the voltage clamp circuit (see materials and methods).
The upright microscope's narrow base permitted the placement of the cut-open oocyte chamber directly beneath the objective. The chamber was placed on a set of sliders so that the oocyte could be mounted and permeabilized under a dissection microscope, and then moved directly underneath a 4× objective for insertion of the microelectrode, and then a 40× objective for optical measurements.
The optical setup consisted of a BX50WI microscope (Olympus Optical, Melville, NY) and used excitation filters, dichroic mirrors, and emission filters (Omega Optical, Brattleboro, VT, and Chroma Technologies, Brattleboro, VT) appropriate for tetramethylrhodamine-5-maleimide (Molecular Probes, Eugene, OR). A microscope tungsten lamp (Carl Zeiss Corp., Thornwood, NY) with a 150-watt filament, powered by a 6286A power supply (Hewlett Packard, Palo Alto, CA), served as the light source. The lamp output was interrupted with a TTL-triggered VS25 shutter (Vincent Associates, Rochester, NY) to minimize photobleaching of the probe.
The LUMPlanFl 40× water-immersion objective had a numerical aperture of 0.8 and working distance of 3.3 mm (Olympus Optical). Light measurements were made with a PIN-020A photodiode (UDT Technologies, Torrance, CA) mounted on an FP-1 fiber optic manipulator (Newport Corp., Irvine, CA), which was attached to the front end of an optical splitter at the microscope's epifluorescence port. The photodiode was attached to the headstage input of an integrating patch clamp amplifier for low noise amplification of the photocurrent. The patch clamp amplifier was an Axopatch-1B (Axon Instruments, Foster City, CA), used with an IHS-1 integrating headstage. A circuit with a 45-volt battery (Eveready, St. Louis, MO) and a 10-GΩ resistor was used to remove integration spikes by offsetting current into the summing junction of the headstage. The fluorescence emission was focused onto the photodiode active area using a microscope condenser lens with a focal distance of 1 cm.
The voltage clamp setup was composed of a top, middle, and bottom chamber (Fig. 1, bottom). The bottom chamber contained the portion of the oocyte that was permeabilized with saponin so that current could be injected directly into the oocyte. The middle chamber served as an electronic guard, and the top chamber, which was painted black, contained the portion of the oocyte membrane from which the fluorescence changes and gating or ionic currents were measured. The voltage electrode measured the membrane potential across the oocyte membrane and was part of the feedback loop that held the interior of the oocyte at virtual ground. Voltage clamp of the oocyte was performed with a CA-1 cut-open oocyte clamp (Dagan Corp., Minneapolis, MN).
Anisotropy and Polarization Measurements
The use of an upright microscope and water-immersion objective enabled measurements of polarization and anisotropy that were previously impossible because the fiber optic used to image the oocyte did not maintain light polarization. With rotatable polarizers in the excitation and emission pathway (Olympus U-AN360; Olympus Optical), two measurements of anisotropy were possible for each polarizer, one in a north–south orientation with respect to the microscope, and the other in an east–west orientation. We measured the fluorescence of labeled, expressing oocytes using all four possible combinations of excitation and emission polarizers: exciter north–south polarized, and emitter either north– south (parallel, I∥) or east–west (perpendicular, I⊥) polarized; or exciter east–west polarized, and emitter either east–west (parallel, I∥) or north–south (perpendicular, I⊥) polarized. By measuring the intensity of fluorescence polarized parallel (I∥) and perpendicular (I⊥) to the excitation light, the steady state anisotropy A of the fluorophore can be calculated using the equation A = (I ∥ − I ⊥)/(I ∥ + 2I ⊥), where A ranges between 0 in the completely isotropic case and 0.4 in the completely anisotropic case (Cantor and Schimmel, 1980). Using the four polarization measurements, two independent calculations of anisotropy can be made. With correction factors to account for the intrinsic polarization properties of the optical path, both calculations should yield the same value of anisotropy, independent of excitation polarization.
The calibration process was done by measuring the anisotropy of a known system, TMRM dissolved in glycerol, and then calculating the correction factor for the north–south and east–west excitation polarizations, which would give the correct anisotropy value from the actual microscope measurements. The anisotropy of TMRM in glycerol is 0.38 (P. Selvin, personal communication); the correction factor was 0.971 in the north–south excitation polarization and 1.312 in the east–west excitation polarization.
The contribution of autofluorescence and fluorescence not arising from channels was quantified by measuring the mean fluorescence intensity from labeled populations of channel-expressing oocytes and comparing them to the fluorescence intensity of labeled and unlabeled nonexpressing oocytes. The results are shown in Table I.
Table I.
Average Fluorescence Intensity from Expressing vs. Nonexpressing Oocytes
| Oocyte group | Uninjected unlabeled | Uninjected labeled | D270C labeled | M356C labeled | A359C labeled | V363C labeled | ||||||
|---|---|---|---|---|---|---|---|---|---|---|---|---|
| Intensity ± SEM | 0.8 ± 0.1 | 21.1 ± 0.9 | 215.3 ± 11.8 | 231.1 ± 27.4 | 124.7 ± 8.7 | 205.6 ± 25.4 |
Because the average fluorescence intensity of a labeled, expressing oocyte is typically 6–10× that of a labeled, uninjected oocyte, >85% of the fluorescence is coming from labeled channels. With this data, we have assumed that the anisotropy, quenching, and polarization measurements primarily reflect the properties of fluorophores attached to the channel.
Spectral Analysis
Spectra were obtained with a Multispec 257i spectrograph (Oriel Instruments, Stratford, CT) with a 1,200 lines/mm grating for 100 nm bandwidth, attached to an Instaspec V CCD camera with image intensifier cooled to −20°C (Oriel Instruments). The spectrograph and CCD were attached to the rear end of an optical splitter at the epifluorescence port of the microscope.
The filter response of the dichroic mirror was corrected by obtaining the transfer function of the mirror. This was calculated by taking the spectrum obtained by transillumination of the tungsten lamp with mirror and dividing it by the spectrum obtained by transillumination of the lamp alone. Spectra of TMRM in different solvents were measured by dissolving TMRM to a 5-μM concentration, and the measurements were taken with a 535DF35 excitation filter and a 570DRLP dichroic mirror (Omega Optical). Because of the shallow cutoff of the dichroic mirror, spectral characteristics of the signal were maintained to <560 nm with this procedure.
Data Acquisition and Analysis
Gating, ionic, and fluorescence currents were acquired with a PC44 board (Innovative Technologies, Moorpark, CA), which interfaces with a Pentium-based computer via an IBM-compatible AT slot. The fluorescence and electrophysiology were simultaneously acquired on two 16-bit analogue-to-digital converters and transferred to two separate channels of the PC44. When data is sampled at intervals longer than 5 μs (all traces presented in this paper), the program running the PC44 board acquires the data at 5 μs per point, and then decimates the data to the required sampling period after digitally filtering the original data to the new Nyquist frequency. The acquisition program and data analysis programs were developed in house and were run in MS-DOS and Windows 95, respectively.
Molecular Biology, Channel Expression, and Oocyte Labeling
The noninactivating (Δ6-46, IR) version of the Shaker H4 channel (H4IR) was originally cloned into an engineered version of the pBSTA vector. Two different vector backgrounds were used: a nonconducting version of the channel (W434F), and a conducting version of the channel that tightly binds TEA and agitoxin 2 (T449Y). The agitoxin 2 was kindly provided by Dr. Adrian Gross (UCLA, Los Angeles, CA). For site-directed mutagenesis of all constructs, a two-step PCR protocol (Moore, 1994) was used to introduce mutations between the XbaI and BglII sites into the Shaker background. After subsequent cloning into the pBSTA vector, the cDNA generated by PCR was sequenced to exclude the possibility of unwanted mutations. The constructs are designated by the original amino acid, residue number, and substituted amino acid (i.e., M356C designates the construct where cysteine was substituted for methionine at residue 356).
The cRNA was transcribed in vitro with the T7 mMessage machine kit (Ambion Inc., Austin, TX), and 50 nl cRNA at a concentration of 100 ng/μl were injected into each Xenopus oocyte. Experiments were performed from 2 to 7 d after injection. The sterile oocyte incubation solution consisted of 100 mM NaCl, 2 mM KCl, 1.8 mM CaCl2, 1 mM MgCl2, 5 mM HEPES, 10 μM EDTA, and 100 μM dithiothreitol.
For fluorescent labeling, Xenopus oocytes were incubated in a depolarizing solution containing 5 μM tetramethylrhodamine-5-maleimide (Mannuzzu et al., 1996) at 18°C for 40 min.
results
Modulation of Fluorescence Quenching near the S4 Segment by Substitutions in the External Pore
By substituting cysteine for a specific residue, site-directed fluorescent labeling can be used to measure site-specific environmental changes with the covalent attachment of an extrinsic, membrane-impermeant fluorescent probe to the introduced cysteine (Mannuzzu et al., 1996; Cha and Bezanilla, 1997). Using this technique, sites M356C and A359C, located in the extracellular portion of the S4 segment (as a reference, R362 is the outermost charged residue in the S4 segment), displayed voltage-dependent fluorescence changes with kinetic and steady state properties similar to those of the gating currents. Thus, the fluorescence changes near the S4 segment appear to reflect conformational changes associated with movement of the voltage sensor.
The properties of the fluorescence signal measured at sites near the S4 segment are also affected by mutations in the external pore. This result was surprising because it has not been shown that the S4 segment is affected by the state of the external pore. In the fluorescence traces for the M356C construct combined with the T449Y mutation in the external pore (M356C T449Y), there is a slow fluorescence component that is visible at large depolarizations and is absent in the M356C construct combined with the W434F mutation in the external pore (M356C W434F) (Fig. 2 A). This component is likely responsible for the shallow voltage dependence seen in the F-V curve of the M356C T449Y construct, in contrast to the M356C W434F construct (Fig. 2 B).
Figure 2.
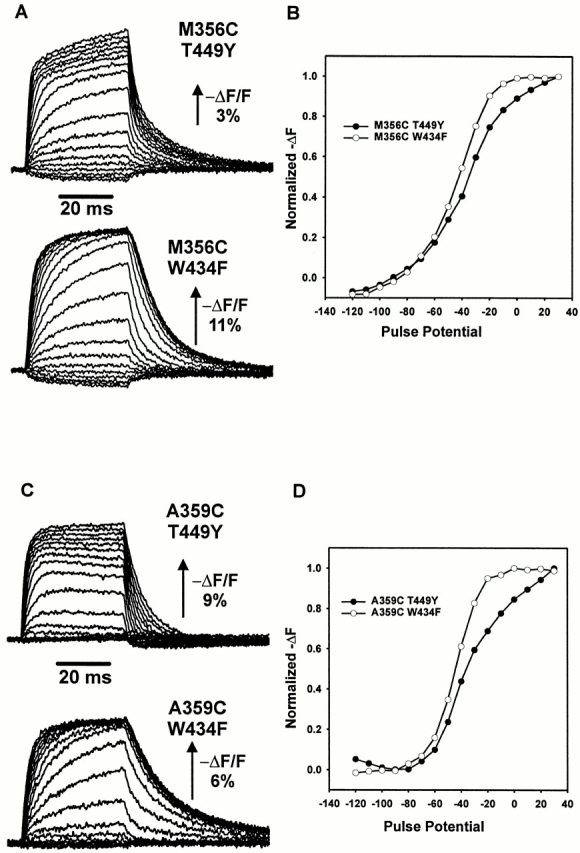
Effects of different pore substitutions on fluorescence quenching near the S4 segment. (A) Fluorescence signals from M356C T449Y and M356C W434F, recorded for a 40-ms pulse from a holding potential of −90 mV to a range of potentials between −120 and 50 mV. An upward deflection of the trace indicates a decrease in fluorescence. Scale bar indicates the magnitude of the percent decrease of total fluorescence (−ΔF/F). (B) Fluorescence change as a function of voltage at the end of the 40-ms pulse for the signals shown in A, normalized to the largest fluorescence change. The traces shown were taken as single sweeps. (C) Fluorescence signals from A359C T449Y and A359C W434F, recorded for a 40-ms pulse from −90 mV to a range of potentials between −120 and 50 mV. (D) Fluorescence change as a function of voltage at the end of the 40-ms pulse for the signals shown in C. The traces shown were taken as single sweeps.
Fluorescence signals from site A359C are also affected by pore substitutions: the kinetics for the A359C T449Y construct are considerably different than for the A359C W434F construct (Fig. 2 C). In this case, the fluorescence kinetics appear to be faster for A359C T449Y than for A359C W434F. The F-V curve also reflects a shallow voltage dependence of the fluorescence changes in the A359C T449Y construct in comparison with the A359C W434F construct (Fig. 2 D).
The mutations W434F and T449Y, both located in the external mouth of the pore, have very different effects on conduction. The tryptophan-to-phenylalanine mutation at residue 434 (W434F) prevents conduction without affecting the conformational changes that occur in the internal mouth of the pore, as judged from the effects of internal TEA on the gating currents (Perozo et al., 1993). In comparison, the threonine-to-tyrosine mutation at residue 449 (T449Y) preserves ionic conduction and increases the affinity of ionic blockers such as TEA and agitoxin (MacKinnon and Yellen, 1990; Heginbotham and MacKinnon, 1992; Gross and MacKinnon, 1996). The differences between these two constructs could be attributed either to changes in the movement of the voltage sensor or changes in the fluorophore's environment introduced by the pore mutations. A comparison of the gating currents of conducting and nonconducting (W434F) constructs indicate that the voltage sensor properties do not appear to be altered by this pore substitution (Perozo et al., 1993). Thus, one possible explanation for the effect is that these pore mutations modify the channel structure so that a different optical profile is seen by the fluorophore. Another possibility is that the state of the external pore may be coupled to the state of the S4 segment in a manner that is not easily observed in the gating currents. A third explanation, which will be addressed in the next section, is that the presence of ion flow through the channel directly affects the fluorophore.
Effects of TEA and Agitoxin on Fluorescence Quenching
To determine whether ion flow through the channel affects fluorophore properties near the S4 segment, we compared the fluorescence signals in the M356C T449Y construct before (Fig. 3 A) and after (Fig. 3 B) the application of external 120 mM TEA-Mes to block the outward flow of potassium. The fluorescence traces are superimposable at small depolarizations but diverge for larger depolarizations. This is more clearly seen in a plot of the fluorescence change versus voltage, or F-V curve (Fig. 3 C). A similar effect in the M356C T449Y construct was seen when ionic current was blocked by the addition of 3 μM agitoxin to the external solution (Fig. 3, D–F). In both cases, the fluorescence quenching became much larger after blocking ionic flow.
Figure 3.

Effects of pore blockers TEA and agitoxin on fluorescence quenching for construct M356C T449Y. (A) Fluorescence traces for M356C T449Y before the application of external 120 mM TEA-Mes, taken in 40-ms pulses from a holding potential of −90 mV to potentials between −120 and 50 mV. Ionic currents (inset) were recorded with internal 120 mM K-Mes solution and external 10 mM K-Mes solution before the addition of TEA, with a current scale of 50 μA and time scale of 102 ms. The traces shown were taken as single sweeps. (B) Same as A, taken after application of external 120 mM TEA-Mes. (C) Plot of fluorescence change at the end of the 40-ms pulse as function of pulse potential, normalized to the largest fluorescence change observed during the experiment, before (•) and after (○) application of TEA. (D) Same as A, taken before application of ∼3 μM agitoxin 2. (E) Same as B, taken after application of ∼3 μM agitoxin 2. (F) Same as C, before and after application of agitoxin.
Although the characteristics of the fluorescence signal are somewhat different, a similar effect of TEA or agitoxin is seen at a second site, A359C, which lies just three residues closer to the S4 segment (Fig. 4). Again, the fluorescence signals are superimposable at small depolarizations, but become larger at potentials where the channel has opened (Fig. 4, C and F). These effects do not appear to be related to series resistance error, as the effect is consistently observed in oocytes independent of the size of the ionic currents.
Figure 4.

Effects of pore blockers TEA and agitoxin on fluorescence quenching for construct A359C T449Y. (A) Fluorescence traces for A359C T449Y before the application of external 120 mM TEA-Mes, taken in 40-ms pulses from a holding potential of −90 mV to potentials between −120 and 50 mV. Ionic currents (inset) were recorded with internal 120 mM K-Mes solution and external 10 mM K-Mes solution before the addition of TEA, with a current scale of 60 μA and time scale of 102 ms. The traces shown were taken as single sweeps. (B) Same as A, taken after application of external 120 mM TEA-Mes. (C) Plot of fluorescence change at the end of the 40-ms pulse as function of pulse potential, normalized to the largest fluorescence change observed during the experiment, before (•) and after (○) application of TEA. (D) Same as A, taken before application of ∼3 μM agitoxin 2. (E) Same as B, taken after application of ∼3 μM agitoxin 2. (F) Same as C, before and after application of agitoxin.
The effects of TEA or agitoxin on the fluorescence at both sites can be obtained by subtracting the fluorescence signals before and after blocker application to obtain the fluorescence difference (dF, see Fig. 5). This effect, as measured by the fluorescence difference before and after the addition of pore blocker, displays a voltage dependence (dF-V) that coincides with ionic conductance, or channel activation (G -V).
Figure 5.

Characteristics of the fluorescence difference near the S4 segment after the application of pore blockers. (top left) The fluorescence difference traces, computed as the fluorescence before TEA minus the fluorescence after TEA application as a function of pulse potential for M356C T449Y, taken from a holding potential of −90 mV to potentials between −120 and 50 mV. (bottom left) A comparison of the voltage dependence of ionic conductance (•) and fluorescence difference (○), taken at the end of a 40-ms pulse from a holding potential of −90 mV. (top right) Same as top left, but using agitoxin in place of TEA. (bottom left) Same as top left, for A359C T449Y with TEA. (bottom right) Same as bottom left, but using agitoxin in place of TEA.
It is unlikely that this modulation is due to a direct interaction of TEA or agitoxin and the fluorophore. Adding either TEA or agitoxin to either W434F construct (M356C, A359C) does not affect the fluorescence signal (data not shown). However, it is possible that the fluorophore is being directly affected by potassium flux. If this were the case, we would expect the following four results: first, the voltage dependence of potassium-based quenching should follow the current-voltage, or I-V curve, and consequently should remain linear at depolarizing potentials. Second, the application of TEA or agitoxin should decrease the quenching of the fluorophore at depolarized potentials by reducing outward potassium flow. Third, the time course of the fluorescence difference should follow the kinetics of ionic current. Fourth, when the direction of ionic current reverses, the fluorescence intensity should also reverse and show substantial intensity changes that mirror the direction of ionic flow.
We found that none of these results apply to the measured fluorescence difference. First, the voltage dependence of the fluorescence difference saturates at large depolarizations (Fig. 5). Second, the application of TEA or agitoxin actually increases the quenching seen at depolarized potentials (Figs. 3 and 4). To address the third point, we compared the kinetics of the fluorescence difference to ionic current difference. Although the voltage dependence of this signal matches the voltage dependence of ionic conductance (Fig. 5), the kinetics of this signal are significantly slower than those of ionic activation (Fig. 6). For three different potentials for each combination of site and blocker, the ionic current difference and fluorescence difference for each potential were superimposed by normalizing to the final value of a 40-ms pulse from −90 mV. From this comparison, it is apparent that the fluorescence signal is generally slower than the ionic current difference at these potentials for each site and blocker. With regard to the fourth point, when the ionic current reverses direction during repolarization (Figs. 3 and 4, insets), the fluorescence does not demonstrate a similar reversal or increase from the initial intensity level. Instead, the fluorescence decays back to its original level, suggesting that the fluorescence is not directly affected by the direction of ionic flow. Taken together, these observations argue that TEA and agitoxin do not modulate fluorescence by the presence or absence of ion flow. Instead, TEA and agitoxin seem to modulate fluorescence by a mechanism related to their ability to prevent conduction. These molecules may inhibit conformational changes that normally occur in the outside region of the conducting channel. These conformational changes, which are coupled to channel opening, may modulate the fluorescence quenching seen at sites near the S4 segment.
Figure 6.

Comparison of the kinetics of the dF with ionic activation. (A) Ionic current differences obtained with the application of TEA to M356C T449Y, superimposed on the measured dF. The data was obtained for 40-ms pulses from −90 mV to three different potentials: −20 (bottom), −10 (middle), and 0 (top) mV. The fluorescence signals are represented by the jagged, thin traces, and ionic current differences are represented by the smooth, thick traces. (B) Same as A, obtained with the application of agitoxin to M356C T449Y. (C) Ionic current differences obtained with the application of TEA to A359C T449Y, superimposed on the measured dF. The data was obtained for 40-ms pulses from −90 mV to three different potentials: −30 (bottom), −20 (middle), and −10 (top) mV. As above, the fluorescence signals are represented by the jagged, thin traces, and ionic currents are represented by the smooth, thick traces. (D) Same as C, obtained with the application of agitoxin to A359C T449Y.
Modulation of Fluorescence by pH Indicates Possible Interactions with pH-titratable Residues
One of the implications of the previous experiments is that the fluorophore may be interacting with another region of the protein. To determine whether the fluorophore may be quenched by nearby protein residues, we examined the characteristics of the fluorophore environment by modulating the external pH. Because TMRM's quantum yield does not change with pH, modulation of TMRM fluorescence by pH would indicate interaction with the probe with a nearby protein whose properties change with pH. The lack of effect of pH on TMRM alone was confirmed by determining that the background fluorescence of uninjected, labeled oocytes does not change with external pH (data not shown). Thus, changing the pH should not directly modulate the fluorescence signal from a labeled site on the protein.
Nevertheless, changing the pH shifts the gating charge versus voltage, or Q-V curve, due to changes in the surface charge detected by the voltage sensor (Starace et al., 1997). Because fluorescence changes at sites near the S4 segment reflect properties of the voltage sensor, the F-V curves at sites M356C and A359C as a function of pH should reflect this shift caused by surface charge. Fig. 7 illustrates the changes that occur in the fluorescence intensity versus voltage curves as a function of pH. As expected, the curve is shifted by the external pH, with pH 5.1 corresponding to the curve shifted most to depolarized potentials.
Figure 7.
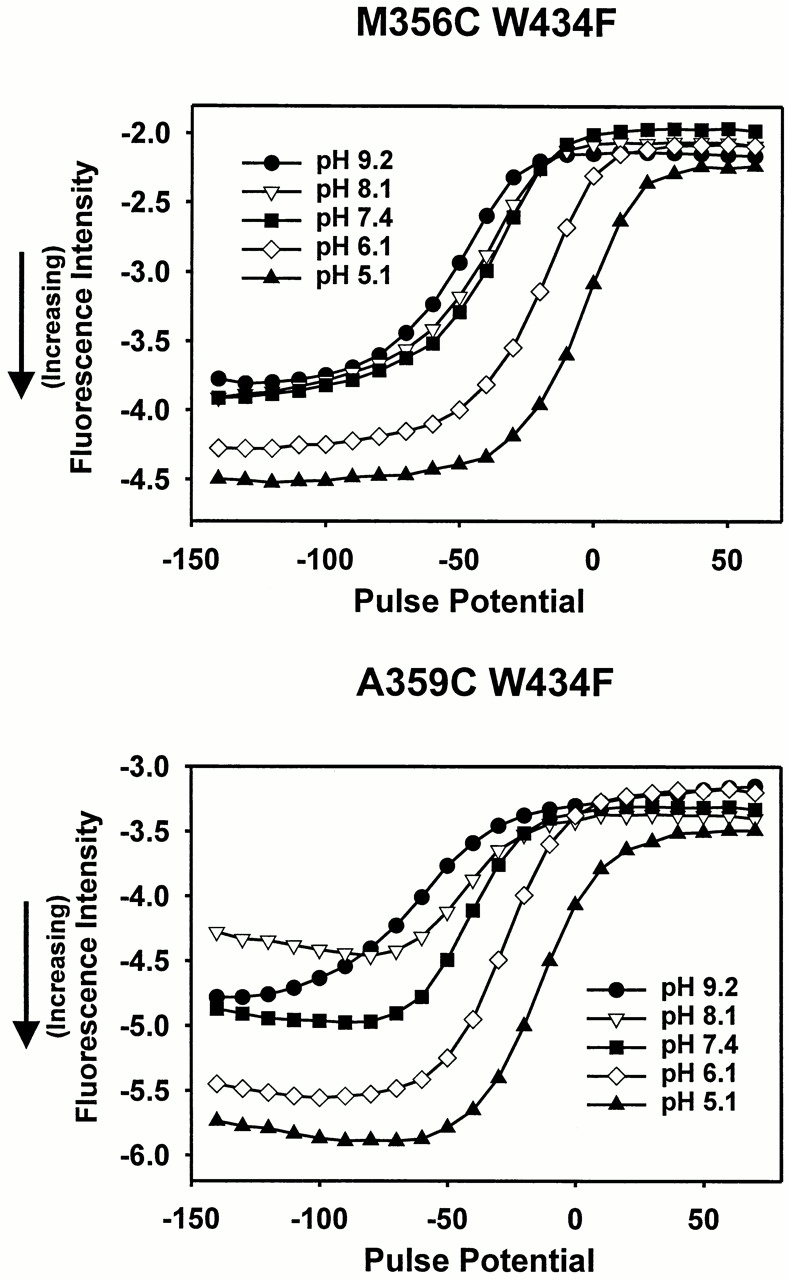
pH-dependent modulation of TMRM fluorescence near the S4 segment. (top) Fluorescence intensity for M356C W434F, taken at the end of a 40-ms pulse from a holding potential of −90 mV, for five different external pH values: 9.2 (•), 8.1 (▿), 7.4 (▪), 6.1 (⋄), and 5.1 (▴). Larger negative fluorescence values indicate an increase in intensity. The fluorescence intensities were measured starting at pH 9.2, going through 8.1, 7.4, 6.1, to 5.1, and then returning through 6.1, 7.4, 8.1, to 9.2, and averaging pre- and post-pH 5.1 intensity measurements for the same oocyte. For this experiment, an offset was applied to subtract a large amount of the background fluorescence. (bottom) Fluorescence intensity for A359C W434F, taken at the end of a 40-ms pulse from −90 mV, for the same pH values, using the symbols and protocol described above.
However, in addition to the shift, there is a difference in the magnitude of the TMRM intensity as a function of pH at both sites, indicating that pH does modulate the voltage-dependent quenching. The increase in fluorescence intensity is largest at hyperpolarized potentials and acidic pH values. Because TMRM's quantum yield is not directly affected by pH, it appears that pH affects the properties of the quencher that interacts with the probe. In addition, both sites show a similar increase in intensity at more acidic pH values. This indicates that the fluorophore at either site may be interacting with a similar region of protein.
This leads to two possible hypotheses: pH may affect the global conformation of the channel so that the probe interacts with a different region of the channel, or pH may affect the nearby region of protein, which interacts directly with the probe. The global effect of pH, as seen by a shift in the voltage axis, results from the change in surface charge. If this change in surface charge were responsible for conformational changes that modulate the fluorescence, then other methods that change the surface charge should have a similar effect. Increasing the concentration of external calcium mimics the surface charge effects of acidic pH and shifts the Q-V curve to more depolarized potentials. However, changing the calcium concentration from 1.8 to 20 mM shifts the F-V curve without modulating the magnitude of the fluorescence at any potential (Fig. 8). This implies that the fluorescence quenching of the probe is independent of changes in surface charge, which supports the idea that there is a region of protein that interacts directly with the fluorophore. This pH effect could either be direct (nearby residues quench differently because of a change in charge) or indirect (the fluorophore moves to a different environment because of electrostatic changes caused by pH).
Figure 8.
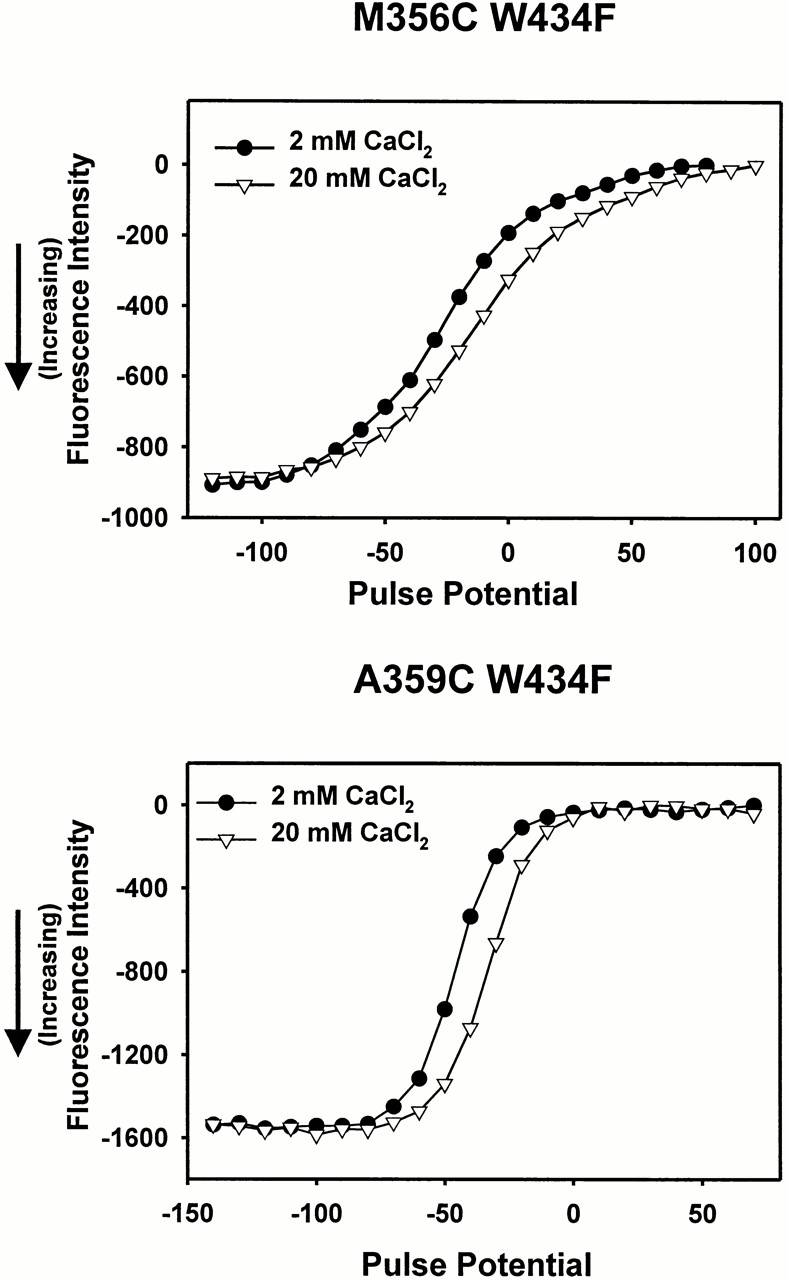
Effects of changing CaCl2 concentration on TMRM fluorescence near the S4 segment. (top) Fluorescence intensity for M356C W434F, taken at the end of a 40-ms pulse from a holding potential of −90 mV, in the presence of 2 (•) and 20 (▿) mM CaCl2 for the same oocyte. (bottom) Fluorescence intensity for A359C W434F, taken at the end of a 40-ms pulse from a holding potential of −90 mV, in the presence of 2 (•) and 20 (▿) mM CaCl2 for the same oocyte.
Differential Access of Collisional Quenchers Indicate the Presence of an Aqueous Protein Vestibule Surrounding the Extracellular Portion of the S4 Segment
If the fluorophore were interacting with a nearby region of protein that acts as a quencher as a function of voltage, one might expect that accessibility to the fluorophore would also be constrained by this region of protein as a function of voltage. Thus, using quenchers with different properties to examine residue accessibility could yield information about nearby structural rearrangements (Arias, 1993; Eftink, 1994). Iodide, a negatively charged anion, quenches sites that are exposed to solvent in an electrostatically dependent manner. In comparison, D2O is a much smaller quencher whose substitution for H2O typically increases fluorophore intensity at solvent-exposed sites. We measured the effects of these solvents on free TMRM and determined that its intensity decreases in the presence of iodide and increases in the presence of D2O (Fig. 9). With this knowledge, we looked at the accessibility of specific residues to both quenchers as a function of voltage.
Figure 9.

Spectral characteristics of TMRM in different solvents. Spectra for TMRM were obtained as described in the materials and methods section. The spectral intensity of 5 μM TMRM were measured in 120 mM N-methyl-d-glucamine (NMG)-Mes with D2O (D2O), normal 120 mM NMG-Mes (H2O), and 50 mM KI + 70 mM NMG-Mes (KI).
We first examined the accessibility of TMRM at positions M356C and A359C to external iodide. The change in fluorescence caused by quencher was measured as the intensity ratio (R) of fluorescence intensity measured after addition of quencher to the fluorescence intensity measured before addition of quencher (Fig. 10). If the fluorescence intensity after quencher application is less than the fluorescence intensity before quencher application, then R < 1. At both sites near the S4 segment, R < 1 (P < 0.01), indicating that iodide is effective in quenching the TMRM fluorescence at both sites and therefore has access to these sites (Fig. 10 A, left).
Figure 10.

Effects of collisional quenchers on TMRM fluorescence near the S4 segment. (A, left) The intensity ratio for constructs M356C W434F and A359C W434F was computed by dividing the fluorescence intensity after the application of 50 mM KI + 70 mM NMG-Mes by the fluorescence intensity before iodide application. Values <1.0 indicate a decrease in fluorescence after application. Fluorescence intensities were measured at either −90 (black) or 0 (white) mV, with error bars representing SEM (M356C, n = 7; A359C, n = 4). The statistical likelihood of no effect (P) was calculated as the probability of obtaining these statistics, given a true ratio of 1. For all four measurements, P < 0.01. (right) Ratio of the iodide intensity ratio at −90 mV (R−90 mV) to intensity ratio at 0 mV (R0 mV) for constructs M356C W434F and A359C W434F, with error bars = SEM (M356C, n = 7; A359C, n = 4). Values >1 indicate that the intensity ratio at −90 mV is larger than the intensity ratio at 0 mV. M356C, P < 0.05; A359C, P = 0.13. (B, left) The intensity ratio for constructs M356C W434F and A359C W434F was computed by dividing the fluorescence intensity after the application of 120 mM NMG-Mes in D2O by the fluorescence intensity before D2O application. Values >1.0 indicate an increase in fluorescence after application. Fluorescence intensities were measured at either −90 (black) or 0 (white) mV, with error bars = SEM (M356C, n = 6; A359C, n = 6). For all four measurements, P < 0.01. (right) Ratio of the D2O intensity ratio at −90 mV (R−90 mV) to intensity ratio at 0 mV (R0 mV) for constructs M356C W434F and A359C W434F, with error bars = SEM (M356C, n = 6; A359C, n = 6). Values <1 indicate that the intensity ratio at −90 mV is smaller than the intensity ratio at 0 mV. For both measurements, P < 0.01.
To determine the relative accessibility to iodide as a function of potential, the ratio of R at −90 mV (R−90 mV) to R at 0 mV (R0 mV) was calculated (Fig. 10 A, right). Because the voltage was held at 0 mV, the channels are likely in the slow-inactivated state. At site M356C, R−90 mV: R0 mV > 1 (P < 0.05), indicating that iodide appears to have better access at depolarized potentials.
The accessibility to D2O at both sites was determined using the same ratios (Fig. 10 B). Since R > 1, the fluorescence intensity increases after the application of D2O at both sites (P < 0.01) (Fig. 10 B, left). Thus, both sites also appear to be accessible to water at −90 and 0 mV. This makes it highly unlikely that the fluorescence change is caused by movement of the fluorophore from a completely hydrophobic environment into the aqueous environment. This was also previously inferred from spectral analysis (Cha and Bezanilla, 1997).
The ratio of R at −90 mV to R at 0 mV was also calculated for D2O. At site A359C, R−90 mV:R0 mV < 1 (P < 0.01), indicating better access at depolarized potentials. However, M356C shows a value >1 (P < 0.01), indicating that D2O access is favored at hyperpolarized potentials. At first, this result appears to contradict the result obtained with iodide. But the differential access can be explained by the properties of these quenchers. Because iodide is negatively charged, it can show preferential access dependent on electrostatic properties, in contrast to water. Thus, M356C may see a more negatively charged environment at hyperpolarized potentials, which would explain the decreased iodide access, while seeing a larger crevice, which would explain the greater D2O accessibility. Similarly, M356C could also see a more positively charged, but smaller crevice at depolarized potentials.
Differences in Anisotropy Are Consistent with Protein Constraints Near the S4 Segment
Fluorescence anisotropy is a reflection of the rotational freedom of the fluorophore during its excited-state lifetime. If the fluorophore were surrounded by protein, one might also expect that anisotropy of the fluorophore would be affected by constraints imposed by nearby residues. To examine possible constraints on the mobility of the fluorophore, the steady state anisotropy values of TMRM attached to different sites in the channel were measured as a function of holding potential (Fig. 11 A). The measured anisotropy is lowest at the site near the S2 segment (D270C), whereas, near the S4 segment, the anisotropy is lowest at residue V363C and is larger at sites M356C and A359C, regardless of pore mutation. One view of the S4 segment is that some residues in the S4 segment are relatively buried, while more extracellular residues in the S4 segment appear to be more accessible (Larsson et al., 1996). This data is the opposite of what would be expected if residues in the S4 segment were constrained by protein or lipid, and residues outside the S4 segment lie further from these constraints. In addition, this profile implies that this region near the S4 segment may lie in close proximity to another region of protein that affects the anisotropy of TMRM.
Figure 11.
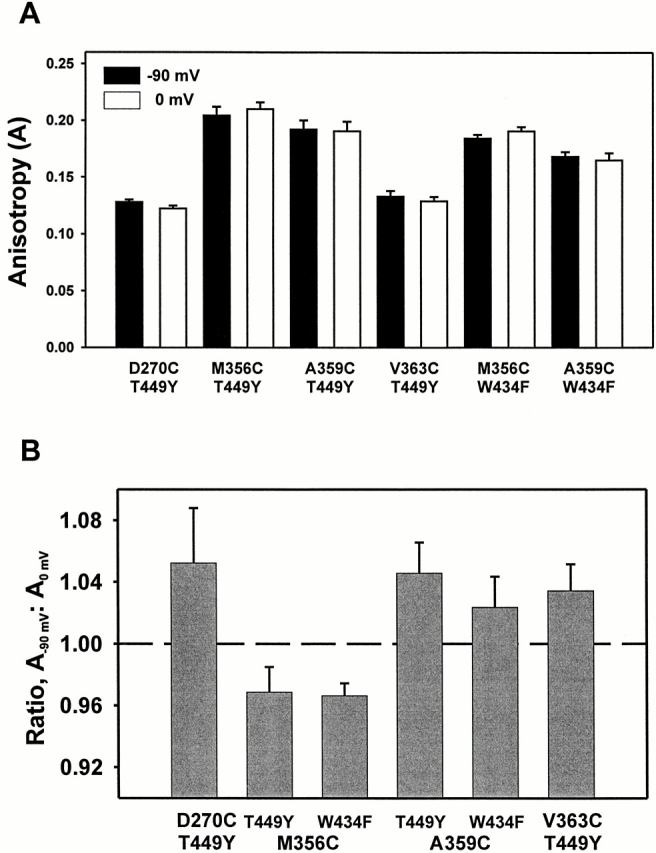
Steady state TMRM anisotropy values for different sites in the channel. (A) Steady state anisotropy, measured as described in materials and methods, for six different constructs: the conducting channels D270C T449Y, M356C T449Y, A359C T449Y, V363C T449Y, and the nonconducting channels M356C W434F and A359C W434F. Bars correspond to a holding potential of −90 (black) or 0 (white) mV, with error bars = SEM (D270C T449Y, n = 4; M356C T449Y, n = 8; A359C T449Y, n = 12; V363C T449Y, n = 6; M356C W434F, n = 8; A359C W434F, n = 6). (B) Ratio of anisotropy at −90 mV (A−90 mV) to anisotropy at 0 mV (A0 mV) for the six constructs, with error bars = SEM (same n as above). The probability of no change in anisotropy as function of voltage: D270C, P = 0.14; M356C, P < 0.01; A359C, P < 0.01; V363C, P < 0.01.
These anisotropy values change slightly in response to voltage, and the direction of the change is dependent on the site. The ratio was taken of the anisotropy at −90 mV (A−90 mV) to the anisotropy at 0 mV (A0 mV) (Fig. 11 B). At site M356C, the fluorophore shows larger anisotropy at depolarized potentials (P < 0.01), whereas at sites A359C (P < 0.01) and V363C (P < 0.01), the anisotropy decreases at depolarized potentials. This implies that the environment near residue M356C becomes more constrained at depolarized potentials, which is consistent with the results from D2O exposure. Taken together, these results are not consistent with a model where the S4 segment simply moves from within the lipid bilayer into the aqueous environment as the channel opens. It is more likely that all three sites lie in a vestibule surrounded by protein, and some residues may experience relief from nearby protein constraints at depolarized potentials (A359C, V363C), while others may not (M356C).
Changes in Fluorophore Orientation Are Not Responsible for the Fluorescence Quenching
To test the hypothesis that the voltage-dependent fluorescence changes are due to quenching by a nearby region of protein, we explored two other mechanisms that could explain the fluorescence changes. The first mechanism we tested is a voltage-dependent reorientation of the fluorophore. With polarized excitation light, only those fluorophores with transition dipoles oriented parallel to the polarization of incoming light will be excited; with a polarized emission filter, only the fluorophores that emit light with that polarization will be seen. The change in fluorescence intensity could be caused by a reorientation of the dipole: if the incoming light has polarization properties, which is typical for an epifluorescence setup with a dichroic mirror, then a reorientation of the fluorophore's dipole could change the relative absorption of one incoming polarization with respect to another. This polarization shift could modulate the total intensity of the fluorophore emission as well as the relative polarization intensities of emitted fluorescence.
If the change in fluorescence intensity is caused by a change in orientation of the fluorophore and corresponding transition dipole, then the decrease in emitted fluorescence at one excitation polarization should be accompanied by an increase in fluorescence at the perpendicular polarization. To determine whether a change in polarization was responsible for the voltage-dependent fluorescence changes, the F-V curves at sites M356C and A359C were measured at the four possible orientations of excitation and emission polarization. When examining the normalized change in fluorescence as a function of polarization at these sites, the direction and voltage dependence of fluorescence change is maintained at all possible polarizer orientations, indicating that the fluorescence quenching is not caused by changes in orientation of the fluorophore (Fig. 12). Because the fluorescence signal does not change directions as a function of polarization, it cannot be primarily responsible for the voltage-dependent fluorescence change.
Figure 12.

Fluorescence quenching near the S4 segment as a function of polarization. (top) Normalized decrease in fluorescence (−ΔF) as a function of excitation and emission polarization for M356C W434F. The four possible polarization measurements are north–south exciter with perpendicular emitter (•), north– south exciter with parallel emitter (▿), east–west exciter with perpendicular emitter (▪), and east–west exciter with parallel emitter (⋄). Error bars = SEM (n = 4). (bottom) Normalized decrease in fluorescence (−ΔF) as a function of excitation and emission polarization for A359C W434F. Designated symbols are identical to those in the top panel. Error bars = SEM (n = 3).
A Voltage-dependent Excitation Shift Is Responsible for Fluorescence Quenching Near the S2 Segment, but Not Near the S4 Segment
Another possible source of quenching could be the result of a shift in the absorption spectrum, which can be caused by the interaction of neighboring fluorophores and does not typically involve protein quenching (Selwyn and Steinfeld, 1972; Burghardt et al., 1996). To examine the possibility of a shift in the excitation of the fluorophore as a function of voltage, we examined changes in fluorescence as a function of the excitation wavelength. In principle, with a shift of the excitation spectrum, the direction of fluorescence change when exciting on one side of the excitation peak should be the opposite of the direction of the fluorescence change when exciting on the other side of the peak. Fig. 13 A presents simulated excitation and emission spectra to illustrate how this shift in excitation can induce changes in emission. For instance, if the excitation peak shifts to shorter wavelengths when the membrane is depolarized from −90 to 0 mV, then at excitation wavelengths Δλ1, the fluorescence will increase, whereas, at excitation wavelengths Δλ2, the fluorescence will decrease.
Figure 13.

Voltage-dependent excitation shift observed near the S2 segment. (A) This diagram illustrates how a theoretical shift in excitation spectrum can lead to a change in the direction of the fluorescence signal as a function of excitation wavelengths. At −90 mV, a theoretical excitation spectrum (dark trace, top panel) yields increased fluorescence emission when excited at wavelengths Δλ2 compared with Δλ1. At 0 mV, when a shift of the excitation spectrum to shorter wavelengths (to the left) occurs, as seen by the new excitation spectrum (dark trace, bottom panel), the relative fluorescence intensities at wavelengths Δλ1 and Δλ2 reverse. Thus, when exciting at Δλ1 during a pulse from −90 to 0 mV, the fluorescence intensity would increase; when exciting at Δλ2 during the same pulse, the fluorescence intensity would decrease. (B) Changes in fluorescence for construct D270C T449Y when exciting at two different wavelengths: 510–560 nm (top, average of 10 sweeps), and 453–487 nm (bottom, average of 25 sweeps). These changes were evoked in response to 40-ms pulses from −90 mV to potentials from −60 to 50 mV. Upward deflection of the trace indicates a decrease in fluorescence intensity (−ΔF). (C) Fluorescence change (−ΔF) at the end of a 40-ms pulse from −90 mV for the two different excitation wavelengths. Negative values indicate an increase in fluorescence. The curves correspond to excitation wavelengths 453–487 nm (•) and 510–560 nm (▵).
By using different filters to excite several regions of the excitation spectrum of TMRM, we can determine whether the fluorescence change is caused by an excitation shift by looking for a direction reversal of the fluorescence change as a function of excitation wavelength. At site D270C, which is located in the extracellular portion of the S2 segment, there is a small decrease in fluorescence (∼0.5% ΔF/F), denoted by an upward deflection of the trace, in response to a depolarizing pulse to 0 mV when illuminating with light between 510 and 560 nm (Fig. 13 B). In comparison, when illuminating with light between 453 and 487 nm, the fluorescence increases for the same depolarization. This indicates that different wavelengths excite fluorescence on different sides of an excitation peak that shifts in response to voltage. Fluorescence changes were not previously observed at this site because of insufficient optical sensitivity of the setup.
We then examined the normalized fluorescence change as a function of voltage, or F-V curve, at sites M356C and A359C centered at three different wavelengths: 557, 535, and 450 nm. For all filters, the fluorescence decreases in response to depolarizations, and the F-V curve is superimposable at all three excitation wavelengths. This result indicates that there is no excitation shift at either site (Fig. 14). Thus, different fluorescence quenching mechanisms occur in different regions of the channel, and the small fluorescence changes at site D270C arise in a different manner than the large fluorescence changes near the S4 segment. Because the voltage-dependent fluorescence changes in the extracellular region of the S4 segment are not caused by an excitation shift of TMRM, it is unlikely that the underlying mechanism is related to fluorophore–fluorophore interactions, such as dimer formation.
Figure 14.
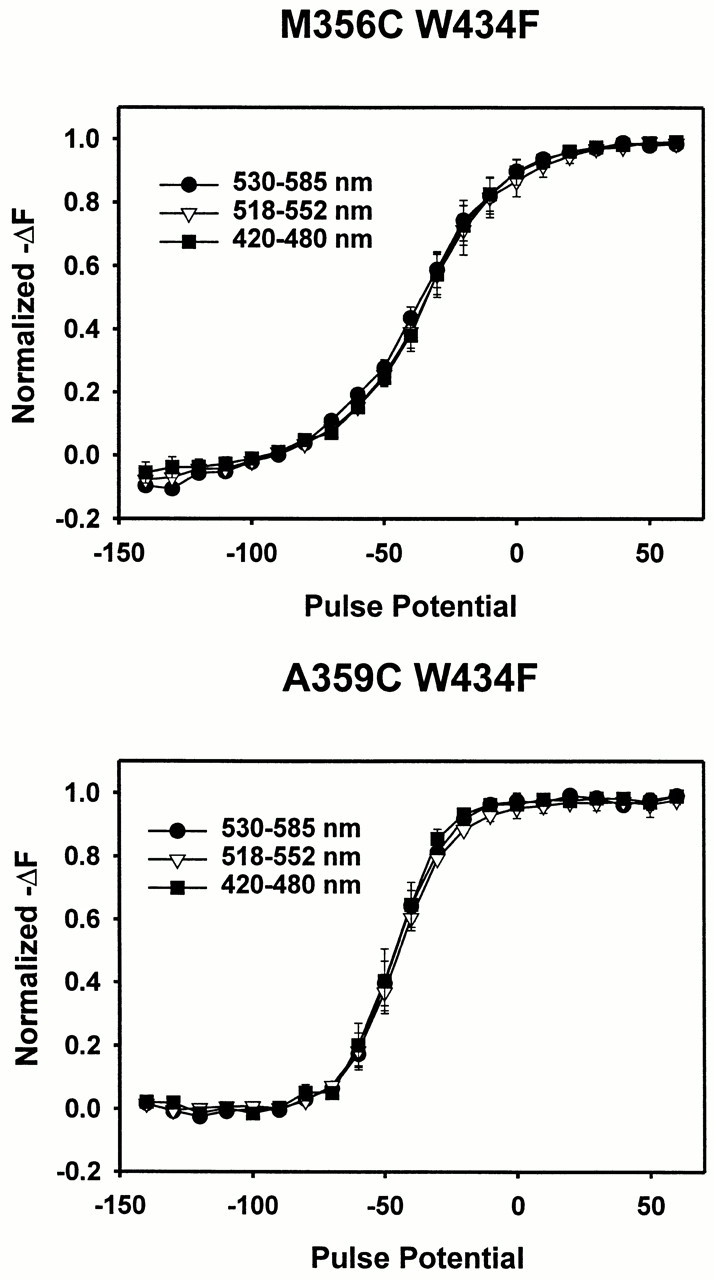
Absence of a voltage-dependent excitation shift near the S4 segment. (A) Normalized decrease in fluorescence (−ΔF) as a function of voltage for M356C W434F at three different excitation wavelengths: 530–585 nm (•), 518–552 nm (▿), and 420–480 nm (▪). The fluorescence was measured at the end of a 40-ms pulse from a holding potential of −90 mV. Error bars = SEM (n = 4). (B) Normalized decrease in fluorescence as a function of voltage for A359C W434F at three different excitation wavelengths, using the same symbols described above. Error bars = SEM (n = 3).
discussion
Implications for Conformational Changes in the External Pore
The fluorescence signal near the S4 segment, which was previously thought to be an indicator of conformational changes specific to the S4 segment itself, is also modulated by mutations and blockers of the external pore. In particular, the conducting T449Y construct shows fluorescence changes with very different characteristics than the nonconducting W434F construct, and the T449Y fluorescence signal changes dramatically with the application of the pore-blocking molecules TEA or agitoxin (Fig. 3). Because this effect is not seen in the W434F construct, these molecules must modulate fluorescence by affecting the state of the pore. This modulation could occur because inhibition of conductance in the external pore could propagate back through the activation pathway and affect the movement of the S4 segment. The other possibility is that the fluorophore's environment contains residues that are affected by the external state of the pore, with the implication that the S4 segment may lie in close proximity to the external pore.
The effect of these blockers, as measured by the fluorescence difference before and after application of blocker, appears to share the voltage dependence of ionic activation, albeit with slower kinetics (Fig. 6). These slower kinetics indicate that the conformational changes represented by these traces are not responsible for directly gating ion flow. But the changes are likely coupled to the open state of the channel and may serve as preparatory steps toward slow inactivation. Similar results were obtained in experiments that identified fluorescence changes at sites F425C and T449C in the external pore, which were slower than ionic activation (Cha and Bezanilla, 1997).
The fluorescence difference also has implications for the structure of the W434F nonconducting construct, whose fluorescence signal is unaffected by TEA or agitoxin. The absence of modulation indicates that the W434F construct may be unable to undergo these external conformational changes near the pore, or that the W434F construct may not effectively bind these blockers. In fact, both hypotheses could hold true, and the mutation may change the pore structure in a manner that prevents conformational changes and reduces TEA and agitoxin affinity. In either case, the W434F mutation alters the structure of the external pore such that the characteristics of the quenching near the S4 segment are different than those seen in the T449Y-conducting construct.
Mechanisms of Fluorescence Quenching in the Shaker Potassium Channel
By studying the mechanism of fluorescence quenching near the S4 segment, we hoped to elucidate the characteristics of the environment surrounding these residues. To this end, several potential quenching mechanisms were ruled out as being responsible for the large voltage-dependent changes in fluorescence intensity. Polarization and excitation shift experiments indicate that neither a reorientation of the fluorophore nor a shift of excitation wavelengths are responsible for the fluorescence change. In addition, access to the fluorophore by D2O at −90 and 0 mV argues strongly against a movement of the fluorophore from a completely hydrophobic environment into an aqueous environment. Thus, the remaining quenching mechanism, voltage-dependent quenching by nearby protein residues, becomes the most likely candidate.
Several other observations support protein-based quenching as the actual mechanism. Modulation of fluorescence by the state of the external pore suggests that the fluorophore may interact with residues affected by the state of the pore. In addition, anisotropy measurements indicate that the environment near the fluorophore becomes more constrained at sites near the S4 segment that show a large fluorescence change (M356C, A359C) than at sites near the S2 segment (D270C) or in the S4 segment itself (V363C), which show little or no fluorescence change. Experiments examining pH titration and the relative accessibility of different quenchers suggest the existence of nearby electrostatic and steric constraints, which are best explained by interactions with a nearby protein vestibule. Thus, the voltage-dependent quenching near the S4 segment appears to depend on quenching by nearby protein residues, which has been seen in other systems (Conibear et al., 1996; Coelho-Sampaio and Voss, 1993).
Properties of a Putative Protein Vestibule Near the S4 Segment
An extracellular protein vestibule near the S4 segment has been proposed, based on histidine scanning mutagenesis (Starace et al., 1997). The experiments presented in this paper can be used to visualize characteristics of residues lining part of this vestibule. An important caveat is that the properties of the environment of residues near the S4 segment have been inferred from characteristics of the fluorophore, which is attached to the residue of interest with a maleimide linker. With a typical length of ∼7 Å, the cysteine-reactive maleimide linker acts as a tether that cannot completely constrain the position of the fluorophore near the residue. The implications of structural features near the labeled site must be made with the knowledge that these structures lie within the reach of a molecule that contains both fluorophore and linker (see Table II).
Table II.
Summary of Fluorescence Characteristics at Different Sites in Shaker
| Site | Less constrained at | More accessible to D2O at | More accessible to iodide at | Modulated by pH at | ||||
|---|---|---|---|---|---|---|---|---|
| M356C | −90 mV | −90 mV | 0 mV | −90 mV | ||||
| A359C | 0 mV | 0 mV | — | −90 mV | ||||
| V363C | 0 mV | — | — | — |
With this in mind, general characteristics of the protein environment can be inferred from the anisotropy, pH, and collisional quencher studies. For instance, given the higher anisotropy values at sites M356C and A359C than at site V363C, it appears that the vestibule may be narrower further into the S3–S4 linker and wider near the beginning of the S4 segment. In addition, anisotropy studies indicate that M356C becomes more constrained at depolarized potentials, indicating that the vestibule is still sensed at depolarized potentials. D2O accessibility studies indicate that the vestibule is aqueous at all sites and a broad range of potentials. The increased accessibility to iodide at depolarized potentials at site M356C indicates that the environment at this site may be positively charged at depolarized potentials, or negatively charged at hyperpolarized potentials.
If the probe is quenched by a residue or group of residues whose ability to quench is pH dependent, likely candidates include aspartic and glutamic acid (pKa ≈ 4–5), as judged from the marked effects and lack of saturation near pH 5 (Fig. 7). Thus, the pH titration data, which indicates possible interaction with glutamic or aspartic acid at hyperpolarized potentials, are consistent with the hypothesis that the fluorophore may lie in a negatively charged environment in the closed state of the channel.
This information, summarized in Table II, can be used to create a preliminary picture of the vestibule near the S4 segment (Fig. 15). This illustration highlights the distinctive properties of these three sites at −90 and 0 mV, particularly at site M356C, which behaves differently than the other sites. This diagram models the movement of the S4 segment as a change in orientation, or tilt, with respect to the transmembrane field (Papazian and Bezanilla, 1997). The negative region of protein near the extracellular S4 segment at −90 mV is consistent with the pH data, and the positive region of protein at −90 mV is consistent with the iodide quenching data. The relative proximity of protein regions to the residues reflects the anisotropy data. This vestibule may also be involved in inhibiting the movement of the voltage sensor after the attachment of charged methanethiosulfonate reagents to sites M356C, A359C, and V363C near the S4 segment (Cheney et al., 1998). Although this gives no more than a rough picture of the environment surrounding the extracellular portion of the S4 segment, it gives a reasonable physical basis to explain the quenching of the fluorophore by the lining of the hydrophilic vestibule.
Figure 15.

Illustration of the protein vestibule near the S4 segment. (left) Visualization of the vestibule characteristics near the S4 segment at −90 mV. The vestibule is shown as two white-to-gray shaded regions, one negatively charged (bottom left) and one positively charged (top right), next to the extracellular loop of the S4 segment. The gray region represents the hydrophobic region where the electric field is focused, and the cylinder represents the S4 segment. (right) Visualization of the vestibule characteristics near the S4 segment at 0 mV. Site M356C is more constrained here than at −90 mV, whereas sites A359C and V363C are less constrained. As above, the vestibule is shown as two white-to-gray shaded regions next to the extracellular loop of the S4 segment, and the gray region represents the hydrophobic region.
Acknowledgments
We thank Dr. Adrian Gross for his help in editing the manuscript. Special thanks go to Dr. Paul Selvin for his contributions and insight into the polarization and anisotropy studies.
This work was supported by National Institutes of Health grant GM-30376 and the Hagiwara Chair funds to F. Bezanilla. A. Cha is also supported by the UCLA Medical Scientist Training Program (GM-08042) and a National Research Service Award from the National Institute of Mental Health (MH-12087).
Abbreviations used in this paper
- dF
fluorescence difference
- R
intensity ratio
- TEA
tetraethylammonium
- TMRM
tetramethylrhodamine maleimide
references
- Aggarwal SK, MacKinnon R. Contribution of the S4 segment to gating charge in the Shaker K+channel. Neuron. 1996;16:1169–1177. doi: 10.1016/s0896-6273(00)80143-9. [DOI] [PubMed] [Google Scholar]
- Andreev OA, Andreeva AL, Borejdo J. Polarization of fluorescently labeled myosin subfragment-1 fully or partially decorating muscle fibers and myofibrils. Biophys J. 1993;65:1027–1038. doi: 10.1016/S0006-3495(93)81161-5. [DOI] [PMC free article] [PubMed] [Google Scholar]
- Arias HR, Valenzuela CF, Johnson DA. Transverse localization of the quinacrine binding site on the Torpedo acetylcholine receptor. J Biol Chem. 1993;268:6348–6355. [PubMed] [Google Scholar]
- Armstrong CM, Bezanilla F. Currents related to movement of the gating particles of sodium channels. Nature. 1973;242:459–461. doi: 10.1038/242459a0. [DOI] [PubMed] [Google Scholar]
- Bezanilla F, Perozo E, Papazian DM, Stefani E. Molecular basis of gating charge immobilization in Shakerpotassium channels. Science. 1991;254:679–683. doi: 10.1126/science.1948047. [DOI] [PubMed] [Google Scholar]
- Burghardt TP, Lyke JE, Ajtai K. Fluorescence emission and anisotropy from rhodamine dimers. Biophys Chem. 1996;59:119–131. doi: 10.1016/0301-4622(95)00118-2. [DOI] [PubMed] [Google Scholar]
- Cantor, C.R., and P.R. Schimmel. 1980. Fluorescence spectroscopy. In Biophysical Chemistry, Part II: Techniques for the Study of Biological Structure and Function. W.H. Freeman and Co., New York. 433–465.
- Cha A, Bezanilla F. Characterizing voltage-dependent conformational changes in the Shaker K+channel with fluorescence. Neuron. 1997;19:1127–1140. doi: 10.1016/s0896-6273(00)80403-1. [DOI] [PubMed] [Google Scholar]
- Cheney MC, Cha A, Bezanilla F. Partial immobilization of Shaker K+channel gating charge by cysteine modification. Biophys J. 1998;74:A214. . (Abstr.) [Google Scholar]
- Coelho-Sampaio T, Voss EW., Jr Pressure-induced dissociation of fluorescein from the anti-fluorescein single-chain antibody 4-4-20. Biochemistry. 1993;32:10929–10935. doi: 10.1021/bi00092a001. [DOI] [PubMed] [Google Scholar]
- Conibear PB, Jeffreys DS, Seehra CK, Eaton RJ, Bagshaw CR. Kinetic and spectroscopic characterization of fluorescent ribose-modified ATP analogs upon interaction with skeletal muscle myosin subfragment 1. Biochemistry. 1996;35:2299–2308. doi: 10.1021/bi951824+. [DOI] [PubMed] [Google Scholar]
- Eftink MR. The use of fluorescence methods to monitor unfolding transitions in proteins. Biophys J. 1994;66:482–501. doi: 10.1016/s0006-3495(94)80799-4. [DOI] [PMC free article] [PubMed] [Google Scholar]
- Eftink, M.R. 1991. Fluorescence techniques for studying protein structure. In Protein Structure Determination. Volume 35. C.H. Suelter, editor. John Wiley & Sons, Inc., New York. 127–205. [DOI] [PubMed]
- Gross A, MacKinnon R. Agitoxin footprinting the Shakerpotassium channel pore. Neuron. 1996;16:399–406. doi: 10.1016/s0896-6273(00)80057-4. [DOI] [PubMed] [Google Scholar]
- Heginbotham L, MacKinnon R. The aromatic binding site for tetraethylammonium ion on potassium channels. Neuron. 1992;8:483–491. doi: 10.1016/0896-6273(92)90276-j. [DOI] [PubMed] [Google Scholar]
- Larsson HP, Baker OS, Dhillon DS, Isacoff EY. Transmembrane movement of the Shaker K+channel S4. Neuron. 1996;16:387–397. doi: 10.1016/s0896-6273(00)80056-2. [DOI] [PubMed] [Google Scholar]
- MacKinnon R, Yellen G. Mutations affecting TEA blockade and ion permeation in voltage-activated K+channels. Science. 1990;250:276–279. doi: 10.1126/science.2218530. [DOI] [PubMed] [Google Scholar]
- Mannuzzu LM, Moronne MM, Isacoff EY. Direct physical measure of conformational rearrangement underlying potassium channel gating. Science. 1996;271:213–216. doi: 10.1126/science.271.5246.213. [DOI] [PubMed] [Google Scholar]
- Moore, D.D. 1994. Mutagenesis of cloned DNA. In Current Protocols in Molecular Biology. F.M. Ausubel, R. Brent, R.E. Kingston, D.D. Moore, J.G. Seidman, J.A. Smith, and K. Struhl, editors. John Wiley & Sons, Inc., New York. 8.2.8–8.2.11.
- Papazian DM, Bezanilla F. How does an ion channel sense voltage? . News Physiol Sci. 1997;12:203–210. [Google Scholar]
- Perozo E, MacKinnon R, Bezanilla F, Stefani E. Gating currents from a nonconducting mutant reveal open-closed conformations in Shaker K+channels. Neuron. 1993;11:353–358. doi: 10.1016/0896-6273(93)90190-3. [DOI] [PubMed] [Google Scholar]
- Selwyn JE, Steinfeld JI. Aggregation equilibria of xanthene dyes. J Phys Chem. 1972;76:762–774. [Google Scholar]
- Seoh SA, Sigg D, Papazian DM, Bezanilla F. Voltage-sensing residues in the S2 and S4 segments of the Shaker K+channel. Neuron. 1996;16:1159–1167. doi: 10.1016/s0896-6273(00)80142-7. [DOI] [PubMed] [Google Scholar]
- Stefani E, Toro L, Perozo E, Bezanilla F. Gating of Shaker K+channels: I. Ionic and gating currents. Biophys J. 1994;66:996–1010. doi: 10.1016/S0006-3495(94)80881-1. [DOI] [PMC free article] [PubMed] [Google Scholar]
- Starace D, Stefani E, Bezanilla F. Voltage-dependent proton transport by the voltage sensor of the Shaker K+channel. Neuron. 1997;19:1319–1327. doi: 10.1016/s0896-6273(00)80422-5. [DOI] [PubMed] [Google Scholar]
- Timpe LC, Schwarz TL, Tempel BL, Papazian DM, Jan YN, Jan LY. Expression of functional potassium channels from Shaker cDNA in Xenopusoocytes. Nature. 1988;331:143–145. doi: 10.1038/331143a0. [DOI] [PubMed] [Google Scholar]