

Abstract
H+ currents in human neutrophils, rat alveolar epithelial cells, and several mammalian phagocyte cell lines were studied using whole-cell and excised-patch tight-seal voltage clamp techniques at temperatures between 6 and 42°C. Effects of temperature on gating kinetics were distinguished from effects on the H+ current amplitude. The activation and deactivation of H+ currents were both highly temperature sensitive, with a Q 10 of 6–9 (activation energy, E a, ≈ 30–38 kcal/mol), greater than for most other ion channels. The similarity of E a for channel opening and closing suggests that the same step may be rate determining. In addition, when the turn-on of H+ currents with depolarization was fitted by a delay and single exponential, both the delay and the time constant (τact) had similarly high Q 10. These results could be explained if H+ channels were composed of several subunits, each of which undergoes a single rate-determining gating transition. H+ current gating in all mammalian cells studied had similarly strong temperature dependences. The H+ conductance increased markedly with temperature, with Q 10 ≥ 2 in whole-cell experiments. In excised patches where depletion would affect the measurement less, the Q 10 was 2.8 at >20°C and 5.3 at <20°C. This temperature sensitivity is much greater than for most other ion channels and for H+ conduction in aqueous solution, but is in the range reported for H+ transport mechanisms other than channels; e.g., carriers and pumps. Evidently, under the conditions employed, the rate-determining step in H+ permeation occurs not in the diffusional approach but during permeation through the channel itself. The large E a of permeation intrinsically limits the conductance of this channel, and appears inconsistent with the channel being a water-filled pore. At physiological temperature, H+ channels provide mammalian cells with an enormous capacity for proton extrusion.
Keywords: proton channels, ion channels, pH, microglia, Q10
introduction
Voltage-gated H+ channels were described first in snail neurons (Thomas and Meech, 1982; Byerly et al., 1984), and more recently have been found in mammalian cells (DeCoursey, 1991). A recent burst of interest in this channel has resulted from its proposed role in extruding protons from neutrophils and other phagocytes. During the “respiratory burst,” NADPH oxidase secretes superoxide anion to kill bacteria and simultaneously releases protons into the cytoplasm. Henderson and colleagues (1987, 1988a, 1988b) deduced that electrogenic H+ efflux provided the necessary charge compensation, on the basis of pH and membrane potential changes in human neutrophils. The presence of voltage- and pH-activated H+-selective channels in human neutrophils was subsequently confirmed by voltage clamp (DeCoursey and Cherny, 1993). Despite increasing interest in this channel, its molecular identity has not been established and numerous questions about the properties and physiological regulation of this channel remain unanswered.
Here we explore the effects of temperature on two fundamental properties of voltage-activated H+ channels: pH-dependent gating and H+ permeation. Interpreting the results requires distinguishing the effects of temperature on the voltage- and pH-dependent gating mechanism from those on the conductance of the open channel. A recent suggestion that H+ currents in murine mast cells have a greater temperature sensitivity than other H+ channels (Kuno et al., 1997) led us to examine the temperature dependence in several mammalian cells and cell lines. In addition, it is now clear that the properties of H+ channels differ in different cells. We studied H+ currents in rat alveolar epithelial cells, rat macrophages, human neutrophils, human monocyte THP-1 cells, human promyelocyte HL-60 cells, and mouse microglial BV-2 cells. These cells include both type e (epithelial) and p (phagocyte) H+ channel varieties (DeCoursey, 1998) and 6 of the 17 mammalian cells or cell lines and 3 of 5 mammalian species in which H+ currents have been reported. We find similarly high temperature sensitivity in all mammalian cells.
Voltage-gated H+ channels are extremely selective for H+ (and deuterium), with no detectable permeability to other cations (Barish and Baud, 1984; Byerly et al., 1984; DeCoursey, 1991; Bernheim et al., 1993; Kapus et al., 1993; Demaurex et al., 1993; DeCoursey and Cherny, 1994a, 1994b, 1997; Gu and Sackin, 1995; Gordienko et al., 1996; Kuno et al., 1997). Although the macroscopic conductance increases at lower pHi, the increase is only 1.7-fold/U decrease in pHi when measured in inside-out patches (DeCoursey and Cherny, 1995, 1996a ), far less than the 10-fold increase expected if the conductance were proportional to the permeant ion concentration, [H+]i. In contrast, the H+ conductance of gramicidin (Akeson and Deamer, 1991; Cukierman et al., 1997) and several other H+ permeable channels (reviewed by DeCoursey and Cherny, 1994b ) increases in direct proportion to [H+] up to pH ∼0, and then saturates. Thus, the conductance of the voltage-gated H+ channel appears to be nearly saturated at pH 7. Because relatively small changes in g H are seen when either intracellular or extracellular buffer concentrations were varied 100-fold (DeCoursey and Cherny, 1996b ), neither buffer diffusion nor direct proton transfer from buffer to channel can be rate determining steps in conduction. The ratio of H+ to D+ current was 1.9 at 20°C (DeCoursey and Cherny, 1997), much larger than 1.41–1.52 for the ratio of H+ to D+ conductivities in bulk solution at 20°C (Lewis and Doody, 1933; Roberts and Northey, 1974). Taken together, these studies suggest that the rate-determining step in H+ permeation occurs in the pore rather than in the diffusional approach of either protonated buffer or H3O+. The activation energy (E a)1 reported here for H+ permeation is large enough to rule out conclusively the possibility that diffusion to the channel is rate determining. That the E a is as high as for hydrolysis leads to renewed consideration of this mechanism (Kasianowicz et al., 1987) as a possible source for a fraction of the protons that carry current through these channels.
A quintessential feature of all voltage-gated H+ channels is the striking dependence of their voltage-gating mechanism on pHo and pHi. This interaction was examined systematically in alveolar epithelial cells, where the voltage–activation curve was found to shift −40 mV/U increase in the pH gradient, ΔpH = pHo − pHi (Cherny et al., 1995). The threshold voltage at which the g H is first detectably activated can be predicted from:
 |
1 |
where V0 was typically 20 mV (Cherny et al., 1995), or:
 |
2 |
where Vrev is the observed reversal potential (DeCoursey and Cherny, 1997). The importance of the regulation of gating by pH is that the g H is activated only when there is an outward ΔpH, thus the channel evidently functions to extrude H+ from the cell. We have proposed that the regulation of gating by ΔpH is mediated by internal and external protonation sites, which are accessible only to one side of the membrane at a time, and whose accessibility is governed by a conformational change in the channel molecule that can occur only when the sites are deprotonated (Cherny et al., 1995). The effects of temperature on gating kinetics further elucidate the gating mechanism. The surprising similarity of the Q 10 for activation and deactivation suggests that the same process is rate determining for both opening and closing of H+ channels.
materials and methods
Cells
Human neutrophils.
Neutrophils were isolated from normal human blood by density gradient centrifugation (Schmeichel and Thomas, 1987), and kept on ice in nominally divalent-free buffer. Immediately before recording, neutrophils were transferred to the glass recording chamber and superfused with Ringer's solution (see Solutions, below). In some experiments, fresh blood from the authors was studied without purification, and neutrophils were identified visually by their size (∼8 μm diameter) and spherical, granular appearance, as described previously (DeCoursey and Cherny, 1993).
THP-1 cells.
THP-1 cells were obtained from American Type Culture Collection (Rockville, MD). Cells were cultured in suspension in RPMI medium supplemented with 0.29 mg/ml glutamine, 10% fetal bovine serum (Gibco Laboratories, Grand Island, NY), 100 U/ml of penicillin, 100 μg/ml streptomycin, and 0.25 μg/ml Fungizone (Amphotericin B; Gibco Laboratories). Cells were incubated at 37°C in a humidified atmosphere of 5% CO2 in air. Every 2–3 d, about half of the media was replaced with fresh media, and once per week the cells were removed, centrifuged at 1,800 rpm for 10 min at 4°C in an RT6000 refrigerated centrifuge with an H1000B rotor (both from Sorvall, Newtown, CT). The cell pellet was resuspended in fresh media at 1–2 × 10⁶ cells/ml. THP-1 cells are nonadherent. With maintained weak positive pressure, the pipette was placed on or near a cell, and then suction was initiated.
BV-2 cells.
BV-2 cells were a gift from Claudia Eder (University of California at Irvine, Irvine, CA). The cells were maintained in DMEM with 10% FCS and 1% l-glutamine.
HL-60 cells.
HL-60 cells were obtained from American Type Culture Collection. They were grown in RPMI 1640 media containing 20% FCS. Some cells were studied after treatment with 1% DMSO for 7 d to induce differentiation into granulocytes.
Rat alveolar epithelial cells.
Type II alveolar epithelial cells were isolated from adult male Sprague-Dawley rats using enzyme digestion, lectin agglutination, and differential adherence, as described in detail elsewhere (DeCoursey et al., 1988; DeCoursey, 1990), with the exception that we now use elastase without trypsin to dissociate the cells. Some earlier experiments on cells isolated with trypsin and elastase are included here. Before invasive procedures were initiated, the rats were anesthetized deeply using sodium pentobarbital. In brief, the lungs were lavaged to remove macrophages, elastase was instilled, and then the tissue was minced and forced through fine gauze. Lectin agglutination and differential adherence further removed contaminating cell types. The preparation at first includes mainly type II alveolar epithelial cells, but after several days in culture the properties of the cells are more like type I cells. No changes in the properties of H+ currents have been observed during this differentiation process. H+ currents were studied in approximately spherical cells up to several weeks after isolation.
Rat macrophages.
Rat macrophages were obtained by lavage during the isolation of type II alveolar epithelial cells. They were studied <1 d after removal from the rat.
Solutions
Most solutions (both external and internal) contained 1 mM EGTA, 2 mM MgCl2, and 100 mM buffer, with tetramethylammonium methanesulfonate (TMAMeSO3) added to bring the osmolarity to ∼300 mosM, and titrated to the desired pH with tetramethylammonium hydroxide (TMAOH) or methanesulfonic acid (solutions using bis-Tris as a buffer). The pH 7 and 8 solutions contained 3 mM CaCl2 instead of MgCl2. A stock solution of TMAMeSO3 was made by neutralizing TMAOH with methanesulfonic acid. Buffers (Sigma Chemical Co., St. Louis, MO), which were used near their pK in the following solutions, were: pH 5.5–6.0 Mes; pH 6.5 bis-Tris (bis[2-hydroxyethyl]amino-tris[hydroxymethyl]methane); pH 7.0 Bes (N,N-bis[2-hydroxyethyl]-2-aminoethanesulfonic acid); pH 7.5 HEPES; pH 8.0 Tricine (N-tris[hydroxymethyl]methylglycine). In a few experiments (done 5–6 yr ago), TEA+ replaced TMA+, and 20 mM buffer was used. Whether TEA+ is inert with respect to H+ channels is uncertain, but the temperature dependence of the currents appeared consistent with other data using TMA+. In a few other experiments, N-methyl-d-glucamine was used as an impermeant cation instead of TMA+. The initial bath solution was usually Ringer's solution containing (mM): 160 NaCl, 4.5 KCl, 2 CaCl2, 1 MgCl2, 5 HEPES, pH 7.4.
Electrophysiology
Conventional whole-cell, cell-attached, or excised inside-out patch configurations were used. Inside-out patches were generally formed by lifting the pipette into the air briefly. Micropipettes were pulled in several stages using a Flaming Brown automatic pipette puller (Sutter Instruments, Co., San Rafael, CA) from EG-6 glass (Garner Glass Co., Claremont, CA), coated with Sylgard 184 (Dow Corning Corp., Midland, MI), and heat polished to a tip resistance ranging typically from 3 to 10 MΩ. Electrical contact with the pipette solution was achieved by a thin sintered Ag-AgCl pellet (In Vivo Metric Systems, Healdsburg, CA) attached to a silver wire covered by a Teflon tube. A reference electrode made from a Ag-AgCl pellet was connected to the bath through an agar bridge made with Ringer's solution. The current signal from the patch clamp (List Electronic, Darmstadt, Germany) was recorded and analyzed using an Indec Laboratory Data Acquisition and Display System (Indec Corp., Sunnyvale, CA). Data acquisition and analysis programs were written in BASIC23 or FORTRAN. Seals were formed with Ringer's solution in the bath, and the zero current potential established after the pipette was in contact with the cell. Inside-out patches were formed by lifting the pipette into the air briefly.
Pulse duration.
Pulse duration was adjusted at different temperatures with the intent of balancing two opposing factors. Longer pulses tend to provide a better estimate of both gating kinetics and steady state current amplitudes. However, the longer the pulse, the greater the increase in pHi caused by H+ efflux- mediated depletion of protonated buffer from the cell. Depletion directly distorts the H+ current waveform and also necessitates long interpulse intervals to allow pHi to recover. Most whole-cell measurements above 30–35°C were plagued by signs of changes in bulk pHi due to the massive H+ extrusion during voltage pulses, even though we tried to use relatively small and brief depolarizations to avoid this complication. We generally stopped increasing the temperature when pronounced droop of the H+ current occurred.
Temperature Control
Bath temperature was controlled by Peltier devices in a feedback arrangement, and was monitored by a resistance temperature detector (RTD) element (Omega Scientific, Stamford, CT) placed in the bath near the cell. Bath temperature was recorded at the end of the pulse just before writing to disk, and was stored with each current record. The maximum rate of change of bath temperature was ∼0.1°C/s. During temperature changes, the temperature often changed during long pulses. We usually stayed for several minutes at temperatures in intervals of 5–10°C to fix the behavior more accurately. Before lowering the bath temperature, we lifted the cell (via the pipette) because otherwise thermal contraction of the copper housing supporting the bath lifted the chamber enough to smash the pipette tip.
Temperature effects on buffer pKa.
The pK a of most buffers decreases with increased temperature by 0.01–0.02 U/°C. When we change the temperature, the pK a of the buffers used to establish the pH of internal and external solutions will change, and consequently H+ will be released or bound by buffer. When the same buffer, or buffers with similar temperature dependence, are used in the bath and pipette solutions, temperature will not affect the pH gradient, ΔpH, but will change the absolute pH. However, when buffers with different temperature dependences are used in the bath and pipette solutions, ΔpH (as well as the absolute pH) will change. Most experiments were done with Mes or bis-Tris in the pipette solution, both of which have weaker temperature dependence than the most frequently used extracellular buffers (Bes, less often HEPES, Tricine, or others). Consequently, ΔpH will decrease at higher temperatures, and E H will generally change less at higher temperatures and in some situations actually decrease (because changes in ΔpH and T in the Nernst equation tend to cancel each other). Over a temperature range spanning 30°C for the buffers used, the largest change in absolute pH is 0.42 U (for Tricine), and the largest net change in ΔpH is ∼0.26 U for pH 8.0//6.5 (Tricine//bis-Tris). Most measurements were done at pH 7.0//5.5 (Bes//Mes), where ΔpH changes 0.04 U/10°C. All solutions are described according to their nominal pH when titrated at room temperature (20–24°C).
Conventions
We refer to pH in the format pHo//pHi. In the inside-out patch configuration, the solution in the pipette sets pHo, defined as the pH of the solution bathing the original extracellular surface of the membrane, and the bath solution sets pHi. Currents and voltages are presented in the normal sense; that is, upward currents represent current flowing outward through the membrane from the original intracellular surface, and potentials are expressed by defining as 0 mV the original bath solution. Current records are presented without correction for leak current or liquid junction potentials.
Data Analysis
The time constant of H+ current activation, τact, was obtained by fitting the current record by eye with a single exponential after a delay (as described in DeCoursey and Cherny, 1995):
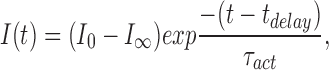 |
where I 0 is the initial amplitude of the current after the voltage step, I ∞ is the steady state current amplitude, t is the time after the voltage step, and t delay is the delay. The H+ current amplitude (I H) is defined as (I 0 − I ∞). No other time-dependent conductances were observed consistently under the ionic conditions employed. The tail current time constant, τtail, was obtained by fitting the current with a single exponential:
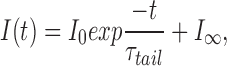 |
where I 0 is the amplitude of the decaying part of the tail current.
Calculation of Q10 or Arrhenius activation energies.
The relative change in a parameter for a 10°C change in temperature, the Q 10, was calculated by:
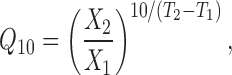 |
3 |
where X 2 is the parameter value at the higher temperature T 2, X 1 is the parameter value at the lower temperature T 1. Operationally, we usually extracted Q 10 values by plotting the data on semilog axes, drawing a straight line through the points (by eye or by linear regression), and determining its slope. Data considered less reliable were given lower weight in this process. Arrhenius activation energies were calculated from:
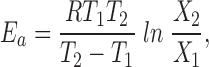 |
4 |
where R is the gas constant (8.314 J or 1.9872 cal °K−1 mol−1), and T 1 and T 2 are in °K (Kimura and Meves, 1979).
results
The amplitude and kinetics of voltage-gated H+ currents are strongly temperature dependent. For example, evaporative heat loss from the solution in the recording chamber lowers the temperature by ∼1°C, producing a noticeable change in the H+ currents. Fig. 1 illustrates families of H+ currents recorded in a human neutrophil at 11, 20, and 36°C (note the different time bases). Increasing the temperature by 25°C increased the H+ current amplitude >7-fold and the rate of activation (turn on) of the current with depolarization >20-fold. At all temperatures, H+ currents activated during depolarizing pulses with a sigmoidal time course, suggesting that the channel passes through more than one closed state before opening (DeCoursey and Cherny, 1994b ; Cherny et al., 1995). In general, the behavior of H+ currents appeared to be fairly consistent at all temperatures; that is, after scaling the amplitude and time scales, there were no obvious changes in the characteristic properties or appearance of the current waveforms.
Figure 1.

Families of H+ currents in a human neutrophil at 11, 20, and 36°C. From Vhold = −60 mV, pulses were applied in 20-mV increments from −40 to +40 mV. Bath solution was TMAMeSO3 at pHo 7.0; the pipette contained NMGMeSO3 at pHi 5.5. The current calibration bar applies to all panels; note the change in time calibration.
Fig. 2 illustrates tail currents and Vrev measurements in the same neutrophil as in Fig. 1. A depolarizing prepulse opened many H+ channels, and then the membrane was repolarized to various potentials. The time course of current decay reflects the progressive closing of channels at each potential. The tail current decay was well fitted by a single exponential, giving τtail, the time constant. The rate of channel closing (1/τtail) is evidently highly temperature sensitive (note the change in time base), as was the rate of channel opening in Fig. 1. When τtail was measured over a wide voltage range at different temperatures (Fig. 2 C), the τtail–V relationship appeared to scale uniformly at all potentials. Our model (Cherny et al., 1995) predicts a 5% steeper slope of the τtail–V relationship at higher temperatures (V.S. Markin, personal communication). However, the measurement is not sufficiently accurate to detect this subtle a change. To a first approximation, the Q 10 of τtail is independent of voltage.
Figure 2.

Tail currents at 20.5 (A) and 36.5°C (B) in the same human neutrophil as in Fig. 1 (also at pH 7.0//5.5). The temperature varied several tenths of a degree from pulse to pulse and we have rounded to the nearest half degree. From V hold = −60 mV, a prepulse to +30 (A) or +20 (B) mV was followed by test pulses to the indicated voltages, shown in 20-mV increments. (C) Voltage dependence of τtail at 20.5 and 36.5°C in the same experiment as A and B. The slopes are similar, 39 and 44 mV/e-fold change in τtail, respectively, giving an average Q 10 of 8.5 in this cell.
The reversal potential Vrev was determined from tail current measurements like those in Fig. 2, A and B. In the illustrated neutrophil, Vrev was close to −80 mV at both 20.5 and at 36.5°C. The Nernst potential for H+, E H, at nominally pHo 7.0//5.5, is −87 mV at 20.5°C and −88 mV at 36.5°C after correction for shifts in the true pH due to the temperature dependence of the pK a of the buffers used (see materials and methods). In other cells, Vrev generally was unchanged or somewhat more positive at lower temperatures. The actual value obtained for V rev is sensitive to depletion of protonated buffer from the cell by previous pulses, including the prepulse used in standard tail current measurements. Within the reliability of the measurement, temperature does not appear to alter V rev beyond the small change in E H predicted by the Nernst equation.
The steady state voltage dependence of the g H (the activation curve) was generally similar at all temperatures. This result is important partially for technical reasons. The comparison of H+ current kinetics at a fixed test potential at different temperatures would become less valid if the P open were different. A hyperpolarizing shift in P open at high temperature would tend to artificially enhance the temperature dependence of the activation time constant, τact, and perhaps reduce the temperature dependence of τtail. The voltage dependence of channel opening is not easy to evaluate quantitatively because the chord conductance (g H) often does not saturate, the g H–V relationship is poorly described by a Boltzmann function, whole-cell currents are susceptible to depletion effects, and for other reasons discussed at more length elsewhere (DeCoursey, 1991; DeCoursey and Cherny, 1994a , 1994b ; Cherny et al., 1995). Therefore, several approaches were taken (not all are illustrated). In Fig. 3 A, g H was determined in an inside-out patch from an alveolar epithelial cell, from the amplitude of an exponential fit to the rising phase of H+ currents. Using the fitted amplitude corrects data in which activation did not achieve steady state during the pulse. In this experiment, activation appeared to occur at more negative potentials (by ∼10–15 mV) at higher temperatures. However, both the tremendous increase in gating kinetics, as well as the increase in H+ current amplitude, will tend to give this impression, even if there were no true shift. Small changes in ΔpH and E H due to temperature effects on buffers predict net shifts of a few millivolts in the depolarizing direction at higher temperatures (see Fig. 3, legend). We also looked for changes in Vthreshold, the threshold potential at which time-dependent outward current was first detectable. In some experiments, careful examination revealed little or no shift, whereas in other experiments shifts of 5–10 mV occurred, with activation usually occurring at more negative voltages at higher temperatures. The impression gained from these attempts was that any shift in the voltage–activation curve was smaller than could be demonstrated convincingly. We cannot distinguish whether increasing the temperature produced a small (∼10 mV) hyperpolarizing shift or no effect. Likewise, we cannot resolve whether high temperature might have steepened the g H–V relationship somewhat as predicted by our model (Cherny et al., 1995).
Figure 3.

The voltage dependence of H+ current activation does not change much with temperature. (A) Chord conductance–voltage relationship in an inside-out patch from a rat alveolar epithelial cell, at the indicated temperatures, at pHo 7.5 (pipette)//pHi 6.5 (bath). The order of measurement was 20, 10, 21, 30, and 40°C. At 40°C, g H at +20 mV was 1.24 nS (not plotted). Because of the difference in temperature dependence of the buffers used (the pK a of bis-Tris decreases 0.008/°C and HEPES 0.014/°C), the pH gradient across the cell membrane, ΔpH (pHo − pHi), will decrease by 0.06 U every 10°C. Assuming that the g H–V relationship shifts −40 mV/U increase in ΔpH (Eq. 1), this effect would give rise to a depolarizing shift of 4.8 mV (or 2.3 mV if the g H–V relation is set by V rev according to Eq. 2) as the temperature is increased from 10 to 30°C. (B) Voltage dependence of τact at various temperatures in the same patch. The lines show the slopes by linear regression, which range from 46 to 64 mV/e-fold change in act and did not change consistently with temperature.
The time course of H+ currents, at least for moderate depolarizing pulses, was reasonably well described by a single exponential rise after a delay. Fig. 3 B illustrates the voltage dependence of the activation time constant, τact, measured at several temperatures in the inside-out patch shown in Fig. 3 A. As was found for τtail, the Q 10 appeared to be independent of the voltage at which the measurement was made. Our model (Cherny et al., 1995) predicts some temperature dependence of the slope of the τact–V relationship. However, within the accuracy of the measurement, both kinetic parameters appeared simply to scale uniformly with temperature at all voltages. Similar results were obtained in whole-cell experiments.
To evaluate H+ channel gating and conductance over a wide range of temperature, we used a moderate depolarizing test pulse, followed by repolarization either to Vhold or to another voltage at which the tail current decay was resolvable. This pulse protocol permitted obtaining all four parameters nearly simultaneously: τact, the delay time, τtail, and I H. As the temperature was varied, the pulse durations were adjusted to resolve the kinetic parameters. Low temperatures required very long pulses (up to 80 s), with the result that the temperature sometimes changed significantly during the pulse. Some hysteresis in the data is to be expected in this situation. Fig. 4 illustrates the temperature dependence of the parameters studied in a rat alveolar epithelial cell. All four parameters have roughly linear temperature dependence (in a semi-log plot), and thus each can be described by a single Q 10. The same data are plotted in Fig. 4 B in a conventional Arrhenius plot in which the slope gives the E a.
Figure 4.

( A) Temperature dependence of the amplitude and gating kinetics of H+ currents in an alveolar epithelial cell at pH 7.0//6.5. Pulses were applied from Vhold = −20 to +50 mV, and then to 0 mV. The durations of these pulses were varied from 0.5–25 s according to the temperature range. The rising currents at +50 mV were fitted by a delay (○) followed by a single exponential to obtain τact (•) and the extrapolated H+ current amplitude, I H (♦). Upon repolarization to 0 mV, the tail current was fitted by a single exponential to obtain τtail (▴). The delay was the least well defined parameter. The slopes, determined by linear regression, correspond with Q 10 values of 11.9 for τact, 7.09 for the delay, 7.51 for τtail, and 2.16 for I H, as illustrated by the lines. (B) Arrhenius plots of the data in A. Plotted against 1,000/temperature (°K−1) are the natural logarithm of 1/delay (○), 1/τact (•), 1/τtail (▴), and I H (♦). The slopes, determined by linear regression, correspond with E a values of 41.7 kcal/mol for τact, 33.0 kcal/mol for the delay, 33.3 kcal/mol for τtail, and 13.0 kcal/mol for I H, as illustrated by the lines.
Comparison among Different Cells and Mammalian Species
Fig. 5 illustrates the temperature dependence of the four parameters studied in several types of cells. Several features are immediately apparent. First, the three kinetic parameters, τact, delay, and τtail are all highly temperature sensitive. A second result that is somewhat unusual in temperature studies on ion channels is that there are no obvious changes in the slopes of these curves. The data were well described by a straight line on the graphs, giving a single Q 10 value over the entire temperature range. Q 10 values from experiments like these are summarized in Table I. The third result evident in both Fig. 5 and Table I is that the three kinetic parameters have nearly the same Q 10. The similarity of Q 10 values for the three kinetic parameters explains why the general appearance of the currents appeared to simply scale with temperature (compare Figs. 1 and 2).
Figure 5.

Temperature dependence of H+ current parameters in several cell types. ( A) Temperature dependence of the amplitude and gating kinetics of H+ currents in a human neutrophil at pHo 7.0//pHi 5.5. From Vhold = −60 mV, pulses were applied to +20 mV with a duration 0.4–8.0 s according to the temperature range. The rising current at +20 mV was fitted by a delay (○), followed by a single exponential to obtain τact (•) and I H (♦). The tail current upon repolarization to −60 mV was fitted by a single exponential to obtain τtail (▴). The delay was the least well defined parameter. The slopes, determined by linear regression, correspond with Q 10 values of 4.46 for τact, 6.82 for the delay, 4.53 for τtail, and 2.33 for I H, as illustrated by the lines. There was noticeable hysteresis in this experiment, as the temperature was first increased from room temperature (19°C) to 37°C, decreased to 11°C, and then returned to room temperature. As a result of this hysteresis, there is a certain amount of arbitrariness in the evaluation of these data. (B) THP-1 cell at pHo 7.0//pHi 5.5. Pulses were applied from Vhold = −60 to +50 mV, and then −30 mV. (C) BV-2 cell at pHo 7.0//pHi 5.5. Pulses were applied from Vhold = −80 to −30 mV, and then −80 mV. (D) Inside-out patch from an alveolar epithelial cell at pHo 7.5//pHi 6.5. Pulses were applied from Vhold = −60 to +20 mV, and then −40 mV. Because the currents in patches were much smaller than whole-cell currents, the kinetic parameters are less well determined, but I H is probably more reliable because depletion effects are minimized (see text).
The H+ current amplitude increased substantially with temperature. However, its measurement was complicated by several factors. At low temperature, activation was very slow, and the pulses were sometimes not long enough to reach steady state. We extrapolated the fitted exponential rise to obtain I H. At high temperatures, the currents were quite large and we sometimes observed decay of outward currents above ∼30°C. H+ channels do not inactivate (DeCoursey and Cherny, 1994b ), and this decay is almost certainly the result of increased pHi due to the large efflux of H+ comprising current flow (see discussion). Other factors that could artifactually decrease I H at high temperature include spontaneous clogging of the pipette tip and movement of the cell relative to the pipette due to thermal expansion of the copper support for the chamber (used to transfer heat to the preparation). Because many of these complications can be avoided or minimized using the inside-out patch configuration, we considered this approach to provide the most reliable estimate of the temperature dependence of I H.
Inside-Out Patch Experiments
Several measurements were made in inside-out patches excised from rat alveolar epithelial cells. Although the smaller current amplitudes compared with whole-cell measurements made the extraction of kinetic parameters less precise, the problems associated with pHi changes due to depletion of protonated buffer by H+ currents are greatly reduced. Fig. 6 illustrates families of H+ currents at several temperatures in an inside-out patch. The parameters that could be extracted are plotted in Fig. 5 D, as was done for whole cell data. At higher temperatures, the time-independent “leak” current appears to increase. Because the I H amplitude is obtained by fitting the current to a delay plus a single exponential, it reflects only the time-dependent component of outward current. If some part of the initial jump in outward current at higher temperature reflects H+ current, for example if the decay of capacity current obscures the initial rise in I H at higher temperatures where activation becomes rapid, then the Q 10 of I H will be underestimated by this procedure. We could not resolve tail currents well enough to estimate τtail reliably over a large temperature range in most patches. The values of τact, summarized in Table I, are generally similar to those from whole-cell experiments. Notably different is I H. The H+ current amplitude in patches continued to increase at higher temperatures (instead of saturating above ∼30°C). The Q 10 extracted from patches even in the higher temperature range (>20°C, Table I) was larger than for whole-cell experiments. Because the use of excised patches minimizes depletion problems, we believe that these data are more reliable than those obtained in whole-cell experiments.
Figure 6.

H+ current families at 10 ( A), 20 (B), and 30°C (C) in an inside-out patch from an alveolar epithelial cell at pHo 7.5// pHi 6.5. In each family, Vhold was −60 mV, and pulses to −20, 0, and +20 mV are illustrated. Note the changes in time calibration. The same current calibration applies to all parts.
The I H data from patches exhibited clear nonlinearity of the type observed to a lesser extent in whole cell I H data. In Fig. 7, I H data from three patches with different current amplitudes are plotted. The Q 10 is 2–3 at 20–30°C, but much larger (4–6) at temperatures below 20°C. The curvature is in the direction that would be attenuated in an Arrhenius plot; however, the Arrhenius plots in Fig. 7 B are still clearly nonlinear, with E a ∼15 kcal/mol at high temperatures and ∼30 kcal/mol at low temperatures. Activation energies clearly vary depending on the temperature range studied. In Tables I we list values from above and below 20°C.
Figure 7.

Nonexponential temperature dependence of I H in three inside-out patches from alveolar epithelial cells. ( A) I H in three patches (one is also plotted in Figs. 5 D and 6). Because the plots are not linear, we arbitrarily fitted the data at <21 (○, •), 21–35 (⋄, ♦), and >35°C (□). Lines determined by linear regression are drawn through the points and Q 10 values are given near the relevant sections of data. (B) The same data in an Arrhenius plot. Although the curvature is slightly less than in A, the plot clearly is steeper at low temperatures. Dots inside the symbols identify the data points used to determine the lines shown. E a values for the selected sections of data are given near the data.
discussion
The main results are: (a) the rate of activation of the g H is highly temperature sensitive. The Q 10 for both the delay and τact was about the same, ranging from 6 to 9 in various cells. (b) The rate of deactivation also has a high Q 10 of 6–8, practically identical to that for activation. (c) There were no obvious break points in the temperature dependence of the three kinetic parameters studied. (d) The Q 10 of the H+ conductance is high, >2 in whole-cell measurements, and 2.8 in inside-out patches >20°C and 5.3 at <20°C. (e) The Arrhenius plot of I H is nonlinear, being steeper at low temperature. (f) The temperature dependence of both H+ currents and H+ channel gating kinetics is quite similar in different mammalian cells.
H+ Channel Gating Is Steeply Temperature Dependent
Table I summarizes the temperature dependence of three kinetic parameters reflecting channel opening (τact and delay) and closing (τtail). For all cells studied, the mean Q 10 values were similar, both from one cell type to another, and, more remarkably, for all three kinetic parameters. For other ion channels, opening and closing (τact and τtail) do not as a rule have the same Q 10 (Table II), and in most cases the Q 10's of inactivation (or block) and recovery appear to be radically different. The Q 10 values in Table IA for H+ currents range from 6 to 9, which inspection of Table II shows is at the upper end of reported values for gating of various ion channels. Most channel gating processes have Q 10 values near 3, generally taken to indicate significant conformational rearrangement of the channel molecule. A high Q 10 for K+ channel inactivation was ascribed to interaction between two peptide moieties, at least one of which evidently has a low probability of adopting the correct conformation to permit binding (Murrell- Lagnado and Aldrich, 1993). Alamethicin pore formation (listed as τact in Table II) has a Q 10 of 9 at low temperatures. This result is intriguing because alamethicin is believed to form channels in which 6–10 molecules assemble in the membrane in a barrel-stave arrangement (Boheim and Kolb, 1978), reminiscent of one of the hypothetical physical depictions of our gating model, in which several channel protomers assemble in the membrane to form a functional channel (Cherny et al., 1995). Another intriguing parallel is the high Q 10 of a slow gating process in a Cl− channel that, like the H+ channel, is gated by its permeant ion, interpreted as reflecting channel subunit interaction (Pusch et al., 1997). In general, the high Q 10 for H+ channel gating is compatible with substantial conformational changes in the channel.
Table II.
Q10 Values for Ion Channel Permeation and Gating
| Channel | °C | Conductance | τact | τtail | τi | τrecovery | Reference | |||||||
|---|---|---|---|---|---|---|---|---|---|---|---|---|---|---|
| KIR (frog muscle) | 3.5–17.5 | 1.67 | 2.45 | — | — | — | Almers, 1971 | |||||||
| (tunicate oocyte) | 5–20 | 1.44* | — | — | 3.41V * | — | Ohmori, 1978 | |||||||
| (starfish oocyte) | 1–26 | 1.62H–5.8L | — | — | — | — | Hagiwara and Yoshii, 1980 | |||||||
| (guinea pig myocyte) | 5–37 | 1.15 | 1.45 | — | — | — | Martin et al., 1995 | |||||||
| (cat cardiac myocyte) | 5–37 | 1.22 | 1.82 | — | — | — | Martin et al., 1995 | |||||||
| KV (Xenopus laevis) | 5–20 | 1.2 | 3.2 | 2.8 | — | — | Frankenhaeuser and Moore, 1963 | |||||||
| (Myxicola axon) | 5–14 | — | 2.40 | — | 3.02β | 1.70β | Schauf and Bullock, 1982 | |||||||
| (rat muscle) | 1–37 | 1.42 | 2H–6L | 1.7H–11.5L | — | — | Beam and Donaldson, 1983 | |||||||
| (human T-cell) | 27–37 | 1.56 | 3.31 | 7.09 | 3.87 | 9.81 | Lee and Deutsch, 1990 | |||||||
| (human T-cell) | 20–25 | 1.18* | 2.9 | — | 2.2 | — | Pahapill and Schlichter, 1990 | |||||||
| ShB K+ peptide | 5–20 | — | — | — | 5.0176 | <1.1176 | Murrell-Lagnado and Aldrich, 1993 | |||||||
| Shaker K+ | 5–20 | 1.51 | 3.14 | — | 7.2 | 1.57 | Nobile et al., 1997 | |||||||
| KCa (human RBC) | 0–47 | 1.50 | — | — | — | — | Grygorczyk, 1987 | |||||||
| Na+ (X. laevis) | 5–20 | 1.3 | 1.8 | 1.7 | — | — | Frankenhaeuser and Moore, 1963 | |||||||
| (squid axon) | 0–16 | — | 2.35 | — | 2.7H–4.3L | — | Kimura and Meves, 1979 | |||||||
| (rabbit nerve) | 0–25 | 1.7H–4.7L | — | — | 3H–33L | — | Chiu et al., 1979 | |||||||
| (neuroblastoma) | 5.6–14 | — | — | — | 1.3α * | 1.3α * | Yamamoto and Yeh, 1984 | |||||||
| (frog muscle) | 0–22 | — | 2.4 | — | 3.0H–5.3L | — | Kirsch and Sykes, 1987 | |||||||
| (rabbit muscle) | 0–22 | — | 2.3 | — | 3.4H–9.1L | — | Kirsch and Sykes, 1987 | |||||||
| AchR (BC3H-1) | 10–40 | 1.26H–1.55L * | 3.6* | — | — | — | Dilger et al., 1991 | |||||||
| Ca2+ (muscle) | — | 1.3–1.6* | ∼3.0 | ∼3.0 | — | — | McDonald et al., 1994 | |||||||
| CIC-0 | 9–40 | 1.4* | — | 2.2 | ∼40 | — | Pusch et al., 1997 | |||||||
| Alamethicin | −1–32 | 1.28–1.31 | 2.9H–9.0L | 2.04 | — | — | Boheim and Kolb, 1978 | |||||||
| Gramicidin (K+, Na+) | 3–23 | 1.38,* 1.34* | — | 3.1* | — | — | Hladky and Haydon, 1972 | |||||||
| Gramicidin (Na+) | 10–40 | 1.52* | 3.09 | 2.62 | — | — | Bamberg and Läuger, 1974 | |||||||
| Gramicidin (H+) | 15–22 | 1.33* | — | — | — | — | Akeson and Deamer, 1991 | |||||||
| H+ (snail neuron) | 10–25 | 2.1 | — | — | — | — | Byerly and Suen, 1989 | |||||||
| (mammalian cells) | 5–44 | 2.8H, 5.3L | 6–9 | 6–8 | — | — | This study |
For a variety of ion channels, Q 10 values are listed for the conductance, and for kinetic parameters reflecting gating transitions: activation, deactivation, and inactivation (in some cases block). Q 10 values not given in original references were calculated from Arrhenius activation energy values or other available data (see materials and methods).
Values for single channel currents, which are not complicated by possible interactions between gating and conductance. Several measurements reflect block, rather than intrinsic gating: vvoltage-dependent Na+ block,
block by the inactivation peptide, βblock and unblock by nonyltriethylammonium ions, αblock and unblock by 9-aminoacridine. H Q 10 at higher temperatures, L Q 10 at lower temperatures.
Table IA.
Q10 Values for Voltage-gated H+ Channels (Mean ± SD)
| Cell type | I H | τact | Delay | τtail | ||||
|---|---|---|---|---|---|---|---|---|
| PMN | 3.06 ± 0.48 (5) | 6.1 ± 1.2 (5) | 7.1 ± 1.5 (5) | 6.4 (1) | ||||
| THP-1 | 2.05 ± 0.10 (4) | 6.8 ± 2.1 (8) | 7.5 ± 2.0 (7) | 7.8 ± 1.6 (6) | ||||
| BV-2 | 2.07 ± 0.42 (4) | 8.9 ± 2.0 (4) | 8.8 ± 1.6 (4) | 7.8 ± 0.3 (3) | ||||
| HL-60 | 2.22 ± 0.47 (3) | 6.3 ± 0.8 (3) | 5.9 (2) | 7.0 (2) | ||||
| Rat Mφ | 2.96 ± 0.98 (3) | 7.3 ± 2.6 (3) | 8.5 ± 3.7 (3) | |||||
| Type II | 2.35 ± 1.2 (15) | 7.4 ± 2.0 (16) | 7.0 ± 1.1 (9) | 6.2 ± 1.7 (10) | ||||
| i-o patch | 2.8 ± 0.4 (5), >20°5.3 ± 1.1 (4), <20° |
8.4 ± 2.0 (6) | 5.6 (1) |
The average value for the entire temperature range studied in each cell is shown. The temperature dependence of I H in inside-out patches was often nonlinear (on semilog axes), thus we give values at high or low temperatures. See text for further discussion. In whole-cell data, the nonlinearity was less than the scatter in the data. We excluded data deemed to be unreliable or poorly determined (due to inadequate pulse duration or presumed depletion of protonated buffer from the cell, etc.). PMN, human neutrophils (polymorphonuclear cells); Mφ, rat alveolar macrophage; Type II, rat alveolar epithelial cells (type II when isolated); i-o patch, inside-out patches from rat alveolar epithelial cells. In one outside-out patch from an alveolar epithelial cell, Q 10 values were I H 1.8, τact 7.2, and delay 5.2. Most cells were studied at pHo//pHi = 7.0//5.5, but the ranges were type II pHo 7.0–8.0, pHi 5.5–6.5; PMN pHi 5.5–6.0; BV-2 pHo 5.5–7.0.
We proposed a model of H+ channel gating in which opening requires deprotonation of an externally accessible site(s), followed by a conformational change that shifts the accessibility of the protonation site(s) to the internal side, and finally stabilization of the open configuration by protonation from the inside (Cherny et al., 1995). This model illustrated how gating could be regulated by voltage and the pH gradient, ΔpH (pHo − pHi). Although the model is hypothetical, it is difficult to conceive of a mechanism that does not incorporate the general ideas of regulatory protonation sites whose accessibility switches from one side of the membrane to the other. The voltage dependence of gating in our model could arise either from voltage-dependent proton binding to sites inside “proton wells” analogous to those in H+ ATPases (Mitchell and Moyle, 1974) or from a voltage-dependent conformational change, as is more typical of voltage-gated ion channels. The protonation/deprotonation reactions at the internal site are rate determining, with the conformational change being rapid and in quasi-equilibrium. Because deuterium slowed activation threefold with only minor effects on deactivation, we suggested that a voltage-dependent closing step might precede the internal deprotonation step (DeCoursey and Cherny, 1997).
In this context, the similarity of Q 10 values for τact, delay, and τtail was surprising. Although we cannot rule out the possibility that several processes could have the same high E a, the simplest explanation is that the same energy barrier is rate determining for all three parameters. The energy wells on either side of the barrier must be relatively symmetrical. The E a for this process is evidently 30–38 kcal/mol, which is substantially larger than any of the proton-related processes listed in Table III. Specifically, the E a is much larger than 7 kcal/mol for ionization of the imidazole group of histidine (Reeves, 1977), a candidate for the external regulatory protonation site, proposed on the basis of deuterium isotope effects on gating (DeCoursey and Cherny, 1997). In a linear gating scheme, the delay presumably reflects early events in the opening process, τact reflects the entire gating sequence, and τtail must reflect the final transition between the open state and a neighboring closed state. It appears paradoxical that the same process could determine the relatively rapid tail current decay and the slower activation. A possible explanation for the similarity of E a for all three kinetic parameters is that each of several channel subunits must undergo an identical or similar complex first-order conformational change during opening, but a reverse transition in only one subunit is sufficient to close the channel. This is essentially the Hodgkin-Huxley (1952) model for Na+ and K+ channel gating. This hypothesis would also explain the surprising similarity of E a for the delay, τact, and τtail. In a multiple independent subunit channel, the ratio of delay to τact is fixed (R.W. Aldrich and F.T. Horrigan, personal communication).
Table III.
Activation Energy for Various Proton Events at 18–25°C (or in Ice)
| Property | E a (kcal/mol) | Reference | ||
|---|---|---|---|---|
| H+ conductance in water | 2.6 | Robinson and Stokes, 1959 | ||
| Hydrogen bond strength in water (H2O–H2O) | 2.6 | Walrafen et al., 1996 | ||
| Water rotation in water (dielectric relaxation) | 4.5 | Eigen and DeMaeyer, 1958 * | ||
| Water rotation in ice(dielectric relaxation) | 8.4 | Glasstone et al., 1941 | ||
| ∼13 | Bjerrum, 1952 | |||
| Proton hopping in ice | 9.5 | Collier et al., 1984 | ||
| Bjerrum orientational defect migration in ice | 12.0 | Collier et al., 1984 | ||
| Entry of Bjerrum fault into HBC | ≤8.0 | Nagle et al., 1980 | ||
| Entry of ionic defect into HBC | ∼10–20 | Nagle et al., 1980 | ||
| Self-energy cost of H3O+ permeating a membrane‡ | 58.6 | Parsegian, 1969 | ||
| Ionization of histidine imidazole | 7 | Reeves, 1977 | ||
| Hydrolysis (deprotonation of water) | 15.5–16.5 | Eigen and DeMaeyer, 1958 | ||
| Hydration of CO2/dehydration of HCO3 − | 17.9–15.6 | Sanyal and Maren, 1981 | ||
| H+ channel conductance (excised patches) | 18H, 27L | This study | ||
| H+ channel gating (τact, delay, τtail) | 30–38 | This study |
Based on several original references cited in the review. HBC, hydrogen-bonded chain; Llow temperatures (<20°C); Hhigh temperatures (>20°C).
Assumes dielectric constant ε = 2 and ionic radius = 1.38 Å.
The temperature dependence of gating was nearly linear in Arrhenius plots.
All three of the kinetic parameters measured had roughly linear temperature dependence over the range 6–42°C. For a constant Arrhenius activation energy, E a, the temperature dependence in simple semi-logarithmic plots (e.g., Figs. 4 A, 5, and 7 A) is slightly nonlinear, becoming steeper at low temperatures. Our data do not resolve the fine distinction between linearity and the predicted Arrhenius curvature, and appeared linear on both types of plots (compare Fig. 4, A and B). Many studies of other ion channels describe break points in conductance (Lass and Fischbach, 1976; Chiu et al., 1979; Hagiwara and Yoshii, 1980; Quartararo and Barry, 1988) or gating kinetics (Schwarz, 1979; Chiu et al., 1979; Kirsch and Sykes, 1987), which occur at 4–20°C. Others report no clear break points, although the Q 10 increases at lower temperatures (Boheim and Kolb, 1978; Kimura and Meves, 1979; Kukita, 1982; Beam and Donaldson, 1983; Pahapill and Schlichter, 1990). Breakpoints in Arrhenius plots are generally taken to indicate phase transitions of membrane lipids. Krasne et al. (1971) reported that “freezing” artificial bilayer membranes abolished the conductance mediated by the carriers nonactin and valinomycin, but had little effect on the conductance of the gramicidin channel. Here we saw no consistent or reliable evidence of a break point in the temperature dependence of any kinetic parameter. The absence of a break point could mean that H+ channel gating is relatively insensitive to the fluidity of the surrounding membrane (see Beam and Donaldson, 1983). A more likely explanation is that the membranes of the cells studied do not exhibit sharp phase transitions in the temperature range studied. The linearity of the Arrhenius plots suggests that the same process is rate determining over the entire temperature range.
Arrhenius plots of IH are nonlinear.
In contrast to the kinetic parameters, I H usually changed more steeply at low temperatures, and tended to saturate at high temperature (>30°C). In cells in which I H saturated, the currents often decayed during the pulse (not shown). H+ channels do not inactivate, and this decay is almost certainly the result of increased pHi due to the large efflux of H+ during current flow. Large I H decreases the driving force by increasing pHi, as has been demonstrated by changes in V rev (DeCoursey, 1991; DeCoursey and Cherny, 1994b ), or deduced from pHi measured by microelectrodes (Thomas and Meech, 1982; Meech and Thomas, 1987) or fluorometric dyes (Kapus et al., 1993). During even moderate depolarizations at high temperature, there was sometimes evidence of depletion. Our interpretation is that high temperature exacerbates the depletion of protonated buffer from the cell (and consequent increase in pHi), in spite of the high (100 mM) concentration of buffer in all solutions. Thus, the apparent saturation of I H at high temperature is not ascribable to events occurring near the channel. Higher Q 10 values were obtained for I H measured in inside-out patches than in whole-cell experiments, whereas Q 10's for gating kinetics were similar. The most likely explanation is that depletion of protonated buffer due to H+ efflux is less problematic in excised patches because there are much smaller diffusion barriers between either side of the membrane and an effectively infinite volume of buffered solution.
Nevertheless, in inside-out patches, which would be less subject to depletion effects, Arrhenius plots of I H exhibited distinct curvature (Fig. 7 B). The similar temperature dependence of Arrhenius plots of I H in different patches in which I H differs by an order of magnitude speaks against bulk depletion (of protonated buffer from the enclosed volume at the tip of the pipette) as a cause of the nonlinearity. Although there was no obvious break point, we cannot rule out the possibility that the membrane fluidity affects I H. Another interpretation is that nonlinearity of Arrhenius plots of conductance reflects the temperature dependence of the hydration of ions (Kuyucak and Chung, 1994). If entry into the channel requires at least partial dehydration, it will be facilitated at higher temperatures where ions are less hydrated. Entry of a proton into a hydrogen-bonded chain (HBC, see below), which is the putative nature of the H+ channel conduction pathway, by definition requires complete dehydration. However, the E a for breaking a hydrogen bond between water molecules (Table I), even a first shell hydrogen bond with E a approximately twice that of a second shell hydrogen bond (Agmon, 1996), is too low to account for the E a of permeation. Finally, nonlinearity of the Arrhenius plot for I H may indicate that different processes are rate determining in different temperature ranges. For example, the rate-determining step might be hydrolysis or entry of the ionic defect into the channel at high temperature, but permeation at lower temperatures.
IH Has Abnormally Strong Temperature Dependence
The average Q 10 for I H in whole-cell measurements was 2.1–3.1 in various mammalian cells, and was higher in patches (Table IA). For reasons discussed above, we consider Q 10 values from inside-out patches to be more reliable for I H (but less reliable for the kinetic parameters). The Q 10 in patches averaged ∼2.8 at >20°C and increased to 5.3 at <20°C (Table IA). As discussed in the context of Fig. 6, overestimation of the leak current would tend to decrease the apparent Q 10. Temperature effects on the pK a of buffers will affect these values by changing both the absolute pH and ΔpH. The decrease in pHi at higher temperature will tend to increase I H, presumably by ∼1.7-fold/U (DeCoursey and Cherny, 1995, 1996a ). Most of the measurements were made with Bes externally and Mes internally, for which ΔpH will decrease at higher temperatures, essentially offsetting the increase in RT/F. Correcting for the decrease in pHi at higher temperature lowers the Q 10 values to 2.0–2.9 in whole-cell and 2.6–5.0 in excised patch measurements. These values greatly exceed practically all values reported for ion permeation through other channels (Table II), and thus require some explanation.
An increase in I H with temperature could reflect increased single-channel conductance or open probability, P open. If the opening and closing rates had different temperature dependence, P open would vary with temperature. Three observations indicate that P open does not change with temperature. First, the g H–V relationship was not convincingly shifted. Second, the kinetic parameters of gating (delay, τact, and τtail) and the I H waveform in general all appeared to simply scale uniformly with temperature. The temperature dependence of neither τact nor τtail was detectably voltage dependent. Finally, the H+ current variance at 20°C increases sharply with depolarization, and then plateaus or decreases with further depolarization (V.V. Cherny and T.E. DeCoursey, unpublished observations), suggesting that for large depolarizations P open > 0.8 at 20°C, which would severely limit any possible increase at higher temperatures by this mechanism. None of the arguments is conclusive, and none rules out mechanisms in which the number of functional channels changes with temperature. Insertion of channels at high temperature by vesicle fusion can be ruled out because lowering the temperature rapidly reverses the effects of temperature on I H. Finally, we cannot eliminate the possibility that a rapid gating process (i.e., “flicker”) that is perhaps not in the normal opening pathway might alter the effective unitary current with some arbitrary temperature dependence. In the discussion that follows, we assume that the temperature dependence of I H reflects changes in unitary conductance.
The H+ current is not limited by bulk diffusion.
Limitations to channel permeation can occur at several stages, as delineated for gramicidin by Andersen (1983). The rate-limiting step could occur during diffusion to the mouth of the channel, entry into the channel, permeation through the pore, the exit step, or diffusion away on the distal side. For H+ channels, additional possible rate-limiting steps include buffer diffusion, protonation/deprotonation reactions, and hydrolysis. Because varying the external or internal buffer concentrations from 1 to 100 mM changed I H less than twofold (DeCoursey and Cherny, 1996b ), neither diffusion nor protonation/deprotonation of buffer limits I H. The present results appear to rule out the possibility that diffusion of free H+ is rate determining. This conclusion is consistent with the larger deuterium isotope effect on H+ channel currents than on conduction in bulk solution (DeCoursey and Cherny, 1997).
Temperature dependence of H+ conduction in water.
The electrical conductivity (ionic mobility) of H+ is anomalously higher than that of any other cation, by a factor of ∼5 (Eigen and DeMaeyer, 1958; Robinson and Stokes, 1959). This observation is explained by the unique conduction mechanism for H+. The proton in aqueous solution exists mainly (96–99% of the time) in association with a particular water molecule as a hydronium ion, H3O+ (Conway et al., 1956). Any of the three protons may leave this molecule to conduct current. Protons thus hop from one water molecule to the next (de Grotthuss, 1806) by a mechanism referred to as Grotthuss, water wire, or prototropic transfer (Lengyel and Conway, 1983). The activation energy for H+ conduction is lower than for other ions, and decreases rapidly with increasing temperature. The Q 10 for H+ conductivity, λ0, decreases from 1.2 between 5 and 15°C to 1.11 between 35 and 45°C (Landolt-Börnstein, 1960). The conductivity of H+ traditionally has been separated into ordinary hydrodynamic conduction (that expected if H3O+ diffused as an invariant molecular species like other ions) and “excess” prototropic conductivity of H+; e.g., λH + − λNa + (Hückel, 1928). Hydrogen bonds between molecules facilitate H+ conduction by the Grotthuss mechanism. The excess prototropic conduction decreases strongly with increased temperature: (λHCl − λKCl)/λKCl is 2.26 at 273°K and 1.07 at 373°K (Lengyel and Conway, 1983), because the extent of hydrogen bonding in water is decreased by thermal motion (Ewell and Eyring, 1937; Morgan and Warren, 1938). The validity of the common practice of subtracting hydrodynamic from total to obtain the “excess” H+ conductance has been questioned recently, on the basis that little conventional hydrodynamic conductance can occur due to the strength of first-shell hydrogen bonds, which trap the H3O+ ion in a densely hydrogen-bonded network of water molecules (Agmon, 1996). In this view, all H+ conduction occurs by prototropic transfer. H+ permeation through channels most likely occurs by this mechanism.
Permeation is not equivalent to diffusion in bulk solution.
The conductance of most cation channels is weakly temperature sensitive (Table II). A higher E a has been reported for a lymphocyte K+ channel, 8.2 kcal/mol or twice that of free diffusion (Lee and Deutsch, 1990), and even higher values for inward rectifier K+ channels, although these higher values are from macroscopic measurements that may reflect factors other than changes in single-channel current amplitude. The Q 10 of the conductivity of physiological monovalent cations (Na+ and K+) in aqueous solutions is ∼1.2–1.3 between 5 and 35°C, while that of H+ is only 1.14–1.20 (Robinson and Stokes, 1959). The similarity of the Q 10 for aqueous diffusion of ions and open channel conductance suggests that ions permeate channels in an environment approximating aqueous diffusion (e.g., Horn, 1984; Stein, 1986). This implies that there are not large energy barriers in the permeation pathway, and the ion should permeate at a rate roughly comparable with its diffusion in bulk solution. The conductance of various channels is somewhat less than calculated from the bulk diffusion coefficient, given the dimensions of the pore (Stein, 1986). Calculated using the Poisson-Nernst-Planck approach, the effective diffusion coefficient of ions inside channels during permeation is roughly an order of magnitude lower than in bulk solution (Chen et al., 1997). Part of the higher E a for conduction through ion channels than bulk solution may reflect the energetic cost of partial dehydration of the ion; the effective hydration number of ions in solution decreases at higher temperatures, facilitating entry into the channel (Kuyucak and Chung, 1994). The mobility of H+ in gramicidin channels, which are single-file water-filled pores (Levitt et al., 1978; Finkelstein and Andersen, 1981), at high [HCl] is not much lower than in bulk HCl solution, suggesting that this water-filled pore offers little additional intrinsic resistance (Cukierman et al., 1997). H+ current through single gramicidin channels has a Q 10 of 1.33 (4.8 kcal/mol) at 1 M HCl (Akeson and Deamer, 1991), about twice that of the mobility of H+ in bulk solution. Akeson and Deamer (1991) speculated that misaligned hydrogen bonds between waters in the pore might increase the E a for proton hopping. The recent proposal that the rate-determining step in H+ conduction in water is the breaking of second hydration shell hydrogen bonds of strength 2.5 kcal/mol (Agmon, 1995) leads to the idea that entry of H+ into a channel must require breaking a first shell hydrogen bond, which would be about twice as strong (Agmon, 1996), consistent with the conclusion that H+ permeation through gramicidin is entirely diffusion limited (Decker and Levitt, 1988). The Q 10 for H+ permeation reported here is substantially larger, especially considering the uniquely low Q 10 of H+ conduction in aqueous solution. Evidently, the rate-limiting step in H+ permeation through voltage-gated H+ channels is thermodynamically distinct from diffusion.
What is the rate-limiting step in permeation?
Table III compares E a for voltage-gated H+ channels with various processes involving protons. We focus on parameters related to hydrogen bonding and to the two separate processes believed to be required for H+ passage through an HBC, namely a hopping step (ionic defect migration) and a turning step (Bjerrum L defect migration, or reorientation/rotation of the elements in the HBC to “reload” for the next H+) (Nagle and Morowitz, 1978; Nagle and Tristram-Nagle, 1983). The E a found for H+ permeation through voltage-gated channels, 18–27 kcal/mol, is much larger than the E a for H+ diffusion, 2.6 kcal/mol, and more than double the free energy of water rotation in ice, 8.4 kcal/mol (Glasstone et al., 1941). Of the few processes in Table III with E a in the range observed here, hydrolysis is intriguing because Kasianowicz et al. (1987) proposed this mechanism to account for the problematic supply of sufficient protons to support the large H+ fluxes observed in protonophore-doped membranes. Voltage-gated H+ currents verge on being large enough to require this or some other special mechanism to supply H+ to the channel (DeCoursey and Cherny, 1996b ).
Could hydrolysis provide enough protons to conduct H+ current?
The hydrolysis mechanism is effectively a proton transfer reaction in the energetically unfavorable direction from water, with pK a 15.7, to a hypothetical protonation site at the inner mouth of the channel, whose pK a is unknown but likely much lower. If we assume that the reverse reaction is rapid and diffusion limited and occurs at 2.3 × 10¹⁰ M−1 s−1 (Eigen and Hammes, 1963), then the forward reaction rate is determined by the pK a of the channel (Bell, 1973; Eigen, 1964). The maximum single-channel H+ current assuming that all protons come from hydrolysis is then only 0.04 fA for His (histidine); pK a 6.0), 6.2 fA for Cys (cysteine; pK a 8.18), and 477 fA for Tyr (tyrosine; pK a 10.07). The elementary current through H+ channels in neutrophils was estimated at ∼1 fA (DeCoursey and Cherny, 1993), and more recent estimates are somewhat larger (V.V. Cherny and T.E. DeCoursey, unpublished observations). Thus the hypothesis that hydrolysis provides most of the protons is plausible only if the entry site has an effective pK a ≥ 8 (i.e., Cys, Tyr, Lys, Arg). A speculative mechanism that might overcome the limited intrinsic rate of hydrolysis assumes that the H+ channel is a metalloprotein. The zinc ion at the catalytic center of carbonic anhydrase greatly lowers the pK a of the H2O molecule bound to it, facilitating hydrolysis, as well as electrostatically repelling the nascent proton from the resulting OH− (Liang and Lipscomb, 1988). An attractive feature of hydrolysis is that it would occur at a rate relatively independent of pH, and this could account for the near pH independence of the g H (Byerly et al., 1984; Demaurex et al., 1993; DeCoursey and Cherny, 1994b , 1995, 1996a ; Cherny et al., 1995).
Entry of the proton into the HBC is not rate limiting.
Entry of the ionic defect into an HBC should have a substantial E a (Nagle et al., 1980; Table III), comprising the Born electrostatic energy required to insert a charge into a low dielectric membrane/channel and the chemical energy required to protonate a group on the HBC (John F. Nagle, personal communication). The transmembrane movement of each electronic charge e during H+ conduction across an HBC is divided into two parts, reducing the Born energy. In ice (Scheiner and Nagle, 1983), 0.64 e is carried across during the H+ hopping step and the other 0.36 e is carried during the “turning” step as the HBC reorients to permit the next transfer. The Born energy f 2 q 2/(2 a ε) amounts to 7 kcal/mol under reasonable assumptions (Nagle et al., 1980): the fractional charge f = 0.5 because we do not know the nature of the HBC, q = the electronic charge, ionic radius a = 3 Å, and the dielectric constant ε = 2. The chemical energy for a proton to enter the HBC is (pH − pK) × 1.34 kcal/mol. If the group that comprises the mouth of the channel has a much lower pK a than the ambient pH, entry will be thermodynamically unfavorable and require a high E a. Generating the large E a that we observe (Tables IB and III by this mechanism would require a large difference (pHi − pK) on the order of 8–15 U. The forward rate constant for channel protonation would be too low to result in much current, and we therefore rule out the entry step as rate limiting in permeation.
Table IB.
Activation Energy, Ea (kcal/mol), for Voltage-gated H+ Channels (Mean ± SD)
| Cell type | I H | τact | Delay | τtail | ||||
|---|---|---|---|---|---|---|---|---|
| PMN | 18.7 ± 1.2(5) | 30.6 ± 3.5(5) | 33.3 ± 4.1(5) | 31.6 (1) | ||||
| THP-1 | 12.5 ± 1.0 (4) | 33.4 ± 5.3(8) | 35.0 ± 5.0 (7) | 35.9 ± 3.9(6) | ||||
| BV-2 | 12.6 ± 3.3(4) | 38.4 ± 3.7(4) | 38.1 ± 3.2(4) | 36.4 ± 0.4 (3) | ||||
| HL-60 | 13.9 ± 4.1(3) | 32.6 ± 2.5(3) | 32.2 (2) | 32.7 (2) | ||||
| Rat Mφ | 18.5 ± 5.6(3) | 34.1 ± 5.3(3) | 36.5 (2) | |||||
| Type II | 13.6 ± 6.0(15) | 34.3 ± 4.4(16) | 33.7 ± 2.0(9) | 31.3 ± 4.5 (10) | ||||
| i-o patch | 18.3 ± 2.2(5), >20°27.0 ± 3.6(4), <20° |
36.0 ± 4.2(6) | 30.0 (1) |
Same data as in Table IA expressed in terms of activation energy. The values are not directly interchangeable because different temperature ranges were used in different experiments.
Permeation is rate determining.
Many types of evidence point to H+ permeation through the channel as being rate determining for voltage-gated H+ channel current. Even if hydrolysis could provide sufficient protons, it seems unlikely to be rate limiting. I H does not saturate at large voltages except at low intracellular buffer concentration, and in this situation the apparent saturation probably reflects bulk pHi changes (DeCoursey, 1991). If increasing the voltage increases the current, then the rate-determining step must be voltage dependent. Entry into or exit from the pore could conceivably appear voltage dependent if permeation occurred as a collective event, a possibility suggested by the high proton polarizability of numerous hydrogen-bonded systems (Zundel, 1992). However, entry/exit could not appear voltage dependent if this were the rate-limiting step. Permeation across an HBC might involve a large E a. Because both the hopping and turning steps in HBC conduction carry fractional charges (Scheiner and Nagle, 1983), both would be voltage dependent and either could be rate determining.
A high energy barrier to proton permeation might be traversed by tunneling. In this case, the deuterium isotope effect on permeation would likely be large (e.g., 67) (Conway et al., 1956; Crooks, 1977), whereas we observed only a 1.9 H+/D+ ratio (DeCoursey and Cherny, 1997). The Arrhenius slope should also be somewhat steeper in deuterium (Bahnson and Klinman, 1995). In preliminary attempts, we observed E a for permeation (and gating) in D2O that were in the upper range of values in protium solutions. More careful investigation of this question is warranted, but at present there is not strong evidence that tunneling is rate limiting.
Although its high E a appears to place H+ channel permeation in the realm of pumps and carriers, H+ currents require neither ATP nor co- or counter-ions. A simple carrier mechanism for permeation seems unlikely. Unless the deprotonated form of the carrier is effectively uncharged, it will tend to accumulate on one side of the membrane at extreme voltages, giving rise to a bell-shaped voltage dependence, as recently described for H+ translocation by the voltage sensor of K+ channel (Starace et al., 1997). We conclude that permeation through the H+ channel is an arduous undertaking for a proton, with a large E a that intrinsically limits the conductance of this channel.
Are H+ channels water-filled pores?
We have suggested that voltage-gated H+ channels are unlikely to be water-filled membrane-spanning pores (DeCoursey and Cherny, 1994b , 1995, 1997; Cherny et al., 1995). Three types of evidence support this conclusion. (a) Voltage-gated H+ channels are extremely selective, with no detectable permeability to cations other than H+ or D+, and permeability ratios P H/P cation > 106 − 108, calculated from deviations of V rev from E H (Kapus et al., 1993; Demaurex et al., 1993; DeCoursey and Cherny, 1994b , 1997; Cherny et al., 1995). A water-filled pore would be expected to have detectable permeability to other cations because H3O+ and K+ have nearly identical radii. (b) The unitary H+ channel conductance appears to be near saturation at pH 7.5, eight orders of magnitude lower [H+] than at saturation of H+ current through other water-filled ion channels (DeCoursey and Cherny, 1994b ). (c) The H+/D+ conductance ratio is 1.9 at 20°C (DeCoursey and Cherny, 1997), much greater than 1.35 in the prototypical water-filled channel gramicidin (Akeson and Deamer, 1991). Some uncertainty is introduced by the possibility that the water molecules in a pore are constrained by interactions with the walls (e.g., Nagle et al., 1980; Gutman et al., 1992). Molecular dynamics simulations indicate that rotational relaxation rates for water molecules confined inside narrow channels are reduced compared with bulk (Sansom et al., 1996). Ab initio molecular orbital calculations (Scheiner, 1981) show that the E a for proton transfer between hydrogen-bonded chains of water molecules increases dramatically and superlinearly if the inter- oxygen distance is increased or the bond angles are deformed, and theoretically could be as large as found here. The deuterium isotope effect on conduction is much larger in ice than in liquid water (Kunst and Warman, 1980). Table III shows that the E a for some of the steps likely involved in H+ conduction through a water-filled pore (water rotation, proton hopping, and defect migration) is increased severalfold in ice. Even so, the E a observed here for I H remains about double any of these values, suggesting that if the H+ channel were a water-filled pore, then it must constrain the water molecules more tightly than in ice. a and b above remain hard to reconcile with the idea of a water-filled pore, although waters rigidly frozen inside the channel could prevent other cations from permeating. On balance, we favor the idea that the channel does not contain a continuous chain of waters that span the membrane.
Hydrogen-bonded chain.
The alternative to a water-filled pore is a hydrogen-bonded-chain, a continuous “proton wire” comprising some combination of side groups of amino acids and possibly intercalated water molecules. (We imply the presence of substituents other than water in our use of the term HBC, although a pure “water wire” is formally just a special type of HBC). The HBC mechanism was proposed by Nagle and colleagues for other biological H+ channels such as those in bacteriorhodopsin and in H+ATPases of mitochondria and chloroplasts (Nagle and Morowitz, 1978; Nagle and Tristram-Nagle, 1983). Comparison of the Q 10 for H+ translocation through other membrane proteins (Table IV) generally suggests that H+ transporters that involve conduction via hydrogen-bonded chain mechanisms that include protein groups (such as bacteriorhodopsin, the H+ channel of proton pumps, and MotA) tend to have substantially higher Q 10 than does H+ permeation through the water-filled gramicidin pore. The high Q 10 observed here for I H suggests the existence of significant energy barriers in the permeation pathway. Although we consider a simple water wire to be unlikely, the hydrogen-bonded chain comprising the permeation pathway certainly could include intercalated water molecules, as demonstrated recently for bacteriorhodopsin (Pebay-Peyroula et al., 1997). The M2 viral proton channel may comprise a water-filled pore with a single constriction, occluded by His groups that shuttle protons by a tautomerization (ring flipping) mechanism (Pinto et al., 1997). Although the temperature dependence of its conductance is not known, the rate-determining step in CO2 catalysis by carbonic anhydrase is an intramolecular proton transfer from Zn-bound water to His (Liang and Lipscomb, 1988; Taoka et al., 1994), with E a ∼8 kcal/mol (Ghannam et al., 1986). In summary, the high Q 10 of H+ permeation strengthens the case that the voltage-gated H+ channel is not a water-filled pore like other ion channels. Entry into the channel may consist of simple protonation of the end of an HBC. This may explain the paucity of inhibitors of this conductance—there is no pore to occlude. The main inhibitors of H+ currents are polyvalent cations, which may bind to the putative proton entry site or near enough to it to lower the local [H+] electrostatically.
Table IV.
Q10 Values for Other H+ (or Non-H+)* Transporters
| Transporter | Range | Q 10 | Reference | |||
|---|---|---|---|---|---|---|
| (°C) | ||||||
| Passive currents | ||||||
| H+ conductvity, water | 18–25 | 1.17 | Robinson and Stokes, 1959 | |||
| H+/OH− permeability, renal | 25–40 | 1.30 | Ives, 1985 | |||
| Gramicidin: H+ current | 15–22 | 1.33 | Akeson and Deamer, 1991 | |||
| Gramicidin: Na+ current* | 0–25 | 1.56* | Althoff et al., 1989 | |||
| CF0 H+ channel conductance | 0–25 | 1.89 | Althoff et al., 1989 | |||
| Water channel H2O flux* | 4–37 | 1.24 | Dempster et al., 1992 | |||
| Carriers | ||||||
| Na+-H+ antiport | 25–37 | 1.22 | Graber et al., 1992 | |||
| 25–40 | 1.85 | Ives, 1985 | ||||
| Nonactin | 42–48 | 4.23 | Krasne et al., 1971 | |||
| Valinomycin* | 0–25 | 2.61* | Althoff et al., 1989 | |||
| Na+ glutamate co-transport | 8–18 | 1.95 | Schwartz and Tachibana, 1990 | |||
| Malonate flux (mitochondrial anion channel)* | 5–45 | 1.3–13 | Lie et al., 1996 | |||
| Glucose facilitated diffusion (protozoan)* | 20–33 | 2.33* | Wille et al., 1996 | |||
| Intramolecular H+ transfer, carbonic anhydrase II | 5–30 | 1.6 | Ghannam et al., 1986 | |||
| Proton shuttle on K+ channel voltage sensor | 16–30 | 2.6 | Starace et al., 1997 | |||
| Pumps (turnover rate) | ||||||
| H+-ATPase | 13–40 | 2.1 | Bidani et al., 1994 | |||
| MotA H+ flux | 16–32 | 2.1–2.5 | Meister et al., 1987; Blair and Berg, 1990 | |||
| Bacteriorhodopsin | 5–40 | 1.33–3.37‡ | Cao et al., 1995 | |||
| Na,K-ATPase* | 5–37 | 3.0–5.7* | Ellory and Willis, 1982 | |||
| Na,K-ATPase* | 5–35 | 2.4H–5.3L * | Hakao and Gadsby, 1986; Apell, 1997 |
These measurements are not for H+ transport.
Range of activation enthalpies for five kinetic components of H+ transfer in the M intermediate and for H+ release.
Physiological relevance.
At room temperature, mammalian voltage-gated H+ channels open very slowly in comparison with most ion channels, although other slow channels exist, such as the cardiac delayed rectifier. Mammalian H+ channels and those in molluscan neurons differ mainly in activation kinetics (DeCoursey, 1991, 1998), the latter opening in a few milliseconds (Byerly et al., 1984). The strong temperature dependence of gating means that mammalian H+ channels activate 20–40× faster at body temperature than at room temperature. When the high Q 10 of I H is also considered, it is clear that H+ channels are capable of rapid and highly efficient acid extrusion. The combined effect of the high Q 10 for I H and for gating means that the g H will be activated much faster at body temperature than at room temperature, where most studies of H+ currents have been done.
Comparisons among different cells and mammalian species.
A final point to emerge from this study is that the temperature sensitivity of H+ currents and several kinetic measures of H+ channel gating are quite similar in human neutrophils, THP-1 monocytes, and promyelocytic HL-60 cells, mouse BV-2 microglial cells, and rat alveolar epithelial cells and macrophages. A recent study reported highly temperature sensitive H+ currents in murine mast cells, with a Q 10 of 6.0 or 9.9 for the outward current at the end of voltage ramps at pHi 5.5 or 7.3, respectively (Kuno et al., 1997). This high sensitivity appeared to distinguish the H+ channel in mast cells from that in other cells for which little data had been published. However, the H+ current amplitude at the end of a voltage ramp depends on both the conductance and gating kinetics—at low temperatures, fewer channels will open during the ramp. In the present study, we distinguished between effects of temperature on gating and on open channel conductance. Once this separation was made, it became apparent that the temperature sensitivity of both conductance and gating is similar in all cells in which these properties have been studied. Although there are distinct varieties of H+ channels (DeCoursey, 1998), their temperature sensitivity does not differ obviously. Byerly and Suen (1989) reported a Q 10 of 2.1 for whole-cell I H in snail neurons. Because activation is very rapid in Lymnaea, this value is a relatively pure reflection of I H uncontaminated by gating effects, and is well within the range observed for the Q 10 of I H in mammalian cells (Table IA). These observations provide no evidence for significant differences in either the mechanism of H+ permeation or the rate-determining steps in gating in various types of H+ channels.
Acknowledgments
The authors thank Fred S. Cohen, John J. Kasianowicz, Vladislav S. Markin, and Fred N. Quandt for thoughtful comments on the manuscript. The authors are especially grateful to John F. Nagle for explaining the assumptions used to estimate the free energy cost of defect entry into an HBC, and to Richard W. Aldrich for suggestions about gating schemes.
This work was supported most recently by research grant HL-52671 to Dr. DeCoursey from the National Institutes of Health (NIH). Earlier studies were supported by a Grant-in-Aid to Dr. DeCoursey from the American Heart Association with funds contributed by the American Heart Association of Metropolitan Chicago, and before that, by research grant HL-37500 and Research Career Development Award K041928 to Dr. DeCoursey from the NIH.
Abbreviations used in this paper: E
- a
activation energy
- EH
Nernst potential for H+
- gH
H+ chord conductance
- HBC
hydrogen-bonded chain
- IH
extrapolated H+ current amplitude
- Vhold
holding potential
- Vrev
measured reversal potential
Footnotes
Portions of this work were previously published in abstract form (Cherny, V.V., and T.E. DeCoursey. 1998. Biophys. J. 74:A316).
references
- Agmon N. The Grotthuss mechanism. Chem Phys Lett. 1995;244:456–462. [Google Scholar]
- Agmon N. Hydrogen bonds, water rotation and proton mobility. J Chim Phys. 1996;93:1714–1736. [Google Scholar]
- Almers, W. 1971. The Potassium Permeability of Frog Muscle Membrane. Ph.D. dissertation. University of Rochester, Rochester, NY.
- Akeson M, Deamer DW. Proton conductance by the gramicidin water wire: model for proton conductance in the F0F1 ATPases? . Biophys J. 1991;60:101–109. doi: 10.1016/S0006-3495(91)82034-3. [DOI] [PMC free article] [PubMed] [Google Scholar]
- Althoff G, Lill H, Junge W. Proton channel of the chloroplast ATP synthase, CF0: its time-averaged single-channel conductance as a function of pH, temperature, isotopic and ionic medium composition. J Membr Biol. 1989;108:263–271. [Google Scholar]
- Andersen OS. Ion movement through gramicidin A channels: single-channel measurements at very high potentials. Biophys J. 1983;41:119–133. doi: 10.1016/S0006-3495(83)84414-2. [DOI] [PMC free article] [PubMed] [Google Scholar]
- Apell H-J. Kinetic and energetic aspects of Na+/K+-transport cycle steps. Ann NY Acad Sci. 1997;834:221–230. doi: 10.1111/j.1749-6632.1997.tb52253.x. [DOI] [PubMed] [Google Scholar]
- Bahnson BJ, Klinman JP. Hydrogen tunneling in enzyme catalysis. Methods Enzymol. 1995;249:373–397. doi: 10.1016/0076-6879(95)49042-6. [DOI] [PubMed] [Google Scholar]
- Bamberg L, Läuger P. Temperature-dependent properties of gramicidin A channels. Biochim Biophys Acta. 1974;367:127–133. doi: 10.1016/0005-2736(74)90037-6. [DOI] [PubMed] [Google Scholar]
- Barish ME, Baud C. A voltage-gated hydrogen ion current in the oocyte membrane of the axolotl, Ambystoma. . J Physiol (Camb) 1984;352:243–263. doi: 10.1113/jphysiol.1984.sp015289. [DOI] [PMC free article] [PubMed] [Google Scholar]
- Beam KG, Donaldson PL. A quantitative study of potassium channel kinetics in rat skeletal muscle from 1 to 37 °C. J Gen Physiol. 1983;81:485–512. doi: 10.1085/jgp.81.4.485. [DOI] [PMC free article] [PubMed] [Google Scholar]
- Bell, R.P. 1973. The Proton in Chemistry. 2nd ed. Cornell University Press, Ithaca, NY. 310 pp.
- Bernheim L, Krause RM, Baroffio A, Hamann M, Kaelin A, Bader CR. A voltage-dependent proton current in cultured human skeletal muscle myotubes. J Physiol (Camb) 1993;470:313–333. doi: 10.1113/jphysiol.1993.sp019860. [DOI] [PMC free article] [PubMed] [Google Scholar]
- Bidani A, Brown SES, Heming TA. pHi regulation in alveolar macrophages: relative roles of Na+-H+-antiport and H+-ATPase. Am J Physiol. 1994;259:C586–C598. doi: 10.1152/ajplung.1994.266.6.L681. [DOI] [PubMed] [Google Scholar]
- Bjerrum N. Structure and properties of ice. Science. 1952;115:385–390. doi: 10.1126/science.115.2989.385. [DOI] [PubMed] [Google Scholar]
- Blair DF, Berg HC. The MotA protein of E. coliis a proton-conducting component of the flagellar motor. Cell. 1990;60:439–449. doi: 10.1016/0092-8674(90)90595-6. [DOI] [PubMed] [Google Scholar]
- Boheim G, Kolb H-A. Analysis of the multi-pore system of alamethicin in a lipid membrane. I. Voltage-jump current- relaxation measurements. J Membr Biol. 1978;38:99–150. [Google Scholar]
- Byerly L, Meech R, Moody W. Rapidly activating hydrogen ion currents in perfused neurones of the snail, Lymnaea stagnalis. . J Physiol (Camb) 1984;351:199–216. doi: 10.1113/jphysiol.1984.sp015241. [DOI] [PMC free article] [PubMed] [Google Scholar]
- Byerly L, Suen Y. Characterization of proton currents in neurones of the snail, Lymnaea stagnalis. . J Physiol (Camb) 1989;413:75–89. doi: 10.1113/jphysiol.1989.sp017642. [DOI] [PMC free article] [PubMed] [Google Scholar]
- Cao Y, Brown LS, Sasaki J, Maeda A, Needleman R, Lanyi JK. Relationship of proton release at the extracellular surface to deprotonation of the Schiff base in the bacteriorhodopsin photocycle. Biophys J. 1995;68:1518–1530. doi: 10.1016/S0006-3495(95)80324-3. [DOI] [PMC free article] [PubMed] [Google Scholar]
- Chen D, Lear J, Eisenberg B. Permeation through an open channel: Poisson-Nernst-Planck theory of a synthetic ionic channel. Biophys J. 1997;72:97–116. doi: 10.1016/S0006-3495(97)78650-8. [DOI] [PMC free article] [PubMed] [Google Scholar]
- Cherny VV, Markin VS, DeCoursey TE. The voltage-activated hydrogen ion conductance in rat alveolar epithelial cells is determined by the pH gradient. J Gen Physiol. 1995;105:861–896. doi: 10.1085/jgp.105.6.861. [DOI] [PMC free article] [PubMed] [Google Scholar]
- Chiu SY, Mrose HE, Ritchie JM. Anomalous temperature dependence of the sodium conductance in rabbit nerve compared with frog nerve. Nature. 1979;279:327–328. doi: 10.1038/279327a0. [DOI] [PubMed] [Google Scholar]
- Collier WB, Ritzhaupt G, Devlin JP. Spectroscopically evaluated rates and energies for proton transfer and Bjerrum defect migration in cubic ice. J Phys Chem. 1984;88:363–368. [Google Scholar]
- Conway BE, Bockris JO, Linton H. Proton conductance and the existence of the H3O.ion. J Chem Phys. 1956;24:834–850. [Google Scholar]
- Crooks, J.E. 1977. Proton transfer to and from atoms other than carbon. In Chemical Kinetics. Vol. 8. C.H. Bamford and C.F.H. Tipper, editors. Elsevier Science Inc., New York. 248–250.
- Cukierman S, Quigley EP, Crumrine DS. Proton conduction in gramicidin A and in its dioxolane-linked dimer in different lipid bilayers. Biophys J. 1997;73:2489–2502. doi: 10.1016/S0006-3495(97)78277-8. [DOI] [PMC free article] [PubMed] [Google Scholar]
- Decker ER, Levitt DG. Use of weak acids to determine the bulk diffusion limitation of H+ion conductance through the gramicidin channel. Biophys J. 1988;53:25–32. doi: 10.1016/S0006-3495(88)83062-5. [DOI] [PMC free article] [PubMed] [Google Scholar]
- DeCoursey TE. State-dependent inactivation of K+currents in rat type II alveolar epithelial cells. J Gen Physiol. 1990;95:617–646. doi: 10.1085/jgp.95.4.617. [DOI] [PMC free article] [PubMed] [Google Scholar]
- DeCoursey TE. Hydrogen ion currents in rat alveolar epithelial cells. Biophys J. 1991;60:1243–1253. doi: 10.1016/S0006-3495(91)82158-0. [DOI] [PMC free article] [PubMed] [Google Scholar]
- DeCoursey TE. Four varieties of voltage-gated proton channels. Front Biosci (Online) 1998;3:477–482. doi: 10.2741/a294. [DOI] [PubMed] [Google Scholar]
- DeCoursey TE, Cherny VV. Potential, pH, and arachidonate gate hydrogen ion currents in human neutrophils. Biophys J. 1993;65:1590–1598. doi: 10.1016/S0006-3495(93)81198-6. [DOI] [PMC free article] [PubMed] [Google Scholar]
- DeCoursey TE, Cherny VV. Na+H+antiport detected through hydrogen ion currents in rat alveolar epithelial cells and human neutrophils. J Gen Physiol. 1994a;103:755–785. doi: 10.1085/jgp.103.5.755. [DOI] [PMC free article] [PubMed] [Google Scholar]
- DeCoursey TE, Cherny VV. Voltage-activated hydrogen ion currents. J Membr Biol. 1994b;141:203–223. doi: 10.1007/BF00235130. [DOI] [PubMed] [Google Scholar]
- DeCoursey TE, Cherny VV. Voltage-activated proton currents in membrane patches of rat alveolar epithelial cells. J Physiol (Camb) 1995;489:299–307. doi: 10.1113/jphysiol.1995.sp021051. [DOI] [PMC free article] [PubMed] [Google Scholar]
- DeCoursey TE, Cherny VV. II. Voltage-activated proton currents in human THP1 monocytes. J Membr Biol. 1996a;152:131–140. doi: 10.1007/s002329900092. [DOI] [PubMed] [Google Scholar]
- DeCoursey TE, Cherny VV. Effects of buffer concentration on voltage-gated H+ currents: does diffusion limit the conductance? . Biophys J. 1996b;71:182–193. doi: 10.1016/S0006-3495(96)79215-9. [DOI] [PMC free article] [PubMed] [Google Scholar]
- DeCoursey TE, Cherny VV. Deuterium isotope effects on voltage-activated proton channels in rat alveolar epithelium. J Gen Physiol. 1997;109:415–434. doi: 10.1085/jgp.109.4.415. [DOI] [PMC free article] [PubMed] [Google Scholar]
- DeCoursey TE, Jacobs ER, Silver MR. Potassium currents in rat type II alveolar epithelial cells. J Physiol (Camb) 1988;395:487–505. doi: 10.1113/jphysiol.1988.sp016931. [DOI] [PMC free article] [PubMed] [Google Scholar]
- de Grotthuss, C.J.T. 1806. Sur la décomposition de l'eau et des corps qu'elle tient en dissolution à l'aide de l'électricité galvanique. Ann. Chim. LVIII:54–74.
- Demaurex N, Grinstein S, Jaconi M, Schlegel W, Lew DP, Krause KH. Proton currents in human granulocytes: regulation by membrane potential and intracellular pH. J Physiol (Camb) 1993;466:329–344. [PMC free article] [PubMed] [Google Scholar]
- Dempster JA, Van Hoek AN, Van Os CH. The quest for water channels. News Physiol Sci. 1992;7:172–176. [Google Scholar]
- Dilger JP, Brett RS, Poppers DM, Liu Y. The temperature dependence of some kinetic and conductance properties of acetylcholine receptor channels. Biochim Biophys Acta. 1991;1063:253–258. doi: 10.1016/0005-2736(91)90379-m. [DOI] [PubMed] [Google Scholar]
- Eigen M. Proton transfer, acid-base catalysis, and enzymatic hydrolysis. Part I: elementary processes. Angew Chem Int Ed Engl. 1964;3:1–19. [Google Scholar]
- Eigen M, DeMaeyer L. Self-dissociation and protonic charge transport in water and ice. Proc R Soc Camb A. 1958;247:505–533. [Google Scholar]
- Eigen M, Hammes GG. Elementary steps in enzyme reactions (as studied by relaxation spectrometry) Adv Enzymol. 1963;25:1–38. doi: 10.1002/9780470122709.ch1. [DOI] [PubMed] [Google Scholar]
- Ellory JC, Willis JS. Kinetics of the sodium pump in red cells of different temperature sensitivity. J Gen Physiol. 1982;79:1115–1130. doi: 10.1085/jgp.79.6.1115. [DOI] [PMC free article] [PubMed] [Google Scholar]
- Ewell RH, Eyring H. Theory of the viscosity of liquids as a function of temperature and pressure. J Chem Phys. 1937;5:726–736. [Google Scholar]
- Finkelstein A, Andersen OS. The gramicidin A channel: a review of its permeability characteristics with special reference to the single-file aspect of transport. J Membr Biol. 1981;59:155–171. doi: 10.1007/BF01875422. [DOI] [PubMed] [Google Scholar]
- Frankenhaeuser B, Moore LE. The effect of temperature on the sodium and potassium permeability changes in myelinated nerve fibres of Xenopus laevis. . J Physiol (Camb) 1963;169:431–437. doi: 10.1113/jphysiol.1963.sp007269. [DOI] [PMC free article] [PubMed] [Google Scholar]
- Ghannam AF, Tsen W, Rowlett RS. Activation parameters for the carbonic anhydrase II-catalyzed hydration of CO2 . J Biol Chem. 1986;261:1164–1169. [PubMed] [Google Scholar]
- Glasstone, S., K.J. Laidler, and H. Eyring. 1941. The Theory of Rate Processes: The Kinetics of Chemical Reactions, Viscosity, Diffusion and Electrochemical Phenomena. McGraw-Hill Book Co., New York. 611 pp.
- Gordienko DV, Tare M, Parveen S, Fenech CJ, Robinson C, Bolton TB. Voltage-activated proton current in eosinophils from human blood. J Physiol (Camb) 1996;496:299–316. doi: 10.1113/jphysiol.1996.sp021686. [DOI] [PMC free article] [PubMed] [Google Scholar]
- Graber M, Barry C, Dipaola J, Hasagawa A. Intracellular pH in OK cells II. Effects of temperature on cell pH. Am J Physiol. 1992;262:F723–F730. doi: 10.1152/ajprenal.1992.262.5.F723. [DOI] [PubMed] [Google Scholar]
- Grygorczyk R. Temperature dependence of Ca2+-activated K+currents in the membrane of human erythrocytes. Biochim Biophys Acta. 1987;902:159–168. doi: 10.1016/0005-2736(87)90291-4. [DOI] [PubMed] [Google Scholar]
- Gu X, Sackin H. Effect of pH on potassium and proton conductance in renal proximal tubule. Am J Physiol. 1995;269:F289–F308. doi: 10.1152/ajprenal.1995.269.3.F289. [DOI] [PubMed] [Google Scholar]
- Gutman M, Tsfadia Y, Masad A, Nachliel E. Quantitation of physical-chemical properties of the aqueous phase inside the phoE ionic channel. Biochim Biophys Acta. 1992;1109:141–148. doi: 10.1016/0005-2736(92)90077-y. [DOI] [PubMed] [Google Scholar]
- Hagiwara S, Yoshii M. Effect of temperature on the anomalous rectification of the membrane of the egg of the starfish, Mediaster aequalis. . J Physiol (Camb) 1980;307:517–527. doi: 10.1113/jphysiol.1980.sp013451. [DOI] [PMC free article] [PubMed] [Google Scholar]
- Henderson LM, Chappell JB, Jones OTG. The superoxide-generating NADPH oxidase of human neutrophils is electrogenic and associated with an H+channel. Biochem J. 1987;246:325–329. doi: 10.1042/bj2460325. [DOI] [PMC free article] [PubMed] [Google Scholar]
- Henderson LM, Chappell JB, Jones OTG. Internal pH changes associated with the activity of NADPH oxidase of human neutrophils: further evidence for the presence of an H+conducting channel. Biochem J. 1988a;251:563–567. doi: 10.1042/bj2510563. [DOI] [PMC free article] [PubMed] [Google Scholar]
- Henderson LM, Chappell JB, Jones OTG. Superoxide generation by the electrogenic NADPH oxidase of human neutrophils is limited by the movement of a compensating charge. Biochem J. 1988b;255:285–290. [PMC free article] [PubMed] [Google Scholar]
- Hladky SB, Haydon DA. Ion transfer across lipid membranes in the presence of gramicidin A: I. Studies of the unit conductance channel. Biochim Biophys Acta. 1972;274:294–312. doi: 10.1016/0005-2736(72)90178-2. [DOI] [PubMed] [Google Scholar]
- Hodgkin AL, Huxley AF. A quantitative description of membrane current and its application to conduction and excitation in nerve. J Physiol (Camb) 1952;117:500–544. doi: 10.1113/jphysiol.1952.sp004764. [DOI] [PMC free article] [PubMed] [Google Scholar]
- Horn, R. 1984. Gating of channels in nerve and muscle: a stochastic approach. In Ion Channels: Molecular and Physiological Aspects. W.D. Stein, editor. Academic Press Inc., New York. 53–97.
- Hückel E. Theorie der beweglichkeiten des wasserstoff- und hydroxylions in wässriger lösung. Zeitschrift für Elektrochemie und Angewandte Physikalische Chemie. 1928;34:546–562. [Google Scholar]
- Ives HE. Proton/hydroxyl permeability of proximal tubule brush border vesicles. Am J Physiol. 1985;248:F78–F86. doi: 10.1152/ajprenal.1985.248.1.F78. [DOI] [PubMed] [Google Scholar]
- Kapus A, Romanek R, Qu AY, Rotstein OD, Grinstein S. A pH-sensitive and voltage-dependent proton conductance in the plasma membrane of macrophages. J Gen Physiol. 1993;102:729–760. doi: 10.1085/jgp.102.4.729. [DOI] [PMC free article] [PubMed] [Google Scholar]
- Kasianowicz J, Benz R, McLaughlin S. How do protons cross the membrane-solution interface? Kinetic studies on bilayer membranes exposed to the protonophore S-13 (5-chloro-3-tert-butyl-2′-chloro-4′nitrosalicylanilide) J Membr Biol. 1987;95:73–89. doi: 10.1007/BF01869632. [DOI] [PubMed] [Google Scholar]
- Kimura JE, Meves H. The effect of temperature on the asymmetrical charge movement in squid giant axons. J Physiol (Camb) 1979;289:479–500. doi: 10.1113/jphysiol.1979.sp012748. [DOI] [PMC free article] [PubMed] [Google Scholar]
- Kirsch GE, Sykes JS. Temperature dependence of Na currents in rabbit and frog muscle membranes. J Gen Physiol. 1987;89:239–251. doi: 10.1085/jgp.89.2.239. [DOI] [PMC free article] [PubMed] [Google Scholar]
- Krasne S, Eisenman G, Szabo G. Freezing and melting of lipid bilayers and the mode of action of nonactin, valinomycin, and gramicidin. Science. 1971;174:412–415. doi: 10.1126/science.174.4007.412. [DOI] [PubMed] [Google Scholar]
- Kukita F. Properties of sodium and potassium channels of the squid giant axon far below 0°C. J Membr Biol. 1982;68:151–160. doi: 10.1007/BF01872261. [DOI] [PubMed] [Google Scholar]
- Kuno M, Kawawaki J, Nakamura F. A highly temperature-sensitive proton conductance in mouse bone marrow– derived mast cells. J Gen Physiol. 1997;109:731–740. doi: 10.1085/jgp.109.6.731. [DOI] [PMC free article] [PubMed] [Google Scholar]
- Kunst M, Warman JM. Proton mobility in ice. Nature. 1980;288:465–467. [Google Scholar]
- Kuyucak S, Chung S-H. Temperature dependence of conductivity in electrolyte solutions and ionic channels of biological membranes. Biophys Chem. 1994;52:15–24. doi: 10.1016/0301-4622(94)00034-4. [DOI] [PubMed] [Google Scholar]
- Landolt, H., and R. Börnstein. 1960. Eigenschaften der materie in ihren aggregatzuständen. Part 7, Elektrische eigenschaften II (elektrochemische systeme). R. Appel, K. Cruse, P. Drossbach, H. Falkenhagen, G.G. Grau, G. Kelbg, E. Schmutzer, and H. Strehlow, editors. In Landolt-Börnstein: Zahlenwerte und Funktionen aus Physik, Chemie, Astronomie, Geophysik und Technik. 6th edition. J. Bartels, P. Ten Bruggencate, H. Hausen, K.H. Hellwege, Kl. Schäfer, and E. Schmidt, editors. Springer-Verlag, Berlin. 959 pp.
- Lass Y, Fischbach GD. A discontinuous relationship between the acetylcholine-activated channel conductance and temperature. Nature. 1976;263:150–151. doi: 10.1038/263150a0. [DOI] [PubMed] [Google Scholar]
- Lee SC, Deutsch C. Temperature dependence of K+channel properties in human T lymphocytes. Biophys J. 1990;57:49–62. doi: 10.1016/S0006-3495(90)82506-6. [DOI] [PMC free article] [PubMed] [Google Scholar]
- Lengyel, S., and B.E. Conway. 1983. Proton solvation and proton transfer in chemical and electrochemical processes. In Comprehensive Treatise of Electrochemistry. Vol. 5. Thermodynamic and Transport Properties of Aqueous and Molten Electrolytes. B.E. Conway, J.O Bockris, and E. Yeager, editors. Plenum Publishing Corp., New York. 339–398.
- Lewis GN, Doody TC. The mobility of ions in H2H2O. J Am Chem Soc. 1933;55:3504–3506. [Google Scholar]
- Levitt DG, Elias SR, Hautman JM. Number of water molecules coupled to the transport of sodium, potassium and hydrogen ions via gramicidin, nonactin or valinomycin. Biochim Biophys Acta. 1978;512:436–451. doi: 10.1016/0005-2736(78)90266-3. [DOI] [PubMed] [Google Scholar]
- Liang J-Y, Lipscomb WN. Hydration of CO2 by carbonic anhydrase: intramolecular proton transfer between Zn2+-bound H2O and histidine 64 in human carbonic anhydrase II. Biochemistry. 1988;27:8676–8682. doi: 10.1021/bi00423a025. [DOI] [PubMed] [Google Scholar]
- Liu G, Hinch B, Davatol-Hag H, Lu Y, Powers M, Beavis AD. Temperature dependence of the mitochondrial inner membrane anion channel. J Biol Chem. 1996;271:19717–19723. doi: 10.1074/jbc.271.33.19717. [DOI] [PubMed] [Google Scholar]
- Martin RL, Koumi S-I, Ten RE, Eick Comparison of the effects of internal [Mg2+]i on IK1in cat and guinea-pig cardiac ventricular myocytes. J Mol Cell Cardiol. 1995;27:673–691. doi: 10.1016/s0022-2828(08)80059-4. [DOI] [PubMed] [Google Scholar]
- McDonald TF, Pelzer S, Trautwein W, Pelzer DJ. Regulation and modulation of calcium channels in cardiac, skeletal, and smooth muscle cells. Physiol Rev. 1994;74:365–507. doi: 10.1152/physrev.1994.74.2.365. [DOI] [PubMed] [Google Scholar]
- Meech RW, Thomas RC. Voltage-dependent intracellular pH in Helix aspersaneurones. J Physiol (Camb) 1987;390:433–452. doi: 10.1113/jphysiol.1987.sp016710. [DOI] [PMC free article] [PubMed] [Google Scholar]
- Meister M, Lowe G, Berg HC. The proton flux through the bacterial flagellar motor. Cell. 1987;49:643–650. doi: 10.1016/0092-8674(87)90540-x. [DOI] [PubMed] [Google Scholar]
- Mitchell P, Moyle J. The mechanism of proton translocation in reversible proton-translocating adenosine triphosphatases. Biochem Soc Spec Publ. 1974;4:91–111. [Google Scholar]
- Morgan J, Warren BE. X-ray analysis of the structure of water. J Chem Phys. 1938;6:666–673. [Google Scholar]
- Murrell-Lagnado RD, Aldrich RW. Energetics of ShakerK channels block by inactivation peptides. J Gen Physiol. 1993;102:977–1003. doi: 10.1085/jgp.102.6.977. [DOI] [PMC free article] [PubMed] [Google Scholar]
- Nagle JF, Mille M, Morowitz HJ. Theory of hydrogen bonded chains in bioenergetics. J Chem Phys. 1980;72:3959–3971. [Google Scholar]
- Nagle JF, Morowitz HJ. Molecular mechanisms for proton transport in membranes. Proc Natl Acad Sci USA. 1978;75:298–302. doi: 10.1073/pnas.75.1.298. [DOI] [PMC free article] [PubMed] [Google Scholar]
- Nagle JF, Tristram-Nagle S. Hydrogen bonded chain mechanisms for proton conduction and proton pumping. J Membr Biol. 1983;74:1–14. doi: 10.1007/BF01870590. [DOI] [PubMed] [Google Scholar]
- Nakao M, Gadsby DC. Voltage dependence of Na translocation by the Na/K pump. Nature. 1986;323:628–630. doi: 10.1038/323628a0. [DOI] [PubMed] [Google Scholar]
- Nobile M, Olcese R, Toro L, Stefani E. Fast inactivation of Shaker K+channels is highly temperature dependent. Exp Brain Res. 1997;114:1381–1442. doi: 10.1007/pl00005613. [DOI] [PubMed] [Google Scholar]
- Ohmori H. Inactivation kinetics and steady-state current noise in the anomalous rectifier of tunicate egg cell membrane. J Physiol (Camb) 1978;281:77–99. doi: 10.1113/jphysiol.1978.sp012410. [DOI] [PMC free article] [PubMed] [Google Scholar]
- Pahapill PA, Schlichter LC. Modulation of potassium channels in human T lymphocytes: effects of temperature. J Physiol (Camb) 1990;422:103–126. doi: 10.1113/jphysiol.1990.sp017975. [DOI] [PMC free article] [PubMed] [Google Scholar]
- Parsegian A. Energy of an ion crossing a low dielectric membrane: solutions to four relevant electrostatic problems. Nature. 1969;221:844–846. doi: 10.1038/221844a0. [DOI] [PubMed] [Google Scholar]
- Pebay-Peyroula E, Rummel G, Rosenbusch JP, Landau EM. X-ray structure of bacteriorhodopsin at 2.5 Angstroms from microcrystals grown in lipidic cubic phases. Science. 1997;277:1676–1681. doi: 10.1126/science.277.5332.1676. [DOI] [PubMed] [Google Scholar]
- Pinto LH, Dieckmann GR, Gandhi CS, Papworth CG, Braman J, Shaughnessy MA, Lear JD, Lamb RA, DeGrado WF. A functionally defined model for the M2proton channel of influenza A virus suggests a mechanism for its ion selectivity. Proc Natl Acad Sci USA. 1997;94:11301–11306. doi: 10.1073/pnas.94.21.11301. [DOI] [PMC free article] [PubMed] [Google Scholar]
- Pusch M, Ludewig U, Jentsch TJ. Temperature dependence of fast and slow gating relaxations of ClC-0 chloride channels. J Gen Physiol. 1997;109:105–116. doi: 10.1085/jgp.109.1.105. [DOI] [PMC free article] [PubMed] [Google Scholar]
- Quartararo N, Barry PH. Ion permeation through single ACh-activated channels in denervated adult toad sartorius skeletal muscle fibres: effect of temperature. Pflügers Arch. 1988;411:101–112. doi: 10.1007/BF00581653. [DOI] [PubMed] [Google Scholar]
- Reeves RB. The interaction of body temperature and acid– base balance in ectothermic vertebrates. Annu Rev Physiol. 1977;39:559–586. doi: 10.1146/annurev.ph.39.030177.003015. [DOI] [PubMed] [Google Scholar]
- Roberts NK, Northey HL. Proton and deuteron mobility in normal and heavy water solutions of electrolytes. J Chem Soc Faraday Trans I. 1974;70:253–262. [Google Scholar]
- Robinson, R.A., and R.H. Stokes. 1959. Electrolyte Solutions. Butterworths, London. 571 pp.
- Sansom MSP, Kerr ID, Breed J, Sankararamakrishnan R. Water in channel-like cavities: structure and dynamics. Biophys J. 1996;70:693–702. doi: 10.1016/S0006-3495(96)79609-1. [DOI] [PMC free article] [PubMed] [Google Scholar]
- Sanyal G, Maren TH. Thermodynamics of carbonic anhydrase catalysis: a comparison between human isoenzymes B and C. J Biol Chem. 1981;256:608–612. [PubMed] [Google Scholar]
- Schauf CL, Bullock JO. Solvent substitution as a probe of channel gating in Myxicola: effects of D2O on kinetic properties of drugs that occlude channels. Biophys J. 1982;37:441–452. doi: 10.1016/S0006-3495(82)84690-0. [DOI] [PMC free article] [PubMed] [Google Scholar]
- Scheiner S. Proton transfers in hydrogen-bonded systems: cationic oligomers of water. J Am Chem Soc. 1981;103:315–320. [Google Scholar]
- Scheiner S, Nagle JF. Ab initiomolecular orbital estimates of charge partitioning between Bjerrum and ionic defects in ice. J Phys Chem. 1983;87:4267–4272. [Google Scholar]
- Schmeichel CJ, Thomas LL. Methylxanthine bronchodilators potentiate multiple human neutrophil functions. J Immunol. 1987;138:1896–1903. [PubMed] [Google Scholar]
- Schwarz W. Temperature experiments on nerve and muscle membranes of frogs: indications for a phase transition. Pflügers Arch. 1979;382:27–34. doi: 10.1007/BF00585900. [DOI] [PubMed] [Google Scholar]
- Schwartz EA, Tachibana M. Electrophysiology of glutamate and sodium co-transport in a glial cell of the salamander retina. J Physiol (Camb) 1990;426:43–80. doi: 10.1113/jphysiol.1990.sp018126. [DOI] [PMC free article] [PubMed] [Google Scholar]
- Starace DM, Stefani E, Bezanilla F. Voltage-dependent proton transport by the voltage sensor of the Shaker K+channel. Neuron. 1997;19:1319–1327. doi: 10.1016/s0896-6273(00)80422-5. [DOI] [PubMed] [Google Scholar]
- Stein, W.D. 1986. Transport and Diffusion across Cell Membranes. Academic Press Inc., San Diego, CA. 685 pp.
- Taoka S, Tu C, Kistler KA, Silverman DN. Comparison of intra- and intermolecular proton transfer in human carbonic anhydrase II. J Biol Chem. 1994;269:17988–17992. [PubMed] [Google Scholar]
- Thomas RC, Meech RW. Hydrogen ion currents and intracellular pH in depolarized voltage-clamped snail neurones. Nature. 1982;299:826–828. doi: 10.1038/299826a0. [DOI] [PubMed] [Google Scholar]
- Walrafen GE, Yang W-H, Chu YC, Hokmabadi MS. Raman OD-stretching overtone spectra from liquid D2O between 22 and 152°C. J Phys Chem. 1996;100:1381–1391. [Google Scholar]
- Wille U, Seyfang A, Duszenko M. Glucose uptake occurs by facilitated diffusion in procyclic forms of Trypanosoma brucei. . Eur J Biochem. 1996;236:228–233. doi: 10.1111/j.1432-1033.1996.00228.x. [DOI] [PubMed] [Google Scholar]
- Yamamoto D, Yeh JZ. Kinetics of 9-aminoacridine block of single Na channels. J Gen Physiol. 1984;84:361–377. doi: 10.1085/jgp.84.3.361. [DOI] [PMC free article] [PubMed] [Google Scholar]
- Zundel, G. 1992. Hydrogen-bonded systems with large proton polarizability due to collective proton motion as pathways of protons in biological systems. In Electron and Proton Transfer in Chemistry and Biology. A. Müller, H. Ratajczak, W. Junge, and E. Diemann, editors. Elsevier Science Inc., New York. 313–327.