

Abstract
A graded response to calcium is the defining feature of calcium-regulated exocytosis. That is, there exist calcium concentrations that elicit submaximal exocytotic responses in which only a fraction of the available population of secretory vesicles fuse. The role of calcium-dependent inactivation in defining the calcium sensitivity of sea urchin egg secretory vesicle exocytosis in vitro was examined. The cessation of fusion in the continued presence of calcium was not due to calcium-dependent inactivation. Rather, the calcium sensitivity of individual vesicles within a population of exocytotic vesicles is heterogeneous. Any specific calcium concentration above threshold triggered subpopulations of vesicles to fuse and the size of the subpopulations was dependent upon the magnitude of the calcium stimulus. The existence of multiple, stable subpopulations of vesicles is consistent with a fusion process that requires the action of an even greater number of calcium ions than the numbers suggested by models based on the assumption of a homogeneous vesicle population.
Keywords: cytoplasmic vesicles, fertilization, membrane fusion, sea urchins, secretion
introduction
In many calcium-regulated exocytotic systems, the response to increasing concentrations of intracellular calcium is characterized by a sigmoidal relationship between exocytosis and calcium concentration (reviewed in Knight and Scrutton, 1986; Knight and Baker, 1987). There exist calcium concentrations that can elicit submaximal exocytotic responses in which only a fraction of the available population of secretory vesicles fuse, despite prolonged exposure to calcium concentrations exceeding a threshold value. Since exocytosis is an irreversible secretion of concentrated products, submaximal exocytotic responses cannot be explained with single, linear reaction schemes because the irreversible step will collect, in time, the entire population. We have examined the origin of submaximal exocytotic responses because (a) differentiation between hypotheses that attempt to explain this behavior is required for the development of correct secretory models; (b) it is a feature common to calcium-triggered exocytotic systems, including synaptic transmission and neuroendocrine secretion; and (c) the goal of relating specific proteins with steps in the exocytotic process can only proceed if the steps in the process are correctly identified and characterized in detail.
In the sea urchin, Strongylocentrotus purpuratus, 50% of the vesicles fuse in response to ∼20 μM free calcium (Vogel et al., 1996). In this paper, we consider two general hypotheses to explain why only a fraction of the vesicles fused. The first hypothesis is that an initially homogeneous population of cortical vesicles is inactivated after the initiation of the fusion process such that only a fraction fuse. The second hypothesis is that the population of cortical vesicles is heterogeneous in their response to calcium before the application of calcium, such that different subpopulations of vesicles enter the fusion process, depending upon the magnitude of the calcium stimulus.
Models have been proposed for synaptic transmission and neuroendocrine secretion that attempt to quantitatively relate the extent and/or rate of exocytosis to the calcium concentration (Dodge and Rahamimoff, 1967; Llinas et al., 1976, 1981; Simon and Llinas, 1985; Zucker and Fogelson, 1986; Heinemann et al., 1993, 1994). Modeling the exocytotic response often requires the inclusion of calcium-dependent steps distinct from the actual fusion step. These steps may be dependent upon temporal and spatial properties of the calcium concentration that obscure the underlying relationship between calcium and exocytosis. Preparations that reduce the degree of complexity are attractive systems for investigating the relationship between calcium and exocytosis.
Cortical degranulation in the sea urchin egg isolated planar cortex, an example of calcium-triggered exocytosis, is such a preparation (Vacquier, 1975; Baker and Whitaker, 1978; Zimmerberg et al., 1985; reviewed in Jackson and Crabb, 1988; Vogel et al., 1991; Zimmerberg et al., 1993). It is ideal for these studies because the exocytotic response to calcium is sigmoidal, vesicles are “pre-docked,” endocytosis does not occur, and calcium-triggered exocytosis occurs in the absence of ATP, GTP, and all other soluble factors and proteins. Vesicle exocytosis is neither influenced by nor dependent upon interconversion between different spatially localized “pools” or compartments. In other systems, complications such as the temporal overlap of exocytosis and endocytosis, or the loss of cytosolic factors, “rundown,” make the origin of submaximal responses difficult to evaluate. For example, the interpretation of membrane capacitance changes during exocytosis is strongly dependent upon differentiation of vesicle transport between “reserve” and readily releasable compartments and from endocytosis (Heinemann et al., 1994), and manipulating the submaximal state in certain permeabilized cell preparations is limited by the loss of factors required for exocytosis (Sarafian et al., 1987).
No evidence was found to support the hypothesis that calcium-dependent inactivation is responsible for the cessation of fusion (submaximal responses). The hypothesis that the calcium sensitivity of secretory vesicle exocytosis in vitro is heterogeneous before initiating fusion was consistent with the data. A decrease in the number of vesicles within a fusing subpopulation was the only limiting process identified.
materials and methods
Specimens of the sea urchins, Strongylocentrotus purpuratus and Lytechinus pictus were purchased from Marinus, Inc. (Long Beach, CA) and maintained at 10 and 15°C in aquaria, respectively. Eggs were obtained by intracoelomic injection of 0.5 M KCl and collected in artificial sea water (Instant Ocean; Aquarium Systems, Mentor, OH). Eggs were dejellied mechanically by passage through a 90 (S. purpuratus) or 110 (L. pictus) μm pore size nylon mesh, washed three times in large volumes of artificial sea water, allowed to settle in a large beaker that minimized packing, and held at 16°C in artificial sea water. An aliquot of the egg suspension was deposited onto poly-l-lysine-treated (250 μg/ml) cover slips and the eggs were allowed to settle and attach to the coverslip over a 2–5-min period. The cover slip was rinsed with shearing medium: 50 mM piperazine-ethane sulfonic acid, K-PIPES (Sigma Chemical Co., St. Louis, MO), 425 mM potassium chloride (Mallinckrodt, Inc., Paris, KY), 3 mM hydroxyethyl-ethylenediamine-triacetic acid (HEDTA; Sigma Chemical Co.), 3 mM EGTA (Fluka Chemical Corp., Ronkonkoma, NY), 3 mM nitrilotriacetic acid (NTA; Fluka Chemical Corp.), and 1 mM benzamidine (Sigma Chemical Co.), pH 6.7 adjusted with potassium hydroxide (Mallinckrodt, Inc.). Later experiments used a modified calcium buffer containing 6 mM HEDTA, 6 mM EGTA, and 3 mM NTA. The exocytotic response to defined calcium concentrations was identical using either buffer composition. A stream of 2–5 ml of shearing medium produced from a hand-held syringe with a 19-gauge needle was used to shear the attached eggs. This procedure resulted in an attached layer of plasma membrane with bound cortical vesicles (Vacquier, 1975), known as the planar isolated cortex.
Solutions with defined calcium concentrations were prepared by adding CaCl2 (0.1000 ± 0.0005 mol/liter calcium standard; Orion Research, Cambridge, MA) to shearing medium (0–7 mM final concentration). Calcium activities were measured at room temperature (21–24°C) with calcium-specific electrodes (TIPCA, Kwik Tip; World Precision Instruments, Inc., Sarasota, FL) calibrated against calcium standards. Solutions prepared according to Tsien and Rink (1980), and commercial solutions (CALBUF-1; World Precision Instruments, Inc.) gave the same calibration curves. The voltage response of the calcium electrodes was linear over the pCa range 7.0–3.0. The standard error for any single pCa determination was typically <0.1 pCa U. The standard error for averaged data was always <0.1 pCa U and was typically <0.05 pCa U.
Fast perfusion of solutions was achieved using a flow chamber specifically designed for use with multiple solution exchange protocols (Kaplan et al., 1991, 1996; Zimmerberg et al., 1992). The original perfusion system was modified for use with four solutions instead of two. Four valves were used for solution delivery, two for solution removal, and two were used to toggle the vacuum lines for rapid exchange of fluid. Unstirred layers were minimized using flow rates fast enough to generate turbulent flow within the chamber. Solution exchange at the cover slip surface was estimated to be <200 ms based on the pH-dependent shift in the fluorescence of coverslips coated with fluorescein-conjugated albumin (Kaplan et al., 1996). Later experiments used a modified perfusion system using unidirectional solution exchange within the flow chamber.
Cortical vesicle fusion was calculated from changes in the forward light scattering intensity. The scattered intensity is proportional to the number of cortical vesicles present in the monolayer of cortices: the scattered intensity decreases as the number of cortical vesicles decreases (Zimmerberg et al., 1985). An upright microscope fitted with a photodiode detector was used as the light scattering photometer. The combination of a darkfield condenser (0.63 numerical aperture) and a low numerical aperture objective (0.22 numerical aperture) provided conical collection over scattering angles ranging from ∼10–40 degrees. Light scattering was normalized using the initial and final intensities measured in the absence of calcium and after exposure to a high calcium concentration (>300 μM). 100 and 0% fusion correspond to 0 and 1 normalized light scattering, respectively. Exposure of the cortices to high calcium concentrations resulted in the fusion of essentially every cortical vesicle present. The probed monolayer consisted of 20–40 cortices, resulting in a signal that represented the scattering behavior of ∼106 cortical vesicles. The entire apparatus was located in rooms maintained at ∼16°C. Differences in the free calcium concentration of solutions measured at room temperature but used at 16°C were estimated using the program Maxchelator (v6.95, BERS constants; program provided by Chris Patton, cpatton@stanford.edu) and found to be less than the standard error for pCa determination.
The data obtained from 188 egg preparations (111 S. purpuratus and 77 L. pictus) over a 3-yr period are presented in this study. The results from a total of 94 double challenges (68 S. purpuratus and 26 L. pictus) are reported. Curve fitting was performed using the Levenburg-Marquardt algorithm with Pearson Minimization as implemented in TableCurve 2D software (Windows v2.0; Jandel Scientific, Corte Madera, CA). Derivative curves were calculated from percent fusion versus time using third-order forward differences and smoothed using a low-pass filter as implemented in SigmaPlot (Windows v2.0). No seasonal or yearly differences in exocytosis were observed except at the end of the season, when large decreases in calcium sensitivity and loss of resistance to shear were sometimes observed. Data from the end of the season were not included in the analysis. Decreases in the calcium sensitivity of the cortex during the first few minutes after shearing have been reported (Moy et al., 1983; Sasaki and Epel, 1983; Zimmerberg et al., 1985). Stable conditions were achieved by waiting 10 min after shearing before initiating the solution exchange protocols. The origin of the decrease in calcium sensitivity during the first few minutes after shearing is not understood.
results
Intermediate calcium concentrations lead to stable, submaximal responses in the extent of fusion (Fig. 1 A). The loss of vesicles with time cannot be described by a single exponential process. Differences in the fusion time course after normalization of the fusion data to the submaximal extents of fusion indicate that the kinetics of the vesicles that take part in the fusion process depend upon the calcium concentration (Fig. 1 B). There appears to exist an absolute threshold in calcium concentration (∼5 μM) below which no vesicle fusion was observed. The fusion kinetics are faster, and higher calcium concentrations are required for comparable extents of fusion with L. pictus compared with S. purpuratus (Fig. 2 A). For each species studied, the transition from 0 to 100% fusion occurs over a narrow range of calcium concentrations. Well after the time required to establish a spatially and temporally invariant calcium concentration, there exists an inflection point in the %fusion-vs.-time curve such that the instantaneous rate of fusion, d(%fusion)/dt, is maximum. The rate of fusion increases, peaks at this maximum rate, and then decreases in the presence of a defined, spatially and temporally invariant, concentration of calcium: the rate of fusion does not decrease monotonically with time (Fig. 2 B). However, this kinetic feature can be obscured when the rate (derivative) curve is too noisy, the phase occurs within a time period comparable to the solution turnover in the chamber, or the temporal resolution is too low. For example, the early kinetic behavior of L. pictus was easily observed using a higher sampling rate (20 ms/point) compared with the typical sampling rate (≥100 ms/point). The maximum rate of fusion in previously unchallenged cortices increases with increasing calcium concentration, while the time to reach the maximum rate decreases with increasing calcium concentration (Fig. 1 B). The increase in the maximum rate of fusion with increasing calcium concentration is consistent with the previously observed increase in the inverse half time (Zimmerberg et al., 1985). What process(es) could limit the extent and instantaneous rate of fusion in the continued presence of calcium?
Figure 1.

(A) Percent fusion vs. time. Four different calcium concentrations are represented (35, 14, 10, and 5 μM). In this example, a calcium concentration of 5 μM was below the threshold for fusion. The data were collected using a sample time of 0.1 s. (B) Normalization of the fusion data to the submaximal extents of fusion for 10, 14, and 35 μM calcium. Differences in the fusion time course after normalization indicate that the kinetics of the vesicles that take part in the fusion process depend upon the calcium concentration.
Figure 2.
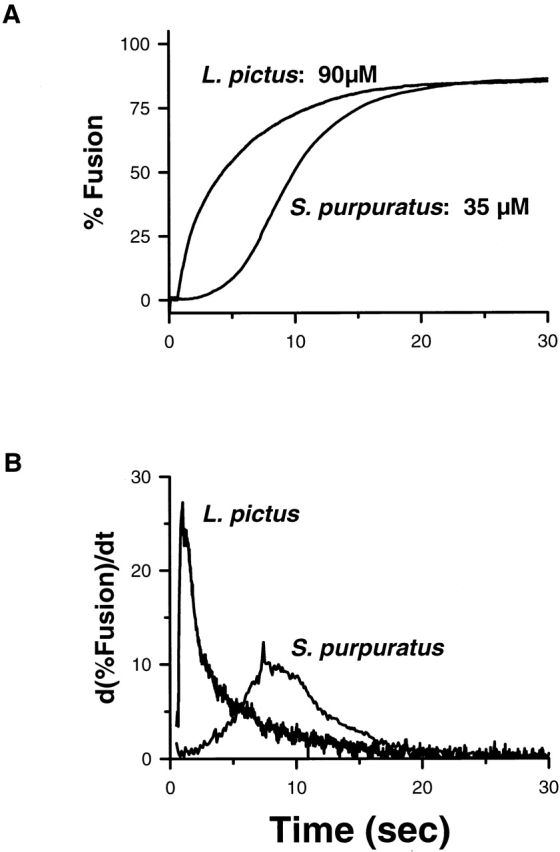
(A) Percent fusion vs. time, species differences. For comparable extents of fusion, L. pictus requires higher calcium concentration than S. purpuratus. The data were collected using a sample time of 0.02 (L. pictus) and 0.1 (S. purpuratus) s. (B) Rate, d(%fusion)/dt vs. time in the continued presence of calcium. The maximum rate of fusion is larger and occurs earlier in L. pictus compared with S. purpuratus. The data were low-pass filtered with a 1.0 Hz cutoff frequency before calculating the derivative using third order forward differences.
The submaximal fusion response is not limited by an irreversible loss in the ability of the remaining vesicles to fuse. For example, the continued presence of elevated calcium for 30 min had no effect on subsequent fusion (Fig. 3). In every preparation studied, the remaining population of vesicles fused after the addition of a high calcium concentration (>300 μM), independent of the time and sequence of solution challenges. Permanent inactivation of the remaining vesicles was never observed under the conditions described in this report. The calcium sensitivity of unfused vesicles surviving after submaximal stimulation is not altered by the continued presence of calcium. This rules out hypotheses relying on calcium-dependent irreversible transitions of the fusion apparatus to an inactive state.
Figure 3.

30-min exposure to elevated calcium with S. purpuratus. Submaximal responses were maintained during the exposure of cortices to solutions containing 5 or 16 μM. The upward arrows signify addition of calcium. The smaller arrow represents the addition of either 5 or 16 μM calcium while the larger arrow represents the calcium concentration (>300 μM) used to fuse all the remaining vesicles. The presence of elevated calcium for 30 min had no effect on subsequent fusion resulting from exposure to a higher concentration of calcium. The sample time was 0.3 s.
If the cessation of fusion was due to a reversible, calcium-dependent inactivation of the fusion machinery, then returning the preparation to a lower calcium concentration should reset the fusion process. Upon reset, a second exposure to the initial calcium concentration should result in fusion of the remaining vesicles to the same fractional extent as observed previously. This property was not observed. Once the stable, submaximal response was reached, enhanced fusion did not occur when cortices were challenged with a second application of the same calcium concentration after incubation in nominally zero calcium (<0.3 μM) from 0 to 30 min (Fig. 4). The calcium sensitivity of unfused vesicles surviving after submaximal stimulation is not altered by the absence of calcium. The fusion process cannot be reset and does not respond to the same calcium challenge elicited by two identical pulses separated in time by up to 30 min. The decrease in the instantaneous rate of fusion to zero in the continued presence of calcium, characteristic of a stable, submaximal extent of fusion, cannot be attributed to reversible, calcium-dependent inactivation of the fusion apparatus.
Figure 4.

Multiple calcium challenges. Enhanced fusion does not occur when cortices are challenged with a second application of 24 μM calcium, S. purpuratus. Cortices were washed and incubated in zero calcium for 0.5, 1.0, 3.0, 10.0, and 30 min (A–E) before the second calcium challenge. The upward and downward arrows signify addition and removal of calcium, respectively. The largest arrow represents the calcium concentration (>300 μM) used to fuse all remaining vesicles. The sample time was 0.15 s.
If the cessation of fusion occurs because a specific subpopulation of vesicles is removed through fusion (heterogeneity), then only perfusion with higher calcium concentrations will enhance fusion. In the absence of other processes, the amount of fusion will be additive and only depend upon the final concentration of calcium reached. Enhanced fusion was obtained, with or without an intervening chelator wash, only when the calcium concentration of the second challenge was raised. Large variations in vesicle exocytosis among the 20–40 cortices in the probed monolayer were not observed. Degranulation occurred in all cortices after a calcium challenge above threshold. The fusion rate observed after a second challenge of higher calcium concentration was variable relative to the fusion rate observed after a single challenge of the same final calcium concentration: rates after the second challenge were less than, equal to, or greater than those seen with single challenge experiments. Nevertheless, the extent of fusion was additive, with the overall extent dependent only on the calcium concentration of the final challenge (Fig. 5, and see Fig. 7 A).
Figure 5.

Additivity in the extent of fusion, S. purpuratus. The final extent of fusion is independent of the sequence of concentrations used to elicit the response. The upward and downward arrow signifies addition and removal of calcium. The calcium concentrations were 14, 24, and >300 μM (DP); 24 and >300 μM (SP). For clarity, only every 10th data point was plotted for SP. The sample time was 0.15 s.
Figure 7.

(A) Calcium activation curves for S. purpuratus and L. pictus, average values (± SEM). Unchallenged cortices are represented by solid symbols and previously challenged cortices are represented by open symbols. The solid lines are the log-normal cumulative distribution function, %fusion = 50 · erfc{[pCa + log (10−6 M)]/ , with W = 0.23 ± 0.02 and 0.24 ± 0.02 and midpoint M = 18.2 ± 0.6 and 44.8 ± 1.2 μM for S. purpuratus and L. pictus, respectively. (B) Distribution of calcium thresholds (probability density function) for S. purpuratus and L. pictus derived from the derivative of the log-normal cumulative distribution function. The total area under each curve is one, corresponding to 100% fusion.
In the isolated planar cortex, after a critical period during which removal of calcium is known to leave vesicles that are competent to fuse upon reapplication of the same calcium concentration (Zimmerberg et al., 1985), fusion to the stable, submaximal response is observed independent of the presence or absence of calcium. Small (<4%) differences in fusion were occasionally observed when the response to the first calcium challenge had not yet reached a plateau value at the time of the second calcium challenge (Fig. 6 A). The small changes in fusion that occur during this time could be mistakenly attributed to solution challenges in the absence of a continuous record of fusion. The absence of any abrupt change in fusion, with or without an intervening chelator wash, is consistent with the interpretation that the second challenge occurred during the time when previously activated vesicles, irreversibly committed to the fusion process, are fusing. In contrast, abrupt changes in fusion are observed only when calcium is removed before irreversible commitment to the fusion process (Fig. 6 B). The importance of acquiring a continuous fusion record cannot be overemphasized because changes in fusion observed during the calcium-independent period could be mistakenly attributed to additional interventions such as the removal or addition of a calcium challenge (see discussion).
Figure 6.

(A) Fusion can occur during solution exchange, before establishing the stable, submaximal response, which is independent of the presence or absence of calcium. The upward and downward arrows signify addition and removal of 24 μM calcium, S. purpuratus. The absence of abrupt changes in fusion (inset) indicates that the solution exchange occurred during a time when previously activated vesicles are now fusing. T1 and T2 label the times of solution exchange. The sample time was 0.15 s. (B) Abrupt changes in fusion are observed only when calcium is removed before irreversible commitment to the fusion process. The upward and downward arrows signify addition and removal (Interrupted) of 70 μM calcium, S. purpuratus. The sample times were 0.15 and 0.05 s for Uninterrupted and Interrupted, respectively.
The results from single and double challenges are summarized in the calcium activation curve (Fig. 7
A). The single and double challenge data were fit by a log-normal cumulative distribution function % fusion = 50 · erfc{[pCa + log (10−6 M)]/ , where erfc is the complementary error function. For S. purpuratus, W = 0.23 ± 0.03 and 0.24 ± 0.06, and midpoint M = 18.3 ± 0.7 and 17.9 ± 1.6 μM (n = 111 and 68), respectively. For L. pictus, W = 0.25 ± 0.03 and 0.25 ± 0.05, and midpoint M = 45.9 ± 1.5 and 44.2 ± 3.2 μM (n = 77 and 26), respectively. For either species, the parameters of the fit for single and double challenge calcium activation curves were not significantly different (P < 0.01). With no evidence for different calcium activation curves arising from the sequence of calcium challenges, the entire data sets for S. purpuratus and L. pictus were fit using a log-normal cumulative distribution function with W = 0.23 ± 0.02 and 0.24 ± 0.02, and midpoint M = 18.2 ± 0.6 and 44.8 ± 1.2 μM, respectively. The shift in calcium sensitivity between the two species, M, is significant (P < 0.05), while the width of the underlying distribution, W, is invariant. The absence of any difference between the calcium activation curves derived from single and double challenges suggests that the exocytotic response was dependent only on the final calcium concentration, and not the sequence of concentration steps used to reach the final concentration.
A log-normal probability density function was calculated from the log-normal cumulative distribution function (Fig. 7 B). The first derivative of the calcium activation curve can be viewed as the underlying probability density function for fusion thresholds. A log-normal representation was chosen because calcium thresholds are exclusively positive values. The calcium concentration required for the first fusion event can be estimated from the probability density function for fusion thresholds. Multiplying the probability density function by the total number of vesicles in a population approximates the frequency distribution of vesicle thresholds. An estimate of the calcium concentration required for the first fusion event occurs at a threshold frequency of one. For example, in a system of 20,000 vesicles, the first vesicle is estimated to fuse when the concentration of calcium exceeds ∼1 μM in S. purpuratus and 7 μM in L. pictus. This value is greater than the in vivo concentration of calcium in unfertilized eggs, regardless of species. The distribution of vesicle thresholds offers a rationale for explaining why vesicles fail to fuse in unfertilized eggs, where the calcium concentration is believed to be submicromolar (reviewed in Shen, 1995): the lowest threshold for fusion is higher than the calcium concentration present.
discussion
What are the limiting mechanism(s) that result in submaximal responses? We conclude that the calcium sensitivity of cortical degranulation is heterogeneous: vesicle exocytosis ceases at a certain calcium concentration because all the vesicles that can fuse at that concentration have fused. No evidence was found for calcium- dependent inactivation in cortical degranulation.
Submaximal Responses Are Not Due to Calcium-dependent Inactivation
Irreversible and reversible inactivation of the fusion process was ruled out within our experimental times. This result is different from findings in permeabilized bovine adrenal medullary cells, where subsequent catecholamine release was obtained in a double challenge protocol with the same calcium concentration in both challenges (Baker and Knight, 1981; Knight and Baker, 1982). While the calcium-dependent processes of chromaffin vesicle exocytosis may differ from those of cortical vesicle exocytosis, it is likely, based on their time course for catecholamine release, that calcium was withdrawn from, and then returned to, the permeabilized chromaffin cells before the stable, submaximal response had reached its plateau (e.g., Fig. 6 A, this work; Fig. 12 A, Baker and Knight, 1981). This plateau may have been difficult to identify in the absence of a continuous record of secretion, the presence of an endogenous (nonstimulated) secretion, long equilibration times, and interconversion between vesicle compartments.
Heterogeneity in Triggered Exocytosis Is Due to Multiple Populations with Differing Thresholds
The failure to identify a single limiting process in the decay of the instantaneous rate other than a decrease in the number of vesicles in a selected population, the size of which is set by the calcium concentration, is consistent with a system having the property of earlier heterogeneity in calcium thresholds. Alternatively, multiple limiting processes may act concurrently. Indeed, it is possible to invoke schemes having complicated rate, time, and concentration properties that can account for the behaviors that are observed. However, the existence of multiple subpopulations of vesicles with differing calcium thresholds is the simplest explanation for the behaviors observed in this system and represents our working hypothesis. That vesicles from the same cell type respond to calcium differently supports the hypothesis that vesicles that appear morphologically homogeneous can have different calcium thresholds (Ninomiya et al., 1997).
We have proposed that the number and distribution of activated fusion complexes underlie the control of the rate and extent of triggered exocytosis, and that cortical vesicles have nine active fusion complexes, on average, at high calcium concentrations (Vogel et al., 1996). Since fusion of a single vesicle is an all-or-none event that can be caused by one activated fusion complex, the probability density function for calcium thresholds can be regarded as the widest possible distribution of the lowest threshold values present on cortical vesicles. Since a vesicle may have multiple activated fusion complexes, the lowest threshold group represents a subpopulation of the total number of activable fusion complexes present in the system. The sampling of the transition region of the calcium activity curve is not sufficient to distinguish between a continuous or discrete probability density function for calcium thresholds. However, there are at least five, experimentally defined, subpopulations with different calcium thresholds.
That cortical vesicles are heterogeneous in their response to calcium raises questions on the molecular origin of this property. Fusion may proceed through chemically identical complexes whose calcium sensitivity is dependent, before the introduction of calcium, on the local environment. For example, after insertion into various membranes and lipid preparations, the affinity of purified muscarinic acetylcholine receptors for antagonists is modulated by the lipid environment (Berstein et al., 1989). The degree of association between the vesicle and target membrane, local ionic conditions (McLaughlin and Whitaker, 1988), and local lipid composition (Vogel et al., 1993; reviewed in Chernomordik et al., 1995) may influence the fusion process and manifest as differing sensitivities to calcium. Alternatively, fusion may proceed through distinct complexes, each having different calcium sensitivities. The heterogeneity in calcium sensitivity may arise from different proteins (e.g., a multigene family as in olfaction; reviewed in Chess et al., 1992), different protein isoforms (e.g., multiple synaptotagmins; reviewed in Littleton and Bellen, 1995), or different posttranslational modifications such as phosphorylation of calcium binding sites.
Sharp Transitions Require the Action of Many Calcium Ions
Efforts have been made to estimate the number of calcium ions involved in the fusion process based on models that relate the calcium concentration and fusion response. A fundamental assumption in these analyses is that fractional response is directly proportional to fractional calcium binding. The nonlinear relationship between calcium concentration and neurotransmitter release at the neuromuscular junction has been attributed to the cooperative action of four calcium ions in the release process (Dodge and Rahamimoff, 1967). Dodge and Rahamimoff (1967) recognized that their data were compatible with either a stochastic (random) model or with a stoichiometric reaction involving four calcium ions and four independent binding sites (a single site binding curve raised to the fourth power). The nonlinear relationship in the squid giant axon (Augustine and Charlton, 1986) was described by either a fourth order stoichiometric relationship or a Hill equation with cooperative interactions between four binding sites. Both Dodge and Rahamimoff (1967) and Augustine and Charlton (1986) relied on the linearity of nth root double-reciprocal plots to conclude that power functions of a single site binding curve described the data. In these studies, the number of calcium ions is represented by a parameter that describes the steepness of the transition from 0 to 100% activity. However, we have now demonstrated that the response to calcium is consistent with multiple subpopulations with differing thresholds. These subpopulations exhibit “receptor reserve” behavior (Vogel et al., 1996). This implies that the underlying subpopulations, each with a different threshold, must have even steeper individual transitions than the overall measured response because the width of the measured response includes contributions from both the distribution of thresholds and the intrinsic width of each subpopulation. For the first time, we can identify multiple stable subpopulations whose existence requires that their individual transitions be steeper than the measured response. A steeper individual transition is consistent with a fusion process that requires the action of an even greater number of calcium ions than the number suggested by homogeneous models. The calculated dependence on calcium in other calcium-triggered exocytotic systems may be in error if a distribution of thresholds (subpopulations) exist in these systems. Four concurrent, calcium-dependent molecular events may represent a lower limit. The involvement of many calcium ions may be a consequence of both protein and lipid binding processes. In fact, six individual transitions, each requiring the interaction of 10 calcium ions, results in an overall calcium activation curve that, when analyzed using homogeneous models, would suggest the interaction of three to four calcium ions. The assumption that fractional response is directly proportional to fractional calcium binding must be tested.
Although shifted, the invariance in the shape of the calcium activation curves for S. purpuratus and L. pictus implies that the cortical vesicle subpopulations in both species respond to the same increment in calcium, ΔpCa. Similarities in the calcium activation curves for secretion from endocrine, exocrine, neuronal, and paracrine cells (Knight and Scrutton, 1986) support the hypothesis that subpopulations of exocytotic vesicles exist in every calcium-triggered exocytotic system and that all subpopulations respond to approximately the same increment in calcium, ΔpCa. That equivalent subpopulations of vesicles enter the fusion process for comparable changes in calcium, ΔpCa, suggests that the molecular machinery involved in the overall fusion process performs the same work in overcoming a common fusion energy barrier, ΔEfusion, but that the initial and final energy levels differ between systems. These energy differences may be reflected in the calcium-binding properties of the calcium sensor and/or fusogenic apparatus and the lipid organization of the membranes. The two species, S. purpuratus and L. pictus, are found in the same environment but undergo the cortical reaction during the winter and summer, respectively. Could the shift in the calcium activity curve towards higher calcium concentrations for L. pictus be a compensatory mechanism that prevents thermally driven fusion events, which may arise as a result of increased ambient temperature, from occurring?
In summary, we have determined that the calcium sensitivity of individual vesicles within a population of exocytotic vesicles is heterogeneous. The cessation of fusion in the continued presence of calcium was not due to calcium-dependent inactivation. The molecular origin of the observed distribution of thresholds remains to be answered. The dependence of the extent of exocytosis on calcium suggests that many calcium-dependent events are required for the fusion process. Thus, calcium activation curves may arise from both an underlying distribution of calcium thresholds and multiple calcium-dependent events.
Acknowledgments
We thank Itzhak Steinberg, who initially directed our attention to the importance of the double challenge protocol, and Peter Bungay and Jim Sullivan for help with the design and fabrication of the flow system.
Footnotes
Portions of this work have been previously published in abstract form (Kaplan, D., P.S. Blank, M.S. Cho, I. Steinberg, and J. Zimmerberg. 1994. Biophys. J. 66:284a. Blank, P.S., M.S. Cho, S.S. Vogel, D. Kaplan, D. Bhuva, A. Kang, J. Malley, and J. Zimmerberg. 1997. J. Gen. Physiol. 110:17a).
Dr. Kaplan's present address is Israel Institute for Biological Research, Ness-Ziona Israel 70400. Dr. Vogel's present address is Medical College of Georgia, Augusta, GA 30912-2630.
references
- Augustine GJ, Charlton MP. Calcium dependence of presynaptic calcium current and post-synaptic response at the squid giant synapse. J Physiol (Camb) 1986;381:619–640. doi: 10.1113/jphysiol.1986.sp016347. [DOI] [PMC free article] [PubMed] [Google Scholar]
- Baker PF, Knight DE. Calcium control of exocytosis and endocytosis in bovine adrenal medullary cells. Philos Trans R Soc Lond B Biol Sci. 1981;296:83–103. doi: 10.1098/rstb.1981.0174. [DOI] [PubMed] [Google Scholar]
- Baker PF, Whitaker MJ. Influence of ATP and calcium on the cortical reaction in sea urchin eggs. Nature. 1978;276:513–515. doi: 10.1038/276513a0. [DOI] [PubMed] [Google Scholar]
- Berstein G, Haga T, Ichiyama A. Effect of lipid environment on the differential affinity of purified cerebral and atrial muscarinic acetylcholine receptors for pirenzepine. Mol Pharmacol. 1989;36:601–607. [PubMed] [Google Scholar]
- Chernomordik L, Kozlov MM, Zimmerberg J. Lipids in biological membrane fusion. J Membr Biol. 1995;146:1–14. doi: 10.1007/BF00232676. [DOI] [PubMed] [Google Scholar]
- Chess A, Buck L, Dowling MM, Axel R, Ngai J. Molecular biology of smell: expression of the multigene family encoding putative odorant receptors. Cold Spring Harbor Symp Quant Biol. 1992;57:505–516. doi: 10.1101/sqb.1992.057.01.056. [DOI] [PubMed] [Google Scholar]
- Dodge FA, Rahamimoff R. Co-operative action of calcium ions in transmitter release at the neuromuscular junction. J Physiol (Camb) 1967;193:419–432. doi: 10.1113/jphysiol.1967.sp008367. [DOI] [PMC free article] [PubMed] [Google Scholar]
- Heinemann C, von Ruden L, Chow RH, Neher E. A two-step model of secretion control in neuroendocrine cells. Pflügers Arch. 1993;424:105–112. doi: 10.1007/BF00374600. [DOI] [PubMed] [Google Scholar]
- Heinemann C, Chow RH, Neher E, Zucker RS. Kinetics of the secretory response in bovine chromaffin cells following flash photolysis of caged Ca2+ . Biophys J. 1994;67:2546–2557. doi: 10.1016/S0006-3495(94)80744-1. [DOI] [PMC free article] [PubMed] [Google Scholar]
- Jackson RC, Crabb JH. Cortical exocytosis in the sea urchin egg. Curr Top Membr Transp. 1988;32:45–85. [Google Scholar]
- Kaplan D, Bungay P, Sullivan J, Zimmerberg J. A rapid-flow perfusion chamber for high-resolution microscopy. J Microsc. 1996;181:286–297. doi: 10.1046/j.1365-2818.1996.103383.x. [DOI] [PubMed] [Google Scholar]
- Kaplan D, Zimmerberg J, Puri A, Sarkar D, Blumenthal R. Single cell fusion events induced by influenza hemagglutinin: studies with rapid-flow, quantitative fluorescence microscopy. Exp Cell Res. 1991;195:137–144. doi: 10.1016/0014-4827(91)90509-s. [DOI] [PubMed] [Google Scholar]
- Knight DE, Scrutton MC. Gaining access to the cytosol: the technique and some applications of electropermeabilization. Biochem J. 1986;234:497–506. doi: 10.1042/bj2340497. [DOI] [PMC free article] [PubMed] [Google Scholar]
- Knight DE, Baker PF. Calcium-dependence of catecholamine release from bovine adrenal medullary cells after exposure to intense electric fields. J Membr Biol. 1982;68:107–140. doi: 10.1007/BF01872259. [DOI] [PubMed] [Google Scholar]
- Knight DE, Baker PF. Exocytosis from the vesicle viewpoint: an overview. Ann NY Acad Sci. 1987;493:504–523. doi: 10.1111/j.1749-6632.1987.tb27237.x. [DOI] [PubMed] [Google Scholar]
- Littleton JT, Bellen HJ. Synaptotagmin controls and modulates synaptic vesicle fusion in a Ca2+-dependent manner. TINS (Trends Neurosci) 1995;18:177–183. doi: 10.1016/0166-2236(95)93898-8. [DOI] [PubMed] [Google Scholar]
- Llinas R, Steinberg IZ, Walton K. Presynaptic calcium currents and their relationship to synaptic transmission: voltage clamp study in squid giant synapse and theoretical model for the calcium gate. Proc Natl Acad Sci USA. 1976;73:2918–2922. doi: 10.1073/pnas.73.8.2918. [DOI] [PMC free article] [PubMed] [Google Scholar]
- Llinas R, Steinberg IZ, Walton K. Relationship between presynaptic calcium current and postsynaptic potential in squid giant synapse. Biophys J. 1981;33:323–352. doi: 10.1016/S0006-3495(81)84899-0. [DOI] [PMC free article] [PubMed] [Google Scholar]
- McLaughlin S, Whitaker M. Cations that alter surface potentials of lipid bilayers increase the calcium requirement for exocytosis in sea urchin eggs. J Physiol (Camb) 1988;396:189–204. doi: 10.1113/jphysiol.1988.sp016958. [DOI] [PMC free article] [PubMed] [Google Scholar]
- Moy GW, Kopf GS, Gache C, Vacquier VD. Calcium-mediated release of glucanase activity from cortical granules of sea urchin eggs. Dev Biol. 1983;100:267–274. doi: 10.1016/0012-1606(83)90221-x. [DOI] [PubMed] [Google Scholar]
- Ninomiya Y, Kishimoto T, Yamazawa T, Ikeda H, Miyashita Y, Kasai H. Kinetic diversity in the fusion of exocytotic vesicles. EMBO (Eur Mol Biol Organ) 1997;16:929–934. doi: 10.1093/emboj/16.5.929. [DOI] [PMC free article] [PubMed] [Google Scholar]
- Sarafian T, Aunis D, Bader M. Loss of proteins from digitonin-permeabilized adrenal chromaffin cells essential for exocytosis. J Biol Chem. 1987;34:16671–16676. [PubMed] [Google Scholar]
- Sasaki H, Epel D. Cortical vesicle exocytosis in isolated cortices of sea urchin eggs: description of a turbidimetric assay and its utilization in studying effects of different media on discharge. Dev Biol. 1983;98:327–337. doi: 10.1016/0012-1606(83)90363-9. [DOI] [PubMed] [Google Scholar]
- Shen, S.S. 1995. Mechanisms of calcium regulation in sea urchin eggs and their activities during fertilization. In Current Topics in Developmental Biology. Vol. 30. R.A. Pedersen and G.P. Schatten, editors. Academic Press, Inc., New York. 63–101. [DOI] [PubMed]
- Simon SM, Llinas RR. Compartmentalization of the submembrane calcium activity during calcium influx and its significance in transmitter release. Biophys J. 1985;48:485–498. doi: 10.1016/S0006-3495(85)83804-2. [DOI] [PMC free article] [PubMed] [Google Scholar]
- Tsien RY, Rink TJ. Neutral carrier ion-selective microelectrodes for measurement of intracellular free calcium. Biochim Biophys Acta. 1980;599:623–638. doi: 10.1016/0005-2736(80)90205-9. [DOI] [PubMed] [Google Scholar]
- Vacquier V. The isolation of intact cortical granules from sea urchin eggs: calcium ions trigger granule discharge. Dev Biol. 1975;43:62–74. doi: 10.1016/0012-1606(75)90131-1. [DOI] [PubMed] [Google Scholar]
- Vogel SS, Delaney K, Zimmerberg J. The sea urchin cortical reaction. A model system for studying the final steps of calcium-triggered vesicle fusion. Ann NY Acad Sci. 1991;635:35–44. doi: 10.1111/j.1749-6632.1991.tb36479.x. [DOI] [PubMed] [Google Scholar]
- Vogel SS, Leikina EA, Chernomordik LV. Lysophosphatidylcholine reversibly arrests exocytosis and viral fusion at a stage between triggering and membrane merger. J Biol Chem. 1993;268:25764–25768. [PubMed] [Google Scholar]
- Vogel SS, Blank PS, Zimmerberg J. Poisson-distributed active fusion complexes underlie the control of the rate and extent of exocytosis by calcium. J Cell Biol. 1996;134:329–338. doi: 10.1083/jcb.134.2.329. [DOI] [PMC free article] [PubMed] [Google Scholar]
- Zimmerberg J, Sardet C, Epel D. Exocytosis of sea urchin egg cortical vesicles in vitro is retarded by hyperosmotic sucrose: kinetics of fusion monitored by quantitative light-scattering microscopy. J Cell Biol. 1985;101:2398–2410. doi: 10.1083/jcb.101.6.2398. [DOI] [PMC free article] [PubMed] [Google Scholar]
- Zimmerberg, J., J. Sullivan, and P.M. Bungay. 1992. Rapid exchange imaging chamber for stop-flow microscopy. US Patent 5,170,286.
- Zimmerberg J, Vogel SS, Chernomordik LV. Mechanisms of membrane fusion. Annu Rev Biophys Biomol Struct. 1993;224:33–66. doi: 10.1146/annurev.bb.22.060193.002245. [DOI] [PubMed] [Google Scholar]
- Zucker RS, Fogelson AL. Relationship between transmitter release and presynaptic calcium influx when calcium enters through discrete channels. Proc Natl Acad Sci USA. 1986;83:3032–3036. doi: 10.1073/pnas.83.9.3032. [DOI] [PMC free article] [PubMed] [Google Scholar]