Abstract
Extracellular Zn2+ was found to reversibly inhibit the ClC-0 Cl− channel. The apparent on and off rates of the inhibition were highly temperature sensitive, suggesting an effect of Zn2+ on the slow gating (or inactivation) of ClC-0. In the absence of Zn2+, the rate of the slow-gating relaxation increased with temperature, with a Q10 of ∼37. Extracellular Zn2+ facilitated the slow-gating process at all temperatures, but the Q10 did not change. Further analysis of the rate constants of the slow-gating process indicates that the effect of Zn2+ is mostly on the forward rate (the rate of inactivation) rather than the backward rate (the rate of recovery from inactivation) of the slow gating. When ClC-0 is bound with Zn2+, the equilibrium constant of the slow-gating process is increased by ∼30-fold, reflecting a 30-fold higher Zn2+ affinity in the inactivated channel than in the open-state channel. As examined through a wide range of membrane potentials, Zn2+ inhibits the opening of the slow gate with equal potency at all voltages, suggesting that a two-state model is inadequate to describe the slow-gating transition. Following a model originally proposed by Pusch and co-workers (Pusch, M., U. Ludewig, and T.J. Jentsch. 1997. J. Gen. Physiol. 109:105–116), the effect of Zn2+ on the activation curve of the slow gate can be well described by adding two constraints: (a) the dissociation constant for Zn2+ binding to the open channel is 30 μM, and (b) the difference in entropy between the open state and the transition state of the slow-gating process is increased by 27 J/ mol/°K for the Zn2+-bound channel. These results together indicate that extracellular Zn2+ inhibits ClC-0 by facilitating the slow-gating process.
Keywords: ClC-0, Zn2+, slow gating, inactivation, temperature dependence
introduction
ClC-0, the first cloned member of the ClC channel family, is a voltage-dependent chloride channel that is present abundantly in the Torpedo electric organ. The open–close transition of this channel is known to involve two different gating processes, both of which are voltage dependent (for review, see Miller and Richard, 1990; Pusch and Jentsch, 1994). In one, the channel opens, or activates, when membrane potential is depolarized, and closes, or deactivates, when membrane potential is hyperpolarized. This transition happens in a relatively fast time scale of milliseconds and is thought to be controlled by a “fast” gate (Miller, 1982; Hanke and Miller, 1983; Pusch et al., 1995; Chen and Miller, 1996). The other gating process, which resembles inactivation of other voltage-gated channels, operates in a time scale of tens of seconds. This “slow” gate opens when membrane potential hyperpolarizes and closes when membrane potential depolarizes (White and Miller, 1979; Pusch et al., 1997). Previous studies have suggested that there are two identical “protomers” in a channel, each of which probably contains a pore and an independent fast gate (Miller, 1982; Middleton et al., 1994, 1996; Ludewig et al., 1996). On the other hand, the inactivation (or the close–open transition of the slow gate) occurs at the same time for the two protochannels (Miller and White, 1984; Richard and Miller, 1990; Pusch et al., 1997).
The above two gating processes function in an interesting way in that they both show Cl− as well as voltage dependence. The fast gate decreases its open probability upon reducing the extracellular Cl− concentration (Pusch et al., 1995), suggesting that the permeant ion, Cl−, may act as the gating charge for the channel opening (Pusch et al., 1995; Chen and Miller, 1996). The interaction of Cl− with the slow gating is even more intriguing. It was found that Cl− flux through the channel pore was coupled to a nonequilibrium gating among closed, open, and inactivated states of the channel (Richard and Miller, 1990). The underlying mechanism of this phenomenon is still unknown. The slow gating of ClC-0 is difficult to characterize in a quantitative manner at the single channel level because the gate operates at a very slow rate. Recently, by measuring macroscopic current relaxation from Xenopus oocytes expressing ClC-0, Pusch et al. (1997) discovered that the inactivation rate of ClC-0 was highly temperature dependent with a Q10 of ∼40.
The high temperature dependence of the slow gating of ClC-0 suggests that the process may involve a very complex conformational change of the channel molecule (Pusch et al., 1997). The mechanism underlying this complex slow-gating transition, however, is not well understood. There have been so far only a few point mutants of the channel whose slow-gating processes are altered (Ludewig et al., 1996, 1997). The amino acid residues that have been identified, however, are scattered throughout the entire channel sequence, making a mechanistic interpretation of the mutation effect rather difficult. Another problem that hinders a better understanding of ClC-0 inactivation comes from the fact that there are few useful molecular probes that can interfere with this gating transition. Previously, Cd2+, Ni2+, and Zn2+ have been shown to interact with the permeation and the gating processes in a variety of ion channels (Backx et al., 1992; Karpen et al., 1993; Yellen et al., 1994; Gordon and Zagotta, 1995; Liu et al., 1997). Results from studying the interaction of these divalent cations with channel proteins provide insightful information to understand not only the functional but also the structural aspects of these channel molecules. The interesting issue here is whether these useful metal ions are able to interact with ClC-0.
The modulation of ClC-type Cl− channels by divalent metal ions is not without precedence. Early investigations have revealed that Zn2+ inhibits the resting conductance of the frog skeletal muscle (Hutter and Warner, 1967; Stanfield, 1970; Bretag et al., 1984), the majority of which is contributed by a Cl− conductance, most likely ClC-1. Recently, human and rat ClC-1 channels were expressed in Xenopus oocyte, mammalian, and insect cell lines, and the channels were found to be irreversibly blocked by Zn2+ and Cd2+ (Kürz et al., 1997; Rychkov et al., 1997). The underlying mechanisms for these inhibitions, however, were not understood. ClC-0 is similar to ClC-1 not only in the amino acid sequence, but also in gating properties (Jentsch et al., 1990; Steinmeyer et al., 1991). In the present study, I show that Zn2+ can also inhibit the ClC-0 channel. Unlike in the case of ClC-1, the inhibition of ClC-0 by Zn2+ is reversible. Detailed characterization of this inhibition indicates that the effect appears to be due to a facilitation of the slow gating. This observation thus provides an opportunity of using Zn2+ to explore the molecular mechanism of the slow-gating process of ClC-0.
materials and methods
Molecular Biology and Channel Expression
All experiments were carried out in Xenopus oocytes expressing wild-type ClC-0 originally cloned from Torpedo electric organ (Jentsch et al., 1990). The modified version of the cDNA, pRM105, in which most of the 3′ and 5′ untranslated regions were deleted, was first linearized by restriction enzyme ScaI (New England Biolabs Inc., Beverly, MA). Capped cRNA was then transcribed in vitro using the T3 mMessage mMachine kit (Ambion Inc., Austin, TX). Xenopus oocytes were surgically removed and dissociated for 1 h in nominally calcium-free OR-2 solution (containing [mM]: 96 NaCl, 2 KCl, 2 MgCl2, and 5 Na-HEPES, pH 7.6) containing 1 mg/ml of type II collagenase (GIBCO BRL, Gaithersburg, MD). Follicle-free stage V–VI oocytes were selected and injected with 50 nl synthetic mRNA in distilled water (0.01– 0.2 mg/ml). Injected oocytes were maintained at 18°C (±3°C) in ND96 solution (containing [mM]: 96 NaCl, 2 KCl, 1.8 CaCl2, 1 MgCl2, and 5 Na-HEPES, pH 7.6, plus 0.2 mg/ml gentamicin) and, with daily change of the ND-96 maintaining solution, were usually able to survive for 7–10 d.
Electrical Recording and Data Analysis
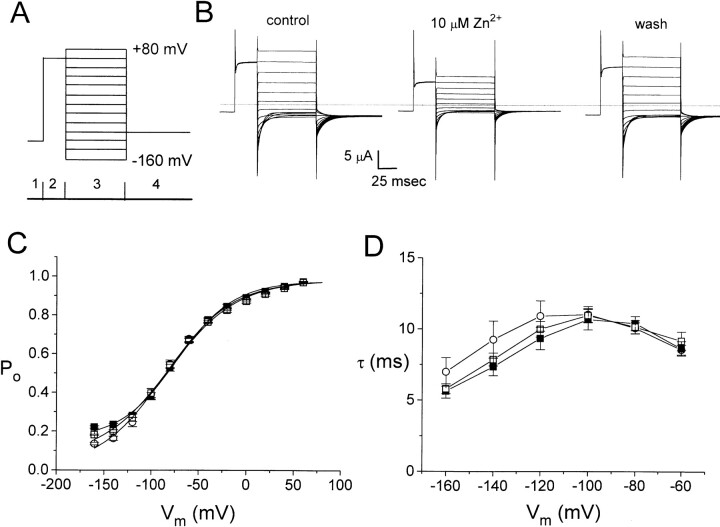
Whole oocyte ClC-0 current was recorded with a two-electrode voltage clamp amplifier (725C; Warner Instruments, Hamden, CT) 1–4 d after mRNA injection. Microelectrodes were filled with 3 M KCl and had resistance of 0.2–1.0 MΩ. The current, filtered at 1 kHz by the built-in filter of the amplifier, was digitized at 2–5 kHz using Digidata 1200 data acquisition board and pClamp6 software (Axon Instruments, Foster City, CA). Expression of ClC-0 was checked with a voltage protocol similar to that shown in Fig. 2 A. This protocol elicited a characteristic current crossover in the voltage range from −150 to −80 mV in the injected oocytes (see Fig. 2 B), indicating a successful expression of ClC-0.
Figure 2.
Extracellular Zn2+ has little effect on the fast gate of ClC-0. (A) Voltage protocol used to evaluate the fast gate of ClC-0. To focus on the fast gate, multiple short negative voltage pulses were applied to open the slow gate before the experiment. A −120-mV voltage step was first given to further ensure maximal activation of the slow gate (only partially shown in 1). The fast gate was then examined with a voltage pulse to +60 mV (2), followed by different test voltages from −160 to +80 mV in 20-mV steps (3). The tail currents were measured at −100 mV (4). (B) Families of currents in control (left), 10 μM Zn2+ (middle) and after Zn2+ washout (right). Dotted line shows level of zero current. (C) Steady state P o–V curves of the fast gate. ○, ▪, and □ are control, in 10 μM Zn2+, and wash, respectively (n = 4). Solid curves were drawn according to a simple voltage equilibrium: P o = P min + (P max − P min)/[1 + exp(−zF(V − Vo)/RT)], with z = 0.7–0.83, P max = 0.98–0.99, P min = 0.01–0.16, and Vo = −73 to −85 mV. The differences among the three P o-V curves were observed only at voltages more negative than −120 mV where the leak current contributed a relatively big fraction to the observed current. (D) Time constants of deactivation phase in period 3 plotted against membrane voltages. Symbols are as those in C.
For a typical experiment, the recording room was set at the desired temperature. Oocytes were then brought out of the incubating chamber to equilibrate the temperature of incubating solution to the room temperature at least 30 min before recording. The bathing (external) solution for assaying the effect of Zn2+ was a low Ca2+–ND96 solution containing (mM): 96 NaCl, 2 KCl, 0.3 CaCl2, 1 MgCl2, and 5 Na-HEPES, pH 7.6. ZnCl2 (J.T. Baker, Inc., Phillipsburg, NJ) and chloride salts of other transition metals were dissolved in water as 100 mM stock solution and then added to the low Ca2+–ND96 solution to obtain the indicated concentration.
To examine the kinetics of the slow-gating process, the slow gate was first opened with multiple short hyperpolarized pulses (−120 to −150 mV, 50–200 ms in duration) given at a frequency of 0.5–1 Hz. The membrane potential was then held at −30 mV, a value close to the equilibrium potential of Cl−, and a 100-ms voltage pulse to +40 mV was given every 2–6 s to monitor the current relaxation. The frequency of the given +40-mV voltage pulses had no effect on the slow-gating relaxation rate.
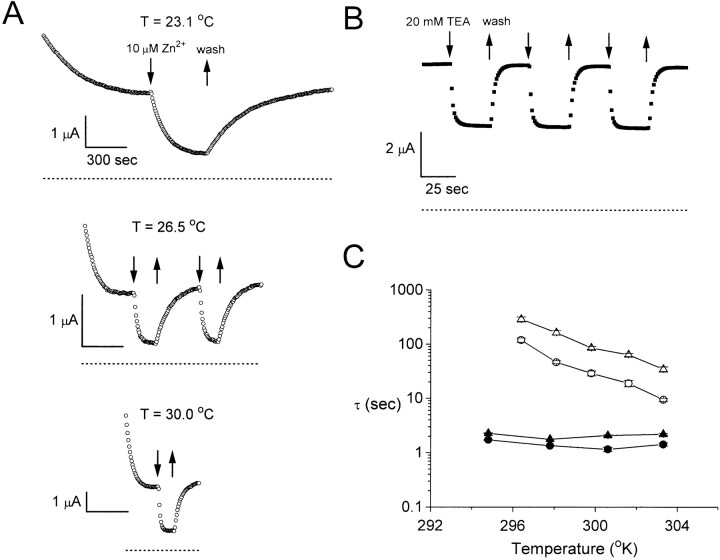
To evaluate the effects of Zn2+ and other metal ions, the oocyte current was monitored with repetitive voltage pulses at a constant holding potential, usually −30 mV. The metal ions were applied only after the current reached a steady state. EGTA– ND96 solution was used as the control and wash solutions. Its composition was the same as that of the low Ca2+–ND96 solution, except that an additional 1 mM CaCl2 and 1 mM EGTA was added, with the pH adjusted to 7.6 after addition of the extra components. Since EGTA has a higher affinity for Zn2+ than for Ca2+, the wash solution chelates any leftover Zn2+ (Yellen et al., 1994). The switch between EGTA–ND96 solution and low Ca2+– ND96 solution causes little change in the current amplitude. For more precise measurements of the on and off rates of Zn2+ inhibition (see Fig. 3 A), the flow rate was at ∼25 ml/min, whereas the volume of the recording chamber was ∼1 ml. The time constant of the solution exchange was ∼2 s, as judged from the time course of tetraethylammonium (TEA)1 inhibition of a Shaker K+ channel (see Fig. 3 B). It therefore took ∼5–6 s to exchange the solution of the recording chamber to 99%. This delay was relatively small in comparison with the time constants of the slow gating of ClC-0 in most experiments. As the slow gating of ClC-0 and the Zn2+ inhibition were highly temperature dependent, all solutions used for recording were incubated at the desired temperature before use. The temperature of the perfusion solution was monitored by a small temperature-sensitive element (Warner Instruments). Typically, its variation was less than ±0.3°C throughout an experiment.
Figure 3.
Kinetics of Zn2+ inhibition and recovery are temperature sensitive. (A) Inhibition of ClC-0 by 10 μM Zn2+ at three different temperatures. (B) Inhibition of Shaker K+ channels by 20 mM TEA. The membrane potential was held at −80 mV and a 30-ms voltage pulse to +30 mV was given every second. Dotted lines in A and B represent zero-current level. (C) Comparison of the time constants of Zn2+ inhibition of ClC-0 (○ and ▵) with those of TEA inhibition of the Shaker K+ channel (• and ▴). Circles, time constants of current inhibition; triangles, time constants of current recovery (n = 4–5).
The ClC-0 current amplitude was usually measured near the end of the +40-mV voltage pulse when the opening of the fast gate is at steady state. Because the channel does not close completely even at very negative membrane potential (Chen and Miller, 1996; Ludewig et al., 1997), the nonspecific “leak” current was not subtracted in all experiments. The leak fraction, however, was estimated separately with two approaches. In one set of experiments, oocytes without mRNA injection were recorded in low Ca2+–ND96 solution. Alternatively, oocytes expressing ClC-0 were recorded in 0 Cl− solution (containing [mM]: 98 Na-Glutamate, 1.3 MgSO4, and 5 Na-HEPES, pH 7.6), a condition in which the inward Cl− flux is abolished. The measurements in both cases gave leak currents at +40 mV of ∼0.1–0.2 μA, which were usually <2–3% of the maximal current in a typical oocyte used in this study. Little current difference between these two ways of leak measurements was discerned, indicating that the endogenous Cl− current of the oocytes did not contribute much to the observed current.
Data analysis was conducted with software programs in pClamp6 (Axon Instruments) and Origin 4.0 (Microcal Software, Inc., Northampton, MA). Curve fittings were performed with an un-weighted least-squares method. Results are presented as mean ± SEM.
results
Sensitivity of ClC-0 to Various Divalent Metal Ions
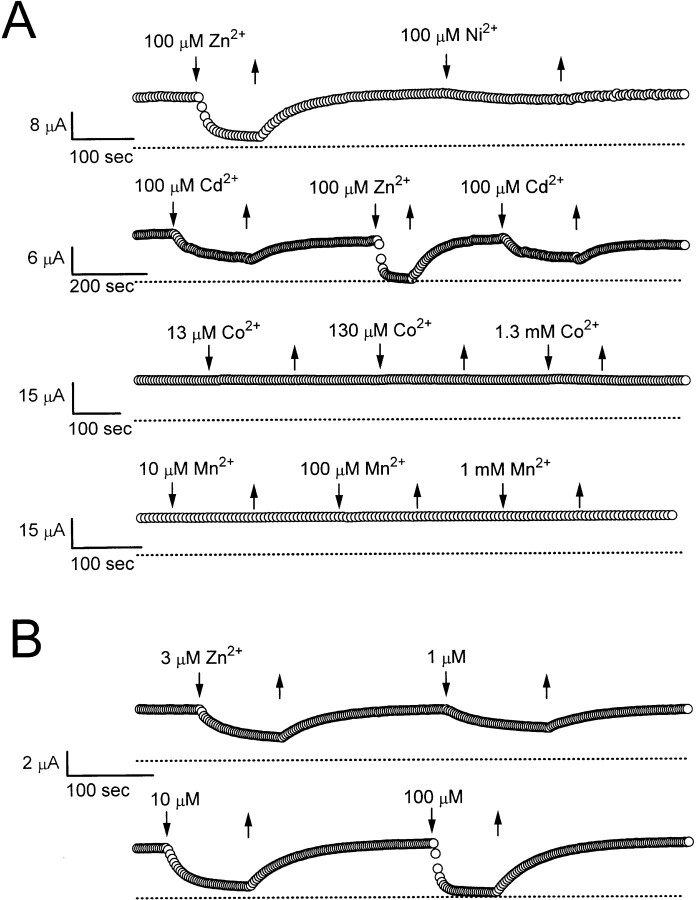
Fig. 1 A shows the effects of several divalent metal ions on the steady state current of the oocyte. These metal ions have different potencies to inhibit the current. The comparison among various ions can usually be carried out on the same oocyte since the inhibition is reversible after the ion is washed out. In these experiments, Zn2+ had the strongest effect to inhibit ClC-0 with an apparent IC50 of ∼1–3 μM (Fig. 1 B). Cd2+ and Ni2+ can also inhibit the current, but with a weaker effect. On the other hand, Co2+ and Mn2+ had almost no effect at concentrations up to 1–1.3 mM.
Figure 1.
(A) Effects of various divalent metal ions on the steady state current of the ClC-0 Cl− channel. The membrane potential of the oocyte was clamped at −30 or −40 mV. Each circle represents the current amplitude monitored by a 100-ms voltage pulse to +30 or +40 mV given every 5 or 6 s. Dotted lines show zero-current level. Solutions containing desired concentrations of various heavy metal ions were perfused in (downward arrows) and out (upward arrows), as indicated. (B) Concentration-dependent inhibition of the steady state current by Zn2+. Holding potential was at −30 mV. Continuous recording at 27.4°C for more than 50 min.
Extracellular Zn2+ Has Little Effect on the Fast Gating of ClC-0
Although Zn2+ can reduce the steady state current of ClC-0 with relatively high affinity, its effect on the fast gate of the channel is only minimal. Fig. 2 A shows the voltage protocol similar to that used by Pusch et al. (1995) to examine the fast gating of ClC-0. The current families elicited by this voltage protocol in the absence or presence of Zn2+ were shown in Fig. 2 B. Application of 10 μM Zn2+ inhibits the current by about half at all voltages (Fig. 2 B, left and middle), indicating a voltage-independent inhibition. The current recovers completely after Zn2+ washout (Fig. 2 B, right).
The effect of Zn2+ on the fast gate of ClC-0 was evaluated in two ways: the steady state open probability (P o) and the kinetics of the fast gate. To determine the P o of the fast gate from Fig. 2 B, the tail current was extrapolated to the onset of period 4. Normalization of these extrapolated values to the maximal value (usually the one following the +80-mV test pulse) yielded the relative P o's at the corresponding membrane potentials in period 3 (Pusch et al., 1995). Fig. 2 C shows that the steady state P o–V curves in the presence and absence of Zn2+ are identical, indicating that Zn2+ has little effect on the fast gate. The effect of Zn2+ on the kinetics of the fast gate was evaluated by examining the fast-gating relaxation. The current deactivation in period 3 was fitted to a single-exponential function (Pusch et al., 1997; Ludewig et al., 1997) and the time constants at various voltages were plotted in Fig. 2 D. The effect of Zn2+ on these deactivation time constants is also minimal. The time constants in the presence and absence of Zn2+, again, overlap with each other, particularly in the voltage range from −100 to −60 mV. In contrast, the reduction of the current by Zn2+ is observed at all membrane potentials (Fig. 2 B). Thus, the potent inhibition by Zn2+ shown in Fig. 1 is not likely due to an effect on the fast gating of the channel.
Apparent On and Off Rates of Zn2+ Inhibition Are Temperature Dependent
To further explore the mechanism of the Zn2+ effect, the kinetics of the inhibition was studied at a holding potential of −30 mV. As shown in Fig. 3 A, the amplitude of the whole oocyte current spontaneously decreases due to the closing of the slow gate, with the time to reach a steady state depending on the temperature. After the relaxation was close to a steady state, 10 μM Zn2+ was perfused in and out of the bath solution. The apparent on and off rates of Zn2+ inhibition were surprisingly slow. In addition, both rates were highly temperature dependent. To rule out the possibility that the slow kinetics and the temperature dependence of the Zn2+ effect were due to slow solution exchange, this exchange rate was measured using TEA to inhibit a Shaker K+ channel with the inactivation ball removed (Fig. 3 B). Since TEA is known to block the Shaker K+ channel with on and off rates in the micro- to millisecond time range (Hille, 1992), the time constants (∼1–3 s) measured from the TEA inhibition mostly reflect the delay of the solution exchange. Fig. 3 C compares the time constants of the Zn2+ inhibition of ClC-0 with those of the TEA inhibition of the Shaker K+ channel. The apparent on and off rates of the Zn2+ inhibition of ClC-0 are clearly temperature dependent, whereas the solution exchange rate is not. Furthermore, the kinetics of the Zn2+ inhibition is much slower than that of the TEA inhibition. Except for high temperature conditions that gave relatively fast inhibitory kinetics, the rate of the solution exchange was usually 10-fold faster than that of the Zn2+ inhibition, indicating that the slow kinetics of the Zn2+ inhibition on ClC-0 do not arise from the solution exchange.
Extracellular Zn2+ Facilitates the Inactivation Relaxation
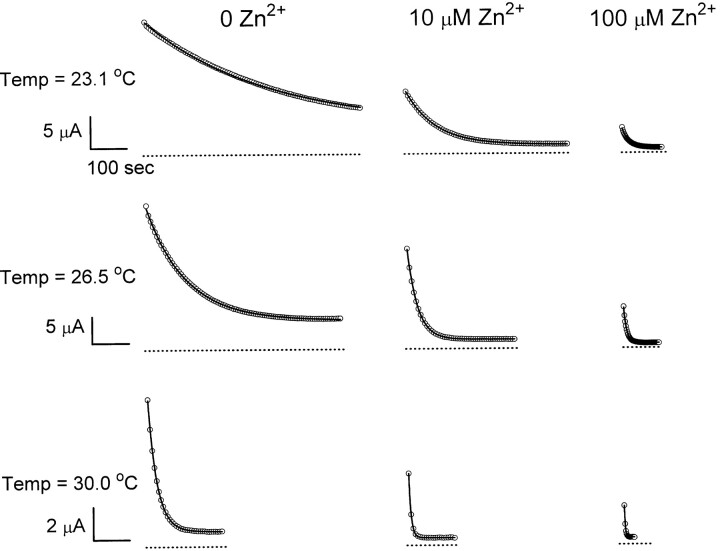
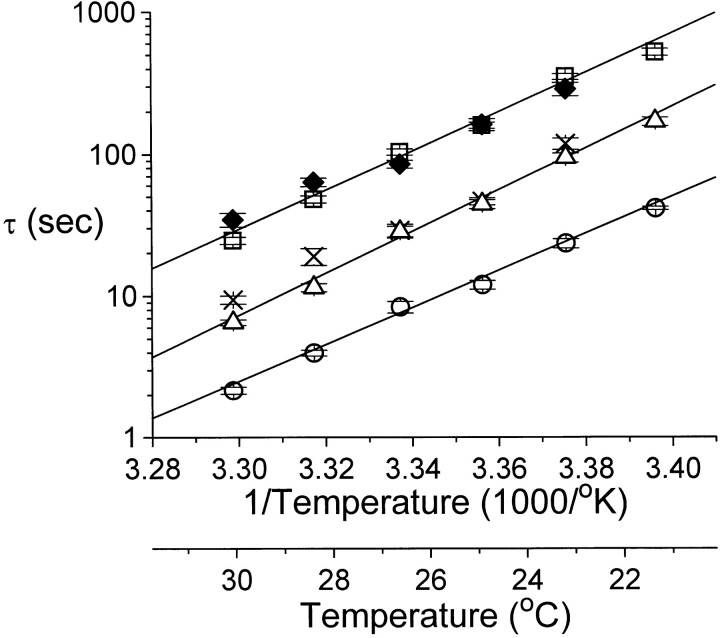
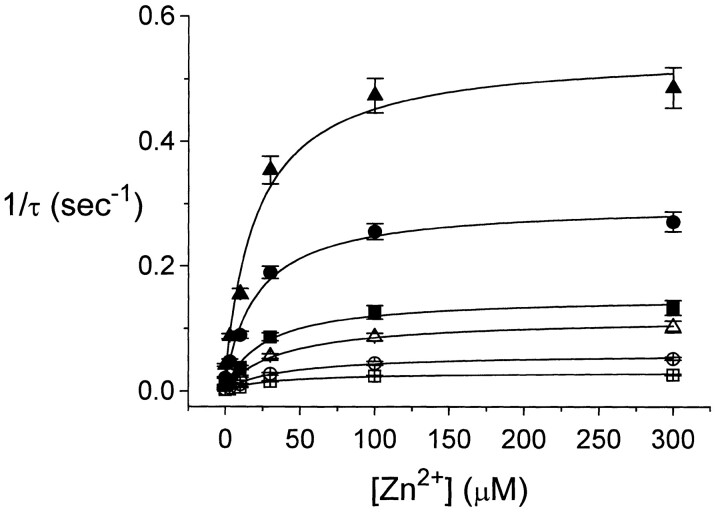
The strong temperature dependence of the inhibition kinetics suggests that a complicated process may be involved in Zn2+-induced inhibition. With the inhibition showing such slow kinetics and high temperature dependence, it seems unlikely that Zn2+ acts as an open channel blocker to reduce the single-channel conductance of ClC-0. On the other hand, Zn2+ is more likely to alter the slow gating of ClC-0, which intrinsically has a high Q10 (Pusch et al., 1997). To examine this possibility, the slow-gating relaxation of ClC-0 was studied at various temperatures with or without extracellular Zn2+ (Fig. 4). Consistent with a previous study (Pusch et al., 1997), the slow-gating relaxation follows a single-exponential decay. In the absence of Zn2+, the time constant of the current relaxation is smaller with a higher temperature. At a fixed temperature, Zn2+ also speeds up the inactivation relaxation process; the relaxation time constant decreases with increasing Zn2+ concentration. From records like these, an Arrhenius plot of the time constants of the slow-gating relaxation at different Zn2+ concentrations was obtained (Fig. 5). The time constant, τ, depends on both temperature and Zn2+ concentration. In the absence of Zn2+, the slope of the fitted line gives a Q10 of ∼37. Raising extracellular Zn2+ concentration shortens the relaxation time constant at all temperatures, but the slope of the fitted line does not change. When Zn2+ concentration is higher than 100 μM, the ability of Zn2+ to speed up the slow-gating kinetics appears to be saturated (Fig. 6). Curve fittings to hyperbolic equations give apparent half effective concentrations (K 1/2's) from ∼20–40 μM at various temperatures. The ratio between the rate at saturated Zn2+ (the fitted Y∞) and in the absence of Zn2+ (the fitted Yo) ranges from 18.6 to 35.9. As will be shown later, the K 1/2 and the ratio Y∞/Yo from this analysis are informative to assess the Zn2+-binding affinities of the channel at different states.
Figure 4.
The slow-gating relaxation rate of ClC-0 is sensitive to both temperature and extracellular Zn2+. Dotted lines show zero-current level. Solid curves were the best fit to single-exponential functions. Time constants at 0, 10, and 100 μM Zn2+ were: (23.1°C) 332.9, 81.2, and 17.6 s; (26.5°C) 109.3, 27.9, and 8.1 s; and (30.0°C) 25.4, 6.0, and 2.4 s, respectively.
Figure 5.
Arrhenius plot of the slow-gating relaxation time constants in various external [Zn2+]. The time constant τ of the slow-gating relaxation was evaluated from experiments similar to those shown in Fig. 4 (n = 7–8). Solid lines were the best fit to Y = A + BX, where Y is log10(τ) and X is the inverse of temperature. External [Zn2+] (μM) and the Q10s of the fitted lines were: (□) 0, 36.5; (▵) 10, 46.2; (○) 100, 29.7. × and ♦ are the time constants of Zn2+ inhibition and recovery shown in Fig. 3 C.
Figure 6.
Slow-gating relaxation rate as a function of external [Zn2+]. Data points were fitted to Y = Y o + X · Y∞/(X + K 1/2). The fitted K 1/2s (μM) and Y∞/Yo were: (21.3°C, □) 33.2, 29.2; (23.1°C, ○) 40.4, 35.9; (24.8°C, ▵) 39.0, 26.3; (26.5°C, ▪) 26.6, 27.5; (28.3°C, •) 22.0, 18.6; (30.0°C, ▴) 21.5, 18.7. The increase of the inactivation rate by Zn2+, if all comes from the activation entropy, corresponds to an increase of ΔS of 24.3–29.8 J/mol per °K (see text for detailed discussion).
A Four-State Scheme Describes the Inhibitory Effect of Zn2+
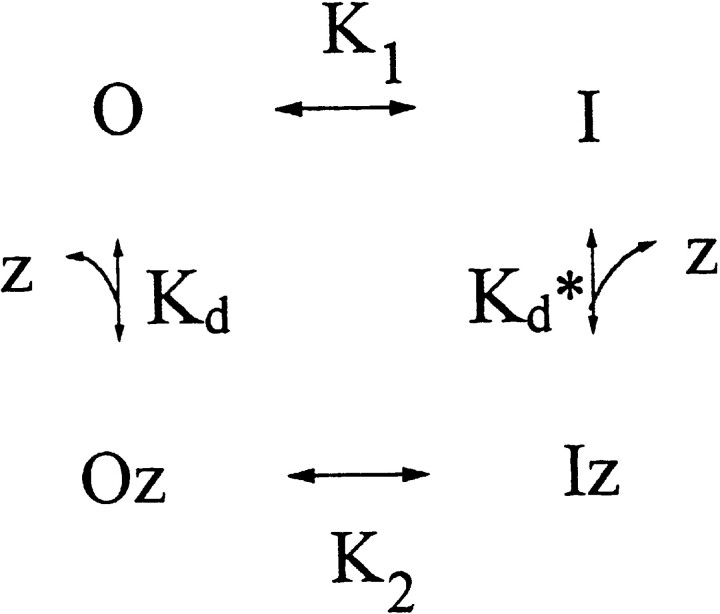
The inhibition of ClC-0 by the extracellular Zn2+ shown above can be explained by a simple four-state model (Scheme I). Here, z represents Zn2+, and O and I are the open and inactivated states of the channel. K1 and K2 are gating equilibrium constants between O and I and between Oz and Iz, whereas K d and K d* are apparent dissociation constants of Zn2+ binding to the open and inactivated channels, respectively. In this scheme, the closed state of the channel is ignored because most of the noninactivated channels are in the open state (versus close state) at a holding potential of −30 mV (Pusch et al. 1995; Chen and Miller, 1996). The binding and unbinding of Zn2+ to the channel are probably several orders of magnitude faster than the slow-gating transition because the latter operates at a time scale of tens to hundreds of seconds (Fig. 4). Thus, the rate-limiting steps of the steady state current inhibition by Zn2+ and the current recovery after Zn2+ washout must reside between Oz and Iz, and between O and I, respectively. This consideration predicts that the observed on rate of Zn2+ inhibition should be identical to the inactivation relaxation rate at the same Zn2+ concentration. Furthermore, the observed off rate of Zn2+ inhibition must also equal the inactivation relaxation rate in the absence of Zn2+. Fig. 5 compares, at various temperatures, the apparent on and off rates of Zn2+ inhibition with the inactivation relaxation rates with or without 10 μM Zn2+. Except for the comparisons of the on rate of Zn2+ inhibition with the inactivation rate at high temperatures, the above two predictions are fulfilled. At the highest two temperatures, 28.3° and 30.0°C, the time constants of the inhibition by 10 μM Zn2+ were 19.0 ± 5.1 (n = 4) and 9.4 ± 1.4 (n = 5) s, respectively, whereas the inactivation relaxation time constants at the same Zn2+ concentration were 11.5 ± 2.1 (n = 8) and 6.5 ± 0.9 (n = 8) s. The difference between these two cases is ∼3–8 s, a value comparable to the time for the solution exchange. The 3–8-s delay, however, is relatively small in comparison with slow-gating relaxation rates in other experimental conditions. Thus, these results show that the apparent on rate for Zn2+ to inhibit the steady state current is indeed equal to the inactivation relaxation rate at the same Zn2+ concentration, indicating that Zn2+ is very likely acting on the inactivation process of the channel.
The four-state scheme given above requires that the Zn2+ binding affinity of the inactivated channel be higher than that of the open channel; that is, K d > K d*. This is because the ratio K d/K d* must equal K2/K1, which is >1. Let transition rates α1 and β1 be the forward rate (the rate of inactivation) and the backward rate (the rate of recovery from inactivation) of the slow gating of the unliganded ClC-0, respectively, and α2 and β2 be those of the Zn2+-bound channel. It can be shown that if Zn2+ increases only the forward rate (that is, β1 = β2), the K 1/2 obtained from Fig. 6 would be K d. On the other hand, if the effect of Zn2+ is solely on β (that is, α1 = α2), K 1/2 would be K d*. The latter possibility can be ruled out even at this stage since the increase of β alone by Zn2+ would have led to a potentiation instead of an inhibition of the steady state current. There is, however, a possibility that Zn2+ may affect both the forward and backward rates of the slow-gating process. To address this question, it will be informative to evaluate the equilibrium between O and I by constructing the activation curve of the slow gate.
Effect of Zn2+ on the Activation Curve of the Slow Gate
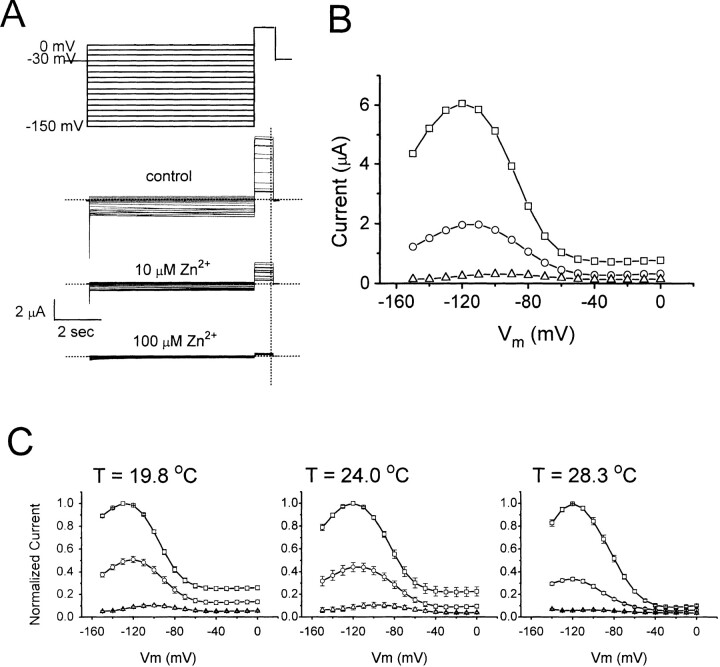
The voltage-dependent activation of the slow gate was examined with a protocol shown on top of Fig. 7 A, in which a 7-s prepulse from 0 to −140 or −150 mV in −10-mV steps was followed by a 0.8-s test pulse at +40 mV. This voltage protocol had been used previously to examine the activation curve of the slow-gating process, and it was found that the 7-s prepulse is long enough to maximally activate the slow gate (Pusch et al., 1997). As shown in Fig. 7 A, Zn2+ inhibits the activation of the slow gate in a dose-dependent manner. Fig. 7 B plots the current measured at the test pulse as a function of the prepulse voltage. This quasi–steady state activation curve shows a biphasic response for the open probability of the slow gate. The peak of the activation curves is around −120 mV in this experiment carried out at 23.8°C. The activation curves at 19.8° and 28.0°C reveal a similar pattern of voltage dependence (Fig. 7 C). In all three temperatures, 10 and 100 μM Zn2+ do not change the biphasic behavior of the activation curve, suggesting that Zn2+ has little effect on the current- decreasing phase at very negative potentials. The nonmonotonic behavior of the activation curve has been observed previously (Ludewig et al., 1997; Fong et al., 1998). The current reduction at the hyperpolarized end of the curve may be due to an additional unknown mechanism that closes the channel with strong negative potential. Therefore, I have restricted my attention to the voltage range more depolarized than −120 mV to simplify the analysis. In all situations, Zn2+ inhibits currents at all voltages with approximately the same degree, suggesting that the inhibition has little voltage dependence. The fractional inhibition ranges from ∼50 to 70% at 10 μM Zn2+ and ∼80 to 95% at 100 μM Zn2+.
Figure 7.
Effects of Zn2+ on the quasi–steady state activation curve of the slow gate. (A) Family of current traces elicited at 0, 10, and 100 μM Zn2+ with a voltage protocol shown on top. All traces were from the same oocyte at 24.0°C. The membrane potential was first held at −30 mV for the slow gating to reach steady state before each experiment started. Horizontal dotted lines indicate level of zero current. (B) Quasi–steady state activation curves at various Zn2+ concentrations from the experiment shown in A. The current amplitudes were measured at the vertical dotted line shown in B. □, ○, and ▵ represent control, 10, and 100 μM Zn2+, respectively. (C) Averaged quasi–steady state activation curves at 19.8, 24.0, and 28.3°C. Symbols are as those in B (n = 3–5).
Effect of Zn2+ Is Mostly on the Forward Rate of Inactivation
With information from kinetics as well as quasi–steady state equilibrium, it is possible to evaluate the rate constants of the slow-gating process. In the quasi–steady state activation curve, the current does not further decrease when the membrane potential is more depolarized than −30 mV (Fig. 7, B and C; also see Pusch et al., 1997). The noninactivated current fraction, obtained by normalizing the current amplitude at −30 mV (I) to the maximal current in the activation curve (Imax), can be expressed as a function of the forward (α) and backward (β) rate constants of the slow-gating process:
 |
1 |
In addition, the observed time constant τ of the slow-gating relaxation shown in Fig. 4 is also a function of α and β, with the following relation:
 |
2 |
Table I lists, at three temperatures, the relaxation time constant τ and the steady state fraction of the noninactivated current, I/Imax. The calculated forward rate constant α and backward rate constant β are also shown. Without considering the leak current (numbers outside parentheses in Table I), both α and β increase with Zn2+. The ratio between β at 100 μM Zn2+ (β100) and in the absence of Zn2+ (β0) ranges from ∼2 to 5, whereas the ratio between α at 100 μM Zn2+ (α100) and α in the absence of Zn2+ (α0) ranges from ∼13 to 18. Even under such situations where the analysis is contaminated with the leak current, most of the Zn2+ effect is on the forward rate α. When 1, 2, or 3% of the total current is considered as the leak, the ratio α100/α0 is not sensitive to variable leak fractions, whereas the ratio β100/β0 becomes ∼2–4, 1–3, and 0.6–1.5, respectively. Clearly, as more of the current is subtracted, the effect of Zn2+ on β gets smaller. It is difficult to give an exact number for the leak fraction from these experiments since ClC-0 does not close completely even at very large negative potentials (Chen and Miller, 1996; Ludewig et al., 1997). However, the leak currents observed from recordings of uninjected oocytes were usually ∼0.1–0.2 μA at +40 mV, and the maximal currents of the oocytes for the experiments in Fig. 7 C were ∼3–8 μA. Therefore, it seems reasonable to give a leak fraction of at least 2–3%. This number can also be independently checked by recording oocytes in 0 Cl− solution (see materials and methods).
Table I.
Effects of Zn2+ on the Forward (α) and Backward (β) Rates of Inactivation
| [Zn2+] (μM) | τ (s) | I/Imax | β (× 10−3 s−1) | α (× 10−3 s−1) | α100/α0 | |||||||||||||||||||||||
|---|---|---|---|---|---|---|---|---|---|---|---|---|---|---|---|---|---|---|---|---|---|---|---|---|---|---|---|---|
| 0 | 10 | 100 | 0 | 10 | 100 | β0 | β10 | β100 | β100/β0 | α0 | α10 | α100 | ||||||||||||||||
| 19.8°C | 1093.3 | 344.7 | 75.5 | 0.2508 | 0.1271 | 0.0516 | 0.229 | 0.369 | 0.683 | 2.98 | 0.686 | 2.532 | 12.562 | 18.31 | ||||||||||||||
| (0.2208) | (0.0971) | (0.0216) | (0.202) | (0.282) | (0.286) | 1.42 | (0.713) | (2.619) | (12.959) | 18.18 | ||||||||||||||||||
| 24.0°C | 235.4 | 67.1 | 17.8 | 0.2213 | 0.0891 | 0.0391 | 0.940 | 1.328 | 2.197 | 2.34 | 3.308 | 13.575 | 53.983 | 16.32 | ||||||||||||||
| (0.1913) | (0.0591) | (0.0091) | (0.813) | (0.881) | (0.511) | 0.63 | (3.435) | (14.022) | (55.669) | 16.21 | ||||||||||||||||||
| 28.3°C | 51.1 | 13.2 | 4.2 | 0.0908 | 0.0561 | 0.0378 | 1.777 | 4.250 | 9.000 | 5.06 | 17.792 | 71.508 | 229.095 | 12.88 | ||||||||||||||
| (0.0608) | (0.0261) | (0.0078) | (1.190) | (1.977) | (1.857) | 1.56 | (18.379) | (73.781) | (236.238) | 12.85 | ||||||||||||||||||
The table lists the slow-gating relaxation time constant (τ) calculated from Fig. 5, the noninactivated current fraction (I/Imax) obtained from Fig. 7 C, the forward (α) and the backward (β) rates of inactivation at three different temperatures, and in 0, 10, and 100 μM Zn2+. β was calculated by dividing I/Imax by τ (Eq. 1), whereas α was obtained by subtracting β from 1/τ (Eq. 2). The numbers outside the parentheses were derived from original measured current without leak subtraction. The I/Imax values in parentheses were obtained by subtracting 0.03 from the original values outside parentheses and the α's and β's in parentheses were calculated accordingly.
The data corrected with leak subtraction are shown within parentheses in Table I. The leak fraction is chosen to be 3% of the maximal current. Under this condition, the α's at 100 μM Zn2+ are ∼13–18-fold larger than those in the absence of Zn2+. On the other hand, Zn2+ has almost no effect on the backward rate β at all three temperatures. This argues that K2/K1 should be equal to α2/α1 if Scheme SI is considered. The ratio Y∞/Yo from Fig. 6 can be used to approximate α2/α1 since β is small in comparison with α (compare β0 and β100 with α0 and α100 in Table I). The dissociation constant for Zn2+ binding to the open channel (K d) is ∼30 μM, whereas Y∞/Yo ranges from 18.6 to 35.9 (Fig. 6). To a first degree of approximation, the dissociation constant for Zn2+ binding to the inactivated channel (K d*) should be ∼1 μM. It is interesting to point out that K d* should be close to the apparent K 1/2 of Zn2+ inhibition on the steady state current at −30 mV, where the O ↔ I transition favors the I state. Furthermore, the more the I state is favored (that is, the higher the K1 value as the temperature is raised), the closer the observed affinity to K d*. In Fig. 3 A, the fractional inhibition of the steady state current by 10 μM Zn2+ is >50%, consistent with the K d* value inferred from the above analysis. The dose-dependent inhibition of the steady state current by Zn2+ performed at temperatures around 25–30°C usually gave an apparent K 1/2 of ∼1–3 μM (Fig. 1 B).
Scheme I.
discussion
Transition metal ions have long been used to explore the structure and function of ion channels. In the present study, I have shown that Zn2+ can reversibly inhibit ClC-0. The effect of Zn2+ on the fast gate is only minimal and cannot explain the magnitude of Zn2+ inhibition. Rather, Zn2+ appears to inhibit the channel by facilitating the slow-gating process. Such a coupled equilibrium system, in which the binding of a divalent metal ion is coupled to the inactivation of an ion channel, has been characterized on the Shaker K+ channel (Yellen et al., 1994). The binding of Cd2+ to the external mouth of the Shaker channel via an engineered cysteine was found to modulate the C-type inactivation of the channel, with the Cd2+ affinity increased by 45,000-fold for the inactivated channel. This effect is due to a destabilization of the open state as well as a stabilization of the inactivated state of the Shaker channel. In the present study, although the Zn2+ affinity of the inactivated ClC-0 is only 30-fold higher than that of the open channel, the same principle of coupled binding still applies. The effect of Zn2+ on the slow-gating equilibrium of ClC-0 appears to come mostly from an increase of the forward rate constant of the inactivation.
The inhibition of ClC channels by transition metal ions was also found in ClC-1 and ClC-2. However, the apparent affinity of Zn2+ inhibition of ClC-0 is very different from those of ClC-1 and ClC-2. For the Torpedo channel, the apparent K 1/2 for Zn2+ to inhibit the steady state current is ∼1–3 μM (Fig. 1 B). In contrast, Zn2+ and Cd2+ inhibit ClC-1 and ClC-2 with apparent K 1/2's at least 50–100-fold higher (Kürz et al., 1997; Rychkov et al., 1997; Clark et al., 1998), suggesting a different inhibition mechanism. As the inhibition of ClC-0 by Zn2+ is through the facilitation of the slow gating, the lack of a high-affinity block in ClC-1 and ClC-2 by Zn2+ or Cd2+ may suggest the absence of a similar Zn2+-sensitive, highly temperature-dependent slow-gating process in these two mammalian channels.
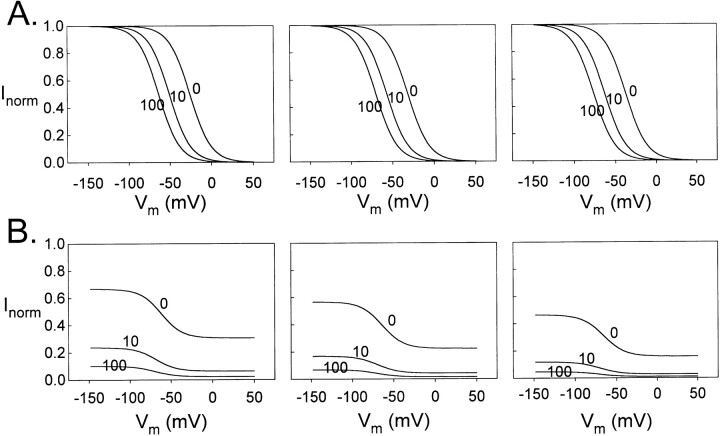
Although the four-state scheme (Scheme I) appears to explain well the effect of Zn2+ at a constant holding potential of −30 mV, problems with this simple scheme are obvious when the membrane potential is changed. In Scheme I, the same voltage and temperature dependence are assigned at the transitions O ↔ I and Oz ↔ Iz. Under this condition, hyperpolarization, which opens the slow gate and shifts the channel (Zn2+ bound or unbound) mostly to the O state, would reduce the Zn2+ inhibition since the Zn2+-bound O state is conducting. At an extremely negative membrane potential, the current should be the same whether in the absence or presence of Zn2+. In other words, Zn2+ must shift the activation curve to the left along the voltage axis without changing the maximal and minimal current levels (see modeling in Fig. 8 A). The experimental results in Fig. 7, however, show that this appears not to be the case.
Figure 8.
Simulation for the effect of Zn2+ on the quasi– steady state activation curve of the slow gate. Activation curves were generated based on Scheme SI (A) and Scheme III (B) in the presence of 0, 10, and 100 μM Zn2+ at 20° (left), 24° (middle), and 28°C (right). The ratio of the occupation probability of any two states, A and B, is assumed to be of the form: 1/K AB = P A/P B = exp(−ΔG AB/RT) = exp(ΔS AB/R − ΔH AB/RT + z ABVF/RT), where K AB is the equilibrium constant, and ΔG AB, ΔS AB, and ΔH AB are the difference in Gibbs free energy, entropy, and enthalpy between the two states, respectively. R, T, and F have their usual meanings. V is the membrane voltage and z AB is the “gating valence” describing the voltage dependence of the transition A ↔ B. The values of the above parameters in the absence of Zn2+ were the same as those in a previous paper (Pusch et al., 1997) except for ΔH O1O2. They are shown as follows (ΔH in kJ/mol, ΔS in kJ/mol/°K): (A) ΔH OI = −80, ΔS OI = −0.29, z OI = −2; (B) ΔH O1I1 = −77, ΔS O1I1 = −0.26, z O1I1 = 0, ΔH O1O2 = 10, ΔS O1O2 = 0, z O1O2 = −2, ΔH O2I2 = −78, ΔS O2I2 = −0.27, z O2I2 = 0. Assigning 10 kJ/mol for ΔH O1O2 makes all curves in B shift to the left by ∼40 mV so that the curves from modeling are more similar to the experimental data with respect to their positions along the voltage axis. It does not affect the effect of Zn2+, which shifts the curve from top to bottom. Even with this adjustment, the assigned values in B do not provide a superb prediction for the plateau at positive voltages as they give a much larger noninactivated fractional current than the data shown in Fig. 7. This difference is not important since the pattern of Zn2+ inhibition is basically the same as that in the experimental data. The numbers 0, 10, and 100 indicate Zn2+ concentrations.
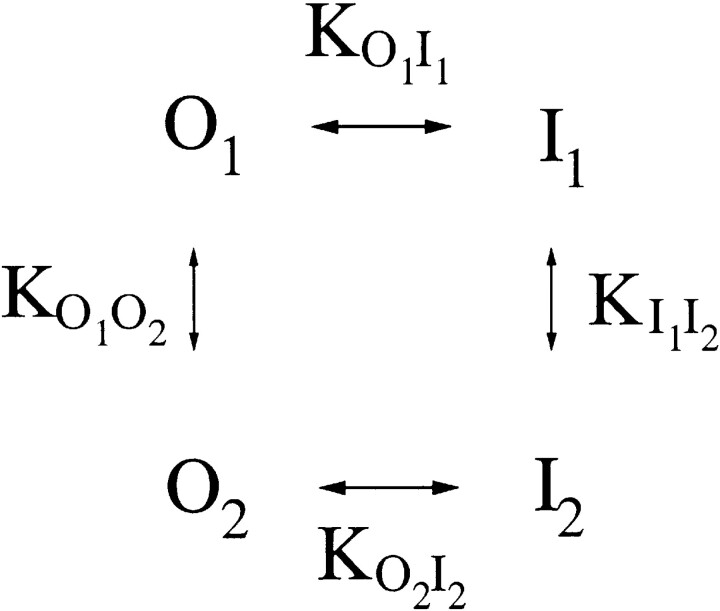
The problem of Scheme SI discussed above comes from naively assigning the slow gating as a simple process between only two states, O and I. Pusch et al. (1997) pointed out that any Markov-type model to describe the slow gating itself requires at least four states. Based on the quasi–steady state activation curves at different temperatures, they suggested the model shown in Scheme II. Here, O1 and O2 represent the two states in which the slow gate is open (that is, the noninactivated states), whereas I1 and I2 are the two states in which the slow gate is closed (the inactivated states). KABs are equilibrium constants between states A and B. The peculiar feature of this model is that the transitions between O and I (O1 ↔ I1 and O2 ↔ I2) are temperature, but not voltage, dependent. The voltage dependence instead resides in the transitions between states 1 and 2 (O1 ↔ O2 and I1 ↔ I2; Pusch et al., 1997). Thus, as long as the free energy of the slow-gating transition of channel population 1 differs from that of channel population 2 (that is, KO1I1 ≠ KO2I2), the open probability of the slow gate would reveal voltage dependence. At a fixed voltage (e.g., −30 mV), the total free energy of the slow-gating transition for all channels is constant at the same temperature, so Scheme SII would automatically reduce to a two-state process. Under such situations, Scheme SI would be able to explain the effect of Zn2+ as being achieved from the analysis of the Zn2+ inhibition on the steady state current at −30 mV.
Scheme II.
As Zn2+ apparently exerts its effect on the slow-gating process, one can examine whether Scheme SII is valid by studying the effect of Zn2+ on the quasi–steady state activation curve. The examination can be illustrated in Scheme III. Here, the four states in front represent Scheme SII and each of the four species is then connected to a Zn2+-bound state. The dissociation constants for Zn2+ binding to the channels (K d and K d*) and the equilibrium gating constants among the Zn2+-unbound states have the same meanings as those in Schemes SI and SII, respectively. To model the effects of Zn2+ on activation curves, the enthalpy and entropy of the transitions among Zn2+-unbound states were taken from Pusch et al. (1997). In addition, two pieces of information from Fig. 6 are also used: the dissociation constant of Zn2+ binding to the open-state channel (K d) is 30 μM, and the entropy difference of the slow-gating transition in the Zn2+-bound channel is increased by 27 J/mol/°K. The latter is calculated from the ratio Y∞/Yo, according to transition state theory and assuming that the backward rate of the inactivation process is not affected by Zn2+ (see results). Fig. 8 A shows that Zn2+ shifts the activation curve along the voltage axis when only two states, O and I, are used to describe the slow gating (Scheme I). On the other hand, the activation curves derived from Scheme III show a Zn2+ inhibition pattern similar to the experimental results (Fig. 8 B). The curve shifts along the longitudinal axis by raising extracellular Zn2+, a pattern similar to that made by increasing temperature (Pusch et al., 1997). This similarity is not surprising since a change in temperature is equivalent to a change in entropy with respect to their contributions to the free energy of the slow-gating process.
 Scheme III thus describes the effect of Zn2+ on the quasi–steady state activation curve well, but only at voltages more depolarized than −120 mV. As the membrane potential is more negative than −120 mV, the open probability of the slow gate becomes paradoxically smaller. There is very limited information about the slow gating at such hyperpolarized membrane potentials, so the underlying mechanism is difficult to address at the present time. However, the facilitation of inactivation upon depleting permeant ions has been observed in other channels (Baukrowitz and Yellen, 1995, 1996; Townsend and Horn, 1997). This possibility cannot be ruled out here since reduction of the intracellular Cl− concentration, at least near the internal mouth of the channel, is very likely to occur in such a hyperpolarized condition. The slow gating of ClC-0 has long been known to couple to the Cl− flux across the channel pore (Richard and Miller, 1990). Thus, the slow gating of ClC-0 could be more complicated than the above gating scheme if the Cl− effect is considered.
The high activation energy of the inactivation of ClC-0 is consistent with a complex conformational change thought to involve subunit interaction between two protomers (Pusch et al., 1997). In the Arrhenius plot, Zn2+ simply shifts the line describing temperature dependence without altering the slope of the line (Fig. 5). This suggests that Zn2+ binding does not change the activation enthalpy of the slow-gating process, but results in a bigger entropy difference between the open and transition states. Assuming the transition state with or without Zn2+ has the same entropy, the open state must have a lower entropy in the presence than in the absence of Zn2+. One can imagine that the complex slow-gating process may involve a step that requires some kind of order in the channel protein (or part of the channel protein, for example, a less movable loop), which renders the inactivation process relatively unfavorable. Zn2+, in binding to the channel, may facilitate this process by providing the order that would otherwise be more difficult to reach in the absence of Zn2+. This suggestion, however, is only one of the many interpretations based on thermodynamic arguments. The structural evidence to support this implication awaits more characterization of the channel molecule.
In summary, I have shown that Zn2+ can reversibly inhibit the ClC-0 Cl− channel from Torpedo electroplax. This effect is likely due to an increase of the inactivation rate of the channel with little changes on the rate of recovery from the inactivation state. The molecular structure of the slow gate and how it functions are largely unknown. Zn2+, due to its effect on the inactivation process of ClC-0, may be used to further explore the slow gating of ClC-0 in the future.
Abbreviation used in this paper
- TEA
tetraethylammonium
Footnotes
I thank Prof. Chris Miller, who initiated this project by showing that the ash of burned spider venom retained the ability to inhibit ClC-0 just as potently as the fresh venom. I would also like to thank Drs. Tzyh-Chang Hwang and Ru-Chi Shieh for their comments on the manuscript.
This research was supported in part by grants NSC86-2314-B010-123T and NSC87-2314-B010-103 from the National Science Council, and also by a grant DOH88-HR-813 from National Health Research Institutes, Taiwan, ROC.
references
- Backx PH, Yue DT, Lawrence JH, Marban E, Tomaselli GF. Molecular localization of an ion-binding site within the pore of mammalian sodium channels. Science. 1992;257:248–251. doi: 10.1126/science.1321496. [DOI] [PubMed] [Google Scholar]
- Baukrowitz T, Yellen G. Modulation of K+ current by frequency and external [K+]: a tale of two inactivation mechanisms. Neuron. 1995;15:951–960. doi: 10.1016/0896-6273(95)90185-x. [DOI] [PubMed] [Google Scholar]
- Baukrowitz T, Yellen G. Use-dependent blockers and exit rate of the last ion from the multi-ion pore of a K+channel. Science. 1996;271:653–656. doi: 10.1126/science.271.5249.653. [DOI] [PubMed] [Google Scholar]
- Bretag AH, Fietz MJ, Bennet RRJ. The effects of zinc and other transition metal ions on rat skeletal muscle. Proc Aust Physiol Pharmacol Soc. 1984;15:146P. . (Abstr.) [Google Scholar]
- Chen T-Y, Miller C. Nonequilibrium gating and voltage dependence of the ClC-0 Cl−channel. J Gen Physiol. 1996;108:237–250. doi: 10.1085/jgp.108.4.237. [DOI] [PMC free article] [PubMed] [Google Scholar]
- Clark S, Jordt S-E, Jentsch TJ, Mathie A. Characterization of the hyperpolarization-activated chloride current in dissociated rat sympathetic neurons. J Physiol (Lond) 1998;506:665–678. doi: 10.1111/j.1469-7793.1998.665bv.x. [DOI] [PMC free article] [PubMed] [Google Scholar]
- Fong P, Rehfeldt A, Jentsch TJ. Determination of slow gating in ClC-0, the voltage-gated chloride channel of Torpedo marmorata. . Am J Physiol. 1998;274:C966–C973. doi: 10.1152/ajpcell.1998.274.4.C966. [DOI] [PubMed] [Google Scholar]
- Gordon SE, Zagotta WN. A histidine residue associated with the gate of the cyclic nucleotide-activated channels in rod photoreceptors. Neuron. 1995;14:177–183. doi: 10.1016/0896-6273(95)90252-x. [DOI] [PubMed] [Google Scholar]
- Hanke W, Miller C. Single chloride channels from Torpedoelectroplax: activation by protons. J Gen Physiol. 1983;82:25–45. doi: 10.1085/jgp.82.1.25. [DOI] [PMC free article] [PubMed] [Google Scholar]
- Hille, B. 1992. Mechanisms of block. In Ion Channels of Excitable Membranes. 2nd ed. B. Hille, editor. Sinauer Associates, Inc. Sunderland, MA. 390–422.
- Hutter OF, Warner AE. Action of some foreign cations and anions on the chloride permeability of frog muscle. J Physiol (Lond) 1967;189:445–460. doi: 10.1113/jphysiol.1967.sp008178. [DOI] [PMC free article] [PubMed] [Google Scholar]
- Jentsch TJ, Steinmeyer K, Schwarz G. Primary structure of Torpedo marmorata chloride channel isolated by expression cloning in Xenopusoocytes. Nature. 1990;348:510–514. doi: 10.1038/348510a0. [DOI] [PubMed] [Google Scholar]
- Karpen JW, Brown RL, Stryer L, Baylor DA. Interactions between divalent cations and the gating machinery of cyclic GMP-activated channels in salamander retinal rods. J Gen Physiol. 1993;101:1–25. doi: 10.1085/jgp.101.1.1. [DOI] [PMC free article] [PubMed] [Google Scholar]
- Kürz LL, Wagner S, George AL, Jr, Rüdel R. Probing the major skeletal muscle chloride channel with Zn2+and other sulfhydryl-reactive compounds. Pflügers Arch. 1997;433:357–363. doi: 10.1007/s004240050288. [DOI] [PubMed] [Google Scholar]
- Liu Y, Holmgren M, Jurman ME, Yellen G. Gated access to the pore of a voltage-dependent K+channel. Neuron. 1997;19:175–184. doi: 10.1016/s0896-6273(00)80357-8. [DOI] [PubMed] [Google Scholar]
- Ludewig U, Pusch M, Jentsch TJ. Two physically distinct pores in the dimeric ClC-0 chloride channel. Nature. 1996;383:340–343. doi: 10.1038/383340a0. [DOI] [PubMed] [Google Scholar]
- Ludewig U, Jentsch TJ, Pusch M. Analysis of a protein region involved in permeation and gating of the voltage-gated Torpedochloride channel ClC-0. J Physiol (Lond) 1997;498:691–702. doi: 10.1113/jphysiol.1997.sp021893. [DOI] [PMC free article] [PubMed] [Google Scholar]
- Middleton RE, Pheasant DJ, Miller C. Purification, reconstitution, and subunit composition of a voltage-gated chloride channel from Torpedoelectroplax. Biochemistry. 1994;33:13189–13198. doi: 10.1021/bi00249a005. [DOI] [PubMed] [Google Scholar]
- Middleton RE, Pheasant DJ, Miller C. Homodimeric architecture of a ClC-type chloride ion channel. Nature. 1996;383:337–340. doi: 10.1038/383337a0. [DOI] [PubMed] [Google Scholar]
- Miller C. Open-state substructure of single chloride channels from Torpedoelectroplax. Philos Trans R Soc Lond B Biol Sci. 1982;299:401–411. doi: 10.1098/rstb.1982.0140. [DOI] [PubMed] [Google Scholar]
- Miller, C., and E.A. Richard. 1990. The voltage-dependent chloride channel of Torpedo electroplax: intimations of molecular structure from quirks of single-channel function. In Chloride Transporters. A. Leefmans and J. Russell, editors. Plenum Publishing Corp., New York. 383–405.
- Miller C, White MM. Dimeric structure of single chloride channels from Torpedoelectroplax. Proc Natl Acad Sci USA. 1984;81:2772–2775. doi: 10.1073/pnas.81.9.2772. [DOI] [PMC free article] [PubMed] [Google Scholar]
- Pusch M, Jentsch TJ. Molecular physiology of voltage-gated chloride channels. Physiol Rev. 1994;74:813–825. doi: 10.1152/physrev.1994.74.4.813. [DOI] [PubMed] [Google Scholar]
- Pusch M, Ludewig U, Jentsch TJ. Temperature dependence of fast and slow gating relaxations of ClC-0 chloride channels. J Gen Physiol. 1997;109:105–116. doi: 10.1085/jgp.109.1.105. [DOI] [PMC free article] [PubMed] [Google Scholar]
- Pusch M, Ludewig U, Rehfeldt A, Jentsch TJ. Gating of the voltage-dependent chloride channel ClC-0 by the permeant anion. Nature. 1995;373:527–531. doi: 10.1038/373527a0. [DOI] [PubMed] [Google Scholar]
- Richard EA, Miller C. Steady-state coupling of ion-channel conformations to a transmembrane ion gradient. Science. 1990;247:1208–1210. doi: 10.1126/science.2156338. [DOI] [PubMed] [Google Scholar]
- Rychkov GY, Astill DS, Bennetts B, Hughes BP, Bretag AH, Roberts ML. pH-dependent interactions of Cd2+and a carboxylate blocker with the rat ClC-1 chloride channel and its R304E mutant in the sf-9 insect cell line. J Physiol (Lond) 1997;498:691–702. doi: 10.1111/j.1469-7793.1997.355bn.x. [DOI] [PMC free article] [PubMed] [Google Scholar]
- Stanfield PR. The differential effects of tetraethylammonium and zinc ions on the resting conductance of frog skeletal muscle. J Physiol (Lond) 1970;209:231–256. doi: 10.1113/jphysiol.1970.sp009164. [DOI] [PMC free article] [PubMed] [Google Scholar]
- Steinmeyer K, Ortland C, Jentsch TJ. Primary structure and functional expression of a developmentally regulated skeletal muscle chloride channel. Nature. 1991;354:301–304. doi: 10.1038/354301a0. [DOI] [PubMed] [Google Scholar]
- Townsend C, Horn R. Effect of alkali metal cations on slow inactivation of cardiac Na+channels. J Gen Physiol. 1997;110:23–33. doi: 10.1085/jgp.110.1.23. [DOI] [PMC free article] [PubMed] [Google Scholar]
- White MM, Miller C. A voltage-gated anion channel from electric organ of Torpedo californica. . J Biol Chem. 1979;254:10161–10166. [PubMed] [Google Scholar]
- Yellen G, Sodickson D, Chen T-Y, Jurman ME. An engineered cysteine in the external mouth of a K+channel allows inactivation to be modulated by metal binding. Biophys J. 1994;66:1068–1075. doi: 10.1016/S0006-3495(94)80888-4. [DOI] [PMC free article] [PubMed] [Google Scholar]


