

Abstract
Ca2+ channel inactivation in the neurons of the freshwater snail, Lymnaea stagnalis, was studied using patch-clamp techniques. In the presence of a high concentration of intracellular Ca2+ buffer (5 mM EGTA), the inactivation of these Ca2+ channels is entirely voltage dependent; it is not influenced by the identity of the permeant divalent ions or the amount of extracellular Ca2+ influx, or reduced by higher levels of intracellular Ca2+ buffering. Inactivation measured under these conditions, despite being independent of Ca2+ influx, has a bell-shaped voltage dependence, which has often been considered a hallmark of Ca2+-dependent inactivation. Ca2+-dependent inactivation does occur in Lymnaea neurons, when the concentration of the intracellular Ca2+ buffer is lowered to 0.1 mM EGTA. However, the magnitude of Ca2+-dependent inactivation does not increase linearly with Ca2+ influx, but saturates for relatively small amounts of Ca2+ influx. Recovery from inactivation at negative potentials is biexponential and has the same time constants in the presence of different intracellular concentrations of EGTA. However, the amplitude of the slow component is selectively enhanced by a decrease in intracellular EGTA, thus slowing the overall rate of recovery. The ability of 5 mM EGTA to completely suppress Ca2+-dependent inactivation suggests that the Ca2+ binding site is at some distance from the channel protein itself. No evidence was found of a role for serine/threonine phosphorylation in Ca2+ channel inactivation. Cytochalasin B, a microfilament disrupter, was found to greatly enhance the amount of Ca2+ channel inactivation, but the involvement of actin filaments in this effect of cytochalasin B on Ca2+ channel inactivation could not be verified using other pharmacological compounds. Thus, the mechanism of Ca2+-dependent inactivation in these neurons remains unknown, but appears to differ from those proposed for mammalian L-type Ca2+ channels.
Keywords: molluscs, cytochalasin B, intracellular Ca2+, Ca2+ buffering
INTRODUCTION
Inactivation of Ca2+ channels is thought to be of two types—voltage-dependent inactivation, like that of Na+ channels (as originally proposed by Hodgkin and Huxley 1952), and Ca2+-dependent inactivation, which is determined by the intracellular Ca2+ concentration (Brehm and Eckert 1978; Tillotson 1979). Ca2+-dependent inactivation is an important example of negative feedback through which the Ca2+ levels inside the cell can regulate the amount of Ca2+ influx. It is, as yet, unknown whether Ca2+ merely influences the rate constants of entry to and departure from the inactivated state, or if it actually causes the channels to enter an entirely different inactivation state.
In this paper, we have studied the inactivation of Ca2+ channels in Lymnaea neurons. Ca2+-dependent inactivation in molluscan neurons has received considerable attention; it was in these neurons that this phenomenon was first characterized (Tillotson 1979; Eckert and Tillotson 1981). However, it is necessary to reexamine the inactivation of molluscan Ca2+ channels because the original studies did not take into account the outward proton current, which was discovered later in snail neurons (Thomas and Meech 1982; Byerly et al. 1984a) and can easily be misinterpreted as Ca2+-current inactivation. Also, the early studies were inconclusive about the amount of voltage-dependent inactivation present in molluscan neurons (Eckert and Chad 1984). These studies, and others (Brehm and Eckert 1978; Ashcroft and Stanfield 1982; Lee et al. 1985) established that Ca2+ channel inactivation under some conditions has a bell-shaped voltage dependence; i.e., depolarizations to potentials that elicit large Ca2+ currents also cause maximal amounts of inactivation. This is consistent with the idea that inactivation is caused by Ca2+ influx, and thus a bell-shaped inactivation curve is often interpreted to indicate the presence of Ca2+-dependent inactivation.
In this study, we show that Ca2+ channel inactivation in Lymnaea neurons has both Ca2+- and voltage-dependent components, and that both of these components have a bell-shaped voltage dependence. From the kinetics of the development of and the recovery from inactivation, we infer that there are two distinct inactivation states, even in the absence of Ca2+-dependent inactivation, and an increase in Ca2+ causes a greater occupancy of the longer-lived inactivation state. We find that while Ca2+-dependent inactivation is influenced by Ca2+ influx, its magnitude does not depend linearly on the magnitude of the influx, as was shown previously (Eckert and Tillotson 1981), but instead saturates at relatively low levels of Ca2+ influx. Intracellular EGTA (5 mM) can completely suppress Ca2+-dependent inactivation, suggesting that Ca2+-dependent inactivation is not caused by Ca2+ ions binding to the channel protein itself, as proposed by earlier models (Sherman et al. 1990; Neely et al. 1994). We focus our attention on other models that propose that the cytoplasmic Ca2+ levels control Ca2+-dependent inactivation through enzymatic actions (Chad and Eckert 1986; Armstrong 1989), or by modulating the polymerization state of the cytoskeleton (Johnson and Byerly 1994; Galli and DeFelice 1994). We find no evidence to support that serine/threonine phosphorylation controls Ca2+-dependent inactivation in Lymnaea neurons. Cytochalasin B, a disrupter of actin filaments, causes a large increase in inactivation of Ca2+ channels. However, it appears that the increases in inactivation do not result from a disruption of actin filaments by cytochalasin B.
MATERIALS AND METHODS
Cell Preparation and Electrophysiology
Neurons were dissociated from the pedal, parietal, and visceral ganglia of adult Lymnaea stagnalis, and prepared for patch clamp experiments as previously described (Johnson and Byerly 1993a). The cells used for this study were nearly spherical, and their diameters ranged from 50 to 75 μm. The Axopatch 200A patch clamp amplifier (Axon Instruments) was used in this study to measure currents. pClamp software (version 6.0) was used for data acquisition (Clampex) and analysis (Clampfit). The patch clamp electrodes typically had resistances of 1 MΩ and tip diameters of 12–16 μm. Series resistance (usually ∼2–4 MΩ) was electronically compensated to >90%. Inactivation measurements were taken at least 10 min after entering the whole-cell configuration, unless otherwise noted, to allow for the diffusion of the electrode solution into the cell. Junction potential errors (described in Hagiwara and Ohmori 1982; Neher 1995) have not been corrected for in these experiments and are expected to be approximately −10 to −15 mV (Byerly and Hagiwara 1982). Linear leak currents and capacitive transients are subtracted using a P/4 protocol. Currents recorded in the standard solutions are comprised of voltage-gated Ca2+ and H+ currents (Byerly et al. 1984a). These currents are not contaminated with outward Cs+ or Cl− currents, since replacing internal Cs+ with N-methyl-d-glucamine+, or external Cl− with methanesulfonate− (CH3SO3 −) does not produce any change in the shape of the recorded currents.
Internal Perfusion Experiments
Internal perfusion experiments were done following the method described by Neher and Eckert 1988. The intracellular solution of the cell could be completely exchanged in <6 min, as estimated from measuring outward K+ currents while replacing intracellular K+ with Cs+.
Solutions
The Lymnaea saline used for dissociation and storage of cells contains 50 mM NaCl, 2.5 mM KCl, 4 mM MgCl2, 4 mM CaCl2, 10 mM HEPES (N-[2-hydroxyethyl] piperazine-N′-[2-ethane sulfonic acid]), adjusted to pH 7.4 with NaOH. The standard extracellular saline used for recording Ca2+ or Ba2+ currents is composed of 76 mM TrisCl and 10 mM CaCl2 or BaCl2, and is adjusted to pH 7.4. In some experiments where the concentration of Ca2+ in the external solution is reduced to 1 mM, 9 mM MgCl2 is added to keep the total concentration of divalent ions constant. All of the intracellular solutions contain 50 mM HEPES, 0.5 mM MgCl2, 3–12 mM CsCl, 15–20 mM aspartic acid, and 2 mM Mg-ATP, with varying amounts of calcium buffers, adjusted to pH 7.3 with CsOH, thus making Cs+ the main intracellular cation. The different levels of intracellular Ca2+ buffers used in this study are 0.1 mM EGTA, 5 mM EGTA, 5 mM EGTA with 2.5 mM CaCl2, 5 mM EGTA with 4.5 mM CaCl2, and 11 mM 1,2-bis(2-amino phenoxy) ethane-N, N, N′, N′-tetraacetic acid (BAPTA) with 1 mM CaCl2. These solutions adjusted to various free Ca2+ levels were used for calibrating Fura-2.
H-7 [1-(5-isoquinolinylsulfonyl)-2-methyl piperazine], cyclosporin A, and colchicine are readily soluble in water and their stock solutions were made in distilled water. Although phalloidin is not highly soluble in water, its aqueous solubility is adequate to form a 5-mM stock solution in distilled water. The stock solution for okadaic acid (K+ salt) was only three times more concentrated than the final concentrations required and was made directly in the extracellular saline. Stock solutions for calmidazolium, cytochalasin B, and cytochalasin D were made in DMSO. Appropriate volumes of these stock solutions were then added to the external solution in the bath to bring the bath concentration of these compounds to the required levels.
Fura-2 Measurements of Free Ca2+ in Cells
Free Ca2+ levels in cells were measured by loading the cells with an intracellular solution containing 10 μM Fura-2, a Ca2+-sensitive ratiometric dye (Grynkiewicz et al. 1985). Fura-2 fluorescence was measured in a confocal arrangement using pinholes as previously described (Johnson and Byerly 1993b). The calibration solutions described above were used for calibrating Fura-2 in microcuvettes (borosilicate microslides with an optical path length of 50 μm; VitroCom Inc.). The UV exciting Fura-2 was controlled by a Lambda 10-2 filter wheel (Sutter Instrument Co.) and limited to 200-ms pulses of 380 and 360 nm radiation for each measurement of Ca2+. Background fluorescence measurements were made before the patch membrane was ruptured, and later subtracted from all records.
Measurement of Inactivation
In the studies reported in this paper, inactivation has been measured using mainly a three-pulse protocol (see Fig. 1 A). First a short test pulse (10 ms) to +40 mV is applied, then a conditioning pulse (150 ms) of variable amplitude, followed by a gap (20 ms) at the holding potential (−60 mV), and, finally, a second test pulse to +40 mV is applied. The inactivation caused by the conditioning pulse is calculated as the percent reduction in the test pulse current after the conditioning pulse. In an earlier study (Gera and Byerly 1999), we have shown that this method of measuring Ca2+ channel inactivation avoids errors caused by H+ currents, which can be prominent in snail neurons under the conditions used to record Ca2+ currents (Byerly et al. 1984a). This is primarily because H+ current activates slowly at the test pulse potential, and any H+ current activated by the conditioning pulse is given time to deactivate completely during the 20-ms gap, before the second test pulse is applied. Some recovery from inactivation also takes place during the 20-ms gap; consequently, our measurements of inactivation reflect the fraction of Ca2+ channels in the inactivated state 20 ms after the end of the conditioning pulse and not the total inactivation caused by the conditioning pulse. The length of this gap is determined by the time that H+ and Ca2+ currents, activated by the conditioning pulse, take to completely deactivate. While H+ currents deactivate relatively fast, Ca2+ tail currents after conditioning pulses to large voltages can take 20 ms to decay to baseline. Thus, the gap length has been chosen to be 20 ms to minimize the contamination of the test pulse current by conditioning pulse tail currents, while maximizing the amount of inactivation that can be accurately measured. Since large, positive pulses longer than 150 ms cause a rapid rundown of Ca2+ current in Lymnaea neurons, we have restricted the study presented here to inactivation caused by 150-ms long conditioning pulses. Consequently, the inactivation levels we measure here are not steady state.
Figure 1.

Ca2+-channel inactivation measurements in cells containing 5 mM EGTA. (A) Method for measuring Ca2+-channel inactivation. Command voltage traces for three different conditioning pulse voltages (top) and the corresponding current traces (bottom) are shown. A 10-ms test pulse (TP) to +40 mV is followed by a 150-ms conditioning pulse (CP), a 20-ms gap at the holding potential (−60 mV), and a second test pulse to +40 mV. (B) Average inactivation measurements (▪, n = 31) and the normalized peak inward currents (□, n = 32) as a function of the conditioning-pulse voltage. The inward currents for each cell were normalized to the maximum inward current, and then averaged across all cells. Error bars in this and the following figures represent SEM.
In some experiments, tail currents have been used to measure inactivation (e.g., see Fig. 2 D, 4 C, and 5), using a protocol similar to the one described above. A short test pulse (3 ms) to +120 mV is applied before and after the conditioning pulse, and inactivation is calculated as the percent reduction in the tail current (measured at −40 mV) elicited by the termination of the test pulse. Tail currents typically reached their peak magnitude in 100 μs. We have previously shown (Gera and Byerly 1999) that this protocol gives a valid measure of inactivation and also avoids errors due to H+ currents. These tail-current measurements are also not contaminated by gating currents or other currents not flowing through Ca2+ channels. This is shown by reducing the concentration of permeant ions in the extracellular solution and observing that as the permeant ion concentration approaches zero, the tail current measurement also approaches zero (Gera and Byerly 1999).
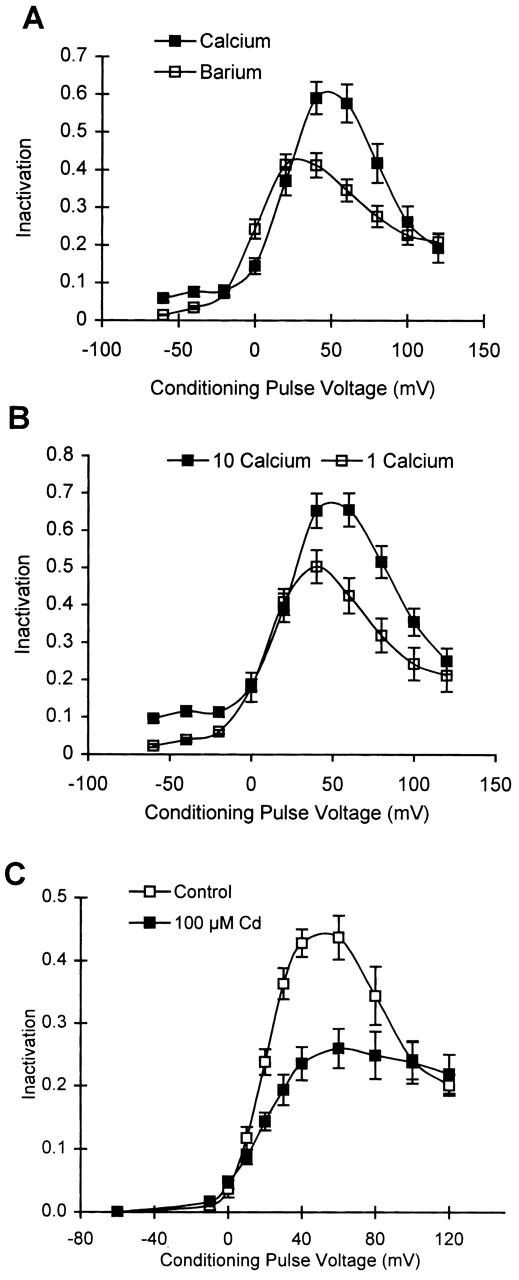
Figure 2.

Inactivation in cells containing 5 mM EGTA is independent of Ca2+ influx. (A) Average inactivation curves obtained in external Ca2+ (▪) and in external Ba2+ (□). (B) Average inactivation curves in 10 (▪) and 1 (□) mM extracellular Ca2+. The same population of cells was used for both solutions in each study (n = 6 and 7 for A and B, respectively). A test-pulse voltage of +30 mV is used in external Ba2+ in A, and in 1 mM external Ca2+ in B, to compensate for the leftward shift in the activation curve. (C) Average inactivation curves obtained in cells containing either 5 mM EGTA (▪; n = 31) or 11 mM BAPTA (□; n = 4). 1 mM CaCl2 was added with 11 mM BAPTA to keep the resting levels of intracellular Ca2+ about the same as for 5 mM EGTA. (D) Average inactivation curves in control external solution (▪), and upon the addition of 100 μM external Cd2+ (□) in cells containing 5 mM EGTA (n = 4).
Analysis
Statistical analyses were performed using Systat software (Version 6; SPSS Inc.) and the corrected R2 parameter was used to determine the quality of fit of a model to the experimental data.
RESULTS
Ca2+ Channel Inactivation in Cells Containing 5 mM EGTA Is Independent of Ca2+ Influx
Inactivation is measured using a three-pulse protocol (Fig. 1 A). In this protocol, a short test pulse is applied before and after a conditioning pulse to variable potentials, and inactivation is measured as the percentage reduction in the test pulse current due to the conditioning pulse. There is a 20-ms gap at the holding potential between the conditioning pulse and the second test pulse, which is necessary to allow background currents activated during the conditioning pulse to completely deactivate. However, it also results in some Ca2+ channels recovering from inactivation during the gap. Thus, our measurement of inactivation relates to the fraction of Ca2+ channels that are still inactivated at the end of a 20-ms gap. Inactivation measured this way in cells containing a high level of intracellular Ca2+ buffer (5 mM EGTA) is relatively small (the peak inactivation being ∼0.25), and exhibits a bell-shaped voltage dependence (Fig. 1 B). We show below that the inactivation measured in these conditions is independent of Ca2+ influx.
A common test for the presence of Ca2+-dependent inactivation is to compare inactivation of Ca2+ currents with that of Ba2+ currents. The underlying assumption is that the intracellular site, which mediates Ca2+-dependent inactivation, is less sensitive to Ba2+ ions than to Ca2+ ions. Therefore, the current-dependent component of inactivation during Ba2+ influx would be reduced, as compared with that during Ca2+ influx. Exchanging external Ca2+ with Ba2+ does not cause a reduction in the levels of peak inactivation measured in Lymnaea neurons containing 5 mM EGTA (Fig. 2 A), suggesting that there is very little Ca2+-dependent inactivation in this case. The leftward shift in the inactivation curve observed with external Ba2+ can be explained on the basis of the shift of Ba2+ current activation to potentials lower than those for Ca2+-current activation.
Ca2+-dependent inactivation also implies that inactivation should depend on the amount of Ca2+ influx. This is not true for Lymnaea neurons containing 5 mM EGTA. The standard extracellular solution in our experiments contains 10 mM Ca2+; reducing this concentration 10-fold to 1 mM does not cause a significant reduction in the amount of inactivation measured (Fig. 2 B), even though the current magnitude decreases fourfold.
We also compared inactivation in cells dialyzed with a 5 mM EGTA solution to that in cells dialyzed with an 11 mM BAPTA solution. In the second case, not only is there a higher concentration of a Ca2+ buffer, but the buffer used (BAPTA) is also substantially faster. Consequently, the Ca2+ transients in cells with 11 mM BAPTA should be substantially smaller than those in cells with 5 mM EGTA (Neher 1986). However, the inactivation measured in the two cases is similar (Fig. 2 C), showing that the Ca2+ transients in 5 mM EGTA are already too small to affect inactivation.
Another way of assessing the contribution of Ca2+ influx in Ca2+-channel inactivation is to eliminate all Ca2+ influx, and measure the inactivation of the Ca2+ channel current carried by monovalents (Cox and Dunlap 1994). However, replacing permeant divalent cations with impermeant ones (such as Mg2+) in the extracellular solution causes Lymnaea neurons to develop a large leak current, possibly because of loss of K+ channel selectivity (Armstrong and Lopez-Barneo 1987; Armstrong and Miller 1990). As an alternative approach, we have used 100 μM Cd2+, a Ca2+ channel blocker, to eliminate Ca2+ influx. Cd2+ was chosen because it is known to block Ca2+ channels in a voltage-dependent manner (Byerly et al. 1984b; Swandulla and Armstrong 1989); it is a more effective blocker at positive potentials than at negative ones, and, consequently, currents during a positive pulse are blocked more than the tail currents (measured at negative potentials). Thus, using 100 μM Cd2+ in the external solution, we can block 90% of the Ca2+ influx during a conditioning pulse and still measure inactivation using the tail currents, which are only blocked by 40% (see materials and methods). We find that for cells containing 5 mM EGTA, the amplitude of peak inactivation does not change when 100 μM Cd2+ is added to the external solution (Fig. 2 D), which supports our conclusion that inactivation in 5 mM EGTA is independent of Ca2+ influx. (We consistently observe that Cd2+ also causes a change in the shape of the inactivation curve, which we do not understand.)
We conclude from the four types of experiments described above (Fig. 2, A–D) that Ca2+-channel inactivation in cells containing 5 mM EGTA is entirely voltage dependent and is independent of Ca2+ influx. Ca2+ channels in Lymnaea neurons are capable of exhibiting Ca2+-dependent inactivation when the intracellular Ca2+ buffering is lowered (shown below). Thus, we conclude that 5 mM EGTA reduces intracellular Ca2+ transients to a size where they are incapable of activating the site that mediates Ca2+-dependent inactivation.
Ca2+ Channel Inactivation in Cells Containing 0.1 mM EGTA Has a Current-dependent Component
To demonstrate that Ca2+ channels in Lymnaea neurons are capable of exhibiting Ca2+-dependent inactivation, we compared Ca2+-channel inactivation in two identical populations of neurons loaded with different amounts of intracellular Ca2+ buffer. Cells containing 0.1 mM EGTA show substantially more inactivation than those containing 5 mM EGTA (Fig. 3 A), indicating that increased levels of intracellular Ca2+ lead to an increase in Ca2+ channel inactivation. This result was confirmed with internal perfusion experiments in which intracellular solutions were changed while recording from one cell. Inactivation was first measured when the cells were perfused with a solution containing 5 mM EGTA, and was found to increase if the intracellular solution was changed to one containing only 0.1 mM EGTA (Fig. 3 B). In control experiments, in which the second intracellular solution perfused into the cells was the same as the first, inactivation was not affected by the exchange (data not shown).
Figure 3.

Inactivation of Ca2+ channels is dependent upon intracellular Ca2+ buffering. (A) Average inactivation curves measured for cells containing 0.1 (•, n = 41) and 5 (□, n = 31) mM EGTA. (B) Average inactivation measured in cells, first when they contain an internal solution containing 5 mM EGTA (□), and after the internal solution has been changed to one that contains 0.1 mM EGTA (•), n = 6. In these experiments, the test pulse potential is +30 mV. (C) Inactivation was measured in cells containing different amounts of free EGTA. Each point (○) represents the peak inactivation of a cell containing the specified levels of EGTA and CaCl2 (in millimolar); n = 15 for 5 EGTA alone; n = 7 for 5 EGTA and 2.5 CaCl2; n = 3 for 5 EGTA and 4.5 CaCl2; n = 15 for 0.1 EGTA alone. All the measurements of inactivation included here were taken in the same time period from similar populations of cells. (D) Ca2+-dependent inactivation is independent of steady state levels of Ca2+. Cells were perfused with a solution containing either 0.1 mM EGTA (□) or 5 mM EGTA/2.5 mM CaCl2 (▪). Inactivation is measured using the three-pulse protocol, while steady state levels of Ca2+ are monitored using Fura-2. Inactivation and Ca2+ levels within the cell are measured at different times after going whole-cell. No measurements are taken within the first 5 min to allow for equilibration of Fura-2 and the buffer solution concentrations within the cell. Each symbol represents the average inactivation and Ca2+ concentration in a single cell.
To ensure that it is indeed the Ca2+-buffering properties of EGTA and not some other pharmacological property that contributes to Ca2+-channel inactivation, we measured inactivation in cells where the intracellular solution contained 5 mM EGTA, loaded with different amounts of CaCl2 (Fig. 3 C). Cells containing 5 mM EGTA alone show smaller magnitudes of inactivation than those in which 5 mM EGTA has been loaded with 2.5 mM CaCl2 or 4.5 mM CaCl2, suggesting that it is the concentration of free Ca2+ buffer that is important for determining the amount of inactivation. These solutions of a fixed amount of Ca2+ buffer and variable amounts of CaCl2 also contain slightly different levels of free Ca2+. But the free Ca2+ levels in all these solutions are low (<10−6 M) and do not appear to determine the amount of Ca2+-dependent inactivation (Fig. 3 D, discussed later).
The increased Ca2+ channel inactivation in Lymnaea neurons containing 0.1 mM EGTA is dependent upon Ca2+ influx. In these cells, exchange of an external Ca2+-containing solution with a Ba2+-containing solution causes a significant decline in peak inactivation (Fig. 4 A), even though the magnitude of Ba2+ current is two to three times larger than that of Ca2+ current. Similarly, changing the external Ca2+ concentration from 10 to 1 mM also leads to a decrease in the total Ca2+-channel inactivation measured in cells containing 0.1 mM EGTA (Fig. 4 B). Furthermore, 100 μM Cd2+ in the extracellular solution causes a substantial decrease in inactivation measured in cells containing 0.1 mM EGTA (Fig. 4 C); the remaining inactivation is not significantly different from that in cells with 5 mM EGTA under similar conditions (Fig. 2 D).
Figure 4.
Inactivation in cells with 0.1 mM EGTA is dependent on Ca2+ influx. (A) Average inactivation curves measured in external Ca2+ (▪), and after substitution with Ba2+ (□) in cells containing 0.1 mM EGTA (n = 9). (B) Average inactivation curves obtained in cells containing 0.1 mM EGTA in 10 (▪) and 1 (□) mM external Ca2+, n = 6. (C) Average inactivation curves in control external solution (□), and upon the addition of 100 μM external Cd2+ (▪) in cells containing 0.1 mM EGTA (n = 4).
From these experiments, we conclude that Lymnaea neurons containing 0.1 mM EGTA have both Ca2+- and voltage-dependent components, while those with 5 mM EGTA exhibit only the voltage-dependent component of Ca2+ channel inactivation. For the purposes of this study, we define Ca2+-dependent inactivation in these cells as the difference in inactivation observed with cells containing 0.1 and 5 mM EGTA.
Recovery from and Development of Inactivation
We measured the rates with which the Ca2+ channels recover from inactivation in cells containing 5 or 0.1 mM EGTA. This was done by varying the lengths of the gap after the conditioning pulse in a protocol that measures inactivation using tail currents (see materials and methods). Using this protocol, we find that the recovery of Ca2+ channels from inactivation has a biexponential time course at −60 mV (τfast = 15 ms, τslow = 600 ms; Fig. 5 A). After a conditioning pulse to +120 mV, the rate of recovery in 0.1 mM EGTA is not substantially different from that in 5 mM EGTA. However, after conditioning pulses to +40 and +60 mV (which cause maximal inactivation) the slow component of recovery is much larger for 0.1 mM EGTA compared with that for 5 mM EGTA. This is accompanied by a modest decrease in the magnitude of the fast component of recovery in 0.1 mM EGTA. The fast component of recovery decays rapidly in the first 20 ms; thus, most of the difference observed between inactivation measured in 0.1 and 5 mM EGTA measured using the 20-ms gap (as in Fig. 3 A) is due to the differences in the magnitude of the slow component of recovery in the two conditions. The two separate time constants for the rate of recovery from inactivation indicate that there are two different inactivated states from which the channels are recovering—at negative potentials, recovery from one inactivated state takes place at a considerably faster rate than from the other inactivated state. The effect of Ca2+ is to increase the occupancy of the latter state.
Figure 5.

Kinetics of Ca2+ channel inactivation in Lymnaea neurons. (A) Recovery from inactivation in 0.1 mM EGTA [from a conditioning pulse to +40 (□) and +120 (○) mV] and in 5 mM EGTA [from a conditioning pulse to +60 (▪) and +120 (•) mV]. The data are fitted by a sum of two exponentials with time constants of 15 and 600 ms. (B) Development of inactivation in 0.1 (open symbols) and 5.0 (closed symbols) mM EGTA. The development of inactivation is measured for a conditioning pulse to +60 (squares) and +120 (circles) mV.
We also measured the development of inactivation during conditioning pulses to +60 and +120 mV. The inactivation measurements were made after allowing the channels to recover for 20 ms after conditioning pulses of variable length, and thus are not independent of the recovery rates. During a pulse to +120 mV, inactivation develops with a single time constant of 250 ms in both 0.1 and 5 mM EGTA (Fig. 5 B). However, when the conditioning pulse is to +60 mV, there is an additional faster component (τ = 50 ms), and the amplitude of this component is three times as large in 0.1 as in 5 mM EGTA. These experiments also indicate that the Ca2+ influx during the tail currents at the end of the conditioning pulse does not contribute significantly towards inactivation, since inactivation approaches zero as the conditioning pulse becomes very short. In the discussion, we develop a model of Ca2+-induced inactivation that can account for our observations regarding the kinetics of inactivation in 5 and 0.1 mM EGTA.
Ca2+-dependent Inactivation Does Not Depend Linearly on Ca2+ Influx
We have shown that for cells containing 0.1 mM EGTA, the Ca2+-dependent component of inactivation can be reduced by reducing Ca2+ influx (Fig. 4). The magnitude of Ca2+-dependent inactivation, however, is not linearly related to the amount of Ca2+ influx. This conclusion is demonstrated by the experiment in which the Ca2+ channel blocker Co2+ was used to reduce the influx of Ca2+ during conditioning pulses. This experiment is analogous to the one described above using Cd2+ to block the Ca2+ current, but Co2+ is a weaker Ca2+ channel blocker than Cd2+, and exerts a simpler, non–voltage-dependent block of current (Byerly et al., 1984b). In these experiments, 1 mM Co2+ was used to replace 1 mM of the 10-mM external Ca2+, resulting in a >50% block of Ca2+ currents; yet it was found to have very little effect on Ca2+-channel inactivation (Fig. 6 A). Therefore, relatively small amounts of Ca2+ influx during the conditioning pulse may be sufficient to cause maximal Ca2+-dependent inactivation. We also observe that Ca2+-dependent inactivation reduces to a half when the external Ca2+ is reduced from 10 to 1 mM (Fig. 4 B), even though the peak Ca2+ current is reduced to a fourth. Ca2+-dependent inactivation, in this case, is the difference between the inactivation measured in cells with 0.1 mM EGTA (Fig. 4 B) and that in cells containing 5 mM EGTA (Fig. 2 B).
Figure 6.

Inactivation in 0.1 mM EGTA is not simply related to Ca2+ influx. (A) Peak Ca2+ current at +40 mV (left) and the maximum inactivation (right) measured in 10-mM external Ca2+ (open bars) and in 9 mM Ca2+/1 mM Co2+ (filled bars) for cells containing 0.1 mM EGTA (n = 9). The pulse current has been normalized to the current measured in the control external solution (10 mM Ca2+). The decline in pulse current after the addition of the Co2+-containing solution is mainly due to the block of Ca2+ current by Co2+, but is also due in part to rundown. We estimate that the Co2+ concentration used here blocks half of the Ca2+ current. (B) Peak inactivation is plotted against Ca2+ current density for 53 cells containing 0.1 mM EGTA. Inactivation is not correlated with Ca2+ current density (R2 = 0.02).
Our conclusion that the amount of Ca2+-dependent inactivation is not simply related to the magnitude of Ca2+ influx during the conditioning pulse is also supported by other observations. In cells perfused with 0.1 mM EGTA, the decrease in Ca2+ current over time (due to rundown) is not accompanied by any significant changes in inactivation. Also, there is no obvious correlation between the peak inactivation and the current density measured in the 53 cells containing 0.1 mM EGTA that we studied (Fig. 6 B). It should be noted, however, that peak inactivation is the sum of voltage- and Ca2+-dependent inactivation. It is possible that in the absence of a strong dependence of Ca2+-dependent inactivation on Ca2+ current density, the random variation in voltage-dependent inactivation obscures any weaker correlation between the two quantities in Fig. 6 B.
Intracellular Sources of Calcium Do Not Contribute Towards Ca2+-dependent Inactivation
Effects of basal Ca2+levels on inactivation.
We investigated the possibility that the basal (i.e., steady state) levels of Ca2+ within the cell may affect Ca2+-channel inactivation. Fura-2 measurements indicated that steady state Ca2+ levels in cells containing 0.1 mM EGTA are much higher (70–300 nM) than those in cells containing 5 mM EGTA (5–20 nM). This difference occurs despite the fact that the two intracellular solutions, containing 5 and 0.1 mM EGTA, respectively, have similar low levels of free Ca2+ (2–10 nM, according to Fura-2 measurements in microcuvettes). The increase in free Ca2+ levels in cells perfused with a poorly buffered solution is probably due to a high rate of Ca2+ influx through the plasma membrane. Thus, it is possible that increased Ca2+-channel inactivation observed in cells with 0.1 mM EGTA results from higher basal levels of free Ca2+ inside the cells.
To examine whether differences in basal Ca2+ levels can account for the variations in inactivation measured in different cells, we measured free Ca2+ levels (using Fura-2) and inactivation in cells perfused with an intracellular solution containing either 0.1 mM EGTA or 5 mM EGTA /2.5 mM Ca2+. These two intracellular solutions were chosen since they result in comparable values of free intracellular Ca2+ levels, but have very different Ca2+-buffering capacities. We find that while cells with 0.1 mM EGTA consistently show more inactivation than cells with 5 mM EGTA/2.5 mM Ca2+, there is no correlation between peak inactivation and steady state Ca2+ levels for the 0.1 mM EGTA data (R2 = 0.021, Fig. 3 D). This leads us to believe that the site that mediates Ca2+-dependent inactivation is not sensitive to resting levels of Ca2+ (≤300 nM); instead, intracellular domains of high Ca2+ that are transiently set up when Ca2+ channels are activated must be mediating Ca2+-channel inactivation.
Intracellular sources of calcium ions do not contribute to Ca2+-dependent inactivation.
Recent studies have shown that, in ventricular myocytes, an influx of Ca2+ through voltage-gated Ca2+ channels triggers a release of Ca2+ from the sarcoplasmic reticulum, and it is this release of Ca2+ from intracellular stores that is largely responsible for Ca2+ channel inactivation in these cells (Balke and Wier 1991; Adachi-Akahane et al. 1996). Such a scenario could potentially explain the nonlinear dependence of Ca2+-dependent inactivation on Ca2+ influx (described above). Therefore, we investigated if Ca2+-induced Ca2+ release (CICR) may also play a role in the Ca2+-dependent inactivation of Lymnaea neurons. Ryanodine is known to be an inhibitor of CICR (Friel and Tsien 1992; Orkand and Thomas 1995). Ryanodine (10 μM), applied extracellularly, does not produce any substantial change in inactivation in cells containing 0.1 mM EGTA (peak inactivation is 0.57 ± 0.07 in the control solution and 0.61 ± 0.08 in 10 μM ryanodine, n = 4). Low caffeine (1 mM) is thought to potentiate CICR, while 10 mM caffeine depletes the internal stores of calcium (Friel and Tsien 1992; Orkand and Thomas 1995). However, neither concentration of caffeine has any effect on Ca2+ channel inactivation: peak inactivation is 0.56 ± 0.03 (control), compared with 0.63 ± 0.05, n = 2 (1 mM caffeine), and 0.53 ± 0.03 (control), compared with 0.58 ± 0.05 (n = 3) in 10 mM caffeine. While intracellular Ca2+ levels in Lymnaea neurons were not monitored during these experiments, similar applications of ryanodine and caffeine are effective in changing intracellular Ca2+ levels in other molluscan neurons (Orkand and Thomas 1995). Therefore, we conclude that CICR is not involved in Ca2+-current inactivation in Lymnaea neurons, and that influx of extracellular Ca2+ through the voltage-gated Ca2+ channels is wholly responsible for the Ca2+-dependent component of inactivation.
Intracellular Proteins Involved In Ca2+-dependent Inactivation
Different mechanisms for Ca2+-dependent inactivation have been proposed in the literature. Some researchers have concluded that Ca2+ may bind directly to the Ca2+ channel (de Leon et al. 1995; Neely et al. 1994), or to a protein, such as calmodulin, that is closely associated with the Ca2+ channel (Peterson et al. 1999; Qin et al. 1999; Zühlke et al. 1999), causing Ca2+-dependent inactivation. The result that 5 mM EGTA can completely suppress Ca2+-dependent inactivation leads us to question this model in Lymnaea neurons (see discussion). We think it is likely that intracellular Ca2+ binds to some other cytoplasmic protein at some distance from the channel, which in turn influences the inactivation of Ca2+ channels. This intermediate protein could be involved in phosphorylation (as proposed by Chad and Eckert 1986; Armstrong 1989) or be a component of the cortical cytoskeleton (Johnson and Byerly 1993a, Johnson and Byerly 1994). We examine these hypotheses below.
Serine-threonine phosphorylation is not involved in Ca2+-channel inactivation.
It has been proposed that an increase in cytoplasmic Ca2+ levels may lead to an activation of a Ca2+-dependent phosphatase (or a kinase) that may alter the phosphorylation state of the Ca2+ channel leading to an increase in inactivation (Chad and Eckert 1986). In support of this theory, Schuhmann et al. 1997 have shown that cyclosporin A, an inhibitor of Ca2+-activated protein phosphatase 2B (calcineurin), can substantially reduce the magnitude of Ca2+-dependent inactivation of L-type Ca2+ channels in smooth muscle cells. However, Ca2+ channel inactivation in other preparations has been shown to be insensitive to phosphorylation (Fryer and Zucker 1993; Imredy and Yue 1994; Branchaw et al. 1997). We tested for an effect of phosphorylation in Lymnaea Ca2+-channel inactivation by extracellularly applying the drug H-7, a broad-range serine/threonine kinase inhibitor. We find that H-7 has no significant effect upon inactivation in cells perfused with 0.1 mM EGTA solution (peak inactivation goes from 0.42 ± 0.04 in control external solution to 0.45 ± 0.04 in the presence of 250 μM H-7, n = 4). Okadaic acid, a phosphatase inhibitor, also has no effect upon inactivation in cells with 0.1 mM EGTA (peak inactivation is 0.60 ± 0.08 in the control solution and 0.61 ± 0.07 in the presence of 5 μM okadaic acid, n = 3). Since okadaic acid is not effective against calcineurin, we also tested for an effect of Cyclosporin A (CsA), a specific inhibitor of calcineurin, on inactivation of Ca2+ channels. Neither acute application of 10 μM CsA during a whole-cell experiment, nor pretreatment of cells with 10 μM CsA for at least 20 h, causes any change in the inactivation of Ca2+ channels (peak inactivation is 0.50 ± 0.02 for cells pretreated with CsA, n = 4, and is 0.52 ± 0.04, n = 7, for cells in the control saline under similar conditions). While we don't have any direct evidence for an effect of these drugs on phosphorylation in Lymnaea neurons, they have been shown to inhibit phosphorylation, or dephosphorylation in similar preparations of other molluscan neurons (Loechner et al. 1992; Yakel 1992; Golowash et al. 1995). Therefore, we believe that serine/threonine phosphorylation does not play any role in the inactivation of Ca2+ channels in Lymnaea neurons; however, our experiments leave open the possibility that tyrosine phosphorylation may be involved.
Cytochalasin B greatly enhances inactivation of Ca2+ channels.
Previous experiments done in our lab have shown that the rundown process of Ca2+ channels in giant inside-out patches is accelerated by the disruption of cytoskeleton (Johnson and Byerly 1993a). To address the question of whether Ca2+-channel inactivation in a whole-cell preparation is influenced by the cytoskeleton, we studied the effects of acute bath application of colchicine and cytochalasin B on Ca2+-channel inactivation. We find that 100 μM colchicine, a microtubule disrupter, has no effect upon inactivation (peak inactivation, in cells containing 5 mM EGTA, is 0.26 ± 0.02 in the control solution and 0.27 ± 0.02 upon addition of 100 μM colchicine, n = 5). However, cytochalasin B, a disrupter of actin microfilaments, causes a large increase in inactivation of Ca2+ channels. This effect of cytochalasin B (which was applied extracellularly, being membrane permeant) is extremely robust and reproducible (Fig. 7 A). Addition of the vehicle by itself produces no change in inactivation. Cytochalasin B causes a rapid and stepwise increase in Ca2+ channel inactivation (Fig. 7 B, ▪). The effect of cytochalasin B is selective for inactivation, since it has very little effect on the magnitude of Ca2+ current (Fig. 7 B, □), and its rate of rundown. Furthermore, the recovery of Ca2+ channels from inactivation is also much slower in the presence of cytochalasin B, primarily because of the increased amplitude of the slow component of recovery (Fig. 7 C), which is similar to the effect of reducing intracellular EGTA concentration. Surprisingly, the effect of cytochalasin B is readily reversible; the Ca2+-channel inactivation returns to its pre–cytochalasin B levels after a few minutes of perfusion with the control external saline.
Figure 7.
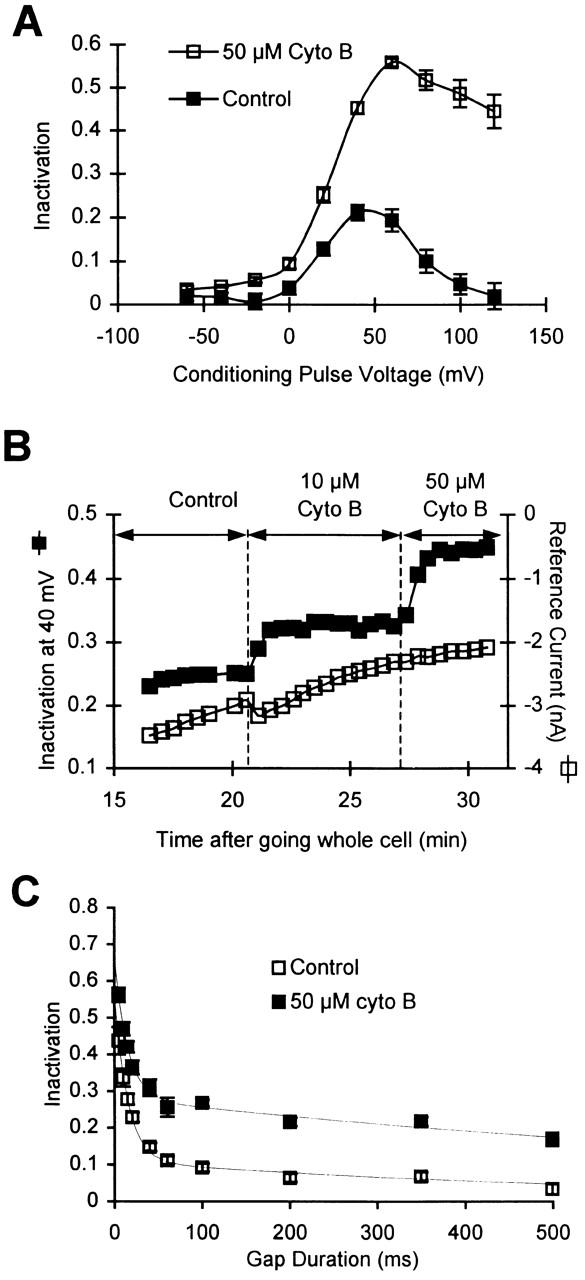
Cytochalasin B increases inactivation in cells containing 5 mM EGTA. (A) Average inactivation curves in the control solutions (▪) and after the addition of 50 μM cytochalasin B (□) in cells containing 5 mM EGTA. (B) Time course of change in Ca2+-channel inactivation and current magnitude upon application of cytochalasin B. Inactivation after a conditioning pulse to +40 mV (▪) was monitored along with peak current during a pulse to +40 mV (□). (C) Rate of recovery from inactivation in 50 μM cytochalasin B (▪) is slower than in the control solution (□). The rates of recovery have been measured by varying the gap duration after a conditioning pulse to +60 mV. The data obtained in cytochalasin B (n = 5–7) are fitted by a sum of two exponentials, with time constants of 15 ms and 1.065 s. The data for control conditions are the same as in Fig. 5 A.
To quantify the effect of cytochalasin B on inactivation, we calculated an f parameter, the fractional increase in inactivation. The f parameter is defined as:
 |
where ΔI is the change in inactivation upon the addition of cytochalasin B, and ΔI max is the maximal possible change in inactivation. We chose f, calculated for a conditioning pulse to +40 mV, f 40 mV, to measure the effect of different concentrations of cytochalasin B upon inactivation in cells with 5 mM EGTA, and obtain the dose–response curve. The concentration of cytochalasin B that causes half the maximal effect on inactivation is ∼100 μM. The effect of cytochalasin B in increasing inactivation in cells with 5 mM EGTA was compared with that for cells with 0.1 mM EGTA. Surprisingly, f 40mV, which is measured at +40 mV, where Ca2+ influx is maximal, is not significantly different in the two cases (Fig. 8), suggesting that the effect of cytochalasin B in increasing inactivation is independent of the Ca2+-dependent inactivation.
Figure 8.

Effect of cytochalasin B on Ca2+ channel inactivation. A shows the absolute inactivation measured for control external solutions (open bars) and after the application of the experimental solution (filled bars), while B shows the f values calculated for changes produced by experimental solutions. The experimental conditions are application of 200 μM cytochalasin B to cells containing 5 mM EGTA (n = 5) and to those containing 0.1 mM EGTA (n = 5), the application of 50 μM cytochalasin B to cells with 5 mM EGTA (n = 5) and to those with 50 μM phalloidin and 5 mM EGTA (n = 2) and application of 100 μM cytochalasin D to cells containing 5 mM EGTA (n = 3). The concentration of cytochalasin D reported here is the amount added; however, this is likely to be higher than the amount actually in solution since some of it precipitated.
While cytochalasin B is known to disrupt the actin cytoskeleton (Cooper 1987), we could not confirm a role of actin filaments in Ca2+-channel inactivation using other cytoskeletal agents. Cytochalasin D, another actin filament disrupter, has no significant effect on Ca2+-channel inactivation in Lymnaea neurons (Fig. 8). Also, internally applied phalloidin, a stabilizer of microfilaments, does not decrease inactivation in cells with 0.1 mM EGTA (data not shown), and is unable to block the effect of extracellularly applied cytochalasin B in cells with 5 mM EGTA (Fig. 8). Moreover, cytochalasin B (50 μM), applied intracellularly, does not increase inactivation (data not shown). It is possible that phalloidin and cytochalasin B, added to the cell through the pipette solution, are unable to reach the cortical cytoskeleton, which alone may be involved in regulating inactivation. However, these results are also consistent with an extracellular effect of cytochalasin B on Ca2+-channel inactivation, and suggest that the effect of cytochalasin B on Ca2+-channel inactivation may be mediated by mechanisms independent of actin microfilaments.
DISCUSSION
In this study, we have characterized the Ca2+ and voltage-dependent inactivation of Ca2+ channels in Lymnaea neurons. Many of the earliest studies describing Ca2+-dependent inactivation of Ca2+ channels were done in molluscan neurons (Tillotson 1979; Eckert and Tillotson 1981). However, these early studies were done before outward H+ currents had been identified in snail neurons (Thomas and Meech 1982; Byerly et al. 1984a), and this may have resulted in erroneous measurements of Ca2+-channel inactivation. Outward H+ currents cannot be pharmacologically isolated from inward Ca2+ currents (Byerly and Suen 1989) and can give the impression of enhanced inactivation of inward currents. We have shown earlier that the three-pulse protocol used to measure inactivation in this study avoids errors due to H+ currents (see materials and methods). For some experiments, we have used tail currents to measure inactivation. This method is also independent of H+ currents because the H+ tail currents deactivate faster than the Ca2+ tail currents at negative potentials (Byerly et al. 1984a), and therefore do not contribute significantly to the measurement of peak Ca2+ tail current (Gera and Byerly 1999).
Much of the recent work in Ca2+-channel inactivation has focussed on the study of recombinant channels expressed in heterologous systems (Neely et al. 1994; de Leon et al. 1995; Adams and Tanabe 1997; Zhou et al. 1997; Peterson et al. 1999), and as such has been successful in avoiding the problems of overlapping currents. However, Ca2+-channel inactivation, especially the Ca2+-dependent component, is greatly influenced by the intracellular environment of the channel (Isom et al. 1994; Johnson and Byerly 1994; Schuhmann et al. 1997), which may be very different in a heterologous system compared with the native cell. Hence, study of Ca2+ channels in their native environments provides a necessary complement to the molecularly defined study of these channels in heterologous systems.
Bell-shaped Inactivation Curve in the Absence of Ca2+-dependent Inactivation
Ca2+-channel inactivation in Lymnaea neurons perfused with 5 mM EGTA solution is not affected by replacing external Ca2+ by Ba2+ (Fig. 2 A), reducing the Ca2+ influx (Fig. 2B and Fig. D), or by increasing the level of intracellular Ca2+ buffering (Fig. 2 C). We conclude from this that Ca2+ channels in Lymnaea neurons containing 5 mM EGTA exhibit only voltage-dependent inactivation, even though the inactivation curve in 5 mM EGTA is bell shaped. A bell-shaped inactivation curve has often been taken as evidence for the presence of Ca2+-dependent inactivation, though previous studies of native Ca2+ channels in bullfrog sympathetic neurons (Jones and Marks 1989) and of recombinant Ca2+ channels in HEK 293 cells (Patil et al. 1998) have also shown that purely voltage-dependent mechanisms can yield bell-shaped inactivation curves. Our results extend those of the earlier studies, for we show that even in Ca2+ channels capable of Ca2+-dependent inactivation, a bell-shaped inactivation curve is not always correlated with the presence of Ca2+-dependent inactivation.
Jones and Marks 1989 have proposed a model where the inactivated state of the channel is reached with highest probability from the open state, but the probability of this transition decreases with increasing voltage. Patil et al. 1998 have proposed a different model where the inactivated state is reached only from intermediate closed states. This model predicts that one long depolarizing step causes less inactivation than the cumulative inactivation caused by a number of shorter steps to the same voltage. However, experiments in Lymnaea neurons failed to conform to this prediction, but this model cannot be ruled out altogether. The model proposed by Correa and Bezanilla 1994 for Na+ channel inactivation in squid giant axons predicts the existence of another open state that is preferentially reached from the inactivated state, and such a model also yields a bell-shaped inactivation curve. Another possibility is that the bell-shaped inactivation curve results from an inactivation process that increases monotonically with voltage combined with a “facilitation” process that increases at higher voltages. Such a facilitation of L-type current by very positive voltages has been reported, and is accompanied by a slowing of deactivation kinetics after long, positive prepulses (Fleig and Penner 1995; Slesinger and Lansman 1996); this slowing of deactivation kinetics is also observed in Lymnaea channels (Gera and Byerly 1999). However, we believe that the process that underlies the slowing of deactivation kinetics in Lymnaea neurons is of a different nature than the one that leads to the bell-shaped inactivation curve. This is because the change in deactivation kinetics lasts only a very short time after the conditioning pulse, and the 20-ms gap before the second test pulse eliminates it. However, the inactivation curve measured is consistently bell shaped. It is possible, though, that some other facilitatory process not involving a change in deactivation kinetics may be involved. While a number of models are adequate for explaining the bell-shaped inactivation curves that we obtain, we do not have any evidence that strongly favors one model over another.
Kinetics of Ca2+-channel Inactivation
We show that increased intracellular Ca2+ concentration increases the time that Ca2+ channels require to recover from inactivation. The effect of Ca2+ in inhibiting the recovery of channels from inactivation at negative potentials has been observed before (Yatani et al. 1983; Gutnick et al. 1989; Branchaw et al. 1997); however, our results differ from those of the previous studies in that we do not observe a change in the time constants of inactivation due to Ca2+ influx, but only a change in the relative amplitudes of the fast and slow components.
It is more difficult to interpret our results pertaining to the development of inactivation (shown in Fig. 5 B) since the measurements of inactivation are dependent on the rate of recovery. To explain these observations, we have developed a simple model of the inactivation kinetics of Ca2+ channels at different voltages that fits the data shown in Fig. 5A and Fig. B (the model is shown in Fig. 9, with rate constants at three different voltages given in Table ). In this model, there are two inactivated states, I FR and I SR, that can be reached from the noninactivated states (which have been lumped together as N–I). At negative potentials, recovery from I FR is considerably faster than that from I SR. Ca2+ influx during a conditioning pulse increases the occupancy of the inactivated state I SR, and thus increases the amplitude of the slow component of recovery at negative potentials. Our data can be fit by making only the forward rate constant (αSR) Ca2+ dependent, but we cannot rule out the possibility that the reverse rate constant (βSR) may also be dependent on Ca2+ influx. After repolarization, I FR is depleted rapidly, while I SR is not greatly affected within the first 20 ms. Hence, the difference in inactivation that we measure between 0.1 and 5 mM EGTA with the three-pulse protocol is largely the difference in the I SR components under the two conditions. Also, the model predicts that the actual difference in inactivation between 0.1 and 5 mM EGTA (Fig. 9 B, continuous curves) during the course of a conditioning pulse is smaller than the difference we measure at the end of the 20-ms gap (Fig. 9 B, points and dashed curves). This is so because the proportion of channels in I FR is larger in 5 than in 0.1 mM EGTA; however, the difference measured after a 20-ms gap reflects primarily the difference in the I SR components in the two cases.
Figure 9.
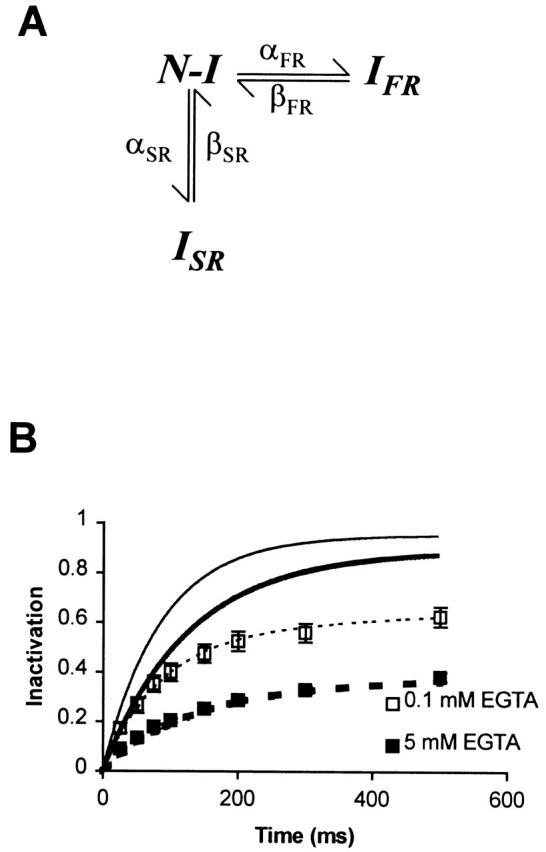
A model of Ca2+ channel inactivation. (A) A schematic diagram of the model. Channels can transition between the noninactivated state N-I, and the two inactivated states I SR and I FR, with forward rate constants αSR and αFR, and reverse rate constants βSR and βFR, respectively. (B) The development of inactivation as predicted by the model. The continuous lines show the development of inactivation for a conditioning pulse to +60 mV and the dashed lines represent the corresponding amount of inactivation that remains after a gap of 20 ms as predicted by the model. The heavy lines represent the inactivation in 5 mM EGTA and the thin lines, that in 0.1 mM EGTA. The symbols represent the experimental data for 5 (▪) and for 0.1 (□) mM EGTA.
Table 1.
Rate Constants Used in the Model of Ca2+ Channel Inactivation (Fig. 9 A)
| Voltage | |||
|---|---|---|---|
| −60 mV | +60 mV | +120 mV | |
| αFR | 0 | 0.006 | 0.0035 |
| βFR | 0.06 | 0.001 | 0.001 |
| αSR | 0 | 0.001 | 0.0004 |
| (in 0.1 mM EGTA) | (0) | (0.005) | (0.0009) |
| βSR | 0.0015 | 0.0001 | 0.0001 |
All rate constants are expressed in units of ms−1. αSR is Ca2+ sensitive; its values in 0.1 mM EGTA are given in parenthesis.
Since inactivation in 5 mM EGTA is completely voltage dependent, these results imply that αSR is not zero at positive voltages even in 5 mM EGTA, and a conditioning pulse to +60 mV causes some occupancy of I SR.
In this analysis, we have assumed that there is only one class of Ca2+ channels in Lymnaea neurons. Pharmacological and kinetic studies done in our lab have failed to resolve more than one component of Ca2+ current, though multiple types of Ca2+ channels cannot be ruled out. In such a case, is it possible that Ca2+- and voltage-dependent inactivation are due to different channel types that gate independently of each other? The results from our kinetic analyses (Fig. 5 A) show that the magnitude of voltage-dependent inactivation is reduced in the presence of Ca2+-dependent inactivation (since the fast component of recovery is smaller in 0.1 than in 5 mM EGTA), which indicates that these phenomena are not independent of each other. It is, therefore, unlikely that different channel types underlie voltage- and Ca2+-dependent inactivation.
Saturation of Ca2+-dependent Inactivation
Our results with the Ca2+ channel blocker Co2+ indicate that just half of the Ca2+ influx under standard conditions may be adequate to almost saturate the Ca2+-dependent component of inactivation (Fig. 6 A). To illustrate the relation between Ca2+-dependent inactivation and Ca2+ influx, we plotted Ca2+-dependent inactivation against Ca2+ influx for a typical cell in Fig. 10. Fig. 10 (▪, connected by a continuous line) shows the relation between these two quantities for each of the conditioning pulse potentials with 10 mM external Ca2+. The general shape of these points shows that the Ca2+-dependent inactivation is not linearly related to the Ca2+ influx, and that Ca2+ influx during pulses from +30 to +80 mV (with 10 mM external Ca2+) causes considerable saturation of the Ca2+-dependent component of inactivation. The shape of this curve is in good agreement with the 20% reduction in peak Ca2+-dependent inactivation that is caused by a 50% reduction in Ca2+ influx with 1 mM Co2+ (Fig. 10, ○). The result that a fourfold reduction in Ca2+ influx, caused by reducing extracellular Ca2+ from 10 to 1 mM, only blocks half of the peak Ca2+-dependent inactivation also fits this same relationship (Fig. 10, ▵).
Figure 10.

Transfer curve showing Ca2+-dependent inactivation plotted against Ca2+ influx. Ca2+-dependent inactivation for control conditions (10 mM external Ca2+, ▪) is calculated as the difference between inactivations measured in 0.1 and 5 mM EGTA. Ca2+ influx is estimated from the peak Ca2+ current and the amount of inactivation that takes place during the conditioning pulse. Peak Ca2+ current is calculated from the number of open Ca2+ channels (as measured by tail currents) and the open channel current–voltage relation. Ca2+ influxes during the first test pulse and the tail current after the conditioning pulse are also included, although the latter makes little contribution. The Ca2+ influx and the Ca2+-dependent inactivation are normalized to their peak values. The reduction in peak Ca2+-dependent inactivation on replacing 10 mM Ca2+ with 9 mM Ca2+/1 mM Co2+ (○), and on reducing the external Ca2+ from 10 to 1 mM Ca2+ (▵) are plotted against the reductions in Ca2+ influx. Peak average inactivation measured in 5 mM EGTA under control conditions has been subtracted from the peak inactivation measured in the presence and absence of Co2+, and in 10 and 1 mM external Ca2+ to give the change in the Ca2+-dependent component.
Mechanisms of Ca2+-dependent Inactivation
Several researchers have proposed that Ca2+ may cause inactivation by binding to a site on the channel itself (Sherman et al. 1990; Neely et al. 1994), or to an associated protein in the channel complex (Peterson et al. 1999; Qin et al. 1999; Zühlke et al. 1999). However, we do not think that is the case in Lymnaea Ca2+ channels, mainly because of two observations. The first is that 5 mM EGTA is able to suppress Ca2+-dependent inactivation completely. Since EGTA is a slow Ca2+ buffer, 5 mM EGTA is fairly ineffective in reducing Ca2+ concentration at the mouth of the channel and makes a significant contribution only at some distance from the channel. A mobile Ca2+ buffer attenuates the intracellular Ca2+ transient exponentially with distance from the channel, the space constant being ∼60 nm for 5 mM EGTA (Neher 1986). At distances smaller than the space constant, the buffer has little effect on the Ca2+ transient. Hence, we think the Ca2+-sensitive site mediating Ca2+-dependent inactivation of Lymnaea Ca2+ channels must be at least 100 nm away from the channel itself. Secondly, if there were a Ca2+-binding site on the Ca2+-channel complex that causes the inactivation of the channel, then this site would have a low affinity for Ca2+ (in the range of a few hundred micromolar, which is the concentration of Ca2+ at the inner mouth of an open channel). However, Ca2+ channels in Lymnaea neurons are sensitive to much lower levels of intracellular Ca2+. Perfusing these neurons with intracellular solutions buffered to 2 μM Ca2+ causes a rapid loss of Ca2+ current as soon as the intracellular saline diffuses within the cells (Byerly and Moody 1984). Also, a sudden increase in the Ca2+ levels to a few hundred nanomolar by flash photolysis of Ca2+-loaded DM-nitrophen causes a reversible decrease in Ca2+ current (Johnson and Byerly 1993b). We interpret these results to mean that the site mediating Ca2+-channel inactivation is sensitive to lower levels of intracellular Ca2+ and, therefore, cannot be on the channel. Here we are assuming that the inactivation of Ca2+ channels (as measured by 150-ms-long pulses), rundown (which develops with a much slower time course of minutes in whole-cell preparations and is largely irreversible) and block of Ca2+ current by intracellular Ca2+ (which has a time course of a few milliseconds) are all caused by similar mechanisms and, hence, have similar sensitivities to intracellular Ca2+. It is possible, however, that the mechanism of inactivation is independent of rundown and Ca2+ block; in which case, we cannot use the above results to estimate the Ca2+ sensitivity of the site mediating Ca2+-dependent inactivation.
Studies on vertebrate L-type Ca2+ channels have led several researchers to conclude that Ca2+-dependent inactivation in these channels is caused by Ca2+-ion binding directly to the channel or to a site closely associated with it (Shirokov et al. 1993; Imredy and Yue 1994; de Leon et al. 1995; Peterson et al. 1999; Qin et al. 1999; Zühlke et al. 1999). Giannattasio et al. 1991 showed that L-type Ca2+ channels in a smooth muscle-derived cell line have Ca2+-dependent inactivation even in the presence of 10 mM intracellular BAPTA, suggesting that the Ca2+-binding site is very close to the Ca2+ pore. This view has been supported by the identification of a putative Ca2+ binding domain (an E-F hand) on the COOH terminal of the mammalian α1C subunit of the Ca2+ channel that controls the Ca2+-dependent inactivation of these channels (de Leon et al. 1995), although some studies suggest that the binding of Ca2+ ions to this site is unimportant for Ca2+-dependent inactivation (Zhou et al. 1997; Bernatchez et al. 1998). Recent studies on Ca2+ channels containing the α1C subunit suggest that the channel is stably complexed with calmodulin, and it is the binding of Ca2+ ions to calmodulin that causes inactivation of the Ca2+ channel (Peterson et al. 1999; Qin et al. 1999; Zühlke et al. 1999). Considering that 5 mM intracellular EGTA completely eliminates Ca2+-dependent inactivation in Lymnaea neurons, it is likely that vertebrate L-type Ca2+ channels have a different mechanism for Ca2+-dependent inactivation than do the Ca2+ channels in Lymnaea neurons.
Effect of Cytochalasin B on Ca2+-channel Inactivation
Several studies have shown that voltage-gated Ca2+ channels are sensitive to the state of the cytoskeleton (Fukuda et al. 1981; Johnson and Byerly 1993a; Johnson and Byerly 1994; Furukawa et al. 1997). However, the role of the cytoskeleton in modulating Ca2+ current is less clear. One study in chick ventricular myocytes shows that colchicine (a microtubule disrupter) and taxol (a microtubule stabilizer) strongly influence the inactivation kinetics of L-type Ca2+ channels (Galli and DeFelice 1994). This is in contrast with the present study, where we find that the inactivation of Lymnaea channels is not affected by 100 μM colchicine.
In this study, we have shown that cytochalasin B, an actin microfilament disrupter, increases the inactivation of Ca2+ channels; however, there is some suggestion in our results that actin filaments may not be involved in this effect of cytochalasin B on inactivation. First, the concentration of cytochalasin B that results in half-maximal increase in inactivation is ∼100 μM, which is very high for an effect on actin filaments. Second, cytochalasin D does not yield the same affect as cytochalasin B (Fig. 8). Also, cytochalasin B applied intracellularly does not increase the amount of inactivation measured, and phalloidin applied intracellularly cannot block the effect of extracellularly applied cytochalasin B (Fig. 8). (Although, in the last two instances, it is questionable whether these drugs can effectively diffuse through the cytoplasm to reach the cytoskeleton close to the membrane.) Additionally, the time course of the onset of the cytochalasin B effect is very fast, limited only by the delay in application, and the effect is readily and completely reversible, inactivation returning to its original levels within minutes of perfusion with the control solution. This suggests that cytochalasin B may have only an extracellular effect.
The mechanism by which cytochalasin B increases inactivation currently remains unresolved. Cytochalasin B is known to inhibit the glucose transporter (Cooper 1987); however, glucose is not present in the extracellular medium at the time of the experiments. Thus, the effect of cytochalasin B on the glucose transporter is unlikely to explain the increase in Ca2+ channel inactivation. Our results are consistent with the model where cytochalasin B acts as a weak open channel blocker, entering the pore from the external side. The slow time constant of recovery from inactivation that we observe in cytochalasin B may be due to the slow rate of dissociation of cytochalasin B from the pore. More experiments are required to distinguish whether actin filaments play a role in inactivation, or if cytochalasin B acts like an open channel blocker.
These studies leave unknown the mechanisms of Ca2+ channel inactivation in Lymnaea neurons. While we conclude that serine/threonine phosphorylation does not play any role in Ca2+ channel inactivation, it is possible that tyrosine phosphorylation may be involved. Indeed, tyrosine phosphorylation has been shown to modulate excision-activated Ca2+ channels in Lymnaea (Pafford et al. 1995). We cannot rule out a role of the actin cytoskeleton in Ca2+-dependent inactivation, although the large effect of cytochalasin B on inactivation is unlikely to involve the cytoskeleton. Recent studies suggest that calmodulin may cause Ca2+-dependent inactivation of mammalian L- and P/Q-type channels by interacting directly with the cytoplasmic domains of the α1 subunits in a Ca2+-dependent manner (Zühlke and Reuter 1998; Lee et al. 1999; Peterson et al. 1999; Qin et al. 1999; Zühlke et al. 1999). This remains a possibility for Lymnaea Ca2+ channels also, although our results suggest that the Ca2+ receptor in Lymnaea neurons is not stably associated with the Ca2+ channel (as suggested by these studies for the L-type channels). Other intracellular proteins, such as G-proteins or phospholipid kinases, could also be involved in Ca2+-dependent inactivation of Ca2+ channels.
Acknowledgments
We thank Dr. John P. Walsh and Dr. Barry D. Johnson for helpful comments on an early version of this manuscript.
This work was supported by the National Institutes of Health grant NS-28484.
References
- Adachi-Akahane S., Cleemann L., Morad M. Cross-signaling between L-type Ca2+ channels and ryanodine receptors in rat ventricular myocytes. J. Gen. Physiol. 1996;108:435–454. doi: 10.1085/jgp.108.5.435. [DOI] [PMC free article] [PubMed] [Google Scholar]
- Adams B., Tanabe T. Structural regions of the cardiac Ca channel α1C subunit involved in Ca-dependent inactivation. J. Gan. Physiol. 1997;110:379–389. doi: 10.1085/jgp.110.4.379. [DOI] [PMC free article] [PubMed] [Google Scholar]
- Armstrong C.M., Lopez-Barneo J. External calcium ions are required for potassium channel gating in squid neurons. Science. 1987;236:712–714. doi: 10.1126/science.2437654. [DOI] [PubMed] [Google Scholar]
- Armstrong D.L. Calcium channel regulation by calcineurin, a Ca2+-activated phosphatase in mammalian brain. Trends Neurosci. 1989;12:117–122. doi: 10.1016/0166-2236(89)90168-9. [DOI] [PubMed] [Google Scholar]
- Armstrong C.M., Miller C. Do voltage-dependent K+ channels require Ca2+? A critical test employing a heterologous expression system. Proc. Natl. Acad. Sci. USA. 1990;87:7579–7582. doi: 10.1073/pnas.87.19.7579. [DOI] [PMC free article] [PubMed] [Google Scholar]
- Ashcroft F.M., Stanfield P.R. Calcium inactivation in skeletal muscle fibres of the stick insect Carausius morosus . J. Physiol. 1982;330:349–372. doi: 10.1113/jphysiol.1982.sp014345. [DOI] [PMC free article] [PubMed] [Google Scholar]
- Balke C.W., Wier W.G. Ryanodine does not affect calcium current in guinea pig ventricular myocytes in which Ca2+ is buffered. Circ. Res. 1991;68:897–902. doi: 10.1161/01.res.68.3.897. [DOI] [PubMed] [Google Scholar]
- Bernatchez G., Talwar D., Parent L. Mutations in the EF-hand motif impair the inactivation of barium currents of the cardiac α1C channel. Biophys. J. 1998;75:1727–1739. doi: 10.1016/S0006-3495(98)77614-3. [DOI] [PMC free article] [PubMed] [Google Scholar]
- Branchaw J.L., Banks M.I., Jackson M.B. Ca2+- and voltage-dependent inactivation of Ca2+ channels in nerve terminals of the neurohypophysis. J. Neurosci. 1997;17:5772–5781. doi: 10.1523/JNEUROSCI.17-15-05772.1997. [DOI] [PMC free article] [PubMed] [Google Scholar]
- Brehm P., Eckert R. Calcium entry leads to inactivation of calcium channel in Paramecium . Science. 1978;202:1203–1206. doi: 10.1126/science.103199. [DOI] [PubMed] [Google Scholar]
- Byerly L., Hagiwara S. Calcium currents in internally perfused nerve cell bodies of Limnea stagnalis . J. Physiol. 1982;322:503–528. doi: 10.1113/jphysiol.1982.sp014052. [DOI] [PMC free article] [PubMed] [Google Scholar]
- Byerly L., Meech R., William Moody J. Rapidly activating hydrogen ion currents in perfused neurones of the snail, Lymnaea stagnalis J. Physiol. 351 1984. 199 216a [DOI] [PMC free article] [PubMed] [Google Scholar]
- Byerly L., Chase P.B., Stimers J.R. Calcium current activation kinetics in neurones of the snail Lymnaea stagnalis J. Physiol. 348 1984. 187 207b [DOI] [PMC free article] [PubMed] [Google Scholar]
- Byerly L., Moody W.J. Intracellular calcium ions and calcium currents in perfused neurones of the snail, Lymnaea stagnalis . J. Physiol. 1984;352:637–652. doi: 10.1113/jphysiol.1984.sp015314. [DOI] [PMC free article] [PubMed] [Google Scholar]
- Byerly L., Suen Y. Characterization of proton currents in neurones of the snail, Lymnaea stagnalis . J. Physiol. 1989;413:75–89. doi: 10.1113/jphysiol.1989.sp017642. [DOI] [PMC free article] [PubMed] [Google Scholar]
- Chad J.E., Eckert R. An enzymatic mechanism for calcium current inactivation in dialyzed Helix neurones. J. Physiol. 1986;378:31–51. doi: 10.1113/jphysiol.1986.sp016206. [DOI] [PMC free article] [PubMed] [Google Scholar]
- Cooper J.A. Effect of cytochalasin and phalloidin on actin. J. Cell. Biol. 1987;105:1473–1478. doi: 10.1083/jcb.105.4.1473. [DOI] [PMC free article] [PubMed] [Google Scholar]
- Correa A.M., Bezanilla F. Gating of the squid sodium channel at positive potentialsII. Single channels reveal two open states. Biophys. J. 1994;66:1864–1878. doi: 10.1016/S0006-3495(94)80980-4. [DOI] [PMC free article] [PubMed] [Google Scholar]
- Cox D.H., Dunlap K. Inactivation of N-type calcium current in chick sensory neuronscalcium and voltage dependence. J. Gen. Physiol. 1994;104:311–336. doi: 10.1085/jgp.104.2.311. [DOI] [PMC free article] [PubMed] [Google Scholar]
- de Leon M., Wang Y., Jones L., Perez-Reyes E., Wei X., Soong T.W., Snutch T.P., Yue D.T. Essential Ca2+-binding motif for Ca2+-sensitive inactivation of L-type Ca2+ channels. Science. 1995;270:1502–1506. doi: 10.1126/science.270.5241.1502. [DOI] [PubMed] [Google Scholar]
- Eckert R., Tillotson D. Calcium-mediated inactivation of the calcium conductance in caesium-loaded giant neurones of Aplysia californica . J. Physiol. 1981;314:265–280. doi: 10.1113/jphysiol.1981.sp013706. [DOI] [PMC free article] [PubMed] [Google Scholar]
- Eckert R., Chad J.E. Inactivation of Ca Channels. Prog. Biophys. Mol. Biol. 1984;44:215–267. doi: 10.1016/0079-6107(84)90009-9. [DOI] [PubMed] [Google Scholar]
- Fleig A., Penner R. Excessive repolarization-dependent calcium currents induced by strong depolarizations in rat skeletal myoballs. J. Physiol. 1995;489:41–53. doi: 10.1113/jphysiol.1995.sp021028. [DOI] [PMC free article] [PubMed] [Google Scholar]
- Friel D.D., Tsien R.W. A caffeine- and ryanodine-sensitive Ca2+ store in bullfrog sympathetic neurones modulates effects of Ca2+ entry on [Ca2+]i . J. Physiol. 1992;450:217–246. doi: 10.1113/jphysiol.1992.sp019125. [DOI] [PMC free article] [PubMed] [Google Scholar]
- Fryer M.W., Zucker R.S. Ca2+-dependent inactivation of Ca2+ current in Aplysia neuronskinetic studies using photolabile Ca2+ chelators. J. Physiol. 1993;464:501–528. doi: 10.1113/jphysiol.1993.sp019648. [DOI] [PMC free article] [PubMed] [Google Scholar]
- Fukuda J., Kameyama M., Yamaguchi K. Breakdown of cytoskeletal filaments selectively reduces Na and Ca spikes in cultured mammal neurons. Nature. 1981;294:82–85. doi: 10.1038/294082a0. [DOI] [PubMed] [Google Scholar]
- Furukawa K., Fu W.M., Li Y., Wilke W., Kwaitkowski D.J., Maltson M.P. The actin-severing protein gelsolin modulates calcium-channel and NMDA receptor activities and vulnerability to excitotoxicity in hippocampal-neurons. J. Neurosci. 1997;17:8178–8186. doi: 10.1523/JNEUROSCI.17-21-08178.1997. [DOI] [PMC free article] [PubMed] [Google Scholar]
- Galli A., DeFelice L.J. Inactivation of L-type Ca channels in embryonic chick ventricle cellsdependence on the cytoskeletal agents colchicine and taxol. Biophys. J. 1994;67:2296–2304. doi: 10.1016/S0006-3495(94)80715-5. [DOI] [PMC free article] [PubMed] [Google Scholar]
- Gera S., Byerly L. Measurement of calcium channel inactivation is dependent upon the test pulse potential. Biophys. J. 1999;76:3076–3088. doi: 10.1016/S0006-3495(99)77460-6. [DOI] [PMC free article] [PubMed] [Google Scholar]
- Giannattasio B., Jones S.W., Scarpa A. Calcium currents in the A7r5 smooth muscle-derived cell line. Calcium-dependent and voltage-dependent inactivation. J. Gen. Physiol. 1991;98:987–1003. doi: 10.1085/jgp.98.5.987. [DOI] [PMC free article] [PubMed] [Google Scholar]
- Golowash J., Paupardintrisch D., Gerschenfeld H.M. Enhancement by muscarinic agonists of a high voltage-activated Ca2+ current via phosphorylation in a snail neuron. J. Physiol. 1995;485:21–28. doi: 10.1113/jphysiol.1995.sp020709. [DOI] [PMC free article] [PubMed] [Google Scholar]
- Grynkiewicz G., Poenie M., Tsien R.Y. A new generation of Ca2+ indicators with greatly improved fluorescence properties. J. Biol. Chem. 1985;260:3440–3450. [PubMed] [Google Scholar]
- Gutnick M.J., Lux H.D., Swandulla D., Zucker H. Voltage-dependent and calcium-dependent inactivation of calcium channel current in identified snail neurones. J. Physiol. 1989;412:197–220. doi: 10.1113/jphysiol.1989.sp017611. [DOI] [PMC free article] [PubMed] [Google Scholar]
- Hagiwara S., Ohmori H. Studies of calcium channels in rat clonal pituitary cells with patch electrode voltage clamp. J. Physiol. 1982;331:231–252. doi: 10.1113/jphysiol.1982.sp014371. [DOI] [PMC free article] [PubMed] [Google Scholar]
- Hodgkin A.L., Huxley A.F. The dual effect of membrane potential on the sodium conductance in the squid axon of Loligo . J. Physiol. 1952;116:497–506. doi: 10.1113/jphysiol.1952.sp004719. [DOI] [PMC free article] [PubMed] [Google Scholar]
- Imredy J.P., Yue D.T. Mechanism of Ca2+-sensitive inactivation of L-type Ca2+ channels. Neuron. 1994;12:1301–1318. doi: 10.1016/0896-6273(94)90446-4. [DOI] [PubMed] [Google Scholar]
- Isom L.L., Jongh K.S.D., Catterall W.A. Auxiliary subunits of voltage-gated ion channels. Neuron. 1994;12:1183–1194. doi: 10.1016/0896-6273(94)90436-7. [DOI] [PubMed] [Google Scholar]
- Johnson B.D., Byerly L. A cytoskeletal mechanism for Ca2+ channel metabolic dependence and inactivation by intracellular Ca2+ Neuron. 10 1993. 797 804a [DOI] [PubMed] [Google Scholar]
- Johnson B.D., Byerly L. Photo-released intracellular Ca2+ rapidly blocks Ba2+ current in Lymnaea neurons J. Physiol. 462 1993. 321 347b [DOI] [PMC free article] [PubMed] [Google Scholar]
- Johnson B.D., Byerly L. Ca2+ channel Ca2+-dependent inactivation in a mammalian central neuron involves the cytoskeleton. Pflügers Arch. 1994;429:14–21. doi: 10.1007/BF02584025. [DOI] [PubMed] [Google Scholar]
- Jones S.W., Marks T.N. Calcium currents in bullfrog sympathetic neurons. II. Inactivation. J. Gen. Physiol. 1989;94:169–182. doi: 10.1085/jgp.94.1.169. [DOI] [PMC free article] [PubMed] [Google Scholar]
- Lee A., Wong S.T., Gallagher D., Li B., Storm D.R., Scheuer T., Catterall W.A. Ca2+/calmodulin binds to and modulates P/Q-type calcium channels. Nature. 1999;399:155–159. doi: 10.1038/20194. [DOI] [PubMed] [Google Scholar]
- Lee K.S., Marban E., Tsien R.W. Inactivation of calcium channels in mammalian heart cellsjoint dependence on membrane potential and intracellular calcium. J. Physiol. 1985;364:395–411. doi: 10.1113/jphysiol.1985.sp015752. [DOI] [PMC free article] [PubMed] [Google Scholar]
- Loechner K.J., Mattessicharrandale J., Azhderian E.M., Kaczmarek L.K. Inhibition of peptide release from invertebrate neurons by the protein-kinase-inhibitor H-7. Brain Res. 1992;581:315–318. doi: 10.1016/0006-8993(92)90724-n. [DOI] [PubMed] [Google Scholar]
- Neely A., Olcese R., Wei X., Birnbaumer L., Stefani E. Ca2+-dependent inactivation of cloned cardiac Ca2+ channel α1 subunit (α1C) expressed in Xenopus oocytes. Biophys. J. 1994;66:1895–1903. doi: 10.1016/S0006-3495(94)80983-X. [DOI] [PMC free article] [PubMed] [Google Scholar]
- Neher E. Concentration profiles of intracellular calcium in the presence of a diffusible chelator. Exp. Brain Res. 1986;14:80–96. [Google Scholar]
- Neher E., Eckert R. Fast patch-pipette internal perfusion with minimum solution flow. In: Grinell A.D., Armstrong D., Jackson M.D., editors. Calcium and Ion Channel Modulation. Plenum Publishing Corp; New York, NY: 1988. pp. 371–377. [Google Scholar]
- Neher E. Voltage offsets in patch-clamp experiments. In: Sakman B., Neher E., editors. Single-Channel Recording. Plenum Publishing Corp; New York, NY: 1995. pp. 147–153. [Google Scholar]
- Orkand R.K., Thomas R.C. Effects of low doses of caffeine on [Ca2+]i in voltage-clamped snail (Helix aspersa) neurones. J. Physiol. 1995;489:19–28. doi: 10.1113/jphysiol.1995.sp021026. [DOI] [PMC free article] [PubMed] [Google Scholar]
- Pafford C.M., Simples J.E., Strong J.A. Effects of the protein tyrosine phosphatase inhibitor phenylarsine oxide on excision-activated calcium channels in Lymnaea neurons. Cell Calc. 1995;18:400–410. doi: 10.1016/0143-4160(95)90055-1. [DOI] [PubMed] [Google Scholar]
- Patil P.G., Brody D.L., Yue D.T. Preferential closed-state inactivation of neuronal calcium channels. Neuron. 1998;20:1027–1038. doi: 10.1016/s0896-6273(00)80483-3. [DOI] [PubMed] [Google Scholar]
- Peterson B.Z., DeMaria C.D., Yue D.T. Calmodulin is the Ca2+ sensor for Ca2+-dependent inactivation of L-type calcium channels. Neuron. 1999;22:549–558. doi: 10.1016/s0896-6273(00)80709-6. [DOI] [PubMed] [Google Scholar]
- Qin N., Olcese R., Bransby M., Lin T., Birnbaumer L. Ca2+-induced inhibition of the cardiac Ca2+ channel depends on calmodulin. Proc. Natl. Acad. Sci. USA. 1999;96:2435–2438. doi: 10.1073/pnas.96.5.2435. [DOI] [PMC free article] [PubMed] [Google Scholar]
- Schuhmann K., Romanin C., Baumgartner W., Groschner K. Intracellular Ca2+ inhibits smooth muscle L-type Ca2+ channels by activation of protein phosphatase Type 2B and by direct interaction with the channel. J. Gen. Physiol. 1997;110:503–513. doi: 10.1085/jgp.110.5.503. [DOI] [PMC free article] [PubMed] [Google Scholar]
- Sherman A., Keizer J., Rinzel J. Domain model for Ca2+-inactivation of Ca2+ channels at low channel density. Biophys. J. 1990;58:985–995. doi: 10.1016/S0006-3495(90)82443-7. [DOI] [PMC free article] [PubMed] [Google Scholar]
- Shirokov R., Levis R., Shirokova N., Ríos E. Ca2+-dependent inactivation of cardiac L-type Ca2+ channels does not affect their voltage sensor. J. Gen. Physiol. 1993;102:1005–1030. doi: 10.1085/jgp.102.6.1005. [DOI] [PMC free article] [PubMed] [Google Scholar]
- Slesinger P.A., Lansman J.B. Reopening of single L-type Ca2+ channels in mouse cerebellar granule cellsdependence on voltage and ion concentration. J. Physiol. 1996;491:335–345. doi: 10.1113/jphysiol.1996.sp021219. [DOI] [PMC free article] [PubMed] [Google Scholar]
- Swandulla D., Armstrong C.M. Calcium channel block by cadmium in chicken sensory neurons. Proc. Natl. Acad. Sci. USA. 1989;86:1736–1740. doi: 10.1073/pnas.86.5.1736. [DOI] [PMC free article] [PubMed] [Google Scholar]
- Thomas R.C., Meech R.W. Hydrogen ion currents and intracellular pH in depolarized voltage-clamped snail neurones. Nature. 1982;299:826–828. doi: 10.1038/299826a0. [DOI] [PubMed] [Google Scholar]
- Tillotson D. Inactivation of Ca conductance dependent on entry of Ca ions in molluscan neurons. Proc. Natl. Acad. Sci. USA. 1979;76:1497–1500. doi: 10.1073/pnas.76.3.1497. [DOI] [PMC free article] [PubMed] [Google Scholar]
- Yakel J.L. Inactivation of the Ba2+ current in dissociated Helix neurons—voltage dependence and the role of phosphorylation. Pflügers Arch. 1992;420:470–478. doi: 10.1007/BF00374621. [DOI] [PubMed] [Google Scholar]
- Yatani A., Wilson D.L., Brown A.M. Recovery of Ca currents from inactivationthe roles of Ca influx, membrane potential, and cellular metabolism. Cell. Mol. Neurobiol. 1983;3:381–395. doi: 10.1007/BF00734718. [DOI] [PMC free article] [PubMed] [Google Scholar]
- Zhou J., Olcese R., Qin N., Noceti F., Birnbaumer L., Stefani E. Feedback inhibition of Ca2+ channels by Ca2+ depends on a short sequence of the C terminus that does not include the Ca2+-binding function of a motif with similarity to Ca2+-binding domains. Proc. Natl. Acad. Sci. USA. 1997;94:2301–2305. doi: 10.1073/pnas.94.6.2301. [DOI] [PMC free article] [PubMed] [Google Scholar]
- Zühlke R.D., Reuter H. Ca2+-sensitive inactivation of L-type Ca2+ channels depends on multiple cytoplasmic amino acid sequences of the α1C-subunit. Proc. Natl. Acad. Sci. USA. 1998;95:3287–3294. doi: 10.1073/pnas.95.6.3287. [DOI] [PMC free article] [PubMed] [Google Scholar]
- Zühlke R.D., Pitt G.S., Deisseroth K., Tsien R.W., Reuter H. Calmodulin supports both inactivation and facilitation of L-type calcium channels. Nature. 1999;399:159–162. doi: 10.1038/20200. [DOI] [PubMed] [Google Scholar]