

Abstract
There appears to be a flux of ammonium (NH4 +/NH3) from neurons to glial cells in most nervous tissues. In bee retinal glial cells, NH4 +/NH3 uptake is at least partly by chloride-dependant transport of the ionic form NH4 +. Transmembrane transport of NH4 + has been described previously on transporters on which NH4 + replaces K+, or, more rarely, Na+ or H+, but no transport system in animal cells has been shown to be selective for NH4 + over these other ions. To see if the NH4 +-Cl− cotransporter on bee retinal glial cells is selective for NH4 + over K+ we measured ammonium-induced changes in intracellular pH (pHi) in isolated bundles of glial cells using a fluorescent indicator. These changes in pHi result from transmembrane fluxes not only of NH4 +, but also of NH3. To estimate transmembrane fluxes of NH4 +, it was necessary to measure several parameters. Intracellular pH buffering power was found to be 12 mM. Regulatory mechanisms tended to restore intracellular [H+] after its displacement with a time constant of 3 min. Membrane permeability to NH3 was 13 μm s−1. A numerical model was used to deduce the NH4 + flux through the transporter that would account for the pHi changes induced by a 30-s application of ammonium. This flux saturated with increasing [NH4 +]o; the relation was fitted with a Michaelis-Menten equation with K m ≈ 7 mM. The inhibition of NH4 + flux by extracellular K+ appeared to be competitive, with an apparent K i of ∼15 mM. A simple standard model of the transport process satisfactorily described the pHi changes caused by various experimental manipulations when the transporter bound NH4 + with greater affinity than K+. We conclude that this transporter is functionally selective for NH4 + over K+ and that the transporter molecule probably has a greater affinity for NH4 + than for K+.
Keywords: ammonia, K-Cl cotransporter, neuroglia, pH, Apis
INTRODUCTION
Although transmembrane transport of ammonium in animals has been studied, mainly in the mammalian kidney, there are two well-established cases of fluxes of ammonium from neurons to glial cells in nervous tissue. In vertebrate brain, where glutamate is the main neurotransmitter, the uptake of glutamate by astrocytes followed by its amination to glutamine, which is returned to the neurons and deaminated, implies a flux of ammonium (Benjamin and Quastel 1975; Hassel et al. 1997). In bee retina, the main metabolic substrate of the neurons (photoreceptors) is alanine formed by amination of pyruvate in the predominant glial cells (“outer pigment cells”). The alanine is transferred to the photoreceptors and deaminated to pyruvate and the tissue releases ammonium (Tsacopoulos et al. 1994, Tsacopoulos et al. 1997b; Coles et al. 1996).
Uptake of ammonium into cells can be monitored continuously, but indirectly, by measuring the changes in intracellular pH (pHi) that it causes. Ammonium has a pKa of ∼9.2 in water (Sillén 1964) so that at physiological pH (in the range 6.5–7.5) a fraction in the order of 1% is in the neutral NH3 form. Nearly all cell membranes are permeable to NH3 (but see Singh et al. 1995), so, when ammonium is applied outside a cell, NH3 diffuses into it, combines with H+, and tends to raise pHi (Jacobs 1940). In contrast, in astrocytes cultured from neonatal mouse, application of ammonium lowers pHi because there is an influx of NH4 + whose effect on pHi outweighs the effects of NH3 fluxes (Nagaraja and Brookes 1998). The glial cells in slices of bee retina also take up NH4 + (Coles et al. 1996), an observation that has been confirmed and extended on bundles of glial cells freshly dissociated from adult retinas (Marcaggi et al. 1999). Application of ammonium causes a fall in pHi that requires the presence of external Cl− and is blocked by loop diuretics such as bumetanide (Marcaggi et al. 1999). These observations suggest that NH4 + enters the glial cells by cotransport with Cl− on a transporter with functional similarities to the cation–chloride cotransporters present on many types of cells. The transport on the bee glial cells is not blocked in the absence of Na+ (Marcaggi et al. 1999), indicating that the transport is of the K+-Cl− class rather than the Na+-K+-2Cl− class (see Race et al. 1999).
Several cases have been described of cation-chloride cotransporters, particularly in kidney, being able to transport NH4 + in the place of K+, although with a lower affinity (Kinne et al. 1986). However, in plant roots, transporters are known that are selective for NH4 + over K+ (e.g., Kaiser et al. 1998) so such selectivity is a demonstrated biological possibility. We have found that uptake of NH4 + by the transporter in bee retinal cells is only moderately affected by external [K+]. This suggested that the transporter might be the first to be described in an animal cell that is selective for NH4 + over K+ and prompted us to make a quantitative estimate of its selectivity.
Influx of NH4 + into a cell is generally associated with transmembrane fluxes of NH3 (Boron and De Weer 1976; see Fig. 2 C), so the relation between changes in pHi (ΔpHi) and NH4 + flux (FNH4) is complex. We tackled the question of the NH4 +/K+ selectivity in two stages. First, we deduced FNH4 from ΔpHi for relatively brief applications of ammonium. This required accurate absolute measurements of pHi and measurement of several other parameters: membrane permeability to NH3, intracellular buffering power, and the kinetics of pHi regulation. Use of this “cell model” showed a functional selectivity for NH4 + over K+. We then recorded pHi responses to longer and more complex NH4 + application protocols. By simulating these responses with a standard minimal model for a cotransport process, to which we added competitive inhibition, we estimated the NH4 + and K+ affinities of the transporter molecule.
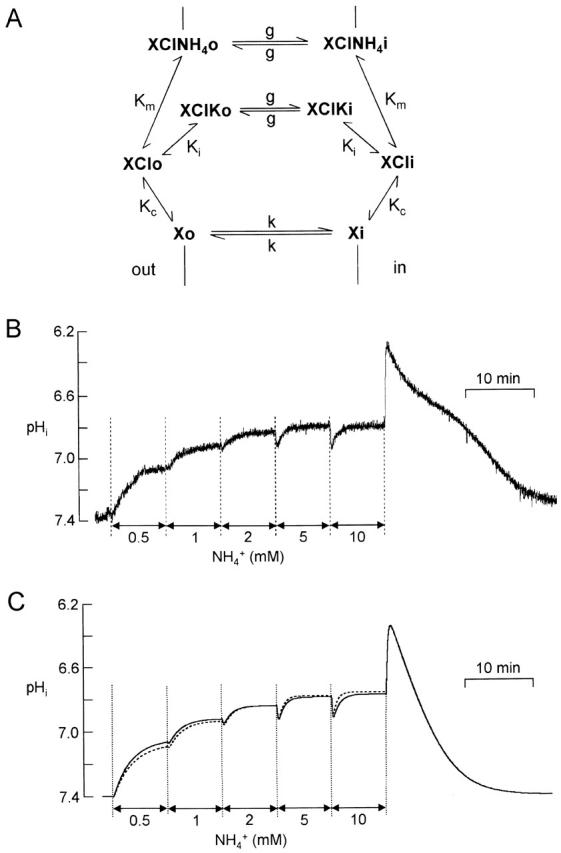
Figure 2.


Effect of extracellular ammonium application on pHi of an isolated bundle of glial cells. (A) The ammonium-induced acidification was slightly inhibited by K+ or Rb+. For each application of 2 mM NH4 +, [K+]o was either maintained at its baseline value of 10 mM, changed as indicated, or replaced by 50 mM Rb+. (B) The response to a 5-min application of 2 mM NH4 + can be divided into five phases, which correspond to different patterns of fluxes (C). This cell had a fairly acid baseline pHi (≈7.17) so that Phase 1 was prominent. (C) Schemes of fluxes corresponding to four of the phases indicated in B. (Phase 1) Inward flux of NH3 is greater than ∼1% of inward flux of NH4 +. The maintenance of intracellular equilibrium NH4 + ↔ NH3 + H+ consumes H+ ions. (Phase 2) NH4 + transmembrane gradient is still inward, while [NH3]i slightly exceeds [NH3]o. H+ ions are shuttled into the cell. (Phase 3) Extrusion of H+ ions by pH regulatory mechanisms equals inward flux of NH4 +. (Phase 4) This phase is approximately the inverse of Phase 1. Phase 5 (not shown) consists almost entirely of H+ efflux. (D) Scheme of transmembrane fluxes during ammonium exposure. pHi changes result from three transmembrane fluxes, FNH4, FNH3, and net H+ flux through pH regulatory processes (Freg) (see text).
MATERIALS AND METHODS
Intracellular pH (pHi) in bundles of glial cells dissociated from the retina of the drone (male) Apis mellifera was measured by techniques developed from those described in Marcaggi et al. 1999. One record is shown (see Fig. 9 D) from an intracellular microelectrode recording of glial membrane potential in a slice of retina prepared and superfused with oxygenated Cardinaud solution, as described previously (e.g., Coles et al. 1996). Unless otherwise stated, results are given as mean ± SD and the two-tailed paired t test was used to determine P values. Errors of quotients were estimated by the calculus of errors (Abramowitz and Stegun 1965).
Figure 9.

Inhibition of inward NH4 + flux by external K+. (A) Comparison of responses to 2 and 5 mM NH4 + in 0 and 10 mM K+. For each response, NH4 + was applied for 30 s; when applied in 0 K+, K+ was removed from the superfusate 15 s earlier. (B) Double inverse plot of mean ΔpHi vs. [NH4 +]o (n = 6). Straight lines passing through mean data points intersect the abscissa at [NH4 +]o = 5.02 mM (0 K+, ○) and 6.90 mM (10 mM K+, •). (C) Double inverse plot of inFNH4 vs. [NH4 +]o. inFNH4 is the mean value during the NH4 + application calculated from ΔpHi of the six experiments of B using the relation of Fig. 8 E. Straight lines passing through mean data points intersect the abscissa for [NH4 +]o = 5.16 mM (0 K+, ○) and 7.09 mM (10 mM K+, •). (D) Intracellular recording from a retinal slice with a microelectrode in the glial compartment. Increasing [K+] from 10 to 20 mM in the superfusate induced a depolarization of the cell membranes. When the same increase of [K+] was made after superfusing the slice with 5 mM barium for a few minutes, the depolarization was undetectable for at least the first 45 s.
Dissociation Procedure and Loading of the Cells
Bees were obtained from A. Dittlo (Villandraut) or J. Kefuss (Toulouse, France) and maintained on sugar water. A slice of drone head ∼500-μm thick was cut with a razor blade. The slice was incubated for 40 min in a 1.5 ml Eppendorf tube containing 1 ml oxygenated Cardinaud solution (see below) to which had been added 2 mg trypsin (T- 4665; Sigma-Aldrich). The slice was washed in Cardinaud solution lacking Ca2+ and Mg2+ and the retinal tissue dissected out and triturated. 150 μl of cell suspension was placed in the perfusion chamber (see below) whose floor consisted of a microscope cover slip coated with poly-l-lysine. The cells were allowed to settle for 10 min and then exposed to the acetoxymethyl ester of 2′,7′-bis(2-carboxyethyl)-5(6)-carboxyfluorescein (BCECF-AM) (Molecular Probes, Inc.) at a concentration of 10 μM for 40 min.
Measurement of Fluorescence
The chamber was placed on the stage of an inverted microscope (Diaphot; Nikon) equipped with a 40× objective, photomultiplier detection, and dual wavelength excitation at 440 and 495 nm switched by liquid crystal shutters, as described in Coles et al. 1999. The stimulating light intensity was attenuated so that fluorescence from a bundle of loaded glial cells excited at 440 nm gave a signal of ∼10,000 photon counts s−1, which remained stable for several hours. Dark noise plus autofluorescence from a bundle of unloaded cells was <2,500 photon counts s−1 for both excitation wavelengths and it was checked that this fluorescence was not affected by ammonium superfusion (n = 4). This background fluorescence was automatically taken into account in the in situ pH calibration of each cell bundle (see below). The excitation pattern was usually: 440 nm, 100 ms; off, 20 ms; 495 nm, 600 ms; off 20 ms. To minimize the noise of the ratio, the signal resulting from excitation near the isosbestic point (440 nm) was averaged over several minutes before the PC computer calculated the ratio using a program available from Jean-Louis Lavie (University Bordeaux, Bordeaux, France).
Solutions
The standard perfusion solution contained (mM): 200 NaCl, 10 KCl, 4 MgCl2, 2 CaCl2. pH was buffered with 10 mM MOPS hemisodium salt and set to 6.90 with HCl. Osmolality was adjusted to 685 mOsm with mannitol (∼240 mM). The salt components, the pH, and the osmolarity of this solution are similar to those measured in vivo (Cardinaud et al. 1994). For other pHs, PIPES, MOPS, or HEPES were used for solutions of pH 6.20–6.50, 6.90–7.50, or 7.70, respectively. Most other variants were obtained by equimolar replacement of NaCl (or by increasing [NaCl] when [KCl] was reduced). Chloride-free solutions were made by replacing Cl− by an equivalent quantity of gluconate and increasing Ca2+ to 8 mM to counteract the chelating effect of gluconate (Kenyon and Gibbons 1977). To test the sensitivity of the responses to ammonium to changes in the osmolarities of solutions, osmolarity was intentionally increased or decreased by 5% (∼34 mOsm) by changing the concentration of mannitol. Such a change in osmolarity had in itself a barely detectable effect on the emission ratio and no detectable effect on the pH response to 2 mM ammonium (n = 3). Therefore, in some experiments, salts such as NH4Cl were simply added to solutions to final concentrations up to 5 mM without a compensatory reduction in [NaCl].
Perfusion System
To be able to make sufficiently rapid solution changes without detaching the cells from the floor of the chamber, we developed a perfusion chamber with no eddy currents. A factor that appeared to be important was the presence of a curved junction between the floor and the wall of the channel (Fig. 1 A). Solutions were gravity fed and selected by computer-controlled solenoid valves whose outflows passed through fine tubes at ∼30 μl s−1 into a common pathway to the chamber. It was found that mixing of solutions was negligible. We obtained a measure of the speed of the solution change in the chamber by recording the change in fluorescence during a switch from standard solution to one containing 1 μg liter−1 fluorescein (Fig. 1 B). The change in pHi measured with BCECF in response to propionate or trimethylamine (TMA) was nearly as fast (see Fig. 4 B and 5 A). The change in fluorescein fluorescence was well described by an exponential; for flow rates used in experiments with cells, the mean time constant was: 5.4 ± 1.9 s (± SD, n = 16), and this exponential was used to describe the changes in extracellular concentration in our numerical models.
Figure 1.
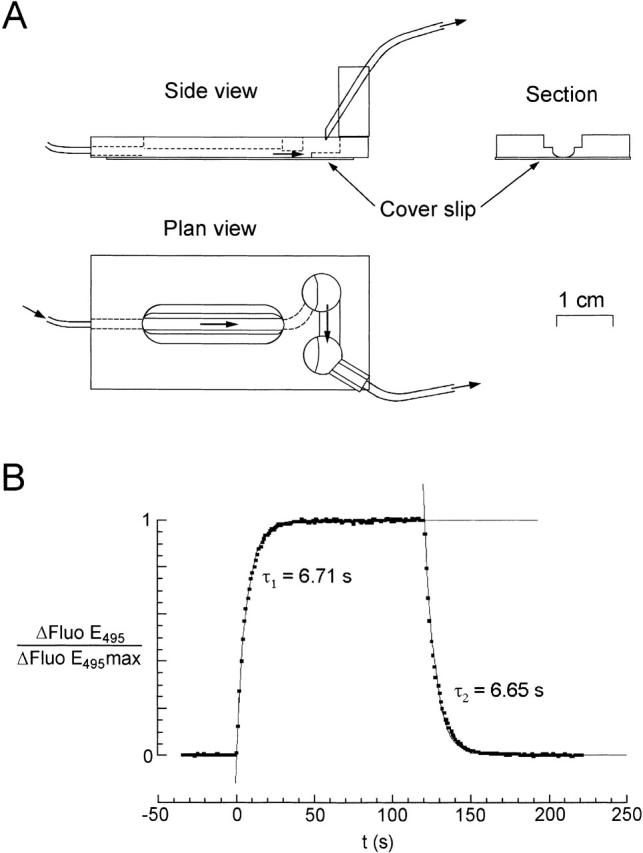
Speed of the solution changes. (A) The perfusion chamber. A channel was milled in a polymethacrylate slab and a glass cover slip was glued on the bottom. Note the rounded edges of the channel. (B) Speed of solution change. The data points show the change in fluorescence observed through the 40× microscope objective focused on cells on the floor of the chamber during a 120-s perfusion change from standard solution to one containing 1 μg liter−1 fluorescein. The time scale was displaced so that zero coincides with the beginning of the fluorescence change. The solid lines represent the best fits of data points obtained by regressions with simple exponentials {1 − exp(−t/τ1) and exp[−(t − 120)/τ2]} whose time constants, τ1 and τ2, are given in the figure.
Figure 4.

Direct measurement of PNH3. (A) A bundle of cells was held with a pipette ∼50 μm above the floor of the chamber and perifused for 30 min in pHo 6.20 to reduce pHi. The cells were then perifused with 0 Cl− solution containing bumetanide 500 μM for 1 min before 10 mM NH4 + o was substituted for Na+ o. (B) A few minutes after the response of A, the same bundle attached to the pipette was perifused with 10 mM propionate in the same conditions. The propionate-induced pHi change gave a lower limit for the speed of the change in solution at the cell membrane.
Calibration of pHi Measurements
We initially used two techniques for calibrating pHi. To estimate the shape of the curve that gives pHi as a function of I440/I495, the cell membranes were made permeable to H+ with nigericin so that pHi varied with pHo (Thomas et al. 1979). At the end of each of 11 experiments, the cells were superfused with 130 mM K+ Cardinaud solution. Perfusion was stopped and nigericin was added to the chamber to a final concentration of 10 μM. After 10 min, cells were quickly superfused with 130 mM K+ Cardinaud solutions at different pHs. It was found that the effect of the nigericin persisted so that it was unnecessary to include it in the calibration solutions: there was no significant difference between calibration curves obtained with solutions containing 5 μM nigericin (n = 4) and those obtained without (n = 7). The value of I495/I440 corresponding to pH 6.84 ([I495/I440]6.84) was estimated by linear interpolation for each of the 11 data sets. I495/I440 was described by the equation of Boyarsky et al. 1988 ():
 |
1 |
The values obtained for the constants were 6.93 ± 0.03 for pK and 0.991 ± 0.022 for b (n = 11). The advantage of this procedure is that calibration for each experiment is reduced to obtaining the fluorescence ratio corresponding to pHi 6.84. This ratio was obtained by superfusing the cells with 2 mM NH4 + at pHo 6.90, a procedure that we found to give a pHi ≈ 6.84 (see Fig. 3, A–D).
Figure 3.

Absolute measurement of pHi during application of 2 mM NH4 +. (A) Recording of BCECF fluorescence ratio from a bundle of glial cells. Different mixtures of propionate (Prop) and trimethylamine (TMA) were applied during prolonged application of 2 mM ammonium, first with pHo = 6.90, and then with pHo = 7.30. (B) In experiments like that of A, pHi was calculated from responses to application of two mixtures of propionate and TMA and ascribed to the time midway between the two applications (e.g., arrows in A and B correspond to the same point). The data points shown are for an ammonium concentration of 2 mM and the solid line is a linear regression through them. The dashed line simply illustrates that the mean initial pHi was 7.3. (C) Summary of results for the pHi measured ∼10 min after application of 2 mM ammonium at pH 6.90. The results for different pairs of weak acids and weak bases are shown separately; for the pair propionate/TMA, a possible dependence on pHi was examined by comparing the mean values for cells with an initial baseline pHi < 7.10 (“acid”) and those with baseline pHi > 7.10 (“alkaline”). Bars show SDs. (D) Absolute pHi reached during 2 mM NH4 + application at pHos 6.50 (n = 7), 6.90 (n = 6), 7.30 (n = 6), and 7.70 (n = 7). The solid line is a linear regression through the data points (R = 0.996), vertical bars represent ±SD, horizontal bars represent the precision of the adjusted pHo of the solutions. (E) Recording showing pHi reached in nigericin 10 μM pHo 6.90 compared with pHi reached in NH4 + 2 mM pHo 6.90.
Absolute Measurement of pHi
The null method of Eisner et al. 1989 was used. Let ΔapHi be the change of pHi that would have been produced by superfusion with a concentration aC of a weak acid AH + A− and ΔbpHi that for a concentration bC of a weak base BH+ + B. Assuming that the diffusion of the neutral form (AH or B) and its re-equilibration with the charged form in the cell are rapid compared with pHi regulatory mechanisms, then:
 |
2a |
 |
2b |
where βi is the buffering power. Let ΔpHi be the net pHi change produced by a simultaneous application of a concentration aC of AH + A− and bC of BH+ + B. ΔpHi = ΔapHi + ΔbpHi.
When ΔpHi ≈ 0, it follows from and that:
 |
3 |
To determine the ratio bC/aC for which ΔpHi ≈ 0, two pairs of concentrations (aC; bC1) and (aC; bC2), which gave rise to ΔpHi1 and ΔpHi2 were applied successively. The desired bC was then estimated from:
 |
4 |
This method is most accurate when bC/aC = 1 and hence when pHi = pHo; we were able to bring pHi close to pHo by applying NH4 + (see Fig. 3, A–D).
Comparison of the Permeabilities of the Neutral Forms of a Weak Base and a Weak Acid
We choose a weak acid AH/A− whose pKa = apKa < 5 so that at pHo ∈ [6; 8] its total concentration Ca = [AH]o +[A−]o ≈ [A−]o. We choose a weak base BH+/B whose pKa = bpKa > 9 so that at pHo ∈ [6; 8] its total concentration Cb = [BH+]o + [B]o ≈ [BH+]o. We set Ca = Cb and find the pHo (∈ [6; 8]) for which the initial inward transmembrane flux of B (FB = PB × [B]o) is equal to that of AH (FAH = PAH × [AH]o):
 |
5 |
For pHi ∈ [6; 8], the initial rate of pHi change induced by the weak acid is −FAH/βi since, in the cell, most of AH dissociates to form A− + H+; similarly, the initial rate of pHi change induced by the weak base is FB/βi. Thus, if one of the permeabilities is known, the other permeability can be deduced from the value of pHo for which the initial direction of the pHi change during the application of the mixture of the weak base and the weak acid reverses (FB = FAH).
Online Supplemental Material
The arguments leading from the observed changes in pHi to the properties of the transporter molecule involve a model of transmembrane fluxes in the cell (essentially that used by Marcaggi et al. 1999) and a multistate model of a hypothetical NH4 +-Cl− cotransporter with K+ inhibition. Details of these models and their analysis are available online at http://www.jgp.org/cgi/content/full/116/2/125/DC1
RESULTS
In agreement with Marcaggi et al. 1999, pHi in bundles of glial cells superfused with solution at the physiological pH of 6.90 had values up to ∼7.55 (e.g., see Fig. 7). More acid pHis (<7.0) were encountered in bundles that were visibly damaged or whose pHi recovered only slowly from an acid load. In slices of bee retina, mean pHi measured in glial cells selected for their negative membrane potentials has been reported as 7.31 (Coles et al. 1996). For this reason, and also because the amplitude of pHi responses of isolated bundles to NH4 + application correlated positively with pHi (Marcaggi et al. 1999), bundles with pHi > 7.1 were usually selected, except for some experiments on NH3 permeability for which a more acid baseline pHi was advantageous (e.g., see Fig. 4).
Figure 7.

pHi changes as a function of ammonium concentration (for 30-s applications in 0 K+). (A) Typical recording of pHi responses to various NH4 + concentrations. Cells were normally superfused with 10 mM K+ standard solution that was switched to a 0 K+ solution 15 s before each NH4 + application. The response to 10 mM propionate (near the end of the experiment) gives a lower limit for the rapidity of the solution changes. On the same cells, after a delay of ≈20 min (“Δt*”), removal of extracellular K+ with no ammonium application had no detectable effect on pHi. (B) Superposition of pHi responses to NH4 + (from A) on a shorter time scale. Dotted lines for 0.5 and 1 mM NH4 + are the second (control) responses. The delay between activation of the solenoid valve (t = 0) and the start of the changes in pHi was ∼10 s. Note that during the NH4 + application, pHi fell more rapidly for 10 mM NH4 + than for 20 mM, but that the peak reached after the application (Phase 4) was greater for 20 mM. (C) Calculation of δpHi/δt(NH4 +) for each NH4 +-induced acidification. Mean slopes were measured between 15 and 35 s after the onset of the NH4 + application by linear regression. Taking into account the delay for arrival of solutions, this interval corresponds to the last 20 s of the NH4 + applications. (D) Mean values for ΔpHi([NH4 +]o) (peak change in pHi, open symbols) and δpHi/δt([NH4 +]o) (filled symbols) from four experiments similar to that of A. Bars represent ± SEM. The best Michaelis-Menten fits of ΔpHi([NH4 +]o) for [NH4 +]o = 0.5, 1, 2, 5, 10, and 20 mM (solid line) and of δpHi/δt([NH4 +]o) for [NH4 +]o = 0.5, 1, 2, and 5 mM (dotted line) are shown.
The Ammonium-induced Decrease in pHi Is Inhibited by a High Concentration of K+ o
Fig. 2 A illustrates how 2 mM ammonium applied for 30 s to an isolated bundle of bee retinal glial cells at the measured physiological pHo of 6.90 (Cardinaud et al. 1994) causes a decrease in pHi, indicating entry of NH4 +. Marcaggi et al. 1999 have reported that this acidification requires external Cl− (but not Na+) and is inhibited by bumetanide (at 100 μM) and by piretanide, properties of the family of K+-Cl− cotransporters. Between applications of NH4 + in Fig. 2 A, the external K+ concentration ([K+]o) was at its normal physiological value of 10 mM (Cardinaud et al. 1994), and it was maintained at this value during the second and fifth applications of NH4 +. For the first NH4 + application, [K+]o was reduced to 1 mM, which slightly increased the acidification, and for the third application it was increased to 50 mM. Although increasing [K+]o to 50 mM for up to 2 min in the absence of ammonium caused only negligible changes in pHi (n = 6; not shown), 50 mM K+ o reduced the ammonium-induced acidification to about half that in the presence of 10 mM K+ o. Rb+, an ion that can replace K+ in many transport processes, produced a greater inhibition that we did not investigate further (fourth ammonium application). Hence, Fig. 2 A suggests that inward transport of NH4 + is inhibited by K+ o and Rb+ o (as would be expected if NH4 + and K+ (and Rb+) competed for the same transporting site, for example). More interestingly, the inhibition may be relatively weak: increasing [K+]o from 10 to 50 mM only halved the pHi response to 2 mM ammonium, suggesting that the transport may be selective for NH4 + over K+. To quantify this selectivity from measurements of pHi, it was necessary to have a scheme of the transmembrane fluxes of NH4 + and NH3 and to determine parameters relating these fluxes to changes in pHi.
Parameters to be Determined
Fig. 2 B shows a response to a longer (5 min) application of ammonium on an expanded time scale. This response can be divided into five phases that can be explained by the schemes of Fig. 2 C (see also Boron and De Weer 1976; Marcaggi et al. 1999). Initially, pHi increases because of the predominant effect of the rapid entry of NH3, which combines with H+ (Phase 1). Since the equilibrium of the reaction NH3 + H+ ↔ NH4 + is so far to the right at pH near 7, it is sufficient that the inward flux of NH3 exceeds ∼1% of the inward flux of NH4 +. As the ratio [NH4 +]i/NH3]i ∝ [H+]i, Phase 1 is expected to be greater for cells with acid pHi. This was actually the case: Phase 1 was detected only for cells with baseline pHi < 7.2. When the NH3 concentrations approach equality on each side of the cell membrane, there is still an inward NH4 + gradient because [H+]o > [H+]i. Then the NH3 flux becomes outward while NH4 + continues to enter the cells and release H+ ions (Phase 2). A steady state is reached (Phase 3) when the production of H+ ions equals their extrusion by pH regulatory processes. When extracellular ammonium is suddenly removed, intracellular ammonium exits the cell faster in the NH3 form than in the NH4 + form, so NH4 + dissociates to form NH3 and there is a rebound acidification (Phase 4), followed by a slower return to baseline as proton equivalents are pumped out of the cell (Phase 5).
Marcaggi et al. 1999 showed that a simple mathematical model based on Fig. 2 D could simulate the main features of the experimental records, but used parameters that were only roughly estimated. We have now made more precise measurements of the following parameters required by the model: the absolute values of baseline pHi, the buffering power (βi), the NH3 permeability (PNH3), the pHi regulation rate (characterized by a time constant τreg), and the Cl− concentration gradient that can help drive NH4 + into the cell.
Absolute Determination of pHi During Application of NH4 +
The precise value of pHo − pHi in the presence of external ammonium (the plateau phase) is related to the force driving NH4 + across the membrane and is our main motivation for seeking an accurate measure of pHi. Marcaggi et al. 1999 calibrated their measurements by applying nigericin, but it has been shown that this technique can give systematic errors (Nett and Deitmer 1996; Boyarsky et al. 1996). To determine the absolute value of pHi during NH4 + perfusion, we applied a weak acid and a weak base simultaneously as described by Eisner et al. 1989 (see materials and methods). Fig. 3 A shows a typical experiment. NH4 + was first applied at pHo 6.90 and then at pHo 7.30. At each plateau phase, ΔpHi (10 mM propionate, 10 mM TMA) and ΔpHi (10 mM propionate, 5 mM TMA) were in opposite directions, and we estimated by linear interpolation the concentration of TMA that would have given no change in pHi when applied with 10 mM propionate (). The absolute value of pHi was then calculated by . The method assumes that intracellular pKa equals extracellular pKa and that the membranes are relatively impermeable to the charged forms of the weak acid and base. This latter assumption was confirmed by the observation that, during applications of propionate (n = 21; not shown) or TMA (see Fig. 5 A), recovery of pHi was slow and could be fully accounted for by pH regulatory processes. Since pHi during the plateau phase depends partly on pHi regulatory processes (Fig. 2 C 3), short NH4 + applications at the beginning and end of the experiment were made to check that the rates of recovery remained approximately the same. From 12 experiments, as in Fig. 3 A, pHi was calculated to be 6.844 ± 0.017 (±SD, n = 12) after an 8-min application of NH4 + with pHo = 6.90. This pHi was significantly less than pHo (P < 0.0001) and remained so for at least 35 min (Fig. 3 B). To see whether the result depended on the specific weak acid and weak base used, we used other weak acid/weak base couples. In experiments similar to that of Fig. 3 A, the estimated difference pHo − pHi after >10 min of perfusion with 2 mM ammonium was not significantly different when the following couples were used: propionate/TMA; propionate/MA; acetate/TMA and caproate/TMA (Fig. 3 C). To see whether the value of (pHo − pHi) reached during the plateau phase was related to the baseline pHi, we compared cells with a baseline pHi < 7.1 with those with pHi > 7.1 (Fig. 3 C, first two columns). The difference in the mean values of (pHo − pHi) during the plateau phase was not significant. In contrast, as illustrated in Fig. 3 A, the level of the plateau did indeed depend strongly on the pHo at which the NH4 + was applied. Absolute values of pHi estimated during superfusion with 2 mM NH4 + at pHo 6.500 ± 0.005, 6.900 ± 0.005, 7.300 ± 0.005, and 7.700 ± 0.005 are plotted in Fig. 3 D and show a very precise linear correlation with pHo such that (pHi − 6.142) = 0.9264 × (pHo − 6.142). In later experiments, we calibrated the measurements of pHi simply by superfusing the cells with 2 mM ammonium for at least 8 min and using this relation.
Figure 5.
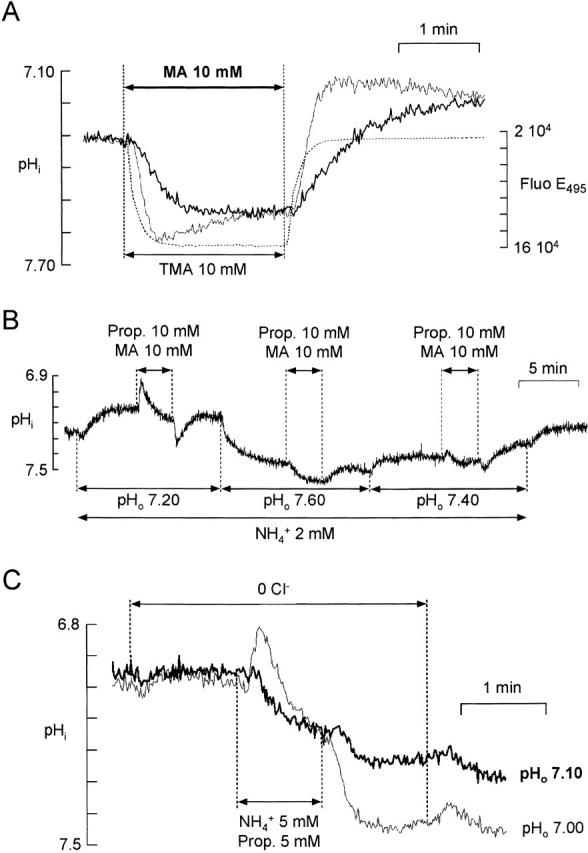
Indirect measurement of NH3 permeability. (A) Direct measurement of PMA. The pHi change induced by 10 mM methylamine (MA) (thick line) was compared with that induced by 10 mM trimethylamine (TMA) (thin line) and to the change in fluorescence on switching to a solution containing 1μg liter−1 fluorescein (dotted line). The microscope was focused on the same bundle for the three recordings. (B) Relative cell membrane permeabilities to neutral forms of propionate (Prop) and MA. A bundle of cells was superfused with 2 mM NH4 + so that pHi was maintained at a value close to pHo (Fig. 3 D). When 10 mM Prop + 10 mM MA was applied at pHo 7.2, entry of the neutral form of Prop initially predominated, but as [Prop]i increased, entry of MA began to predominate and pHi started to increase. The initial change in pHi reversed for a value of pHo between 7.40 and 7.60. (C) Relative cell membrane permeabilities to NH3 and to the neutral form of Prop. A mixture of 5 mM NH4 + and 5 mM Prop was applied to cells superfused with a 0 Cl− solution at pHo 7.10 (thick trace) or 7.00 (thin trace). The two recordings were from the same bundle of cells. At pHo 7.10, the initial change in pHi was an increase, while at pHo 7.00 it was a decrease.
Intracellular Buffering Power
The H+ ions released into (or taken up from) the cytoplasm as a consequence of the transmembrane fluxes of NH4 + and NH3 affect pHi according to the relation ΔpHi = ΔQ/βi, where ΔQ is the quantity of H+ ions/U volume and βi is the intracellular buffering power (see Roos and Boron 1981). We estimated βi by applying the weak acid propionate (as in Figure 1 of Marcaggi et al. 1996); the change in pHi reached its maximum very rapidly compared with the time course of pHi recovery in the presence of propionate, and we did not attempt to block pHi regulation (compare Szatkowski and Thomas 1989). Mean βi was 12.2 ± 2.9 mM (n = 11) and we took 12 mM for the model.
To see if βi varied markedly with pHi, we shifted pHi by applying NH4 + at various pHos. The results and the analysis, which is complicated by the effects of the NH3/NH4 + system, are given in Marcaggi 1999; the conclusion is that βi is effectively constant in the range 6.7–7.3.
Permeability to NH3
We estimated NH3 permeability (PNH3) from measurements of pHi under conditions in which entry of NH4 + was blocked so that changes in pHi were due only to the inward flux of NH3. We have previously shown that NH4 + does not enter through barium-sensitive K+ channels, the major cationic conductance in these cells, and also that NH4 + entry is totally blocked by bumetanide or by removal of external chloride (Marcaggi et al. 1999). We therefore applied ammonium in Cl−-free solutions to which, in some cases, bumetanide had been added, and measured the rate of change of pHi (in the alkaline direction) induced by NH3 entry into the cells.
With the cell bundles adhering to the floor of the perfusion chamber, we failed to find a molecule causing a 10–90% pHi change faster than the one produced by ammonium: perhaps the change of solution at the cell membrane (0–20 μm from the floor of the chamber) was not fast enough for this measurement. To expose cells to faster solution changes, we caught hold of bundles of cells with a 3-μm tip diameter pipette and carried them 50–100 μm up from the floor of the chamber. To increase the time resolution of the rapid initial slope of the pH change, we measured the fluorescence ratio with faster switching of the excitation wavelengths (>3 Hz). To reduce delays due to diffusion, we applied ammonium at a high concentration (10 mM) but at an acid pH (6.50) so that [NH3]o was low but benefited from facilitated diffusion (Engasser and Horvath 1974). To increase the NH3-induced ΔpHi, baseline pHi was reduced (to ∼6.80) by perfusing the cells for 30–60 min with solution buffered at pHo 6.20. After a 1-min perfusion with 0 Cl− + 0.5 mM bumetanide, 10 mM ammonium was applied at pHo 6.50 (Fig. 4 A). In these conditions, the 10–90% pHi change induced by 10 mM propionate (Fig. 4 B) was twice as fast as the one induced by ammonium, showing that the speed of solution change at the cell membrane did not significantly limit the influx of NH3.
Although pHi was ∼7.00 during the ammonium application, while pHo was 6.50, no slow pHi decrease was observed, as would have been the case if the membranes had had some permeability to NH4 +. This confirms that NH4 + pathways were insignificant in these conditions.
The slope of the pHi change was measured at 50% of the ΔpHi response, where it is known that [NH3]o has reached its final concentration, since the effect of propionate is 90% at this time (Fig. 4). Since, for pHi ∼ 7.00, [NH4 +]i > 100 × [NH3]i, then βi × δpHi/δt = δ [NH4 +]i/δt ≈ δ ([NH4 +]i + [NH3]i)/ δt = FNH3 × S/V, where FNH3 is the NH3 transmembrane flux and S/V is the ratio of membrane surface to intracellular volume in which the ammonium is distributed. The ratio of the surface to the total cell volume has been estimated to be ≈1.2 μm−1 (Marcaggi et al. 1999), but the ammonium will be present almost entirely in the water phase that occupies 0.775 of the total volume of the tissue (Coles and Rick 1985). Taking this factor for the water content of the glial cells gives an estimated effective S/V of 1.55 μm−1. Knowing βi, we could then calculate the transmembrane flux of NH3 from the rate of change of pHi: FNH3 ≈ V/S × βi × δpHi/δt. From this flux, we found PNH3 = 14.7 ± 2.9 μm · s−1 (n = 6) in 0 Cl− + 0.5 mM bumetanide, which was not significantly different from the value in 0 Cl− only (n = 5), showing that bumetanide did not further inhibit NH4 + entry.
Holding up the cells with a pipette will have introduced some stress in the cell membrane, which may have modified its permeability. To check that NH3 permeability is the same for cells plated on the bottom of the chamber (the conditions used for the other experiments), we also determined PNH3 by an indirect method. Methylamine (MA; CH3NH3 +/CH3NH2) is a weak base with a pKa that is high (≈10.6; Robinson and Stokes 1959) compared with that of ammonium (≈9.2). Because of this pKa difference, at pH < 8 (at which charged forms are preponderant), if [CH3NH3 +] + [CH3NH2] = [NH4 +] + [NH3], then [CH3NH2] < 0.04 × [NH3]. It follows that if PCH3NH2 (PMA) is not far different from PNH3, for equal concentrations of MA and ammonium applied, FCH3NH2 << FNH3. This is why PMA can be measured directly even with a slow speed of solution change at the cell membrane. Fig. 5 A illustrates the pHi response to 10 mM MA compared with the pHi response to 10 mM TMA (pKa ≈ 9.6). The speed of the pHi change induced by TMA was far faster than the one induced by MA, showing that the speed of the solution change was fast enough for measurement of PMA, which was found to be 27.4 ± 8.1 μm s−1 (n = 8). Once this permeability was known, it was possible to deduce the permeability of propionate by ascertaining the initial direction of the pHi change induced by a simultaneous application of 10 mM propionate and 10 mM MA. To avoid too great a variation of the net ΔpHi during this simultaneous application, we used a condition in which pHi ≈ pHo, which was obtained by including 2 mM ammonium in the superfusate (Fig. 3 D). As illustrated in Fig. 5 B, the initial direction of the pHi change reversed for 7.40 < pHo < 7.60 (n = 4). Taking the mean of this range (pHo ≈ 7.50 ± 0.10) gives x = PMA/Pprop ≈ 3.16 ± 1.46 according to . So, Pprop = PMA/x ≈ 8.67 ± 6.57 μm s−1.
The same protocol was used to estimate PNH3 from the now known Pprop, the simultaneous application being done in 0 Cl− to prevent the entry of NH4 +. As illustrated in Fig. 5 C, the initial direction of the pHi change reversed for 7.00 < pHo < 7.10 (n = 4), which gives x = PNH3/Pprop ≈ 1.02 ± 0.24 according to . So PNH3 = x × Pprop ≈ 8.84 ± 8.78 μm s−1.
In conclusion, the two methods of estimation of PNH3 gave values not significantly different. The standard deviation obtained with the second method was increased by the successive approximations so we give more weight to the value obtained with the first method and conclude that PNH3 is in the range of 7–19 μm s−1; we take the value 13 μm s−1 for the model.
pH Regulation
When pHi falls below its baseline value, pH regulatory mechanisms tend to restore it by extruding H+ ions. To quantify the kinetics of this regulation, we acid loaded the cells by exposure to ammonium and analyzed the recovery (Roos and Boron 1981; Thomas 1984). Fig. 6 A shows the recoveries of pHi in a single bundle of cells after initial displacements of various amplitudes induced by applications of ammonium at various concentrations. For each ammonium application, the recovery was analyzed for 8 min starting 45 s after the end of the application («t f») to allow for the rebound acidification (Phase 4). The plot is semilogarithmic, the ordinate being ln([H+]i − [H+]∞), where [H+]∞ was the baseline [H+]i at rest. Linear regressions showed that the recoveries were exponential irrespective of the initial displacement, and had slopes (= −1/τreg) that were not systematically different.
Figure 6.
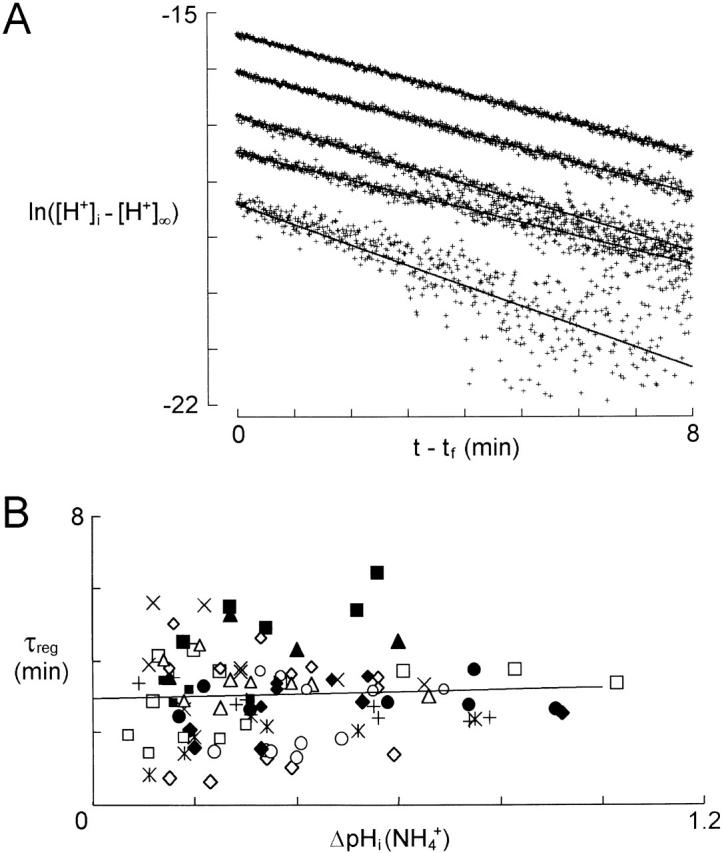
pHi recovery from ammonium-induced acid loads. (A) Analysis of recoveries from acidifications induced by applications of 0.5, 1, 2, 5, and 10 mM NH4 + on the same bundle of glial cells. ln([H+]i − [H+]∞) was plotted against t − t f, where t f is 45 s after the end of the NH4 + superfusion. From linear regressions of the data points, τreg was calculated as being (min): 2.74 (correlation coefficient, R = 0.761), 3.96 (R = 0.971), 3.29 (R = 0.978), 3.68 (R = 0.996), and 3.75 (R = 0.998) for the recoveries from the increasing acidifications induced by 0.5, 1, 2, 5, and 10 mM NH4 +. (B) τreg, calculated as in A, as a function of ΔpHi at the beginning of the recovery. The data are from 17 cell bundles (each represented by a different symbol) for which at least three different [NH4 +]o were applied. For each cell bundle, a linear regression was calculated and a line with the mean of their slopes [(0.3 min (pH unit )−1] is shown passing through the barycenter of the points.
Values of the time constant τreg for 17 bundles of cells for which at least three different ammonium concentrations were tested were plotted as a function of the initial pHi displacement, ΔpHi(NH4 +) (Fig. 6 B). Linear regression of τreg[ΔpHi(NH4 +)] confirmed that τreg was independent of the pH [mean slope of 0.3 ± 1.8 min (pH unit)−1; n = 17]. We conclude that despite considerable variability, τreg was approximately constant irrespective of the initial pHi displacement with a mean value of 3.0 ± 1.1 min (n = 17). We therefore described the pHi regulation by :
 |
6 |
with τreg = 3 min.
Driving Force
The flux rate of a Cl− cotransporter will depend in part on [Cl−]o and [Cl−]i, and we will use values of these concentrations in the transporter model of Fig. 10 A (see online supplemental material). [Cl−]o being known, we attempted to estimate [Cl−]i. Measurements in slices of bee retina with ion-selective microelectrodes have shown that in the glial cells Cl− (and also K+) are at close to electrochemical equilibrium (Coles et al. 1986, Coles et al. 1989). Hence, [Cl−]i/[Cl−]o could be deduced approximately from Vm. We did not succeed in measuring Vm in the isolated bundles of glial cells directly (by electrode techniques) and used an indirect method. We argued that if the membranes were made permeable to H+ then [H+]i would be determined by Vm. We applied the H+/K+ exchanger, nigericin, in solutions with normal [K+]o and observed the resulting change in pHi (Fig. 3 E). The minimum pHi reached during nigericin was compared with pHi at the plateau phase induced by 2 mM NH4 +, the mean difference being 0.02 ± 0.05 (n = 7; Fig. 3 C). It follows that the mean value of pHo − pHi at the maximum of the nigericin-induced pHi change was ∼0.07 (Fig. 3 C). On the assumption that H+, being now in equilibrium with K+, was distributed passively across the membrane, Vm was −4 mV. Since nigericin is not perfectly selective for H+ (Pressman et al. 1967; Margolis et al. 1989), it probably depolarized the membranes somewhat, as suggested by the slow increase in pHi during nigericin (Fig. 3 E). Thus, the true Vm is probably more negative than −4 mV and [Cl−]o/[Cl−]i = exp(−Vm F/RT) > 1.18.
Figure 10.
pHi responses to stepwise increases in [NH4 +]o are accounted for by a model of the transport process. (A) Kinetic scheme of the cotransport of Cl− and NH4 + or K+. The unloaded transporter molecule is symbolized by X; o or i indicate the position of the transporter at the external or internal side of the cell membrane. Binding ions Cl−, NH4 +, and K+ are not shown in this scheme for visual simplicity. The three binding constants K c, K m, and K i for Cl−, NH4 +, and K+ are unaffected by the side to which the transporter faces. Two kinetic constants, k and g, describe the transit steps of the unloaded and loaded transporter. (B) Experimental response to stepwise increases in [NH4 +]o. (C) Simulated response of the cell model of Fig. 2 D including the transporter model of A to stepwise increases in [NH4 +]o with affinity for NH4 +, K m = 5 mM (continuous line) and 20 mM (dashed line). K i was 15 mM.
Concentration Dependence of the pHi Changes Induced by 30-s Applications of Ammonium
To record the responses to increasing concentrations of NH4 + in the absence of external K+, we superfused the cells in 0 K+ for 15 s before and during each NH4 + application (Fig. 7 A). Repeated exposure to high [NH4 +] appeared to lead to impairment of pHi regulation and, for 7 of 11 experiments, pHi did not recover from the acidification induced by 10 mM NH4 +. Measurements were therefore made only on the records from the four experiments for which pHi recovered from 10 mM NH4 + and for which the response to subsequent control application of 0.5 or 1 mM NH4 + was closely similar to the initial response (in the record of Fig. 7 A, a final application of 20 mM NH4 + was made). To make sure that the effect of NH4 + was not rate limited by the speed of the solution change (as was probably the case in the previous study by Marcaggi et al. 1999), we checked that application of propionate gave a more rapid pHi change (Fig. 7 A). Data were analyzed only for experiments in which the time for the 10–90% propionate-induced pHi change was <15 s. The last part of Fig. 7 A shows that 0 K+ alone did not affect pHi on the time and pH scales of these experiments.
Fig. 7 B shows the NH4 + responses from the record of Fig. 7 A on a shorter time scale. The time of onset of the response to propionate (not shown) indicated that in this experiment there was a dead time of ∼5 s between the switching of the electromagnetic valves and the arrival of a new solution at the cell membrane. The slope of the NH4 +-induced pHi change (δpHi/δt) was measured before the rebound (Phase 4), between 15 and 35 s after the valves were actuated. δpHi/δt(NH4 +) was calculated by linear regression as shown in Fig. 7 C. δpHi/δt(NH4 +) increased with [NH4 +]o in the range 0.5–10 mM NH4 +; but for 20 mM NH4 +, although the total pHi change induced by NH4 + [ΔpHi(NH4 +)] continued in every case to increase, in three of the four experiments, δpHi/δt for 20 mM NH4 + was less than for 10 mM, as in the example shown in Fig. 7A–C. Mean data from the four experiments are shown in Fig. 7 D. ΔpHi([NH4 +]o) was well fitted by a Michaelis-Menten curve ΔpHi([NH4 +]o) = a[NH4 +]o/(b + [NH4 +]o) (R = 0.993) with half saturation, b, for [NH4 +]o = 6.62 ± 0.57 mM (n = 4). But δpHi/δt([NH4 +]o) could only be fitted by a Michaelis-Menten curve for [NH4 +] ≤ 5 mM (R = 0.926), half saturation being at [NH4 +]o = 3.37 ± 0.98 mM (n = 6) (Fig. 7 D). Because the relation between NH4 + transport and pHi changes is indirect, the value of [NH4 +]o that half saturates pHi changes does not necessarily correspond to the one that half saturates transport of NH4 +. To deduce the flux of NH4 +, we had recourse to a mathematical model.
Dependence of NH4 + Flux on [NH4 +]o
Three transmembrane fluxes determine pHi during and after application of ammonium (Fig. 2 C). Of these, we have a phenomenological description of the pHi regulation (Freg in Fig. 2 D), and we assume that the flux of NH3 (FNH3 in Fig. 2 D) results from simple diffusion (Fick's law). To deduce the flux of NH4 + through the cotransporter (FNH4 in Fig. 2 D) from the changes in pHi, we use the model of Fig. 2 D, expressed mathematically in the supplemental material. From the measurements described above, values for parameters of the model were: βi = 12 mM, pHi = 7.4, τreg = 3 min, and PNH3 = 13 μm s−1. The surface-to-volume ratio, S/V, with its attendant uncertainty, was used to calculate PNH3, but cancels out in the calculations.
As a first step, a constant inward FNH4 (inFNH4) was imposed for 30 s, with [NH4 +]o (+ [NH3]o) set to 2 mM. The resulting δpHi/δt was calculated 15 s after the onset of the imposed inFNH4 and plotted against inFNH4 for various PNH3 (7, 13, and 19 μm s−1; Fig. 8 A). Increasing PNH3 increased δpHi/δt, but only slightly, showing that PNH3 is not a major rate-limiting factor.
Figure 8.
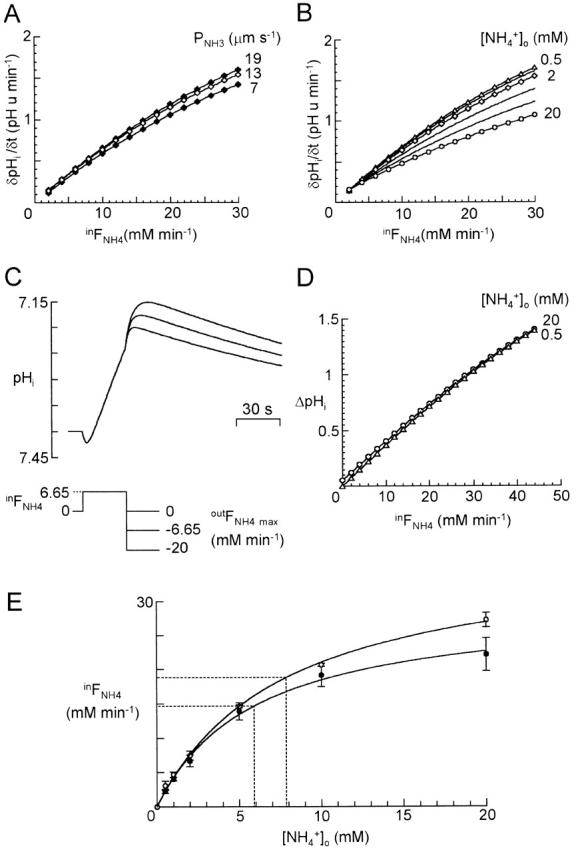
Use of the cell model (Fig. 2 D) to derive inward FNH4([NH4 +]o) from measured pHi changes induced by brief applications of NH4 +. (A) Constant inward FNH4 (inFNH4) was imposed on the model for 30 s. δpHi/δt, calculated 15 s after onset, was plotted against inFNH4. Data are shown for simulations with [NH4 +]o set to 2 mM (to fix [NH3]o) and PNH3 = 7, 13, and 19 μm s−1. (B) As in A, δpHi/δt was plotted versus inFNH4 for simulations with [NH4 +]o = 0.5 mM (triangles), 1 and 2 mM (diamonds), and 5, 10, and 20 mM (circles). PNH3 = 13 μm s−1. Because increasing [NH4 +]o increases [NH3]o, δpHi/δt(inFNH4) is smaller for higher [NH4 +]o. (C) Simulations in which an inFNH4 was imposed for 30 s and followed by an outward FNH4 (outFNH4). inFNH4 was set to 6.65 mM min−1 and [NH3]o was fixed by setting [NH4 +]o = 2 mM; this gave δpHi/δt = 0.44 pH unit min−1, equal to the mean measured pHi change induced by 2 mM NH4 + in 0 K+ for cells with baseline pHi ≈ 7.4. At t = 30 s, FNH4 switched instantaneously from inFNH4 to maximum outFNH4, outFNH4 max, and decreased to zero as [NH4 +]i decreased to zero (see text). Simulations for outFNH4 max equal to 0, −6.65, and −20 mM min−1 show that the rebound acidification after 30 s decreased when outFNH4 max increased. (D) Plot of ΔpHi(inFNH4) measured as baseline pHi (7.4) minus the minimal pHi reached during the rebound acidification after 30 s of influx inFNH4. Simulations for 0.5 mM (triangles) or 20 mM (circles) NH4 + o (+NH3o) show that [NH3]o has little effect on ΔpHi(inFNH4). outFNH4 max = 0. (E) inFNH4([NH4 +]o) calculated from δpHi/δt([NH4 +]o) (•) and ΔpHi([NH4 +]o) (○) of Fig. 7 D. The points were fitted by Michaelis-Menten curves (R = 0.963 and 0.994, respectively) with apparent constants K ′m equal to 5.9 ± 1.3 and 7.8 ± 0.7 mM.
A similar simulation, still using an imposed inFNH4, was then performed in the presence of various [NH4 +]o (+ [NH3]o). Increasing [NH4 +]o increased [NH3]o, reduced outward FNH3, and, as expected, reduced δpHi/δt(inFNH4) (Fig. 8 B). It is clear that the experimental result in which δpHi/δt was smaller for an application of 20 mM ammonium than for 10 mM (Fig. 7) does not necessarily imply that inward FNH4(20 mM NH4 +) < inward FNH4(10 mM NH4 +). We also note that since the relation of δpHi/δt to inFNH4 is curved (Fig. 8A and Fig. B), δpHi/δt vs. [NH4 +]o will saturate more rapidly than will inFNH4 vs. [NH4 +]o.
The pHi peak reached after withdrawal of external ammonium must depend both on [NH4 +]i at the end of the ammonium application, and on the effluxes of NH4 + and of NH3 after withdrawal. To start modeling this, we considered the case of a 30-s application of 2 mM extracellular NH4 + with a constant inFNH4 (6.65 mM min−1 in Fig. 8 C). After removal of extracellular NH4 +, the concentration gradient of NH4 + is outwards. We tested the simplest reasonable assumption, which is that outward FNH4 = outFNH4 ∝ [NH4 +]i. With no loss of generality, this can be written: outFNH4 = outFNH4 max × ([NH4 +]i/[NH4 +]i max), where [NH4 +]i max is the intracellular NH4 + concentration reached at t = 30 s and outFNH4 max is an initially arbitrary constant corresponding to the maximum transient outFNH4. As illustrated in Fig. 8 C, the rebound acidification on removal of extracellular NH4 + is maximal for zero outFNH4 and decreases with increasing outFNH4. Let ΔpHi(inFNH4) be the total pHi change induced by a 30-s inFNH4 followed by an outFNH4 defined as above. From the experimental data, the mean ratio ΔpHi/(δpHi/δt) measured from 30-s applications of 2 mM NH4 + in 0 K+ o was 0.60 ± 0.12 min (n = 10); the closest approach to this in Fig. 8 C is 0.56 min for outFNH4 max = 0, which we accept as an approximation. ΔpHi(inFNH4) is very little affected by [NH4 +]o (still for an imposed inFNH4; Fig. 8 D), much less so than is δpHi/δt (Fig. 8 B). Thus, the inverse operation of estimating inward FNH4([NH4 +]o) is better done from ΔpHi([NH4 +]o) than from δpHi/δt([NH4 +]o). By comparing experimental ΔpHi([NH4 +]o) (Fig. 7 D) and simulated ΔpHi(inFNH4) (Fig. 8 D), we calculated inFNH4([NH4 +]o) (Fig. 8 E). The points were well fitted by a Michaelis-Menten equation of the form ():
 |
7 |
The constant, K ′m, corresponding to half saturation of inward FNH4, was 7.8 ± 0.7 mM. Variant analyses {from δpHi/δt([NH4 +]o or using Lineweaver-Burke plots} all gave lower values, down to 4.9 mM (Marcaggi 1999. We conclude that K ′m = 7.8 mM is a conservative estimate of the affinity (an upper limit for K ′m) of the transporter for NH4 + in these experimental conditions.
Functional Selectivity for NH4 + over K+
Having established the dependence of inFNH4 on [NH4 +]o (for 30-s applications of ammonium), we then extended the approach to analyze the inhibitory effect of K+. Fig. 9 A shows an experiment in which cells were superfused for 30 s with NH4 + in 0 or 10 mM K+. ΔpHi([NH4 +]) from six such experiments is shown plotted with double inverse scales as a function of [NH4 +]o in Fig. 9 B. Using the model, as described above, a value of inFNH4([NH4 +]) was deduced for each measurement of ΔpHi([NH4 +]) and a second inverse plot was made (Fig. 9 C). This plot suggests that the inhibition was competitive since straight lines passing through the data points intersect near the ordinate axis (same inFNH4 max).
Fig. 9 D illustrates how K+ depolarizes these glial cells. In this record, from a glial cell in a retinal slice, the depolarization is greatly damped by electrical coupling between the cells and the slowness of the increase in [K+] in the extracellular clefts (Coles and Orkand 1983). But in isolated cell bundles, the depolarization might be greater and in some way affect NH4 + uptake. We therefore used Ba2+, which blocks the depolarization for at least 45 s after the application of K+ (Fig. 9 D), to study the effect of K+ on ΔpHi(NH4 +) in the absence of changes in membrane potential. In confirmation of Marcaggi et al. 1999, Ba2+ (at 5 mM) had in itself no effect on ΔpHi(NH4 +) (n = 5; not shown). Nor did it have a significant effect on the inhibition of ΔpHi(NH4 +) produced by raising K+ to 20 mM (n = 11; not shown). Hence, the depolarization is unlikely to be responsible for the inhibition of NH4 + transport by extracellular K+.
To quantify the inhibitory effect of K+, we calculated an apparent inhibitory constant, K ′i, defined by: K ″m = K ′m (1 + [K+]o/K ′i), where K ′m is the Michaelis-Menten constant estimated above from responses to NH4 + in 0 K+ and K ″m is the constant estimated from the responses to NH4 + in 10 mM K+. K ′i was found to be 26.7 mM, which is greater than K ′m (≤7.8 mM). Variant analyses also gave K ′i > K ′m (see Marcaggi 1999).
Affinities of the Transporter Molecule for NH4 + and K+
In the previous two sections, we established the dependence of the mean inward FNH4 on [NH4 +]o during 30-s (brief) applications of ammonium, and the inhibition of this flux by [K+]o. We now describe the changes in pHi under more varied conditions; notably, longer applications of NH4 +. These more complex responses impose additional constraints on the interpretation of the underlying processes and allow us to test whether the transport can be described by a standard minimal kinetic model of membrane cotransport to which we add competition by K+ for the NH4 + binding site (Fig. 10 A). As explained by Sanders et al. 1984, the kinetic behavior of a cotransporter can be accounted for by models with different orders of binding of ions; we have chosen to consider binding first of Cl− then K+ or NH4 +. This and other assumptions implicit in the model of Fig. 10 A, their justification where possible, and the techniques used to deduce the parameter values from experimental responses to NH4 + are given in the online supplemental material. Using the experimental results obtained so far, the model suggested that K m, the binding affinity for NH4 +, was 6–8 mM and K i, the binding affinity for K+, was in the range 10–20 mM, values that we now refine.
In the experiment of Fig. 10 B, [NH4 +]o was increased in steps, each lasting 8 min. The level of the plateau phase (Phase 3 in Fig. 2 B) rose no further for [NH4 +]o > 5 mM (n = 4). Fig. 10 C shows simulated responses to the same protocol of stepwise increases in [NH4 +]o for a cell containing the transporter model of A with K i = 15 mM and K m = 5 mM (continuous trace) or 20 mM (dashed trace). It is seen that the time course of pHi, particularly for the step change [NH4 +]o from 5 to 10 mM, is better simulated with K m = 5 mM; i.e., with K m < K i.
Increasing [K+]o in the Presence of NH4 +
Fig. 11 A illustrates the inhibitory effect on NH4 + transport of increasing [K+]o during the plateau phase induced by a long application of NH4 +. An increase in [K+]o from 10 to 50 mM rapidly increased pHi by 0.092 ± 0.012 pH unit in 2 min in 2 mM NH4 + (n = 5) and by a greater amount, 0.115 ± 0.022 pH unit in 20 mM NH4 + (n = 5). The difference is significant with P = 0.01. This observation raised the question of whether the inhibition by [K+]o was purely competitive.
Figure 11.
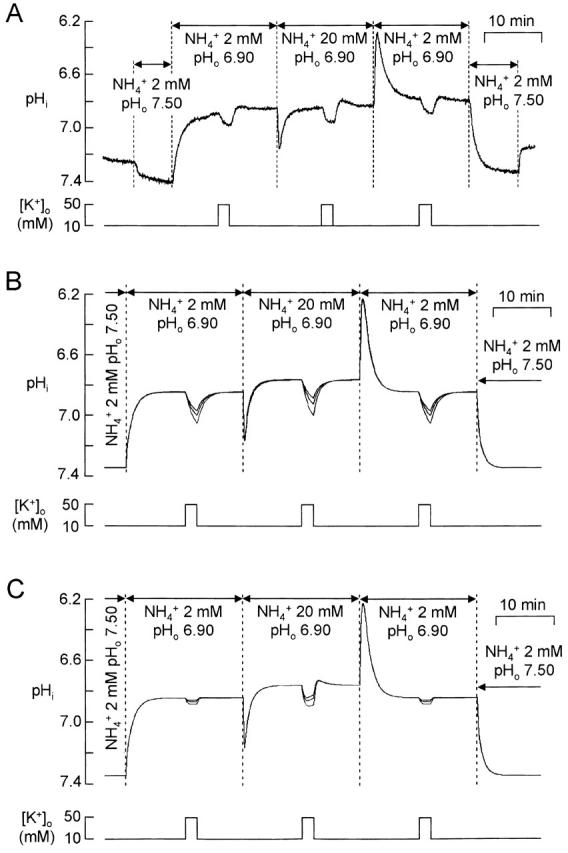
Effects of increasing [K+]o from 10 to 50 mM on the plateau phase pHi during superfusion with 2 mM or 20 mM NH4 +. (A) Typical recording. At the beginning and end of the experiment, the cells were superfused with 2 mM NH4 + at pHo 7.50 to provide a pHi calibration (see Fig. 3 D). (B) Simulated effect of increasing [K+]o. In the model, [K+]i was kept constant when [K+]o was increased. The cell model included the transporter of Fig. 10 A (see online supplemental material for full list of parameter values). K m was 7 mM and K i was 10, 15, or 20 mM (superposed traces), the greatest inhibition being for K i = 10 mM. (C) Simulation with the model modified so that transport of NH4 + was inhibited by extracellular K+ in a noncompetitive manner. The transporter of Fig. 10 A was modified by removing the effect of increasing [K+]o on the binding step XClo → XClKo (this modification amounts to suppressing this binding step with no modification of the other parameters) and by the addition of an inhibitory step XClNH4o → XClNH4Ko, whose affinity constant for K+ o, K K, was 5, 10, or 15 mM (superposed traces), the greatest inhibition being for K K = 5 mM.
Simulations were performed with the transporter model of Fig. 10 A and the protocol of Fig. 11 A. K m was set to 7 mM. Simulations with K i = 10, 15, and 20 mM (Fig. 11 B) show that inhibition by a 2-min increase in [K+]o from 10 to 50 mM differed from the experimental record in three aspects. First, the inhibition in 20 mM NH4 +, although larger than the inhibition in 2 mM NH4 +, was not as markedly larger as in the experiments. Second, the increases in pHi induced by rises in [K+]o were slower than the experimental ones. Third, after returning to 10 mM K+, the small rebound acidification present in the experimental records was not reproduced. A transporter model in which inhibition by extracellular K+ was noncompetitive (Fig. 11 C, legend) corrected these failings, but excessively so. We did not attempt to fit the experimental data more precisely since our transporter model is highly simplified, but these comparisons to simulations do suggest that inhibition by extracellular K+ may be partly noncompetitive.
DISCUSSION
Sensitivity to loop diuretics and external chloride (Marcaggi et al. 1999) indicate that the cotransporter studied belongs to the electroneutral cation-chloride cotransporter family (Haas and Forbush 1998). Despite the electroneutrality of the process and the simultaneous flux of NH3 across the membrane (Marcaggi et al. 1999), we have quantified the transport of NH4 + on the cotransporter after first measuring several parameters (buffering power, PNH3…) that link the transmembrane flux of NH4 + to changes in pHi.
Parameters for the Cell Model: pHi, βi, PNH3
The null method of pH measurement used on the isolated bundles of glial cells showed that many bundles had pHis at least as alkaline as those measured with pH microelectrodes in slices of retina (mean: 7.31; Coles et al. 1996), in agreement with the generally alkaline pH reported in many kinds of glial cells (see Deitmer and Rose 1996). βi [12.2 mequiv (pH unit · liter)−1] is close to the value of 10.4 measured in snail neurons (Szatkowski and Thomas 1989). Our estimate of PNH3 (13 μm s−1) is well within the large range of values reported for biological membranes, which range from 108 μm s−1 or higher in erythrocytes (Klocke et al. 1972; Labotka et al. 1995) to undetectably small at the apical membranes of colonic crypt cells (Singh et al. 1995). This variation appears in part to be correlated inversely with the density of proteins in the membrane: PNH3 is high in protein-free artificial membranes (Antonenko et al. 1997) and low in membranes of urinary bladder, which are densely packed with uroplakins (Chang et al. 1994). PNH3 has not, to our knowledge, been determined for cells of nervous tissue other than the bee retinal glial cells, so we do not know if our value is typical. From experiments similar to that of Fig. 6 B, we compared the permeabilities of the membrane to various neutral lipophilic compounds. We found that the permeabilities to the neutral forms of the amines TMA, MA, and ammonium or the carboxylic acids caproate, propionate, and acetate were greater the greater the hydrophobic part of the molecule (-CH2- groups); i.e., PTMA > PMA > PNH3 and Pcaproate > Ppropionate > Pacetate. Thus, it appears that the relative permeability of the cell membrane to these nonelectrolytes depends more on the hydrophobicity of the molecule than on its size, in accordance with Overton's rule (Overton 1899).
Membrane Potential, Cl− Gradient, and pH Regulation
A major difference, potentially important for certain cell functions, between the glial cells in the isolated bundles and those on which published results were obtained in slices of bee retina, is the apparent membrane potential. On the assumption that application of nigericin caused H+ to distribute across the membrane with the same passive distribution as K+, we concluded that mean Vm in the bundles was −4 mV. Support for a small Vm is given by the observation (Marcaggi et al. 1999) that in dissociations of the kind used here, rhodamine 123 selectively labeled photoreceptor cells. Since rhodamine 123 tends to partition preferentially into negatively charged compartments, this observation is compatible with the isolated bundles of glial cells having a membrane potential, Vm, much smaller than that of the photoreceptors. Despite the smallness of Vm, the glial cell bundles were able to regulate their pHi and to recover from repeated acid loads, although slightly more slowly than the recovery from a stimulus-induced acidification of glial cells in slices (Coles et al. 1996). And in electrically functioning retinal slices, a wide range of glial cell membrane potentials have been recorded (−10 to −75 mV) with little apparent consequence for homeostasis of extracellular ions or metabolism (Bertrand 1974; Coles et al. 1986; our unpublished observations). The mechanism of pH regulation in the bee glial cells is unknown and a mechanism not dependent on an ionic gradient is conceivable, as reported in C6 glial cells (Volk et al. 1998).
Transporters of the cation-Cl− family are normally electroneutral, and the effect of ammonium on glial cell Vm in bee retinal slices is compatible with electroneutral transport (Coles et al. 1996), so Vm is expected to have no direct effect on the thermodynamics of the NH4 + transport. However, since Cl− is distributed approximately passively (Coles et al. 1989), the concentration gradient is much greater in glial cells in vivo and it is predicted that uptake of NH4 + would be more effective than in the isolated bundles.
NH4 +/K+ Selectivity of the Transporter
Until now, the few studies of competition between K+ and NH4 + for inward transport into animal cells on transporters have reported a selectivity for K+ (Kinne et al. 1986; Cougnon et al. 1999). It has, however, been proposed that NH4 + transport is a physiologically significant process, notably in kidney cells (Good 1994) and in salivary acinar cells (Evans and Turner 1998). We have shown that for brief applications of ammonium in the millimolar range, the Cl−-dependent transport in bee retinal glial cells is functionally selective for NH4 + over K+. Further, a minimal numerical model of the transport process in which NH4 + competes for a transporting site with an affinity approximately twice that for K+ accounted for the main features of the pHi responses not only for brief applications of ammonium but also for more complex protocols. Since K+ is the physiological cation whose ionic radius is closest to that of NH4 + (Robinson and Stokes 1959) and whose permeation through channels is most similar to that of NH4 + (Hille 1992), it is unlikely that the transporter has as high an affinity for any other major physiological ion, and we conclude that it is selective for NH4 +.
Reported values for K m (K+) calculated for K+ influx by Cl−-dependent transport into erythrocytes are 55 mM (sheep; Delpire and Lauf 1991) and 140 mM (human; Kaji 1989). These values are higher than the K i calculated in this study (10–27 mM) on the assumption (supported by the Lineweaver-Burke plots of Fig. 9B and Fig. C) that the inhibition is purely competitive. However, if, as suggested by Fig. 11, the inhibition is partly noncompetitive, then the K i for the competitive component will be higher and closer to the values for erythrocytes. Not only does the transporter on the bee retinal glial cell have a lower affinity for K+ than for NH4 +, but preliminary results suggest that even the K+ that is bound may not be transported rapidly (Marcaggi and Coles 1998).
Possible Advantages of Glial Uptake of Ammonium in the NH4 + Form
We have shown that ammonium enters bee retinal glial cells overwhelmingly in the NH4 + form. It is striking that this is also the case for mammalian astrocytes (at least those cultured from neonatal mice), although, in contrast to the bee glial cells, the NH4 + entry into cultured astrocytes appears to occur mainly through Ba2+-sensitive channels (Nagaraja and Brookes 1998; P. Sartor and P. Marcaggi, unpublished data). Entry of ammonium into cells is favored in two ways if it crosses the membrane as NH4 + instead of as NH3. First, at physiological pHs, the majority of the ammonium is in the NH4 + form. Second, the entry can be coupled to a gradient. In the case of bee retinal cells in vivo, this is the Cl− concentration gradient, and in cultured mouse astrocytes it is the electrical potential gradient.
A major ammonium-consuming process in bee retinal glial cells is the conversion of pyruvate to alanine (Tsacopoulos et al. 1994, Tsacopoulos et al. 1997a). As a substrate, NH4 + will contribute to the regulation of the reactions (Tsacopoulos et al. 1997a,Tsacopoulos et al. 1997b). In addition, NH4 + allosterically activates phosphofructokinase (Lowry and Passoneau 1966; Sugden and Newsholme 1975), an effect that, in mammals, may contribute to the coupling of glutamate release by neurons to glycolysis in astrocytes proposed by Pellerin and Magistretti 1994 (see also Magistretti et al. 1999).
In the case of bee retinal glial cells, the ammonium consumption can be summarized by the reaction: CH3-CO-COO− + NH4 + + NADH + H+ → CH3-CHNH3 +-COO− + H2O + NAD+.
Since this reaction consumes H+, pHi is better conserved if ammonium is supplied in the NH4 + form. In astrocytes, the pathways of energy metabolism are still a matter of debate (see, e.g., Demestre et al. 1997), but there, too, the proportion of ammonium that enters as NH3 or NH4 + will affect pH homeostasis in the brain.
Supplemental Material
Acknowledgments
We thank Dr. Robert Dantzer for laboratory facilities and Jean-Louis Lavie for his contribution to the set up.
Financial support was received from the Conseil Régional d'Aquitaine (97-0301208).
Footnotes
Dr. Marcaggi's present address is Department of Physiology, University College London, London WC1E 6BT, UK.
The online version of this article contains supplemental material.
Abbreviations used in this paper: BCECF-AM, acetoxymethyl ester of 2′,7′-bis(2-carboxyethyl)-5(6)-carboxyfluorescein); FNH4 (and FNH3), transmembrane fluxes of NH4 + (and NH3) per liter of cell; TMA, trimethylamine.
References
- Abramowitz M., Stegun I.A. Handbook of Mathematical Functions 1965. Dover Publications Inc; New York, NY: pp. 1046 pp [Google Scholar]
- Antonenko Y.N., Pohl P., Denisov G.A. Permeation of ammonia across bilayer lipid membranes studied by ammonium ion selective microelectrodes. Biophys. J. 1997;72:2187–2195. doi: 10.1016/S0006-3495(97)78862-3. [DOI] [PMC free article] [PubMed] [Google Scholar]
- Benjamin A.M., Quastel J.H. Metabolism of amino acids and ammonia in rat brain cortex slices in vitroa possible role of ammonia in brain function. J. Neurochem. 1975;25:197–206. doi: 10.1111/j.1471-4159.1975.tb06953.x. [DOI] [PubMed] [Google Scholar]
- Bertrand, D. 1974. Etude des propriétés électrophysiologiques des cellules pigmentaires de la rétine du faux-bourdon (Apis mellifera). Thesis No. 1650. Université de Genéve.
- Boron W.F., De Weer P. Intracellular pH transients in squid axons caused by CO2, NH3, and metabolic inhibitors. J. Gen. Physiol. 1976;67:91–112. doi: 10.1085/jgp.67.1.91. [DOI] [PMC free article] [PubMed] [Google Scholar]
- Boyarsky G., Ganz M.B., Sterzel R.B., Boron W.F. pH regulation in single glomerular mesangial cells I. Acid extrusion in absence and presence of HCO3 − . Am. J. Physiol. Cell Physiol. 1988;255:C844–C856. doi: 10.1152/ajpcell.1988.255.6.C844. [DOI] [PubMed] [Google Scholar]
- Boyarsky G., Hanssen C., Clyne L.A. Inadequacy of high K+/nigericin for calibrating BCECF. Am. J. Physiol. Cell Physiol. 1996;271:C1131–C1156. doi: 10.1152/ajpcell.1996.271.4.C1131. [DOI] [PubMed] [Google Scholar]
- Cardinaud B., Coles J.A., Perrottet P., Spencer A.J., Osborne M.P., Tsacopoulos M. The composition of the interstitial fluid in the retina of the honeybee droneimplications for the supply of substrates of energy metabolism from blood to neurons. Proc. R. Soc. Lond. B Biol. Sci. 1994;257:49–58. [Google Scholar]
- Chang A., Hammond T.G., Sun T.T., Zeidel M.L. Permeability properties of the mammalian bladder apical membrane. Am. J. Physiol. Cell Physiol. 1994;267:C1483–C1492. doi: 10.1152/ajpcell.1994.267.5.C1483. [DOI] [PubMed] [Google Scholar]
- Coles J.A., Marcaggi P., Lavie J.L. A rapid wavelength changer based on liquid crystal shutters for use in ratiometric microspectrophotometry. Pflügers Arch. 1999;437:986–989. doi: 10.1007/s004240050871. [DOI] [PubMed] [Google Scholar]
- Coles J.A., Marcaggi P., Véga C., Cotillon N. Effects of photoreceptor metabolism on interstitial and glial cell pH in bee retinaevidence for a role for NH4 + . J. Physiol. 1996;495:305–318. doi: 10.1113/jphysiol.1996.sp021595. [DOI] [PMC free article] [PubMed] [Google Scholar]
- Coles J.A., Orkand R.K. Modification of potassium movement through the retina of the drone (Apis mellifera male) by glial uptake. J. Physiol. 1983;340:157–174. doi: 10.1113/jphysiol.1983.sp014756. [DOI] [PMC free article] [PubMed] [Google Scholar]
- Coles J.A., Orkand R.K., Yamate C.L. Chloride enters glial cells and photoreceptors in response to light stimulation in the retina of the honey bee drone. Glia. 1989;2:287–297. doi: 10.1002/glia.440020502. [DOI] [PubMed] [Google Scholar]
- Coles J.A., Orkand R.K., Yamate C.L., Tsacopoulos M. Free concentrations of Na, K and Cl in the retina of the honeybee dronestimulus-induced redistribution and homeostasis. Ann. NY Acad. Sci. 1986;481:303–317. doi: 10.1111/j.1749-6632.1986.tb27160.x. [DOI] [PubMed] [Google Scholar]
- Coles J.A., Rick R. An electron microprobe analysis of photoreceptors and outer pigment cells in the retina of the honey bee drone. J. Comp. Physiol. 1985;156:213–222. [Google Scholar]
- Cougnon M., Bouyer P., Jaisser F., Edelman A., Planelles G. Ammonium transport by the colonic H+-K+-ATPase expressed in Xenopus oocytes. Am. J. Physiol. Cell Physiol. 1999;277:C280–C287. doi: 10.1152/ajpcell.1999.277.2.C280. [DOI] [PubMed] [Google Scholar]
- Deitmer J.W., Rose C.R. pH regulation and proton signalling by glial cells. Prog. Neurobiol. 1996;48:73–103. doi: 10.1016/0301-0082(95)00039-9. [DOI] [PubMed] [Google Scholar]
- Delpire E., Lauf P.K. Kinetics of Cl-dependant K fluxes in hyposmotically swollen low K sheep erythrocytes. J. Gen. Physiol. 1991;97:173–193. doi: 10.1085/jgp.97.2.173. [DOI] [PMC free article] [PubMed] [Google Scholar]
- Demestre M., Boutelle M.G., Fillenz M. Stimulated release of lactate in freely moving rats is dependent on the uptake of glutamate. J. Physiol. 1997;499:825–832. doi: 10.1113/jphysiol.1997.sp021971. [DOI] [PMC free article] [PubMed] [Google Scholar]
- Eisner D.A., Kenning N.A., O'Neill S.C., Pocock G., Richards C.D., Valdeolmillos M. A novel method for absolute calibration of intracellular pH indicators. Pflügers Arch. 1989;413:553–558. doi: 10.1007/BF00594188. [DOI] [PubMed] [Google Scholar]
- Engasser J.M., Horvath C. Buffer-facilitated proton transport pH profile of bound enzymes. Biochim. Biophys. Acta. 1974;358:178–192. doi: 10.1016/0005-2744(74)90269-1. [DOI] [PubMed] [Google Scholar]
- Evans R.L., Turner R.J. Evidence for physiological role of NH4 + transport on secretory Na+-K+-2Cl− cotransporter. Biochem. Biophys. Res. Commun. 1998;245:301–306. doi: 10.1006/bbrc.1998.8428. [DOI] [PubMed] [Google Scholar]
- Good D.W. Ammonium transport by the thick ascending limb of Henle's loop. Annu. Rev. Physiol. 1994;56:623–647. doi: 10.1146/annurev.ph.56.030194.003203. [DOI] [PubMed] [Google Scholar]
- Haas M., Forbush B.R. The Na-K-Cl cotransporters. J. Bioenerg. Biomembr. 1998;30:161–172. doi: 10.1023/a:1020521308985. [DOI] [PubMed] [Google Scholar]
- Hassel B., Bachelard H., Jones P., Fonnum F., Sonnewald U. Trafficking of amino acids between neurons and glia in vivo. Effects of inhibition of glial metabolism by fluoroacetate. J. Cerebr. Blood Flow Metab. 1997;17:1230–1238. doi: 10.1097/00004647-199711000-00012. [DOI] [PubMed] [Google Scholar]
- Hille B. Ionic Channels of Excitable Membranes 2nd ed 1992. Sinauer Associates, Inc; Sunderland, MA: pp. 607 pp [Google Scholar]
- Jacobs M.H. Some aspects of cell permeability to weak electrolytes. Cold Spring Harbor Symp. Quant. Biol. 1940;8:30–39. [Google Scholar]
- Kaiser B.N., Finnegan P.M., Whitehead L.F., Bergersen F.J., Day D.A., Udvardi M.K. Characterization of an ammonium transport protein from the peribacteroid membrane of soybean nodules. Science. 1998;281:1202–1206. doi: 10.1126/science.281.5380.1202. [DOI] [PubMed] [Google Scholar]
- Kaji D. Kinetics of volume-sensitive K transport in human erythrocytesevidence for asymmetry. Am. J. Physiol. Cell Physiol. 1989;256:C1214–C1223. doi: 10.1152/ajpcell.1989.256.6.C1214. [DOI] [PubMed] [Google Scholar]
- Kenyon J.L., Gibbons W. R. Effects of low chloride solutions on action potentials of sheep cardiac purkinje fibers. J. Gen. Physiol. 1977;70:635–660. doi: 10.1085/jgp.70.5.635. [DOI] [PMC free article] [PubMed] [Google Scholar]
- Kinne R., Kinne-Saffran E., Schütz H., Scholermann B. Ammonium transport in medullary thick ascending limb of rabbit kidneyinvolvement of the Na+, K+, Cl−-cotransporter. J. Membr. Biol. 1986;94:279–284. doi: 10.1007/BF01869723. [DOI] [PubMed] [Google Scholar]
- Klocke R.A., Andersson K.K., Rotman H.H., Forster R.E. Permeability of human erythrocytes to ammonia and weak acids. Am. J. Physiol. 1972;222:1004–1013. doi: 10.1152/ajplegacy.1972.222.4.1004. [DOI] [PubMed] [Google Scholar]
- Labotka R.J., Lundberg P., Kuchel P.W. Ammonia permeability of erythrocyte membrane studied by 14N and 15N saturation transfer NMR spectroscopy. Am. J. Physiol. Cell Physiol. 1995;268:C686–C699. doi: 10.1152/ajpcell.1995.268.3.C686. [DOI] [PubMed] [Google Scholar]
- Lowry O.H., Passoneau J.V. Kinetic evidence for multiple binding sites on phosphofructokinase. J. Biol. Chem. 1966;241:2268–2279. [PubMed] [Google Scholar]
- Magistretti P.J., Pellerin L., Rothman D.L., Shulman R.G. Energy on demand. Science. 1999;283:496–497. doi: 10.1126/science.283.5401.496. [DOI] [PubMed] [Google Scholar]
- Marcaggi, P. 1999. Capture de NH4 + dans les cellules gliales de rétine d'abeille par un transporteur membranaire spécifique. Thesis No. 698. Université Bordeaux 2.
- Marcaggi P., Coles J.A. The major routes of entry of NH4 + and K+ into bee retinal glial cells are independent J. Physiol. 513 1998. 15P 16P(Abstr.) [Google Scholar]
- Marcaggi P., Thwaites D.T., Coles J.A. Accumulation of protons in glial cells dissociated from bee retina in response to ammonium J. Physiol. 495 1996. 60P(Abstr.) [Google Scholar]
- Marcaggi P., Thwaites D.T., Deitmer J.W., Coles J.A. Chloride-dependent transport of NH4 + into bee retinal glial cells. Eur. J. Neurosci. 1999;11:167–177. doi: 10.1046/j.1460-9568.1999.00418.x. [DOI] [PubMed] [Google Scholar]
- Margolis L.B., Novikova I.Y., Rozovskaya I.A., Skulachev V.P. K+/H+-antiporter nigericin arrests DNA synthesis in Ehrlich ascites carcinoma cells. Proc. Natl. Acad. Sci. USA. 1989;86:6626–6629. doi: 10.1073/pnas.86.17.6626. [DOI] [PMC free article] [PubMed] [Google Scholar]
- Nagaraja T.N., Brookes N. Intracellular acidification induced by passive and active transport of ammonium ions in astrocytes. Am. J. Physiol. Cell Physiol. 1998;43:C883–C891. doi: 10.1152/ajpcell.1998.274.4.C883. [DOI] [PubMed] [Google Scholar]
- Nett W., Deitmer J.W. Simultaneous measurements of intracellular pH in the leech giant glial cell using 2′,7′-bis-(2-carboxyethyl)-5,6-carboxyfluorescein and ion-sensitive microelectrodes. Biophys. J. 1996;71:394–402. doi: 10.1016/S0006-3495(96)79240-8. [DOI] [PMC free article] [PubMed] [Google Scholar]
- Overton E. Ueber die allgemeinen osmotischen Eigenschaften der Zelle, ihre vermutlichen Ursachen und ihre Bedeutung fur die Physiologie. Vierteljahrsschr. Naturforsch. Ges. Zuerich. 1899;44:88–135. [Google Scholar]
- Pellerin L., Magistretti P.J. Glutamate uptake into astrocytes stimulates aerobic glycolysisa mechanism coupling neuronal activity to glucose utilization. Proc. Natl Acad. Sci. USA. 1994;91:10625–10629. doi: 10.1073/pnas.91.22.10625. [DOI] [PMC free article] [PubMed] [Google Scholar]
- Pressman B.C., Harris E.J., Jagger W.S., Johnson J.H. Antibiotic-mediated transport of alkali ions across lipid barriers. Proc. Natl. Acad. Sci. USA. 1967;58:1949–14956. doi: 10.1073/pnas.58.5.1949. [DOI] [PMC free article] [PubMed] [Google Scholar]
- Race J.E., Makhlouf F.N., Logue P.J., Wilson F.H., Dunham P.B., Holtzman E.J. Molecular cloning and functional characterization of KCC3, a new K-Cl cotransporter. Am. J. Physiol. 1999;277:C1210–C1219. doi: 10.1152/ajpcell.1999.277.6.C1210. [DOI] [PubMed] [Google Scholar]
- Robinson R.A., Stokes R.H. Electrolyte solutions 2nd ed 1959. London Butterworths; London, UK: pp. 571 pp [Google Scholar]
- Roos A., Boron W.F. Intracellular pH. Physiol. Rev. 1981;61:296–434. doi: 10.1152/physrev.1981.61.2.296. [DOI] [PubMed] [Google Scholar]
- Sanders D., Hansen U.-P., Gradmann D., Slayman C.L. Generalized kinetic analysis of ion-driven cotransport systemsa unified interpretation of selective ionic effects on Michaelis parameters. J. Membr. Biol. 1984;77:123–152. doi: 10.1007/BF01925862. [DOI] [PubMed] [Google Scholar]
- Sillén L.G. Stability constants of metal-ion complexes. I. Inorganic ligands 1964. Chemical Society (Spec. Publ. 17.) London, UK: pp. 150 pp [Google Scholar]
- Singh S.K., Binder H.J., Geibel J.P., Boron W.F. An apical permeability barrier to NH3/NH4 + in isolated, perfused colonic crypts. Proc. Natl. Acad. Sci. USA. 1995;92:11573–11577. doi: 10.1073/pnas.92.25.11573. [DOI] [PMC free article] [PubMed] [Google Scholar]
- Sugden P., Newsholme E. The effect of ammonium, inorganic phosphate and potassium ions on the activity of phosphofructokinases from muscle and nervous tissues of vertebrates and invertebrates. Biochem. J. 1975;150:113–122. doi: 10.1042/bj1500113. [DOI] [PMC free article] [PubMed] [Google Scholar]
- Szatkowski M.S., Thomas R.C. The intracellular H+ buffering power of snail neurones. J. Physiol. 1989;409:89–101. doi: 10.1113/jphysiol.1989.sp017486. [DOI] [PMC free article] [PubMed] [Google Scholar]
- Thomas J.A., Buchsbaum R.N., Zimniak A., Racker E. Intracellular pH measurements in Ehrlich ascites tumor cells utilizing spectroscopic probes generated in situ . Biochemistry. 1979;18:2210–2218. doi: 10.1021/bi00578a012. [DOI] [PubMed] [Google Scholar]
- Thomas R.C. Experimental displacement of intracellular pH and the mechanism of its subsequent recovery. J. Physiol. 1984;354:3P–22P. doi: 10.1113/jphysiol.1984.sp015397. [DOI] [PMC free article] [PubMed] [Google Scholar]
- Tsacopoulos M., Poitry-Yamate C.L., Poitry S. Ammonium and glutamate released by neurons are signals regulating the nutritive function of a glial cell J. Neurosci. 17 1997. 2383 2390a [DOI] [PMC free article] [PubMed] [Google Scholar]
- Tsacopoulos M., Poitry-Yamate C.L., Poitry S., Perrottet P., Veuthey A.L. The nutritive function of glia is regulated by signals released by neurons Glia. 21 1997. 84 91b [PubMed] [Google Scholar]
- Tsacopoulos M., Veuthey A.L., Saravelos G., Perrottet P., Tsoupras G. Glial cells transform glucose to alanine which fuels the neurons in the honeybee retina. J. Neurosci. 1994;14:1339–1351. doi: 10.1523/JNEUROSCI.14-03-01339.1994. [DOI] [PMC free article] [PubMed] [Google Scholar]
- Volk C., Albert T., Kempski O.S. A proton-translocating H+-ATPase is involved in C6 glial pH regulation. Biochim. Biophys. Acta. 1998;1372:28–36. doi: 10.1016/s0005-2736(98)00044-3. [DOI] [PubMed] [Google Scholar]
Associated Data
This section collects any data citations, data availability statements, or supplementary materials included in this article.