Abstract
The effects of intracellular Na+ were studied on K+ and Rb+ currents through single KcsA channels. At low voltage, Na+ produces voltage-dependent block, which becomes relieved at high voltage by a “punchthrough” mechanism representing Na+ escaping from its blocking site through the selectivity filter. The Na+ blocking site is located in the wide, hydrated vestibule, and it displays unexpected selectivity for K+ and Rb+ against Na+. The voltage dependence of Na+ block reflects coordinated movements of the blocker with permeant ions in the selectivity filter.
Keywords: selectivity, KCSA, punchthrough
INTRODUCTION
Among the teeming collection of K+ channels inhabiting the biological universe, the bacterial K+ channel KcsA offers exceptional opportunities for analyzing selective ion permeation from both structural and functional perspectives. The first K+ channel whose pore structure was determined at atomic resolution (Doyle et al., 1998; Jiang and MacKinnon, 2000; Morais-Cabral et al., 2001), KcsA can also be observed electrophysiologically in a minimal, chemically defined system consisting of purified protein reconstituted into synthetic phospholipid membranes separating aqueous solutions controllable over a wide range of conditions unconstrained by physiological requirements. All K+ channels exhibit a common mechanistic feature arising from biological necessity: strong selectivity against Na+. Cited values (Hille, 2001) of the K+-over-Na+ permeation ratio, including that of KcsA (LeMasurier et al., 2001), are typically >100, and in a few cases allowing precise determination (Yellen, 1984; Neyton and Miller, 1988a), selectivity ratios on the order of 1,000 have been measured. In many K+ channels, K+ traverses the pore near diffusion-limited rates, as though the protein presents no barrier at all, whereas Na+, its biological competitor, is effectively barred from permeation. In light of the structureless character of these two inorganic cations, this represents molecular recognition of a high order.
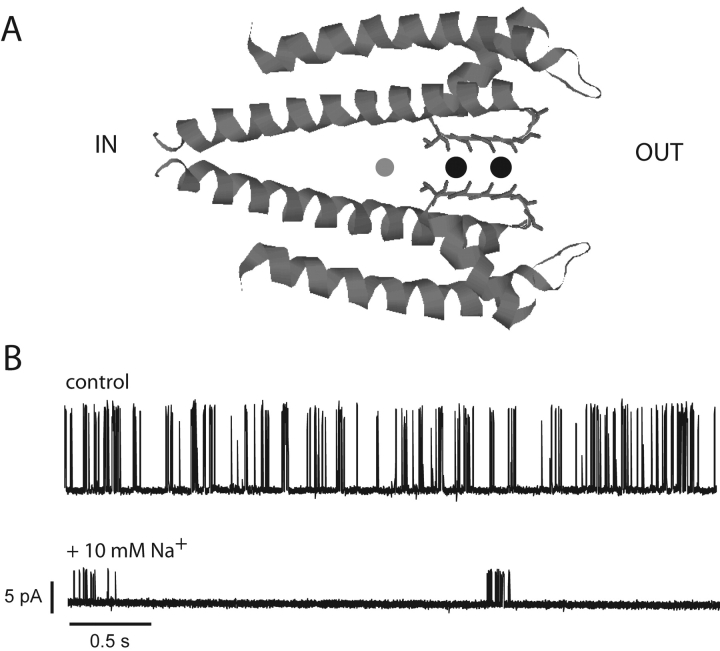
These remarkable characteristics of K+ channels are immediately comprehensible (see Fig. 1 A) from the KcsA structure (Doyle et al., 1998). The protein projects backbone carbonyl and sidechain oxygen atoms into a narrow selectivity filter on the extracellular side of the pore with a geometry that precisely mimics the hydration waters surrounding K+ in aqueous solution (Zhou et al., 2001b); this arrangement produces an isoenergetic landscape along which dehydrated K+ ions can diffuse rapidly through the filter (Morais-Cabral et al., 2001; Bernèche and Roux, 2001). In contrast, Na+ is thermodynamically disfavored in this region, presumably because the selectivity filter is not flexible enough to collapse inwards and intimately coordinate this smaller ion. In the crystal structure, a closed conformation, the pore widens on the intracellular side of the selectivity filter to form a cytoplasmic cavity, where a single ion (either K+ or Na+) may be accommodated. The cation is fully hydrated in this cavity, which terminates in a 3–4-Å intracellular constriction that must widen when the channel opens (Armstrong, 1971; Holmgren et al., 1997; Perozo et al., 1999; Zhou et al., 2001a). Recently, the open conformation of a different bacterial K+ channel, determined crystallographically at high resolution (Jiang et al., 2002a,b), reveals a roughly cylindrical 12-Å-wide aqueous vestibule directly connecting the intracellular solution to the selectivity filter, strikingly similar to the pore architecture for ion-selective channels anticipated on the basis of functional properties alone (Miller, 1982). In view of its width, we would not at first glance expect this intracellular access pathway to display much selectivity between K+ and Na+.
Figure 1.
Na+ block of KcsA: structure and function. (A) Structure of KcsA pore showing selectivity filter occupied by K+ (black circles) and cytoplasmic vestibule containing Na+ (gray circle). (B) Continuous single-channel recording of KcsA in 100 mM K+ before and after addition of 10 mM internal Na+. These 4-s traces were filtered at 1 kHz.
This paper addresses a mechanistic conundrum emerging from the architecture of KcsA, one that probably applies to all K+ channels. If Na+ enters the cytoplasmic vestibule as easily as K+ but is excluded from the selectivity filter, how can the channel avoid being constitutively blocked by cytoplasmic Na+? At low or negative voltage, this would not be a problem because cell Na+ is ∼10-fold lower in concentration than K+, but at increasingly positive voltages, Na+ entering the cavity would be expected to become electrostatically trapped and to severely block K+ current. Such voltage-dependent Na+ block has been described in several pregenomic K+ channels (Bezanilla and Armstrong, 1972; French and Wells, 1977; Yellen, 1984) and in KcsA (Heginbotham et al., 1999), but the voltages at which it becomes significant are beyond the physiological range (e.g., above +50 mV). How does the channel manage to evade this potential problem in its normal operating range and to ensure that Na+ does not clog the channel as it carries out its biological tasks? We show here that two mechanisms operate in KcsA to reconcile robust K+-selective permeation with an antechamber accessible to internal Na+. First, the vestibule, despite its wide girth, displays significant selectivity for K+ against Na+. Second, Na+ ions driven into the blocking site at high voltage are able to escape from it through the selectivity filter at a low rate.
MATERIALS AND METHODS
Materials
High purity salts KCl, NaCl, and RbCl, and buffer (HEPES and succinic acid) used in solutions for electrophysiology experiments were obtained from Sigma-Aldrich. The lipids 1-palmitoyl-2-oleoyl phosphatidylethanolamine (POPE) and phosphatidylglycerol (POPG) were purchased from Avanti Polar Lipids. Detergents used for lipid solubilization and protein extraction were n-dodecyl-β-d-maltoside ULTROL grade from Calbiochem and CHAPS from Pierce Chemical Co.
Expression, Purification, and Reconstitution of KcsA
KcsA labeled with an NH2-terminal His6 tag was expressed at high levels in Escherichia coli (JM-83) as described previously (Heginbotham et al., 1997, 1999; LeMasurier et al., 2001). The overexpressed membrane protein was extracted in dodecylmaltoside, purified over a Ni-NTA agarose column, and reconstituted into POPE/POPG (7.5:2.5 mg/ml) liposomes at a concentration of 0.4–1 μg protein/mg lipid. Aliquots were stored at −80°C for no longer than three months.
Single-channel Recording
KcsA channels in liposomes were incorporated into bilayers formed from POPE/POPG (7.5:2.5 mg/ml) in n-decane. We used a horizontal planar bilayer system consisting of two aqueous chambers separated by a partition with an ∼50-μm hole on which the bilayer (25–60 pF) was formed (Chen and Miller, 1996; Heginbotham et al., 1999). Channels were inserted by adding 1 μl of the KcsA-containing liposomes to a bilayer and waiting up to 5 min for channels to appear. A pH gradient was set up across the membrane to establish faithful orientation of the system, with the “internal” solution buffered at pH 4.0 with 10 mM succinate and the “external” solution at pH 7.0 with 10 mM HEPES (Heginbotham et al., 1999). This strategy silences any channels incorporated with reverse orientation because KcsA requires low internal pH for opening (Cuello et al., 1998; Heginbotham et al., 1999). Single-channel currents were recorded with an amplifier (Axopatch 200; Axon Instruments, Inc.) and sampled at 10–50 kHz with low-pass filtering at 2–5 kHz. In some cases, small amplitude channels obtained in low salt concentrations (25 mM K+ and/or 25–50 mM Rb+) were digitally filtered offline at 0.25–1 kHz. Voltage is referenced to the external solution as ground, according to electrophysiological convention. For each dataset, control recordings were first collected, and then the internal chamber was perfused with Na+-containing solutions to obtain blocked-channel data. Conductance measurements were made as described previously (LeMasurier et al., 2001) on >50 hand-picked long openings taken from at least three separate bilayers and were checked with all-point amplitude histograms.
Data Analysis
For each dataset, open channel I-V curves were constructed. These were fit according to two separate models based on either equilibrium block or kinetic punchthrough (see results). Parameters were derived independently from each dataset. For equilibrium block analysis (see Eqs. 1 and 2), two parameters were obtained, effective valence z and blocker dissociation constant  at zero voltage. For the kinetic analysis (see Eq. 5), which required five parameters, these same two parameters were determined robustly from the fits. For K+ data, the values of z,
  , and δ were largely insensitive to the values of ΘK and ΘB, which were not well constrained by the data. For Rb+ data, we additionally constrained ΘRb, ΘB, and δ according to the values used for fitting K+ data. Specifically, we required that ΘK/ΘRb = 5, according to conductance-concentration behavior of KcsA (LeMasurier et al., 2001). Despite these uncertainties, no conclusions from this work rely on specific values of these unconstrained parameters.
Online Supplemental Material
A figure and a cartoon providing a closer look at the concerted Na+ blocking transition are available at http://www.jgp.org/cgi/content/full/jgp.20028614/DC1.
RESULTS
Voltage-dependent Interactions of Na+ Ions with KcsA
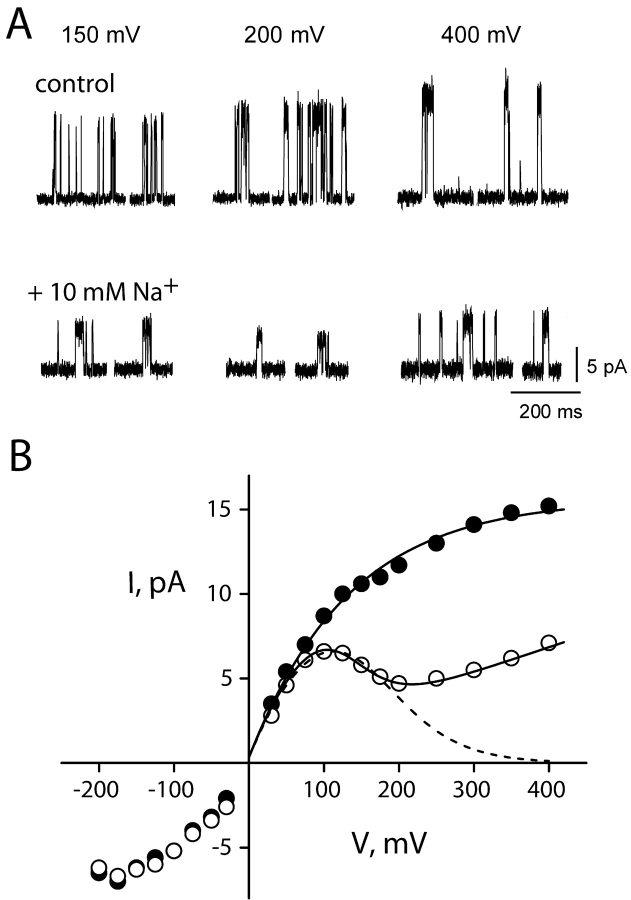
Like all K+ channels, KcsA is inhibited by intracellular but not extracellular Na+ (Heginbotham et al., 1999). This inhibition acts on two distinct processes, gating and conduction. As is apparent by inspection of channel recordings (Fig. 1 B), Na+ dramatically lengthens the long-lived closed intervals that separate bursts of KcsA activity and lowers the single-channel amplitude. This paper is aimed exclusively at the latter effect of Na+. Fig. 2 A shows in more detail single-channel openings in symmetrical 100-mM KCl solutions, with or without internal Na+ present. Na+ block manifests itself as a concentration-dependent decrease in single-channel amplitude, a hallmark of fast block, whereby the residence time of the blocker on its site is much briefer than the time resolution of the measuring apparatus; at the 2-kHz bandwidth used here, the absence of excess open channel noise induced by Na+ implies that blocking kinetics are substantially faster than ∼10 μs (Pusch et al., 2000). It is also apparent from the figure that Na+ actually decreases the open channel current noise, a reproducible observation for which we have no satisfactory explanation.
Figure 2.
Voltage-dependent effects of Na+ on KcsA: K+ current. (A) Single-channel traces from KcsA in 100 mM K+ before and after Na+, recorded at the voltages indicated. Traces, filtered at 2 kHz, are not continuous. (B) Open channel I-V curves calculated from control (closed circles) and 10 mM Na+ (open circles) recordings of the channel in A. The curve through control points is a sigmoidal fit with no theoretical significance. Dashed curve is fit with Eqs. 1 and 2 using Na+ data up to 200 mV with z = 0.5,  = 267 mM. Solid curve through all Na+ data points is fit with Eq. 5, with z = 0.73,
  = 400 mM, ΘK = 100exp(−δFV/RT) mM, ΘB = 1.43exp(−δFV/RT) mM, and δ = −0.1.
The open channel current-voltage (I-V) curve generated from these recordings (Fig. 2 B) highlights several obvious effects of Na+. In control conditions lacking Na+, K+ currents increase monotonically with voltage, tending toward an asymptotic value at very high voltages (>300 mV); it is reasonable to suppose that this voltage-independent current represents diffusion-limitation, but we have not subjected this idea to any specific tests. Intracellular Na+ converts the current-voltage relation (I-V curve) to a complex shape. Below ∼200 mV, Na+ acts as a conventional voltage-dependent blocker (Woodhull, 1973). It produces a negative slope in the I-V curve, as expected if the cation reversibly enters the channel from the internal solution and occludes the flow of K+ by occupying a site within the conduction pathway, the occupancy of which increases with voltage. However, above 200 mV, current rises again, as though the blocking site is somehow cleared of Na+, and K+ can now permeate more readily. This relief of Na+ block at high voltage is most naturally explained by the blocker escaping through the selectivity filter, a process previously observed in squid axon K+ channels (French and Wells, 1977; French and Shoukimas, 1985). Henceforth we will refer to the process by which Na+ block is relieved by permeation as “punchthrough.”
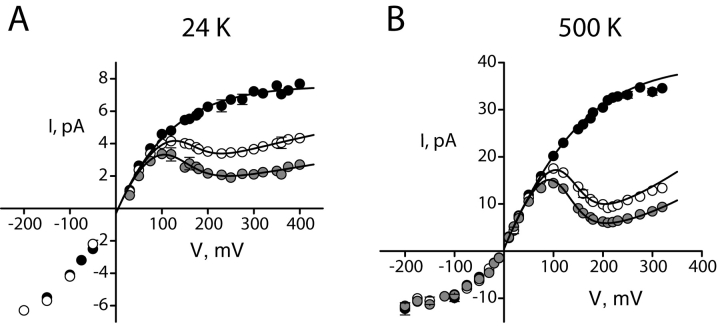
We examined the influence of Na+ on single-channel I-V curves at different concentrations of K+, as illustrated by comparison of Fig. 2 B (100 mM K+) and Fig. 3 (24 and 500 mM K+). Under all conditions, Na+ produces similar effects, and Na+ and K+ behave in a competitive manner; as K+ concentration increases, correspondingly higher concentrations of Na+ are required to produce similar levels of block. This behavior is expected for a blocker operating within the K+ conduction pathway because it is established from the KcsA structure that pore-associated ions occupy well-defined sites (Doyle et al., 1998; Jiang and MacKinnon, 2000; Morais-Cabral et al., 2001).
Figure 3.
Open channel I-V curves at different K+ concentrations. Points represent averages from three to seven datasets, and error bars, present when larger than the size of the points, represent SEM values of each dataset. (A) 24 mM KCl with 0 mM (black circles), 2 mM (open circles), and 5 mM (gray circles) intracellular Na+. The solid curves through Na+ data are fits (Eq. 5) as in Fig. 2, with z = 0.54,  (0) = 107 mM, ΘK = 100exp(−δFV/RT) mM, ΘB = 0.43exp(−δFV/RT) mM, and δ = −0.12. (B) 500 mM KCl with 0 mM (black), 50 mM (open), and 100 mM (gray) intracellular Na+. Parameters are as follows: z = 0.9,
  (0) = 3,000 mM, ΘK= 100exp(−δFV/RT) mM, ΘB = 2exp(−δFV/RT) mM, and δ = −0.19.
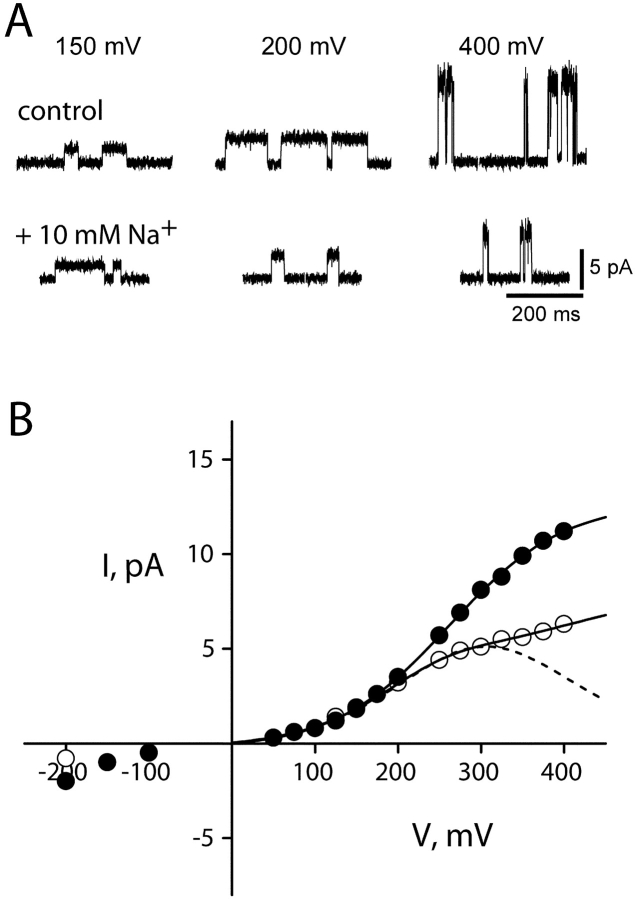
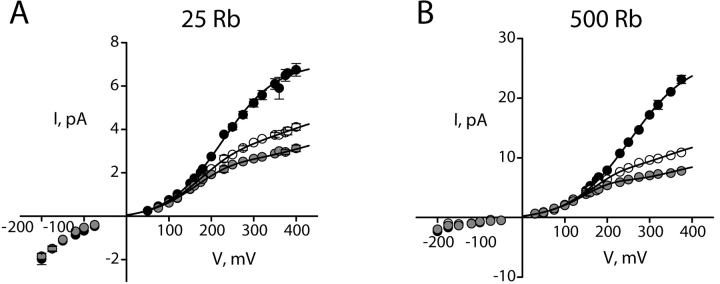
The picture of Na+ action emerging from the above results is simple, unsurprising, and in easy accord with the KcsA structure, with K+ current viewed as a convenient and measurable “reporter” for Na+ interaction with the pore. But after repeating these experiments with Rb+ as the conducting ion, we were surprised to encounter Na+ effects seemingly unlike those in K+. Internal Na+ diminishes the channel conductance in Rb+, but the I-V curve shapes induced by Na+ differ from those in K+ in two ways. First, Na+ block appears far less voltage dependent in Rb+, as indicated by the absence of a negative slope conductance (Fig. 4 B). Second, the Na+ punchthrough effect is not apparent. These characteristics remain across the entire range of Rb+ concentrations used here (Fig. 5) .
Figure 4.
Voltage-dependent effects of Na+ on KcsA: Rb+ current. Single-channel current traces in 100 mM Rb+ (A) and I-V curves (B) are analyzed as in Fig. 2. (dashed curve) Eqs. 1 and 2 fit up to 300 mV, with z = 0.33,  = 1,000 mM; (solid curve) Eq. 5, with z = 0.47,
  =1,000 mM, ΘRb = 20exp(−δFV/RT) mM, ΘB = 1.15exp(−δFV/RT), and δ = −0.1.
Figure 5.
Open channel I-V curves at different Rb+ concentrations. Data are organized as in Fig. 3. (A) 25 mM RbCl with 0 mM (black circles), 2 mM (open circles), and 5 mM (gray circles) intracellular Na+. The solid curves through Na+ data are fits (Eq. 5) as in Fig. 2, with z = 0.37,  (0) =100 mM, ΘRb = 20exp(−δFV/RT) mM, ΘB = 0.55exp(−δFV/RT) mM, and δ = −0.1. (B) 500 mM RbCl with 0 mM (black), 50 mM (open), and 100 mM (gray) intracellular Na+. Parameters are as follows: z = 0.51,
  (0) =1,000 mM, ΘRb = 20exp(−δFV/RT) mM, ΘB = 1.6exp(−δFV/RT) mM, and δ = −0.12.
Quantitative Approaches to Na+ Interactions with KcsA
We used the experimental results to gain quantitative insight into the interaction of Na+ with the KcsA pore. A familiar and simple equilibrium model for rapid voltage-dependent block (Woodhull, 1973; Coronado and Miller, 1979) considers that a blocking ion, present only on one side of the membrane, enters the pore and occupies a site normally used by the conducting ion, such that the channel becomes plugged up until the blocker dissociates. The model posits that blocker cannot permeate the pore beyond this site, and so the only possible pathway for dissociation is a thermodynamically reversible one, whereby the blocker returns to the solution from which it came. If blocker dissociation is rapid compared with the time resolution of the single-channel recordings, this model expects that the single-channel amplitude will be reduced in proportion to the fraction of time the blocker occupies its site:
 |
(1) |
where B denotes the blocker concentration and  is its apparent equilibrium dissociation constant. Because the reaction operates within a transmembrane protein, we expect that in general
  will depend on applied voltage:
 |
(2) |
where z is the effective charge movement associated with Na+ block. Moreover, if blocker and K+ occupy the vestibule in a mutually exclusive manner, the zero voltage value of  will follow a strict competition relation:
 |
(3) |
where K represents the K+ concentration, and KB(0) and KK(0) represent the intrinsic zero voltage dissociation constants of blocker and K+, respectively.
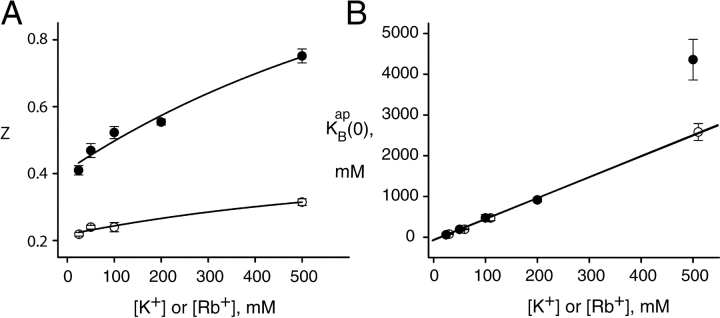
This conventional equilibrium model spectacularly fails to account for the effect of Na+ on K+ currents (Fig. 2 B, dashed curve) because at high voltages, the I-V curves completely abandon the negative resistance characteristic reflecting equilibrium block. However, we thought it worthwhile to apply this analysis below 200 mV, where satisfactory correspondence between data and prediction prevails. In Fig. 6 , we present the results of this analysis in the “blocking regime” for K+. We find that both z and  increase with K+ concentration. The increase in charge movement is expected from the multi-ion character of KcsA, which offers opportunities for coupling of K+ movements to blocker entry (Hille, 1975; Spassova and Lu, 1998), a coupling that is expected to increase with K+ occupancy. The linear increase in
  with K+ concentration is in accord with simple competition between K+ and Na+, as demanded by Eq. 3, and the slope of this relation signifies that K+ is favored in the vestibule over Na+ by a factor of five. Repeating this analysis for Rb+ as the conducting ion (Fig. 4 B, dashed curves), we come qualitatively to the same conclusions (Fig. 6) in the low voltage blocking range of the I-V curves.
  increases linearly with Rb+, with values nearly identical to those seen in K+. However, in Rb+, the absolute values of z are two- to threefold smaller (0.2–0.3) than those in K+ (0.4–0.8), as is obvious from the absence of a negative resistance in the Rb+ I-V curves.
Figure 6.
Parameters derived from equilibrium block analysis. I-V curves were analyzed below 200 mV for K+ (closed circles) and 300 mV for Rb+ (open circles) according to Eqs. 1 and 2, at different permeant ion concentrations. Each point represents the mean and SEM of either z (A) or  . (B) Fit from three to seven individual datasets as in Figs. 2 and 4. Curves through the points in A have no theoretical significance. Lines through the points in B represent linear fits (weighted by standard errors) to Eq. 3, with slopes of 5.15 (K+) and 5.10 (Rb+); intercepts are not significantly different from zero.
A Blocking Model that Incorporates Na+ Punchthrough
The equilibrium picture of Na+ block commands the virtue of model-independent certainty in its predicted behavior, but commits the vice of failure to match the experimental results. We take the departure of the data above 200 mV from the predictions of the equilibrium model to mean that Na+ on its blocking site is not, in fact, at thermodynamic equilibrium. There is only one plausible way that this can happen. Na+ must be able to dissociate from its blocking site by two pathways: in addition to the reversible one back to the solution whence it came, it must be able to use an irreversible, thermodynamically dissipative one forward through the selectivity filter. This second pathway would become increasingly prevalent at higher voltages and would account for relief of block, as manifested in the upward departure of the I-V curve from the equilibrium predictions.
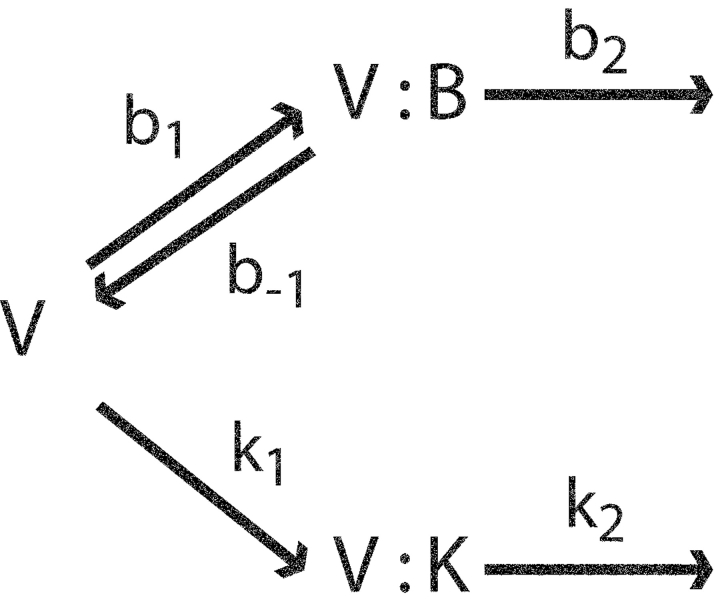
For this reason, we incorporated a punchthrough pathway into a quantitative picture of Na+ interaction with KcsA. We emphasize that it is not our intention to build a pore permeation model, but rather a theory to explain how Na+ modifies K+ and Rb+ currents. We propose (Scheme I) , as in the equilibrium picture, that both K+ and Na+ bind in a mutually exclusive fashion in the vestibule just outside the selectivity filter. The blocker leaves the vestibule either by returning to the intracellular solution (rate constant b−1) or by moving forward through the selectivity filter (rate constant b2). K+ leaves this site only by permeating rapidly; the scheme intentionally neglects the backward flux of K+, which will be very small compared with the forward rate at the positive voltages dominating our analysis.
SCHEME I.
Here, V represents the unoccupied vestibule, and V:K and V:B denote the vestibule site occupied by a K+ ion or a blocker. Rate constants are assumed to be conventionally voltage dependent, with forward rates increasing and backward rates decreasing exponentially with voltage. According to this scheme, Na+ punchthrough is a rare process that gains prominence only at high voltages, where b2 becomes large and b−1 small. The scheme leads to a prediction of flux through the channel, J(V):
 |
(4) |
where rate constants are given in Scheme I, K and B are permeant ion and blocker concentrations, respectively, and s = b2 + b−1.
Analysis (Eq. 14) shows that the second term in the numerator, which represents the current carried by Na+ itself, is negligible (<10%) compared with the first term, the K+ current. This means that the “upturn” in the punchthrough regime is K+ current arising from Na+ escape. For simplicity in subsequent exposition, we will drop the Na+ current term, to yield the I-V curve:
 |
(5) |
where all parameters are voltage dependent, and KB = b−1/b1 (equilibrium dissociation constant of the blocker, as in Eq. 2), ΘK = k2/k1 (Michaelis constant of the permeant ion for vestibule-occupancy), and ΘB = b2/b1 (punchthrough constant, a Michaelis constant for the blocker).
The I-V curve is given by the product of the unblocked I-V curve, I0(V), and a voltage-dependent “scaling term” that describes the interaction of the blocker with the channel. We recognize that Eq. 5 has the same competitive-inhibition form of the equilibrium model (Eq. 1), but with a crucial difference. Now, the apparent dissociation constant of the blocker contains the sum of two terms, an equilibrium block parameter, KB, and a new punchthrough constant ΘB. The former term decreases strongly with voltage, as in the equilibrium case, but the latter is expected from the electric field profile across KcsA to rise weakly with voltage (Roux et al., 2000). This consideration leads to a natural distinction between the blocking and punchthrough regimes in the I-V curve; the blocking regime prevails at low voltages where KB ≫ ΘB, whereas the reverse relation defines the high voltage punchthrough regime. Finally, we note that ΘK, a kinetic parameter, becomes the equilibrium dissociation constant of K+, KK (0), at V = 0.
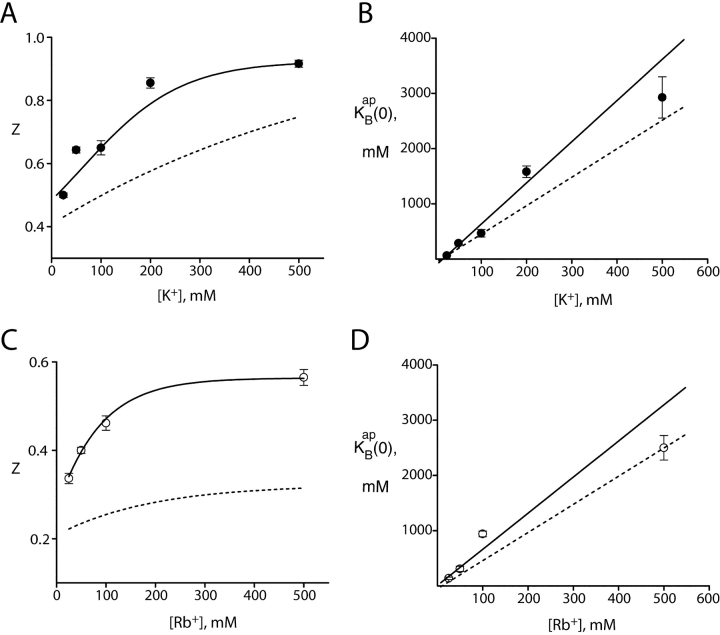
The solid curves of Figs. 2–5 show that this model accounts well for both effects of Na+: block and punchthrough. The key blocking parameters extracted from these curves are, as with the equilibrium approach,  and z. Fig. 7 compares these parameters with their counterparts derived from the equilibrium treatment. We see that despite the profound difference in underlying mechanism, the same qualitative features of these parameters remain: an increase of z with K+ or Rb+ concentration, and a competitive relationship between Na+ and the permeant ion, with substantial selectivity against Na+. Also common to both ways of analyzing the data is the puzzling lower voltage dependence of Na+ block in Rb+ as compared with K+. We note that Na+ punchthrough in Rb+ is less apparent than in K+, since it is masked by the lower voltage dependence of Na+ block.
Figure 7.
Blocking parameters derived from kinetic analysis. I-V curves in K+ (A and B) and Rb+ (C and D) were analyzed by Eq. 5 over the entire voltage range, as in Figs. 2 and 4. The blocking parameters z and  were averaged from individual datasets, as in Fig. 6. The solid curves through z (A and C) have no theoretical significance; solid lines through
  (B and D) represent linear fits as in Fig. 6, with slopes of 7.5 for K+ and 6.5 for Rb+. The dashed curves are taken directly from Fig. 6, for comparison of parameters obtained in the two analysis methods.
DISCUSSION
A great advantage of studying block in this particular K+ channel is structural knowledge of the blocking site. Na+ is known to occupy the intracellular vestibule of KcsA, on the basis of several lines of crystallographic and functional evidence (Jiang and MacKinnon, 2000; Morais-Cabral et al., 2001; Neyton and Miller, 1988b). In examining the effects of intracellular Na+ on K+ currents through KcsA, we distinguish two qualitatively separate phenomena: block and punchthrough. The former manifests itself as a negative resistance below ∼200 mV, whereas the latter appears above this voltage, where the slope of the I-V curve turns positive again as block is relieved by Na+ penetrating the selectivity filter. We consider it worthwhile to scrutinize both of these processes in light of the KcsA structure. Na+ block provides information about ion interactions in the wide, hydrated intracellular vestibule, whereas punchthrough reflects Na+ permeation through a highly K+-specific region of the channel, a low probability process that cannot be observed directly by Na+ current or reversal potential measurements (LeMasurier et al., 2001). Obtaining a quantitative grasp on these two processes, however, presents two problems. First, although block and punchthrough can be individually envisioned, they almost certainly operate simultaneously in the pore and cannot be rigorously separated in the analysis of I-V curves. Second, any theoretical attempt to account for these two processes together must necessarily descend into the abyss of modeling voltage-dependent kinetics in the pore, an approximate venture at best (Andersen, 1999; Miller, 1999; Nonner et al., 1999). Because of these uncertainties, we analyzed our experimental results in two different ways, each with its own soft spot, happily discovering that identical conclusions emerge from the two separate analyses.
We used standard equilibrium analysis (Eq. 1) in the low voltage blocking regime, a procedure that explicitly ignores any nonequilibrium processes present such as punchthrough. This analysis, of course, provides information only about Na+ binding to the vestibule (its voltage dependence and selectivity), and is necessarily silent about permeation of the blocker through the selectivity filter. In parallel, we applied a simplified kinetic model of Na+ entering the vestibule from the intracellular side and leaving it in either of two ways: (1) by the same reversible-block pathway modeled in the equilibrium picture or (2) by an irreversible punchthrough pathway that becomes increasingly important at higher voltages. This kinetic approach eschews details of K+ permeation through the selectivity filter, focusing instead on the vestibule site alone, and the kinetics of ions entering and leaving it. The same parameters (voltage dependence and selectivity of block) as in the equilibrium approach are obtained from this treatment, which additionally provides information about slow permeation of Na+ through the pore.
Ionic Selectivity of the Vestibule
In both treatments, the apparent dissociation constant at zero voltage increases linearly with K+ concentration (Figs. 6 and 7). This behavior is required if Na+ and K+ compete for the binding site in the vestibule. The slope of this line, a direct measure of the inherent selectivity of ion binding at this site (Eq. 3), tells us definitively that the vestibule displays a five- to sevenfold preference for K+ over Na+, equivalent to ∼1 kcal/mol free energy difference. This selectivity is perhaps counterintuitive given the width and hydration of the cavity, but it is in remarkable accord with previous work on ion binding to sites in a mammalian Ca2+-activated K+ channel (Neyton and Miller, 1988b). In that channel, a permeation site now known (Jiang and MacKinnon, 2000) to be analogous to the intracellular vestibule displayed an equilibrium binding selectivity of 5.1 for K+ over Na+ in the channel's open conformation. The close agreement between this literature value and our current results argues for the appropriateness of KcsA as a structural pore model for K+ channels in general in the vestibule and the selectivity filter. Our results establish that the vestibule also selects for Rb+ against Na+; the nearly identical variation of Na+ dissociation constant with concentration of K+ or Rb+ shows that there is no significant selectivity between these two permeant ions, in quantitative agreement with results on the Ca2+-activated K+ channel (Neyton and Miller, 1988b).
The energetic preference for K+ in the vestibule is understandable in terms of KcsA structure. Recent high resolution crystallographic results on KcsA (Zhou et al., 2001b) reveal a full inner hydration shell of eight water molecules coordinating the single K+ ion in the vestibule. The fourfold symmetry of this extraordinary structural feature is imposed by the tetrameric channel; in other words, the vestibule matches the preferred structure of a hydrated K+ ion. But no such ordered water was observed with Na+ in the vestibule. Therefore, we suggest that the selectivity in this wide region arises from a subtle disruption of the larger hydration shell of Na+ when this ion enters the vestibule. Of course, because the KcsA structure is of a closed conformation, this suggestion must remain speculative until a similarly high resolution structure of the open channel is achieved. In any case, this vestibule-selectivity mechanism is very different from the much more severe exclusion of Na+ from the selectivity filter, which discriminates among ions largely denuded of their waters of hydration.
From a physiological viewpoint, the sixfold selectivity of the vestibule acts to lower blockade of K+ channels that unavoidably arises from the presence of intracellular Na+. But is this property of K+ channels a biological imperative or just an adventitious consequence of channel architecture? We suspect that it has compelling biological meaning. Applying our KcsA blocking parameters to a typical K+ channel at the node of Ranvier, for instance, we expect <10% Na+ block at the peak of an action potential; but without selectivity in the vestibule, the channel would be blocked ∼40%, and repolarization would be seriously impeded. In fact, the problem might be much worse than this because this rough calculation ignores the transient, localized increase in internal Na+ concentration expected near the plasma membrane's inner surface at the peak of the action potential.
Voltage Dependence of Na+ Block and Coupled-ion Movement
The block of K+ current by Na+ is voltage dependent, becoming stronger at higher positive voltages. The precise values of effective valence of block differ for the two types of data analysis, with the equilibrium approach producing ∼20% lower values than the full kinetic treatment. This difference is understandable because this simplified treatment underestimates the degree of block by ignoring punchthrough that occurs in the low voltage blocking regime. Nonetheless, according to either analysis, the effective valence of block lies in the range 0.4–0.9. These values are too large to reflect merely the voltage drop a Na+ ion experiences in attaining a blocking site in a wide cytoplasmic vestibule, according to the classical view of effective valence (Woodhull, 1973).
An explanation for these higher-than-expected effective valence values is suggested by the increase in z with K+ or Rb+ concentration (Fig. 6). Because KcsA is a multi-ion channel, it is natural to suppose that as Na+ attains its blocking site, coupled movements of permeant ions occur, as has been clearly shown in quaternary ammonium block of inward-rectifier K+ channels (Spassova and Lu, 1998). Ion coupling adds charge movement to the blocking reaction, and the effect should increase as pore occupancy rises with permeant ion concentration. An additional conclusion from our data analysis, one that was counterintuitive to us, is that the voltage dependence of Na+ block is systematically different in Rb+ than in K+ (Figs. 6 and 7).
A Structure-based Picture of Ion Coupling in Na+ Block
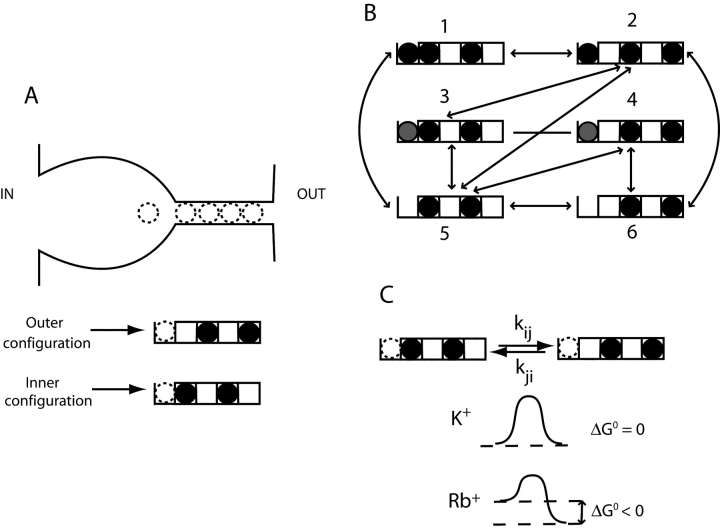
How can we understand the lower value of voltage dependence of Na+ block in Rb+? We find that the difference falls naturally out of a mechanistic feature of KcsA recently deduced from structural analysis: the inhomogeneous energetic landscape of Rb+ in the selectivity filter (Morais-Cabral et al., 2001). We modeled Na+ block coupled to ion permeation using the scheme in Fig. 8 , which shows the correspondence between real positions of ions in the pore and states in the model. We made the simplifying approximation (Morais-Cabral et al., 2001) that the selectivity filter is always occupied by a pair of permeant ions that can shift back and forth between two configurations: inner or outer (Fig. 8). The vestibule can be empty or occupied by either a permeant ion or Na+. Simultaneous exchange between a K+ and a Na+ in the vestibule is prohibited (transitions 1–3 and 2–4), but knock-on transitions are permitted (transitions 1–2 and 2–3). With these constraints, Fig. 8 B shows the allowed transitions among the six kinetic states.
Figure 8.
Model of ion coupling to Na+ block. (A) Ionic occupancy of KcsA. The cartoon shows locations of ion-binding sites in a presumed open conformation of KcsA (note vestibule wider than in closed structure; Fig. 1 A). The diagrams below show the two occupancy configurations of the selectivity filter used here and indicate the position of the vestibule site, which can be either empty or occupied by Na+ or a conducting ion. (B) Kinetic scheme showing all possible ion occupancy states. Black circles represent permeant ions (K+ or Rb+), and gray circles represent Na+. Solid lines indicate allowed transitions. (C) Energetic landscape of selectivity filter. The free energy differences between inner and outer configurations of the selectivity filter, as determined by Morais-Cabral et al. (2001), are illustrated for K+ and Rb+.
We apply to this model an insight arising from recent crystallographic ion occupancy measurements in KcsA (Morais-Cabral et al., 2001). The key point of those results is that K+ and Rb+ experience different free energy landscapes in the selectivity filter. K+ is isopotential, binding equally in the two configurations within the filter, whereas Rb+ is favored by ∼3 kcal/mol in the outer configuration. Accordingly, we introduce an ion-dependent free energy difference between inner and outer configurations (Fig. 8 C). We also include an factor β to account for the possibility of electrostatic repulsion between the ion in the vestibule and ions in the inner configuration, which would tend to favor the outer configuration whenever the vestibule is occupied.
With these considerations in mind, we modeled the Na+ block in K+-like and Rb+-like conditions, using conventional chemical kinetics and assuming exponential voltage dependence to the rate constants. This procedure would be egregiously inappropriate if it were being used to model the I-V curve shapes in the absence of blocker; simple models like this are famously unable to account for the voltage dependence of permeant ion currents (Chen et al., 1992). Our intention is different: we wish only to examine the predicted blocking effect of Na+, with a particular focus on how the voltage dependence of block varies with the free energy landscape of permeant ions in the selectivity filter.
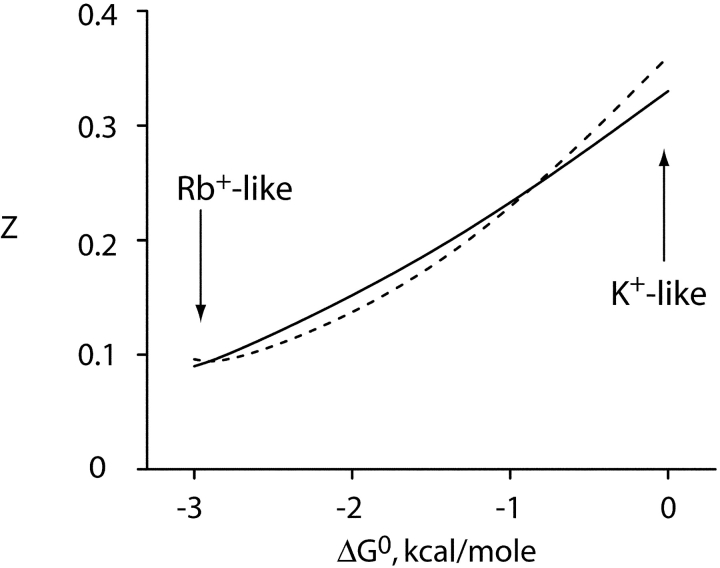
This key feature, the ion's energy landscape, captures the puzzling trend in our experimental results, namely, the reduced voltage dependence of Na+ block in Rb+ compared with K+. With reasonable values of charge movement for individual steps, Na+ blocks the simulated currents in a voltage-dependent manner. We derived a measure of effective valence of Na+ block by analyzing the simulated I-V curves via the equilibrium blocking treatment. The simulated z-values (Fig. 9) are indeed much smaller in Rb+-like (ΔGo ≈ −3 kcal/mol) than in K+-like (ΔGo ≈ 0) conditions. We are interested only in this trend and are not motivated to adjust parameters to obtain agreement with the absolute experimental values of z. This basic feature is a robust property of these simulations and is preserved under all reasonable variation of kinetic parameters; if mild repulsion (β = 100) is added to the model, the difference between effective valence in K+ versus Rb+ is slightly enhanced (Fig. 9).
Figure 9.
Effective valence of simulated Na+ block varies with energy landscape. The scheme of Fig. 8 B was used to simulate Na+ block of permeant ion current. Effective valence of block, z, was calculated by applying Eqs. 1 and 2 to the simulated data over a voltage range of 0–200 mV, and this parameter is plotted against the free energy difference, Go, between outer and inner configurations. The scheme was implemented in MATLAB, using transition rate constants of the form: kij = kij(0)exp(−zijFV/RT). Thermodynamic cycles were balanced and zero voltage first-order rate constants were set to unity at ion concentrations equivalent to the KD value. (solid curve) no repulsion (β = 1); (dashed curve) repulsion included (β = 100). For the simulations illustrated here, charge movement for entry into the vacant vestibule was 0.2, and that of configuration-shifting of the ions in the selectivity filter was 0.4. These values fix the voltage dependences of the other transitions. Voltage dependences of the rate constants were partitioned equally into forward and backward steps.
Why do the different energetic landscapes for K+ versus Rb+ influence the effective valence of Na+ block? A crucial point is that in terms of this permeation model there are two main pathways for block, vacancy-filling and knock-on, which differ in the amount of charge movement associated with each. In the case of Rb+, the inner configuration of ions in the selectivity filter is disfavored by a large factor, and the odd-numbered states of Fig. 8 B are only rarely visited. Consequently, under these circumstances the main blocking pathway is for Na+ to bind to a vacant vestibule (Fig. 8 B, states 2 > 6 > 4). The charge movement associated with this pathway comes solely from the transfer of the Na+ ion through the electric field to its vestibule binding site, with no additional coupled permeant ion movement. Because the vestibule is electrically close to the internal solution, this pathway is of low effective valence.
With K+ as the conducting ion, however, the situation is different. Now, the inner and outer configurations are more in balance, and so neither is highly disfavored. As a consequence, a knock-on blocking pathway operates in addition to the low-z vacancy-filling pathway. In this pathway (Fig. 8 B, states 2 > 3–4), a Na+ ion, seeking to bind in the K+-occupied vestibule, pushes the K+ ion into the selectivity filter, which in consequence switches from the outer to the inner configuration. A more in depth picture detailing ion movements associated with this knock-on pathway is discussed in the PowerPoint file in the online supplemental material (available at http://www.jgp.org/cgi/content/full/jgp20028614/DC1). The net effect of these concerted ion movements is one Na+ ion entering from the inside and one K+ ion exiting to the outside, along with a small redistribution of charge within the selectivity filter. The charge movement associated with this pathway is substantially greater than with vacancy filling, and so the measured effective valence, which reflects a state-weighted average of both pathways, is always higher in K+ than in Rb+.
The Na+ Punchthrough Process
In a formal sense (Eq. 5), we have accounted for the relief of Na+ block at high voltages as representing blocker escape through the selectivity filter. But how does this happen in a K+-specific region? Is the selectivity filter deformed by such high voltages that it loses its preference for K+, or does Na+ simply acquire enough electrostatic energy to surmount the barrier posed by the selectivity filter? Under the first hypothesis, Na+ current should be observed at high voltages in the absence of K+, in contradiction to our observations with KcsA (unpublished data). For this reason, we favor the second hypothesis, which envisions Na+ punchthrough as occurring at all voltages, but with increasing frequency as voltage increases, as embodied in Scheme I.
By conventional electrophysiological measurements, the permeability of KcsA to Na+ is unmeasurably low (LeMasurier et al., 2001). However, the punchthrough process provides an alternative estimate of Na+ permeation rates. We use the predictions of Scheme I to extract a novel selectivity indicator: the relative values of k2 and b2, the rate constants describing escape from the vestibule of K+ versus Na+. In the high voltage limit, where Na+ dissociation toward the outside is much faster than back to the inside (b2 ≫ b−1), Eq. 1 can be readily manipulated to derive a lower limit on this “escape ratio,” expressed in terms of measurable quantities:
 |
(6) |
To use this relation, the experimental value I0/I is best measured at a voltage where punchthrough is beginning to appear but before K+ diffusion-limitation sets in. We chose 300 mV as a compromise and report values (Table I) of Io/I measured at a variety of Na+ and K+ concentrations. To estimate the lower limit for the escape ratio, we use two conservative assumptions. First, we assign a value of 2.5 to the entry rate ratio, k1/b1, partitioning the equilibrium binding selectivity of the vestibule equally into forward and backward rate constants of transfer between the vestibule and the internal solution. Second, the value of ΘK is unknown and quite unconstrained in the I-V fits, although conductance-concentration data suggests that it is on the order of 100 mM (LeMasurier et al., 2001); however, to arrive at a lower limit, we set ΘK = 0. With these considerations, we find that the estimated escape ratio is greater than ∼30 (Table I).
TABLE I.
Estimate of Lower Limit on Escape Ratio
| K+ (mM)
|
24
|
50
|
100
|
200
|
500
|
||||||
|---|---|---|---|---|---|---|---|---|---|---|---|
| Na+ (mM) | 2 | 5 | 5 | 10 | 10 | 25 | 50 | 20 | 50 | 50 | 100 |
| I0/I | 1.8 | 3.1 | 2.2 | 3.4 | 2.7 | 4.7 | 6.7 | 2.4 | 4.2 | 2.6 | 4 |
| k2/b2
lower limit |
24 | 25 | 30 | 30 | 41 | 37 | 29 | 34 | 32 | 40 | 38 |
Values of blocked and unblocked currents at 300 mV were used to calculate lower limits of the escape ratio, k2/b2, from Eq. 6, at the indicated K+ and Na+ concentrations. The entry rate ratio, k1/b1, was taken as 2.5, and ΘK was set equal to zero, as described in the text.
From a simple analysis of the punchthrough process, we conclude that Na+ escapes through the selectivity filter at rates at least 30-fold lower than K+ permeates it. This value should not be directly compared with conventional measurements of channel selectivity, such as the lower limit determined by reversal potentials, where the K+/Na+ permeability ratio is >160 (LeMasurier et al., 2001). The escape ratio reflects the permeation of a single Na+ ion accompanied by two K+ ions, whereas conventional permeability ratios require measurable Na+ current, a situation in which several Na+ ions would simultaneously traverse the pore. Therefore, we might expect that the selectivity of vestibule escape, if we could measure it accurately, would be weaker than the selectivity of conduction.
Conclusions
Intracellular Na+ block has been recognized as a general property of K+ channels for many years. In this paper, we have closely examined this phenomenon in a structural context: single KcsA channels in a defined system. The high resolution structure of this protein provides us with an enhanced level of confidence in interpreting our electrophysiological results. We find that the wide intracellular vestibule, where Na+ blocks the channel, shows significant selectivity toward conducting ions, and we suggest that this novel discrimination among hydrated cations is biologically relevant. In addition, we have shown that Na+ block is strongly influenced by coupled movements of conducting ions cohabiting the channel. Our results provide understanding of block in terms of an ion-permeation model emerging from crystallographic results. Finally, we developed a new measurement of slow Na+ permeation through the K+-selectivity filter.
Acknowledgments
We are grateful to Dr. R. MacKinnon for sharing results in advance of publication, and to J. Mindell, R. Iyer and A. Accardi for comments on the manuscript.
This work was supported by the National Institutes of Health grant GM-31867 to C. Miller.
The online version of this article contains supplemental material.
References
- Andersen, O.S. 1999. Perspectives on ion channel permeation. J. Gen. Physiol. 113:763–764. [DOI] [PMC free article] [PubMed] [Google Scholar]
- Armstrong, C.M. 1971. Interaction of tetraethylammonium ion derivatives with the potassium channels of giant axons. J. Gen. Physiol. 58:413–437. [DOI] [PMC free article] [PubMed] [Google Scholar]
- Bernèche, S., and B. Roux. 2001. Energetics of ion conduction through the K+ channel. Nature. 414:73–77. [DOI] [PubMed] [Google Scholar]
- Bezanilla, F., and C.M. Armstrong. 1972. Negative conductance caused by entry of sodium and cesium ions into the potassium channels of squid axons. J. Gen. Physiol. 60:588–608. [DOI] [PMC free article] [PubMed] [Google Scholar]
- Chen, D.P., V. Barcilon, and R.S. Eisenberg. 1992. Constant fields and constant gradients in open ionic channels. Biophys. J. 61:1372–1393. [DOI] [PMC free article] [PubMed] [Google Scholar]
- Chen, T.-Y., and C. Miller. 1996. Nonequilibrium gating and voltage dependence of the ClC-0 Cl− channel. J. Gen. Physiol. 108:237–250. [DOI] [PMC free article] [PubMed] [Google Scholar]
- Coronado, R., and C. Miller. 1979. Voltage dependent caesium blockade of a cation channel from fragmented sarcoplasmic reticulum. Nature. 280:807–810. [Google Scholar]
- Cuello, L.G., J.G. Romero, D.M. Cortes, and E. Perozo. 1998. pH-dependent gating in the Streptomyces lividans K+ channel. Biochemistry. 37:3229–3236. [DOI] [PubMed] [Google Scholar]
- Doyle, D.A., J.M. Cabral, A. Pfuetzner, J.M. Kuo, J.M. Gulbis, S.L. Cohen, B.T. Chait, and R. MacKinnon. 1998. The structure of the potassium channel: molecular basis of K+ conduction and selectivity. Science. 280:69–76. [DOI] [PubMed] [Google Scholar]
- French, R.J., and J.J. Shoukimas. 1985. An ion's view of the potassium channel. The structure of the permeation pathway as sensed by a variety of blocking ions. J. Gen. Physiol. 85:669–698. [DOI] [PMC free article] [PubMed] [Google Scholar]
- French, R.J., and J.B. Wells. 1977. Sodium ions as blocking agents and charge carriers in the potassium channel of the squid giant axon. J. Gen. Physiol. 70:707–724. [DOI] [PMC free article] [PubMed] [Google Scholar]
- Heginbotham, L., E. Odessey, and C. Miller. 1997. Tetrameric stoichiometry of a prokaryotic K+ channel. Biochemistry. 36:10335–10342. [DOI] [PubMed] [Google Scholar]
- Heginbotham, L., M. LeMasurier, L. Kolmakova-Partensky, and C. Miller. 1999. Single K+ channels from Streptomyces lividans: functional asymmetries and sidedness of proton activation. J. Gen. Physiol. 114:551–560. [DOI] [PMC free article] [PubMed] [Google Scholar]
- Hille, B. 1975. Ionic selectivity of Na+ and K+ channels of nerve membranes. In Membranes, A Series of Advances. vol 3. G. Eisenman, editor. Marcel Dekker, New York. 255–323. [PubMed]
- Hille, B. 2001. Ion Channels of Excitable Membranes. 3 ed. Sinauer Associates, Inc., Sunderland, MA. 814 pp.
- Holmgren, M., P.L. Smith, and G. Yellen. 1997. Trapping of organic blockers by closing of voltage-dependent K+ channels. J. Gen. Physiol. 109:527–535. [DOI] [PMC free article] [PubMed] [Google Scholar]
- Jiang, Y., and R. MacKinnon. 2000. The barium site in a potassium channel x-ray crystallography. J. Gen. Physiol. 115:269–272. [DOI] [PMC free article] [PubMed] [Google Scholar]
- Jiang, Y., A. Lee, J. Chen, M. Cadene, B.T. Chait, and R. MacKinnon. 2002. a. Crystal structure and mechanism of a calcium-gated potassium channel. Nature. 417:515–522. [DOI] [PubMed] [Google Scholar]
- Jiang, Y., A. Lee, J. Chen, M. Cadene, B.T. Chait, and R. MacKinnon. 2002. b. The open pore conformation of potassium channels. Nature. 417:523–526. [DOI] [PubMed] [Google Scholar]
- LeMasurier, M., L. Heginbotham, and C. Miller. 2001. KcsA. It's a potassium channel. J. Gen. Physiol. 118:303–314. [DOI] [PMC free article] [PubMed] [Google Scholar]
- Miller, C. 1982. Bis-quaternary ammonium blockers as structural probes of the sarcoplasmic reticulum K+ channel. J. Gen. Physiol. 79:869–891. [DOI] [PMC free article] [PubMed] [Google Scholar]
- Miller, C. 1999. Ionic hopping defended. J. Gen. Physiol. 113:783–787. [DOI] [PMC free article] [PubMed] [Google Scholar]
- Morais-Cabral, J.H., Y. Zhou, and R. MacKinnon. 2001. Energetic optimization of ion conduction rate by the K+ selectivity filter. Nature. 414:37–42. [DOI] [PubMed] [Google Scholar]
- Neyton, J., and C. Miller. 1988. a. Potassium blocks barium permeation through calcium-activated potassium channels. J. Gen. Physiol. 92:549–567. [DOI] [PMC free article] [PubMed] [Google Scholar]
- Neyton, J., and C. Miller. 1988. b. Discrete Ba2+ block as a probe of ion occupancy and pore structure in the high-conductance Ca2+-activated K+ channel. J. Gen. Physiol. 92:569–586. [DOI] [PMC free article] [PubMed] [Google Scholar]
- Nonner, W., D.P. Chen, and B. Eisenberg. 1999. Progress and prospects in permeation. J. Gen. Physiol. 113:773–782. [DOI] [PMC free article] [PubMed] [Google Scholar]
- Perozo, E., D.M. Cortes, and L.G. Cuello. 1999. Structural rearrangements underlying K+-channel activation gating. Science. 285:73–78. [DOI] [PubMed] [Google Scholar]
- Pusch, M., L. Bertorello, and F. Conti. 2000. Gating and flickery block differentially affected by rubidium in homomeric KCNQ1 and heteromeric KCNQ1/KCNE1 potassium channels. Biophys. J. 78:211–226. [DOI] [PMC free article] [PubMed] [Google Scholar]
- Roux, B., S. Bernèche, and W. Im. 2000. Ion channels, permeation, and electrostatics: insight into the function of KcsA. Biochemistry. 39:13295–13306. [DOI] [PubMed] [Google Scholar]
- Spassova, M., and Z. Lu. 1998. Coupled ion movement underlies rectification in an inward-rectifier K+ channel. J. Gen. Physiol. 112:211–221. [DOI] [PMC free article] [PubMed] [Google Scholar]
- Woodhull, A. 1973. Ionic blockage of sodium channels in nerve. J. Gen. Physiol. 61:687–708. [DOI] [PMC free article] [PubMed] [Google Scholar]
- Yellen, G. 1984. Relief of Na+ block of Ca2+-activated K+ channels by external cations. J. Gen. Physiol. 84:187–199. [DOI] [PMC free article] [PubMed] [Google Scholar]
- Zhou, M., J.H. Morais-Cabral, S. Mann, and R. MacKinnon. 2001. a. Potassium channel receptor site for the inactivation gate and quaternary amine inhibitors. Nature. 411:657–661. [DOI] [PubMed] [Google Scholar]
- Zhou, Y., J.H. Morais-Cabral, A. Kaufman, and R. MacKinnon. 2001. b. Chemistry of ion coordination and hydration revealed by a K+ channel-Fab complex at 2.0 Å resolution. Nature. 414:43–48. [DOI] [PubMed] [Google Scholar]


