

Abstract
The activity of the cardiac Na+/Ca2+ exchanger is stimulated allosterically by Ca2+, but estimates of the half-maximal activating concentration have varied over a wide range. In Chinese hamster ovary cells expressing the cardiac Na+/Ca2+ exchanger, the time course of exchange-mediated Ca2+ influx showed a pronounced lag period followed by an acceleration of Ca2+ uptake. Lag periods were absent in cells expressing an exchanger mutant that was not dependent on regulatory Ca2+ activation. We assumed that the rate of Ca2+ uptake during the acceleration phase reflected the degree of allosteric activation of the exchanger and determined the value of cytosolic Ca2+ ([Ca2+]i) at which the rate of Ca2+ influx was half-maximal (Kh). After correcting for the effects of mitochondrial Ca2+ uptake and fura-2 buffering, Kh values of ∼300 nM were obtained. After an increase in [Ca2+]i, the activated state of the exchanger persisted following a subsequent reduction in [Ca2+]i to values <100 nM. Thus, within 30 s after termination of a transient increase in [Ca2+]i, exchange-mediated Ca2+ entry began without a lag period and displayed a linear rate of Ca2+ uptake in most cells; a sigmoidal time course of Ca2+ uptake returned 60–90 s after the transient increase in [Ca2+]i was terminated. Relaxation of the activated state was accelerated by the activity of the endoplasmic reticulum Ca2+ pump, suggesting that local Ca2+ gradients contribute to maintaining exchanger activation after the return of global [Ca2+]i to low values.
Keywords: Chinese hamster ovary cells, fura-2, digital imaging, mitochondria, SERCA
INTRODUCTION
The Na+/Ca2+ exchange system is an important Ca2+ transporter in the plasma membrane of cardiac myocytes and many other kinds of cells (for reviews see Blaustein and Lederer, 1999; Shigekawa and Iwamoto, 2001). The exchanger couples the movement of Ca2+ across the membrane to the reciprocal movement of 3 (Reeves and Hale, 1984), or perhaps more (Fujioka et al., 2000b; Dong et al., 2002), Na+ ions. Under physiological conditions, it functions principally as a Ca2+ efflux mechanism, although it may also bring Ca2+ into the cell upon strong membrane depolarization or when cytosolic Na+ concentrations increase above normal. The exchanger itself is a protein of 938 amino acids containing 9 transmembrane segments, with a cytosolically disposed hydrophilic domain of 544 amino acids located between transmembrane segments 5 and 6. Removal of the central hydrophilic domain by proteolysis or mutation abrogates regulatory modulation of exchange activity (Matsuoka et al., 1993).
A major mechanism for the regulation of exchange activity involves the interaction of Ca2+ with two well-defined binding sites within the exchanger's central hydrophilic domain (Levitsky et al., 1994). Ca2+-dependent regulation, also called allosteric Ca2+ activation, was first observed in early experiments with squid giant axons (DiPolo, 1979) and has by now been documented by many investigators under a host of different experimental conditions (Blaustein and Lederer, 1999). Most studies indicate that the regulatory sites must be filled with Ca2+ for the exchanger to work in any of its known modes of operation—Na+/Ca2+, Na+/Na+, or Ca2+/Ca2+ exchange. Allosteric Ca2+ activation provides a teleologically satisfying means of turning exchange activity on or off as needed. Importantly, shutting down the exchanger at a low cytosolic Ca2+ concentration ([Ca2+]i) could in principle prevent exchange activity from reducing resting [Ca2+]i to the equilibrium value dictated by the transmembrane Na+ gradient under physiological conditions (∼20 nM for a 3:1 Na+/Ca2+ exchange ratio at a cytosolic Na+ concentration of 10 mM and a membrane potential of −80 mv).
Experiments with excised patches from cardiac myocytes, or frog oocytes expressing the cardiac exchanger (NCX1.1), indicate that the half-maximal Ca2+ concentration (Kh) for the regulatory activation of exchange activity is 200–600 nM (Collins et al., 1992; Hilgemann et al., 1992a; Matsuoka et al., 1995, 1997; Fujioka et al., 2000a). In contrast, measurements of exchange activity in intact cardiac myocytes yielded values ranging from 22 to 125 nM (Miura and Kimura, 1989; Noda et al., 1988; Weber et al., 2001). Previous work from our laboratory measured the Ca2+ dependence of exchange-mediated Ba2+ uptake in transfected Chinese hamster ovary (CHO) cells expressing NCX1.1 (Fang et al., 1998). Cytosolic Ca2+ activated Ba2+ influx cooperatively (Hill coefficient 1.6) with a Kh of 44 nM. It has been difficult to envision how such a high-affinity system could be an effective regulator of exchange activity, since the exchanger would be nearly fully activated at resting cytosolic Ca2+ concentrations of ∼100 nM (Reeves, 1998).
Here, we present a novel approach to measuring the Kh for the allosteric activation of exchange activity by Ca2+. We studied exchange activity operating in its “reverse mode”, when extracellular Na+ was removed so that Ca2+ influx occurred. We found that when reverse exchange activity was initiated, Ca2+ uptake did not begin immediately but showed a pronounced lag phase followed by a progressive increase in the rate of Ca2+ uptake. We assumed that the acceleration of Ca2+ uptake reflected increasing allosteric activation of the exchanger by Ca2+, and defined the Kh for activation as the value of [Ca2+]i when the rate of Ca2+ uptake was half-maximal. This approach yielded Kh values substantially higher (∼300 nM) than we measured in our previous work on Ba2+ uptake. Remarkably, we also found that after a transient exposure to high [Ca2+]i, the activated state of the exchanger persisted for tens of seconds after global [Ca2+]i had declined to values below the Kh for exchanger activation. The persistence of exchanger activation explains why our previous investigations yielded such a low apparent Kh for regulatory Ca2+ activation. Our results indicate that relaxation of the activated state is promoted by Ca2+ uptake into the ER, suggesting that local Ca2+ gradients may be involved in persistent activation.
MATERIALS AND METHODS
Cells
CHO K1 cells or CHO T cells (CHO K1 cells expressing the human insulin receptor (Langille et al., 1999), provided by M. Czech (University of Massachusetts Medical Center), were transfected with the mammalian expression vector pcDNA3 containing the coding sequence for the bovine cardiac Na+/Ca2+ exchanger (NCX1.1; accession number LO6438). Cells expressing exchange activity were selected using the ionomycin treatment of Iwamoto et al. (1998). No qualitative differences in the behavior of transfected CHO K1 or T1 cells were observed, but the T1 transfectants tended to exhibit higher levels of NCX expression and were used for most experiments shown here. Cells expressing the Δ(241–680) deletion mutant were prepared similarly. In this mutant, a large part of the exchanger's central hydrophilic domain has been deleted; the Δ(241–680) mutant shows high activity in the absence of allosteric Ca2+ activation (Matsuoka et al., 1993). An additional mutant was used in one study (see ), in which the positively charged residues within the so-called XIP region (251–270) were changed to alanines; this mutant is resistant to Na+-dependent inactivation, although it displays normal allosteric Ca2+ activation (Condrescu and Reeves, 1999). Cells were grown in a 5% CO2 atmosphere in F12 medium supplemented with 10% fetal calf serum, 2 mM L-glutamine, 100 U/ml penicillin, 100 μg/ml streptomycin, and 20 μg/ml gentamicin. The cell-culture medium, including the fetal calf serum, was obtained from Life Technologies.
Solutions
Na-PSS contained 140 mM NaCl, 5 mM KCl, 1 mM MgCl2, 10 mM glucose, and 20 mM Mops, buffered to pH 7.4 with Tris. Li-PSS had an identical composition except that LiCl was substituted for NaCl. K-PSS contained 140 mM KCl, 1 mM MgCl2, 10 mM glucose, and 20 mM Mops, buffered to pH 7.4 with Tris. Unless otherwise indicated, experiments were performed at room temperature; for experiments at 37°C, the pH of the solutions was adjusted to pH 7.4 at 37°C. Biochemicals were purchased from Sigma-Aldrich.
Fura-2 Imaging
Cells grown on 25-mm circular coverslips were loaded with fura-2 by incubating them for 30 or 40 min at room temperature in Na-PSS containing 1 mM CaCl2, 1% fatty acid free bovine serum albumin, 0.25 mM sulfinpyrazone (to retard fura-2 transport from the cell), and 3 μM fura-2 AM (Molecular Probes). The coverslips were then washed in Na-PSS + 1 mM CaCl2, placed in a stainless steel holder (bath volume ∼0.8 ml; Molecular Probes), and viewed in a ZEISS Axiovert 100 microscope coupled to an Attofluor digital imaging system. Alternating excitation at 334 and 380 nm was obtained through the use of appropriate filters, and fluorescence was monitored with a long pass filter set for 510 nm. In most cases, 40–60 cells were individually monitored from each coverslip. Data points were taken at ∼1.7-s intervals.
Experimental Protocol
To deplete internal Ca2+ stores and prevent Ca2+ uptake into the ER, cells were washed in Na-PSS + 0.3 mM EGTA and then treated with 200 μM ATP (a purinergic agonist) + 2 μM thapsigargin (Tg), an inhibitor of the sarco(endo)plasmic reticulum Ca-ATPase (SERCA) (Lytton et al., 1991). Experiments were begun ∼10 min after the application of ATP + Tg. In experiments where ATP-induced Ca2+ release was monitored, fura-2–loaded cells were preincubated for 5–10 min in Na-PSS + 1 mM CaCl2; the cells were then washed with 4 ml of Na-PSS + 0.1 mM EGTA immediately before beginning the experiment. Changes in the bath medium were performed by manually applying ∼4 ml of the desired medium with a cannulated syringe over a period of 15 s. Reverse exchange activity was initiated by applying K-PSS + 0.1 mM CaCl2.
Calibration of [Ca2+]i
Each cell was calibrated individually using the procedure of Grynkiewicz et al. (1985). During the course of this work, we examined various methods of determining Rmin, the 334/380 ratio at [Ca2+]i ∼0. The procedure finally adopted involved applying Na-PSS + 0.3 mM EGTA to the cells after terminating the experiment, and then adding 10 μM ionomycin + 10 mM NH4Cl in the same medium to release any residual Ca2+ from internal stores; the NH4Cl was added to facilitate ionomycin-induced Ca2+ release from acidic stores. After the resulting [Ca2+]i transient decayed, 1 ml of 50 μM EGTA-AM in Na-PSS + 0.3 mM EGTA was applied and the 334/380 ratio was measured at 5-min intervals until no further decline was noted (usually ∼30 min). This ratio (average of 10 data points) was taken as Rmin after correcting for background fluorescence (see below). A 1:4 mixture of 100 mM CaCl2 and K-PSS was then applied (along with an additional 10 μM ionomycin) and, after the fura signal stabilized, the average ratio over 10 data points, after background correction, was taken as Rmax. Finally, 10 mM MnCl2 in Na-PSS (1 ml) was applied to the cells to quench fura-2 fluorescence and the final fluorescence intensities at 334 nm and 380 nm excitation, averaged over 10 data points, were taken as background fluorescence. For each cell, individual background fluorescence values were subtracted from the experimental fluorescence values at 334 and 380 nm excitation, and Rmin, Rmax, and Sf/Sb values were computed; the latter value is the ratio of corrected fluorescence intensities at 380 nm under conditions for determination of Rmin (Sf) and Rmax (Sb). Experimental values for [Ca2+]i were then calculated from the ratio of background-corrected fluorescence at 334/380 nm excitation (Rcorr), using the formula of Grynkiewicz et al. (1985), i.e., [Ca2+]i = KD,fura(Sf/Sb)(Rcorr − Rmin)/(Rmax − Rcorr). For experiments at room temperature, KD,fura was assumed to be 274 nM (Shuttleworth and Thompson, 1991); for experiments at 37°C, KD,fura was assumed to be 224 nM (Grynkiewicz et al., 1985).
Matching Procedure for Kh Determination
The data were analyzed using Microsoft Excel spread-sheet functions. For each cell, the rate of change in [Ca2+]i with time at each data point was determined over a rolling interval of five data points using the Excel SLOPE function. The MAX function was then used to find the value of the maximal slope (Vmax). The MATCH function was used to identify the data point corresponding to Vmax and the point at which the slope was equal to 0.5 Vmax. For the second comparison, MATCH returned the largest value within the dataset (the time course of Ca2+ uptake) that was less than or equal to Vmax; the values were scrutinized to be certain that they reflected time points earlier than the data point for Vmax. The INDEX function was then used to return the [Ca2+]i value corresponding to the data point at 0.5 Vmax; this value was taken as the Kh for regulatory Ca2+ activation. Because MATCH returns values that may be less than precisely 0.5 Vmax, Kh values returned by the matching procedure tended to be less than the Kh values obtained by curve-fitting (see results). The advantage of the matching procedure is that data for all the cells on the cover-slip can be analyzed in a manageable fashion.
Statistical Analysis
Pooled results from multiple cells on a single coverslip are expressed as mean values ± SD. Pooled results from several coverslips are expressed as the mean value ± SEM. Significance testing was done using Student's two-tailed t test for paired or unpaired samples, as indicated.
RESULTS
The Kh for Allosteric Ca2+ Activation
Fig. 1 displays the time course of Ca2+ uptake after the initiation of the reverse (Ca2+ influx) mode of Na+/Ca2+ exchange in CHO cells expressing the wild-type Na+/Ca2+ exchanger (NCX1.1). In these experiments, the cells were pretreated with ATP + thapsigargin (Tg), an irreversible inhibitor of the SERCA pump, to release Ca2+ from internal stores and prevent subsequent Ca2+ uptake by the ER. The cells were then incubated in Ca2+-free Na-PSS for 10 min before beginning the experiment. Under these conditions, the initial cytosolic Ca2+ concentration was usually <25 nM. The trace labeled “1” in Fig. 1 (filled circles) demonstrates that when the reverse exchange activity was initiated by applying a Na+-free solution (K-PSS) containing 0.1 mM CaCl2 (arrow labeled “K + Ca”), Ca2+ uptake was very slow for ∼15 s but subsequently accelerated and attained a linear rate after an additional 10–20 s (see expanded scale in Fig. 1 B).
Figure 1.

Time course of exchange-mediated Ca2+ uptake in transfected CHO cells expressing NCX1.1. (A) Cells were treated with ATP + Tg in Na-PSS + 0.3 mM EGTA 10 min before beginning the experiment (see materials and methods). At t = 30 s, Na-PSS containing either 0.1 mM EGTA (trace 1, filled circles) or 0.3 mM CaCl2 (trace 2, open circles) was applied to the cells, and at t = 60 s, the medium was changed to K-PSS + 0.1 mM CaCl2. Results are the average [Ca2+]i values for 51 cells for trace 1 and 60 cells for trace 2. See materials and methods for details of the calibration method. (B) Data in A on an expanded time scaled. The dotted lines are extrapolations of the linear phase of Ca2+ uptake. Similar results were obtained with four additional pairs of coverslips.
The other trace in Fig. 1 (labeled “2”, open circles) shows the effects of transiently increasing [Ca2+]i before initiating reverse exchange activity. This was accomplished by applying Na-PSS containing 0.3 mM CaCl2 for 30 s before switching to K-PSS + 0.1 mM CaCl2. [Ca2+]i increased from an initial value of 12 nM to 95 nM, and then declined to 80 nM just before the solution switch to K-PSS + 0.1 mM CaCl2. The increase in [Ca2+]i in Na-PSS was due to Ca2+ entry through store-operated channels that had been activated by the prior release of Ca2+ from internal stores. Under these conditions, the initial delay in Ca2+ uptake was markedly reduced, and the cells attained a linear rate of uptake within ∼10 s of the switch to K-PSS + 0.1 mM CaCl2 (Fig. 1 B). The reduced lag period is clearly evident from the dashed lines in Fig. 1 B, which represent the extrapolations of the linear phase of Ca2+ uptake back to its intersection with the time axis.
We interpret these results in the following way: For trace 1, exchange activity was initially low because [Ca2+]i (∼12 nM) was below the Kh for regulatory Ca2+ activation. As [Ca2+]i slowly increased during the lag period, progressive activation of the exchanger by Ca2+ occurred, leading to an acceleration of Ca2+ uptake through positive feedback. For trace 2, the exchanger was partially activated by the Ca2+ entering through store-operated channels, leading to a marked reduction in the lag period and an increased initial rate of Ca2+ uptake. There was still a lag period of ∼10 s for trace 2, suggesting that the exchanger was not fully activated by the level of [Ca2+]i attained (∼80 nM). Note that the store-operated channels did not contribute significantly to Ca2+ uptake in K-PSS because (a) the external Ca2+ concentration (0.1 mM) was too low to support extensive Ca2+ entry through store-operated channels and (b) channel activity was reduced in this depolarizing medium. In untransfected CHO cells, which lack Na+/Ca2+ exchange, [Ca2+]i increased by only ∼30% in K-PSS + 0.1 mM CaCl2 (unpublished data).
Support for this interpretation is provided by the results of experiments with cells expressing a deletion mutant of NCX1.1, Δ(241–680). This mutant is missing a large portion of the exchanger's central hydrophilic domain and does not require Ca2+ for the activation of exchange activity. Trace 2 in Fig. 2 A (open circles) represents the average [Ca2+]i for 59 Δ(241–680) cells and shows that Ca2+ uptake began immediately upon initiating reverse exchange activity, i.e., without a lag beyond that required for mixing (2–4 s). The trace with the filled circles is the same as trace 1 in Fig. 1, superimposed so that the time at which K-PSS + 0.1 mM CaCl2 was applied is the same for both traces. Fig. 2 B displays the rates of Ca2+ uptake for nine individual Δ(241–680) cells. Although there was variation in the rates of Ca2+ uptake, no lag period was observed in any of these cells, or in the others not shown.
Figure 2.

Time course of exchange-mediated Ca2+ uptake in transfected CHO cells expressing the Δ(241–680) deletion mutant of NCX1.1. Cells were pretreated as described in Fig. 1; K-PSS + 0.1 mM CaCl2 was applied at 30 s. (A) Trace 2 (open circles): average [Ca2+]i values for 59 Δ(241–680) cells. Trace 1 (filled circles) is identical to trace 1 in Fig. 1, except that 30 s have been subtracted from the time points to make the time of application of K-PSS + 0.1 mM CaCl2 coincide for both traces. (B) [Ca2+]i for nine individual Δ(241–680) cells.
A very different pattern emerged when individual cells expressing the wild-type exchanger were examined. Fig. 3 A shows the fura-2 signals for 7 out of the 51 cells monitored for trace 1 in Fig. 1. As shown, the individual cells each displayed a lag period, but the duration of the lag period varied greatly. The trace labeled “1” in Fig. 3 A is for the cell that responded most rapidly in this experiment. The trace labeled “7” is for one of the seven cells that failed to show Ca2+ uptake at all. As shown in Fig. 3 B, there was a strong inverse correlation between the length of the lag period and the maximal rates of Ca2+ uptake (Vmax) among the 44 responding cells in the population (P << 10−3). Because the cells showed such a high dispersion in their lag periods, further analysis of the results was done on a cell-by-cell basis.
Figure 3.

Exchange-mediated Ca2+ influx for seven individual cells. (A) Cells were selected from the coverslip used for trace 1 in Fig. 1. Upper arrow for each trace: data point corresponding to Vmax (see materials and methods) Bottom arrow for each trace: data point corresponding to 0.5 Vmax; [Ca2+]i at 0.5 Vmax provides an estimate of the Kh for allosteric Ca2+ activation. (B) Correlation between Vmax and time-to-Vmax using all the responding cells (Vmax ≥ 5 nM/s) from the coverslip for trace 1 in Fig. 1. r, correlation coefficient.
Fig. 4 presents the rates of Ca2+ uptake plotted against the value of [Ca2+]i for each of the six responding cells shown in Fig. 3 A; the cells are numbered in order of increasing duration of the lag period. The rate of Ca2+ uptake at each data point was computed as the slope of the trace over an interval that included two data points on either side of the specified point (see materials and methods). A set of time points was chosen for analysis that ranged from the sigmoidal “foot” of the Ca2+ uptake curve to a point where the rate was maximal, or in some cases, just beyond maximal. The rates of Ca2+ uptake (v) were fit to the Hill equation (shown as continuous curves in Fig. 4).
Figure 4.

Fit of data from cells in Fig. 3 to Hill Equation. The cells in Fig. 3 were numbered according to increasing duration of the lag period; cell 7 in Fig. 3 is not shown. Rates of Ca2+ uptake were determined as the slope of the Ca2+ uptake curves, measured over a rolling interval of five data points as described in materials and methods. The rates and corresponding values for [Ca2+]i for each data point during the period of accelerating Ca2+ uptake were fit to the Hill equation using the programs in Sigma Plot. The continuous line was drawn using the parameters obtained from the fitting program. Kh values for each cell are presented in the panels. Similar plots and equation parameters were obtained when the interval for calculating the rates was reduced to two data points instead of five; the scatter of the points about the fit line was much greater, however.
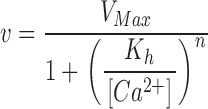 |
We assume that these relations reflect the concentration dependence for regulatory activation of the exchanger by cytosolic Ca2+. Vmax values varied over a fivefold range, from 35 nM/s (cell 6) to 182 nM/s (cell 2); the average value (± SD) for the Hill coefficient (n) was 2.6 ± 0.46. The values for Kh are presented in the panels for the individual cells. The average Kh (±SD) for these six cells was 248 ± 89 nM. This analysis was repeated for three additional cells from each of two additional coverslips; an additional nine cells were selected from three coverslips for experiments performed at 37°C. The values obtained at 37°C did not differ significantly from the data at room temperature and so the results for all 21 cells were pooled to yield the following mean values (±SEM): Vmax = 153 ± 22 nM/s, n = 2.8 ± 0.15, Kh = 232 ± 18 nM.
The above approach used only a small number of cells compared with the total monitored in each experiment. To estimate the value of Kh for the total population of responding cells, we used the spread-sheet matching procedure described in materials and methods; this approach is illustrated by the data for the six cells presented in Fig. 3 A. Each trace in Fig. 3 A is decorated with two arrows. The upper arrow corresponds to the data point where the rate of Ca2+ uptake is maximal (Vmax). The lower arrow (in bold) corresponds to the data point at which the slope is approximately half of the maximal slope. The [Ca2+]i value at this point provides an estimate of the Kh for allosteric activation of the exchanger by Ca2+. The average value for the six cells analyzed in Fig. 3 A was 193 nM; this value is slightly less than that obtained by the curve-fitting procedure for the same cells (248 nM; paired t test P = 0.02) because the matching procedure finds data points where the rate may be less than precisely half of the maximal rate (see materials and methods). Excluding the seven cells that showed no Ca2+ uptake (Vmax < 5 nM/s), the average Kh (±SD) for all of the cells on the coverslip was 237 ± 74 nM (n = 44). This analysis was performed for the six coverslips mentioned in the previous paragraph, three each for experiments performed at room temperature and 37°C. Again, the data at the two temperatures were not significantly different and so the average Kh values from each coverslip were pooled to yield an overall average value (±SEM) of 231 ± 14 nM (n = 6). We compared the values obtained by the matching procedure with those obtained by curve-fitting for the 21 cells discussed in the previous paragraph. The values obtained by curve fitting were 33 ± 4.9% (±SEM) higher than the values obtained by the matching procedure. Correcting for this difference increased the average Kh for the six coverslips to ∼300 nM.
Persistence of Ca2+ Activation
In a previous publication (Vazquez et al., 1997), we demonstrated that exchange activity increased transiently after ATP-induced Ca2+ release from internal stores. Stimulation was observed over a narrow range of low [Ca2+]i values and the results seemed compatible with our subsequent report of a high affinity for Ca2+ activation. The following experiments were done to reevaluate this issue using the analytical approach described above. For the experiment in Fig. 5 A, the application of ATP (200 μM) and Tg (2 μM) in Na-PSS + 0.3 mM EGTA elicited a large Ca2+ transient that decayed rapidly back toward baseline levels. 40 s after adding ATP/Tg, reverse exchange activity was initiated by applying K-PSS + 0.1 mM CaCl2. [Ca2+]i increased rapidly, without the lag period observed in the experiments described previously. The data are displayed on an expanded time scale in Fig. 5 B (filled circles), where t = 0 corresponds to the time at which K-PSS + 0.1 mM Ca2+ was applied. The average [Ca2+]i at the point where reverse exchange was initiated was 87 nM, well below the Kh for activation of reverse exchange activity (∼300 nM), and yet no lag period was observed. The traces with the open circles in Fig. 5, A and B, show the response of the same coverslip to a second application of K-PSS + 0.1 mM CaCl2 after the cells had rested for a 10 min interval in Na-PSS + 0.1 mM EGTA. A long lag period was observed after the second application of K-PSS + 0.1 mM CaCl2 (open circles), similar in duration to that observed for trace 1 in Fig. 1. We conclude that the exchanger remained activated for a while (see below) after Ca2+ release from internal stores, even though global [Ca2+]i had declined to values well below the Kh for activation of exchange activity. We refer to this phenomenon as persistent Ca2+ activation.
Figure 5.

Persistence of allosteric Ca2+ activation. (A) Cells were treated with 200 μM ATP + 2 μM Tg in Na-PSS + 0.1 mM EGTA at t = 60 s and K-PSS + 0.1 mM CaCl2 was applied at t = 100 s (filled circles). Na-PSS + 0.1 mM EGTA was applied as indicated and, after a 10-min interval, K-PSS + 0.1 mM CaCl2 was applied a second time (open circles). Data are the average [Ca2+]i values for 42 cells. (B) Data from first and second applications of K-PSS + 0.1 mM CaCl2 are superimposed. Zero time in the figure corresponds to the time of addition of K-PSS + 0.1 mM CaCl2 in each case. Symbols as in A. Similar results were obtained with three additional coverslips. (C) The experiment described in A was repeated with cells expressing the Δ(241–680) mutant of the exchanger. Data from the first and second applications of K-PSS + 0.1 mM CaCl2 are superimposed, as in B. Symbols as in A and B.
Fig. 5 C presents the results of an identical experiment performed with cells expressing the Δ(241–680) mutant, in which activity is not dependent on regulatory Ca2+. As shown, the rates of Ca2+ uptake were nearly the same for the first and second application of K-PSS + 0.1 mM CaCl2, i.e., application of ATP + Tg did not stimulate the activity of the mutant exchanger, and no lag period was observed after the second application of K-PSS + 0.1 mM CaCl2. The results with the mutant strongly support the conclusion that the enhancement of wild-type activity after ATP-induced Ca2+ release reflects the persistence of the Ca2+-activated state after the return of [Ca2+]i to low values.
Analysis of the data for individual wild-type cells provides additional support for this interpretation. Fig. 6 displays the data for six cells selected from the population of 42 cells monitored in the experiment shown in Fig. 5 A. The traces following the first and second applications of K-PSS + 0.1 mM Ca2+ are superimposed in Fig. 6 (filled and open circles, respectively), where t = 0 corresponds to the time at which exchange activity was initiated. In each case, [Ca2+]i increased without a significant lag period when exchange activity was initiated 40 s after ATP + Tg (filled circles). The rates of Ca2+ influx for cells 1 and 3 showed a tendency to accelerate after 20–30 s of uptake, and the Kh values determined by the matching process described above were 295 nM and 231 nM, respectively. For the remaining cells, the matching analysis returned values that were essentially identical to the value of [Ca2+]i at t = 0 (Kh values given in figure).
Figure 6.

Data for six cells from the coverslip used for the experiment shown in Fig. 5. Symbols as in Fig. 5 (see legend to Fig. 5 and text for further details). Apparent Kh values determined by the matching procedure are given next to each trace. ND, not determined.
For the second application of K-PSS + 0.1 mM CaCl2 (open circles), lengthy lag periods were observed, followed by a strong acceleration of Ca2+ uptake after periods ranging from 30 to >100 s, i.e., the cells behaved essentially identically to those shown in Fig. 3. The matching procedure returned Kh values between 241 and 313 nM for five of the cells shown after the second application of K-PSS + 0.1 mM CaCl2. The rate of Ca2+ influx for cell 6 was <5 nM/s after the second application of K-PSS + 0.1 mM CaCl2, and so it was not analyzed; note that this cell showed a much higher rate of Ca2+ uptake when K-PSS + 0.1 mM CaCl2 was applied after ATP addition (filled circles).
The following analyses pertain to the 31 cells on this coverslip that responded to both applications of K-PSS + 0.1 mM CaCl2 (Vmax ≥ 5 nM/s). When exchange activity was initiated 40 s after ATP/Tg addition, the time required to attain a maximal rate of Ca2+ uptake (Vmax) after the initiation of exchange activity was 22 ± 12 s, as compared with 141 ± 57 s when activity was initiated 10 min later (± SD; P << 10−6, paired t test). The average Kh values (±SD) measured 40 s and 10 min after ATP/Tg addition were 132 ± 133 nM and 269 ± 153 nM, respectively (P < 2 × 10⁻⁵, paired t test). It is notable that of the 11 cells that did not show significant Ca2+ uptake after the second addition of K-PSS + 0.1 mM CaCl2, 10 showed measurable Ca uptake when assayed 40 s after ATP addition, as exemplified by cell 6 in Fig. 6. Similar results were obtained with two additional coverslips. The behavior of the individual cells strongly supports our conclusion that exchanger remains in an activated state following the return of [Ca2+]i to values below Kh.
The effect of the exposure to high Ca2+ dissipates within about a minute after adding ATP. Fig. 7 shows three experiments where exchange activity was initiated 35, 45, or 60 s following the addition of ATP (65, 75 and 90 s in the figure; see arrows at top of panel). Fig. 7 A shows the superimposed traces for the average [Ca2+]i values for each coverslip and Fig. 7, B–D, show several individual cells for each experiment. For the experiment where exchange activity was initiated 35 s after ATP addition (Fig. 7 B), rapid Ca2+ influx was observed very shortly after the solution change to K-PSS + 0.1 mM CaCl2 (indicated by the arrow labeled “Ca” in the figure). The average time (±SD) required to attain Vmax was 24 ± 15 s after the solution change (n = 64 cells). When exchange activity was initiated 45 s after ATP addition (Fig. 7 C), significant lag periods were observed for some cells; the average time required to attain Vmax for this experiment was 44 ± 20 s after the solution change (n = 62). When exchange activity was initiated 60 s after ATP addition (Fig. 7 D), a well-developed pattern of variable lag periods was observed, with an average time to Vmax of 74 ± 30 s (n = 68). The differences between the various times were highly significant (P << 10−6, unpaired t test). We conclude that the activated state of the exchanger dissipates over a time course of tens of seconds.
Figure 7.

Exchange-mediated Ca2+ uptake at various times following ATP addition. (A) Superimposed average traces of experiments in which K-PSS + 0.1 mM Ca2+ was applied 35, 45, and 60 s after addition of 50 μM ATP + 2 μM Tg; times of application of K-PSS + 0.1 mM Ca2+ correspond to 65, 75, and 90 s in the figure. Average [Ca2+]i values are shown for 64, 62, and 68 cells, respectively. (B–D) Selected individual cells from each of the coverslips shown in A. Arrow labeled “Ca” corresponds to application of K-PSS + 0.1 mM CaCl2. Similar results were obtained in 2 additional experiments. For the coverslip shown in B, several cells exhibited spontaneous Ca2+ release before the addition of ATP + Tg; the reasons for this rare behavior are unknown.
In addition to inducing an increase in [Ca2+]i, the activation of purinergic receptors initiates other signaling processes, such as activation of protein kinase C through diacylglycerol production, that could potentially contribute to persistent Ca2+ activation. To assess whether a rise in [Ca2+]i was sufficient by itself for persistent exchanger activation, we incubated the cells in Na-PSS + 0.3 mM EGTA for 10 min after treating them with ATP + Tg, and then measured exchange activity after a transient application of external Ca2+. The results of one such experiment are shown in Fig. 8 A. The trace with the filled circles shows a typical response of the cells to the application of K-PSS + 0.1 mM CaCl2 at t = 30 s; note the lengthy lag period. Na-PSS + 0.3 mM EGTA was then applied and at 300 s, 1 mM Ca2+ was applied in Na-PSS (open circles). Ca2+ entered the cells through store-operated channels and [Ca2+]i increased to a plateau value of ∼150 nM. It should be noted that this value of [Ca2+]i was much lower than that observed for parental CHO cells under the same conditions, where [Ca2+]i values of >800 nM were attained (unpublished data). After 1 min, the external Ca2+ was removed with Na-PSS + 0.3 mM EGTA, and 20 s later, K-PSS + 0.1 mM CaCl2 was applied to initiate a second round of reverse Na+/Ca2+ exchange. As shown in Fig. 8 A, [Ca2+]i increased with only a short lag period. The data for the two traces are superimposed on an expanded time scale in Fig. 8 B where t = 0 corresponds to the time of application of K-PSS + 0.1 mM CaCl2. Note that [Ca2+]i just before the initiation of reverse exchange activity was the same (∼25 nM) for the two traces.
Figure 8.

Exchange-mediated Ca2+ influx after transient elevation of [Ca2+]i by store-operated channel activity. (A) Protocol: Cells were pretreated 10 min before beginning the experiment with ATP + Tg to release Ca2+ stores as described in Fig 1. K-PSS + 0.1 mM Ca2+ was applied at t = 30 s and at t ∼160 s, the medium was returned to Na-PSS + 0.1 mM EGTA (trace 1, filled circles). At t = 300 s, Na-PSS + 1 mM Ca2+ was applied, followed by Na-PSS + 0.3 mM EGTA at 360 s and a second application of K-PSS + 0.1 mM CaCl2 at 380 s (trace 2, open circles). Average [Ca2+]i values from 54 cells are shown. (B) Superimposed traces from A; t = 0 corresponds to the addition of K-PSS + 0.1 mM CaCl2. Symbols as in A. (C–E) Superimposed traces for 3 individual cells; t = 0 corresponds to the application of K-PSS + 0.1 mM Ca2+ in each case. Symbols as in A. Kh values given by the matching procedure are presented in each panel for each trace. Similar results were obtained in two additional experiments.
Fig. 8, C–E, show how three individual cells behaved in this experiment. In each case, [Ca2+]i increased more rapidly after the transient elevation of [Ca2+]i, although the [Ca2+]i values at the time of initiation of exchange activity were identical in the two circumstances. The time course of Ca2+ uptake was sigmoidal in each case, with similar apparent Kh values, determined by the matching procedure described above. The average time (±SD) required to attain Vmax was 42 ± 22 s when exchange activity was initiated following the transient increase in [Ca2+]i, whereas a value of 77 ± 29 s was obtained for the cells analyzed in the absence of a prior Ca2+ transient (P << 10−6, paired t test; n = 54). For the 29 cells that responded to both applications of K-PSS + 0.1 mM Ca2+ (Vmax ≥ 5 nM/s), the average Kh values (±SD) were 194 ± 69 nM and 167 ± 53 nM with or without a prior Ca2+ transient, respectively; the difference was not statistically significant (P = 0.13, paired t test). (In this experiment, 17 cells showed Vmax > 5 nM/s after the Ca2+ transient although they did not respond in the absence of a prior Ca2+ transient; when these cells were included in the analysis, the Kh following the Ca2+ transient became 177 ± 81 nM.) Thus, although the cells responded more rapidly after Ca2+ application in Na-PSS, their Kh for allosteric Ca2+ activation was identical to the same cells without prior Ca2+ application.
Fig. 9 shows the results of a similar experiment, except that in this case 1 mM CaCl2 was applied in Li-PSS instead of Na-PSS. Ca2+ entry under these conditions was due to both store-dependent Ca2+ channels and reverse Na+/Ca2+ exchange, and [Ca2+]i attained levels comparable to that seen after ATP-induced Ca2+-release. Two superimposed traces are shown in Fig. 9 A, representing average [Ca2+]i values for all the cells monitored and corresponding to two pulses of Li-PSS + 1 mM Ca2+ applied to the same coverslip, separated by an interval of 5 min. 30 s after terminating the first pulse with Na-PSS + 0.3 mM EGTA, reverse exchange activity was initiated by applying K-PSS + 0.1 mM CaCl2 (trace 1, filled circles). The cells were returned to Na-PSS + 0.3 mM EGTA and, after 5 min, a second 1-min pulse of Li-PSS + 1 mM CaCl2 was applied; in this case, exchange activity was initiated 60 s after terminating the pulse (trace 2, open circles). The two traces are superimposed so that t = 0 in Fig. 9 A corresponds to the time of addition of Li-PSS + 1 mM CaCl2. The data are shown on an expanded time scale in Fig. 9 B but in this case, t = 0 corresponds to the time of initiation of reverse exchange activity with K-PSS + 0.1 mM CaCl2. Note that in trace 1 (filled circles), Ca2+ uptake begins with a barely discernible lag period; for trace 2, a more sigmoidal time course of Ca2+ uptake was observed. The results for four individual cells are shown in Fig. 10, C–F ; the cells all show Ca2+ uptake without a lag period for trace 1, with variable lag periods for trace 2. Fig. 10 E shows a cell with high exchange activity that did not show a lag period for either trace 1 or trace 2. For trace 1, the average time (±SD) to reach Vmax after the application of K + 0.1 mM CaCl2 was 20 ± 9.6 s, while the corresponding value for trace 2 was 50 ± 33 s (P << 10−6, paired t test; n = 62).
Figure 9.

Exchange-mediated Ca2+ uptake following transient elevation of [Ca2+]i to high values. Protocol: Cells were treated with ATP + Tg 10 min before beginning the experiment as described in Fig. 1. Li-PSS + 1 mM CaCl2 was applied at t = 30 s, followed by Na-PSS + 0.3 mM EGTA at 90 s, K-PSS + 0.1 mM CaCl2 at 120 s, and Na-PSS + 0.3 mM EGTA at 210 s. After an interval of 6 min, the applications described above were repeated, except that K-PSS + 0.1 mM CaCl2 was added 60 s after termination of the [Ca2+]i transient. (A) Superimposed average [Ca2+]i for 62 cells during the two series of sequential additions described in the protocol; t = 0 corresponds to the time of application of Li-PSS + 1 mM CaCl2 in each case. (B) Data in A on expanded time scale, superimposed so that t = 0 corresponds to the time of addition of K-PSS + 0.1 mM CaCl2. Traces 1 (filled circles) and 2 (open circles) correspond to applications of K-PSS + 0.1 mM CaCl2 30 and 60 s after termination of prior elevation of [Ca2+]i with Na-PSS + 0.3 mM EGTA. (C–F) Data for four individual cells from coverslip. Symbols as described for B. Similar results were obtained in four additional experiments.
Figure 10.

Local Ca2+ gradients and persistent Ca2+ activation. (A) Protocol: At t = 30 s, ATP (50 μM) in Na-PSS + 0.1 mM EGTA, with (filled circles) or without (open circles) 2 μM Tg, was applied. At t = 50 s, 1 ml of Na-PSS + 0.1 mM EGTA containing 0.5 mg/ml hexokinase (hex) was added, and at t = 65 s, K-PSS + 0.1 mM LaCl3 was applied. (B) Effect of hexokinase in nontransfected CHO-T1 cells. ATP (50 μM) was applied at t = 30 s, 0.5 mg/ml hexokinase at t = 50 s, and K-PSS + 0.1 mM LaCl3 at t = 70 s (filled circles). For the control trace (open circles), 50 μM ATP as applied at 30 s and no other additions were made. (C) Filled circles: cells were treated with ATP + Tg 10 min before beginning of experiment and K-PSS + 0.1 mM LaCl3 was applied at 65 s. Open circles: cells were not treated with ATP or Tg, but were washed with Na-PSS + 0.1 mM EGTA immediately before beginning the experiment and K-PSS + 0.1 mM LaCl3 was applied at t = 65 s. For all traces, Na-PSS + 0.3 mM EGTA was applied at 4 min. (D) Rates of exchange-mediated La3+ uptake between 100–120 s for the conditions indicated. +,− refers to presence or absence of ATP or Tg, as indicated; +* refers to ATP or Tg added 10 min before experiment. RU, ratio units; †, P < 0.002 versus +ATP, +Tg; ‡, P < 0.0005 versus +ATP, +Tg, P < 0.01 vs. +ATP, −Tg (unpaired t test, n = 4).
The data in Figs. 8 and 9 indicate that the persistence of the activated state was induced by an increase in [Ca2+]i itself, and that other signaling processes initiated by purinergic receptor activation were not involved. The degree of activation appeared to be less for the experiment from Fig. 8, where the Ca2+ pulse was applied in Na-PSS and [Ca2+]i values of only ∼150 nM were attained; the subsequent traces for reverse exchange activity showed some sigmoidal character, and the average time required to attain Vmax was 42 s. For the experiment in Fig. 9, where [Ca2+]i levels were comparable to those attained with ATP, most cells responded immediately when exchange activity was initiated 30 s after termination of the Ca2+ transient, with an average time-to-Vmax of 20 s (compare with 22 and 24 s for the experiments with ATP in Figs. 5 and 7 B). We conclude that the degree of persistent activation of the exchanger increases as [Ca2+]i increases.
Local Ca2+ Gradients and Persistent Ca2+ Activation
The persistence of regulatory Ca2+ activation in these experiments is compatible with either of three general mechanisms: (a) the exchanger retains the molecular configuration of the activated state after a reduction in [Ca2+]i, (b) the local concentration of Ca2+ in the vicinity of the exchanger remains elevated despite the fall of global [Ca2+]i, or (c) the elevated [Ca2+]i initiates a signaling pathway, e.g., calmodulin-dependent protein kinase, which maintains the activated state. A full exploration of these possibilities is beyond the scope of the present report. Electrophysiological measurements of exchange currents in excised patches provide support for the first mechanism (see discussion). In Fig. 10, we present data suggesting that local Ca2+ gradients are also involved. In this experiment, we used La3+ as a substitute for Ca2+ for measuring exchange activity. We recently reported that the exchanger transports La3+ at a low rate, and that La3+ interacts with the regulatory Ca2+ binding sites at low concentrations to activate the exchanger (Reeves and Condrescu, 2003). The advantage of using La3+ for the present purpose is that La3+ does not enter the cell through store-operated channels and does not appear to be transported into the ER by SERCA activity.
Two superimposed traces are shown in Fig. 10 A, corresponding to the addition of ATP, with or without 2 μM Tg, at t = 30 s. At t = 50 s, the effects of ATP were terminated by the addition of 0.5 mg/ml of hexokinase. With 10 mM glucose in the medium, the hexokinase rapidly converts ATP to ADP and terminates the ATP-induced Ca2+ release process since ADP is inactive with respect to the purinergic receptors in CHO cells (see below). K-PSS + 0.1 mM LaCl3 was applied at t = 65 s to initiate exchange-mediated La3+ influx. For the trace obtained in the presence of Tg (filled circles), La3+ uptake began immediately upon the initiation of exchange activity. For the trace with the open circles, Tg was omitted, leaving SERCA activity intact; the rate of La3+ uptake was ∼1/3 the rate seen in the presence of Tg. The pooled results of four such experiments are presented in Fig. 10 D; the rate of La3+ uptake in the presence of Tg was significantly greater than in the absence of Tg (P < 0.002, unpaired t test). We conclude that the SERCA pump accelerates the relaxation of the activated state of the exchanger, presumably by transferring residual cytosolic Ca2+ into the ER. The presence of La3+ interfered with the calibration procedure in these studies but, by analogy to the results in Figs. 5–7, [Ca2+]i had undoubtedly returned to values well below the Kh for exchange activation at the time La3+ uptake was initiated. The simplest interpretation of the results is that SERCA acts to reduce a local elevation of [Ca2+] that maintains exchanger activation, either by directly activating the exchanger or by maintaining the activity of a Ca2+-dependent signaling process.
The trace with the filled circles in Fig. 10 B documents the effectiveness of hexokinase in terminating the effects of ATP. Nontransfected CHO cells were used in this experiment; 50 μM ATP was added at 30 s, and hexokinase was added at 50 s. Note that the nontransfected cells show a much longer Ca2+ transient than the NCX-expressing cells; the difference between the two cell types undoubtedly reflects the efficiency of the exchanger in clearing Ca2+ from the cytosol. Upon the addition of hexokinase, [Ca2+]i rapidly fell to low values (filled circles) compared with a control trace in which hexokinase was not added (open circles). For the hexokinase-treated cells, K-PSS + 0.1 mM LaCl3 was applied at 70 s; as expected, no La3+ uptake was observed in the absence of NCX expression (Reeves and Condrescu, 2003).
Fig. 10 C displays La3+ uptake under two control conditions. For trace 1, the cells were treated with ATP and Tg 10 min before beginning the experiment. For trace 2, internal Ca2+ stores were left intact and the cells were simply washed with Na-PSS + 0.1 mM EGTA immediately before beginning the experiment. K-PSS + 0.1 mM LaCl3 was applied at t = 65 s for both traces. The rates of La3+ uptake were similar in both instances and were significantly lower than seen after ATP addition either in the presence of Tg (P < 0.0005, unpaired t test) or in the absence of Tg (P < 0.01, unpaired t test) (Fig. 10 D).
DISCUSSION
Much of our present understanding of allosteric Ca2+ activation stems from measurements of outward exchange currents in excised patches from cardiac myocytes or from Xenopus oocytes expressing NCX1.1. Kh values of 200–600 nM were obtained for the Ca2+-dependence of peak outward currents, with Hill coefficients close to 1 (Collins et al., 1992; Hilgemann et al., 1992a; Matsuoka et al., 1995, 1997; Fujioka et al., 2000a). Activation of exchange currents by Ca2+ is a rapid process, occurring in <200 ms (Hilgemann et al., 1992a; Weber et al., 2001), although one study reported a time constant for activation of ∼600 ms (Kappl and Hartung, 1996). Only a few studies have examined the effects of ATP on Ca2+ activation. ATP modulates exchanger regulation by effecting the synthesis of phosphatidylinositol-4,5-bisphosphate in the patch membrane (Hilgemann and Ball, 1996). In some, but not all patches, ATP reduced the Kh for Ca2+ activation and increased the Hill coefficient (Hilgemann et al., 1992a). In experiments with patches from mouse myocytes, outward exchange currents became independent of cytosolic Ca2+ after application of ATP (Hilgemann and Ball, 1996; see Weber et al., 2001 for additional information on mouse myocytes).
In excised patches, the removal of cytosolic Ca2+ in the continued presence of cytosolic Na+ led to a time-dependent decay of exchange currents, reflecting relaxation of the Ca2+-activated state. The time constants for this decay were ∼10 s in most experiments (Hilgemann et al., 1992a; Matsuoka et al., 1995); however, a much more rapid decay (∼0.5 s) was observed in one study using a “macro-patch” from cardiac myocytes (Fujioka et al., 2000a). ATP was shown to slow the decay of the activated state following Ca2+ removal (see Fig. 12 in Hilgemann et al., 1992a). Since [Ca2+] was well controlled through the use of buffering agents in these experiments, these results (with one exception) demonstrate that the Ca2+-activated state persists for several seconds after a reduction of [Ca2+]i to very low values. There is no comparable information available on the relaxation of the Ca2+-activated state of the exchanger in intact cells. Since intact cells have high ATP levels and their plasma membranes are presumably well stocked with phosphatidylinositol-4,5bisphosphate, the regulatory behavior of the exchanger may be different in cells than in excised patches.
For the experiments reported here, the findings fall into four categories: (1) the unusual time course for exchange-mediated Ca2+ uptake, (2) the concentration dependence for allosteric Ca2+ activation of exchange activity, (3) the persistence of Ca2+ activation after the return of [Ca2+]i to low values, and (4) the involvement of local ion gradients in persistent Ca2+ activation. A final category is the possible relevance of these findings to the physiological regulation of exchange activity in functioning cardiac myocytes.
Time Course of Ca2+ Uptake
The sigmoidal time course of Ca2+ uptake during reverse exchange activity (Fig. 1) can be divided into a lag phase, during which [Ca2+]i increased only slowly, an acceleration phase, during which the rate of Ca2+ uptake increased rapidly toward Vmax, a plateau of relatively high [Ca2+]i, and a subsequent decline in [Ca2+]i. The highly variable lag periods displayed by individual cells (Fig. 3) initially seemed quite puzzling. When we found that the lag periods could be reduced by elevating [Ca2+]i (Fig. 1), and that cells expressing the Δ(241–680) deletion mutant of NCX1.1 did not display a sigmoidal time course (Fig. 2), it became evident that regulatory Ca2+ activation was involved. This interpretation was supported by our recent results with La3+, which activated exchange activity at very low concentrations (10–20 pM) and itself displayed a sigmoidal time-course of uptake. Indeed, preloading the cells with a small quantity of La3+ (∼15 pM) abrogated the lag period during subsequent exchange-mediated Ca2+ uptake and stimulated the initial rate of Ca2+ uptake 20-fold (Reeves and Condrescu, 2003).
Ca2+ influx during the lag period seems to be mediated almost entirely by a low level of reverse exchange activity, although a small contribution by store-dependent Ca2+ channels cannot be completely excluded. Blockade of these channels with 50 μM SK&F 96365 did not obviously alter the pattern of lag periods displayed by the cells (unpublished data). The inverse correlation between the duration of the lag period and the Vmax for Ca2+ uptake (Fig. 3 B) suggests that variability in exchange activity among the individual cells is an important factor in the high variability of the lag periods. Consistent with this interpretation, lag periods were shortened when exchange activity was increased by using K-PSS containing 1 mM Ca2+ instead of 0.1 mM Ca2+, or when cytosolic [Na+] was stabilized at 20 mM using gramicidin (unpublished data). An additional factor that must be considered is Ca2+ efflux by the plasma membrane Ca2+ ATPase, which would reduce net Ca2+ influx, particularly when exchange activity is low, and prolong the lag period (see below). In principle, Ca2+ accumulation by internal compartments might also contribute to the duration of the lag periods. However, the Tg treatment blocked Ca2+ uptake into the ER, and mitochondria did not accumulate significant amounts of Ca2+ at the low [Ca2+]i values present during the lag phase (unpublished data). Although nonmitochondrial, Tg-resistant compartments are present in CHO cells (Condrescu et al., 1997), we could find no evidence that these compartments accumulated Ca2+ during the lag phase.
The acceleration phase reflected progressive activation of the exchanger as Ca2+ accumulated, leading to a rapid increase in Ca2+ uptake as [Ca2+]i approached the Kh for the allosteric Ca2+ binding sites. Mitochondrial Ca2+ accumulation occurred during the acceleration phase (Opuni and Reeves, 2000; unpublished data). As discussed in the , mitochondrial Ca2+ uptake produced a significant underestimate (44%) of the Kh for allosteric Ca2+ activation of exchange activity. The plateau value appears to reflect a balance between continuing Ca2+ influx via the exchanger and mitochondrial Ca2+ accumulation (see ). An important factor in the decline in [Ca2+]i after the plateau phase is likely to be the loss of Na+ from the cell under the conditions of these experiments. Indeed, the use of ionophores such as gramicidin to stabilize [Na+]i at values ranging from 5 to 20 mM reduced the rate of decline, although it did not completely eliminate it. Importantly, Kh values obtained with gramicidin-treated cells were similar to the values reported here throughout the range of [Na+] studied (unpublished data), suggesting that the presence of the declining phase did not distort our analyses of allosteric Ca2+ activation.
[Ca2+] Dependence of Exchanger Activation
Potential sources of error in our estimates of Kh are considered in the . In addition to the tendency of the matching procedure to underestimate Kh by 33% compared with the curve-fitting procedure (see results), mitochondrial Ca2+ accumulation produces an additional underestimate of 44%, while the effects of fura-2 buffering on the measured velocities of Ca2+ uptake lead to an overestimate of Kh in the range of 25–40% (see ). Using the overall value of Kh obtained by the matching procedure from six coverslips (231 ± 14 nM; see results), and applying the corrections indicated above, we conclude that the Kh for allosteric Ca2+ activation is ∼300 nM.
This value is compatible with the electrophysiological measurements obtained in excised patches but does not agree with other measurements, including our own, that suggested a much higher affinity for the Ca2+ regulatory sites. Earlier electrophysiological measurements in cardiac myocytes (Noda et al., 1988; Miura and Kimura, 1989) may have suffered from inadequate control of [Ca2+]i, despite the use of EGTA in the pipette solutions. The Ba2+ influx measurements that we conducted in transfected CHO cells (Fang et al., 1998) involved pretreating the cells with ionomycin and various external concentrations of Ca2+, and then initiating exchange-mediated Ba2+ influx during the return of [Ca2+]i toward low values. This experimental design was similar in many respects to the experiments presented in Figs. 9 and 10, and would have induced persistent Ca2+ activation in the exchanger, accounting for the high rates of Ba2+ influx that we observed at low [Ca2+]i levels (Fang et al., 1998). Thus, the Kh value of 44 nM we obtained in the previous studies reflected the decay of the Ca2+ activated states that were induced by a range of much higher [Ca2+]i values attained during the ionomycin/Ca2+ pretreatment.
The electrophysiological experiments of Weber et al. (2001) yielded a Kh value of ∼125 nM for allosteric activation of exchange activity in ferret myocytes. Their experimental protocol involved estimating the Kh from the [Ca2+]i dependence of the envelope of the outward branch of alternating inward and outward exchange currents. Their approach assumed that the allosteric activation machinery was in instantaneous equilibrium with the bulk [Ca2+]i, an assumption that should be reexamined in view of the possible persistence of the Ca2+-activated state in these cells.
The fits of the rate data to the Hill equation (Fig. 4) suggest that Ca2+ activation shows a high degree of cooperativity (Hill coefficient 2.8). This conclusion must be viewed cautiously, however, because the net rates of Ca2+ influx reflect not only exchange activity but the Ca2+ efflux activity of the plasma membrane Ca2+-ATPase as well. The fits to the Hill equation are highly dependent on the net rates of Ca2+ uptake at the sigmoidal “foot” of the plots shown in Fig. 4, i.e., during the transition from the lag phase to the acceleration phase when exchange activity is low. The relative influence of Ca2+ efflux by the plasma membrane Ca2+-ATPase on net Ca2+ influx will be profound when exchange activity is low, but less important when exchange activity is high and would therefore tend to increase the sigmoid shape of the curve, perhaps yielding artificially high values for the Hill coefficient. Thus, the degree of cooperativity of allosteric Ca2+ activation in these experiments must remain uncertain.
Persistence of the Ca2+-activated State
A transient elevation in [Ca2+]i to levels above the Kh for Ca2+ activation led to a persistent state of activation with a lifetime of several tens of seconds (Figs. 7 and 9). This was observed whether the Ca2+ transient was induced by either ATP-mediated Ca2+ release (Figs. 5–7) or Ca2+ influx through a store-operated Ca2+ channels and reverse exchange activity (Figs. 8 and 9). In many cases, the initial time course of Ca2+ influx was linear under conditions where bulk cytosolic [Ca2+]i was well below the Kh for Ca2+ activation (Figs. 6 and 9). A linear time course of Ca2+ influx indicates that the exchanger brought about Ca2+ entry at a rate equal to Vmax, and was therefore fully activated despite the low [Ca2+]i.
Persistent Ca2+ activation explains certain aspects of our earlier report showing that exchange activity was stimulated by ATP-induced Ca2+ release (Vazquez et al., 1997). A transient acceleration of Ca2+ or Ba2+ influx was observed even after the Ca2+ transient had decayed and [Ca2+]i had returned to values only slightly higher than control cells that had not been exposed to ATP. At the time, the results seemed consistent with a high affinity of the exchanger for regulatory Ca2+, but are now more readily explained by persistent Ca2+ activation.
Transient elevation of [Ca2+]i to levels less than the Kh for Ca2+ activation (e.g., ∼150 nM for the experiment in Fig. 8) led to partial activation of the exchanger, as indicated by the reduced duration of the lag period (Figs. 8, B–E). The cells exhibited a sigmoidal time course of Ca2+ uptake in the partially activated state and displayed Kh values that were not significantly different from those observed in the absence of a prior Ca2+ transient (see discussion of Fig. 8 in results). Indeed, the behavior of the cells under these conditions was essentially identical to that observed in trace 2 in Fig. 1, where a modest increase in [Ca2+]i shortened the duration of the lag period but did not eliminate the sigmoidicity of the time course of Ca2+ uptake. In the experiment shown in Fig. 1 (trace 2), exchange activity was initiated while [Ca2+]i was still elevated, whereas in Fig. 8, [Ca2+]i was returned to low values for a short interval before initiating reverse exchange activity. It appears that the partially activated state of the exchanger persists to a degree that is comparable to the fully activated state induced by much higher levels of [Ca2+]i.
Local Ca2+ Gradients and Persistent Ca2+ Activation
The effects of SERCA activity on exchange-mediated La3+ uptake (Fig. 10) indicate that local Ca2+ gradients contribute to maintaining the activated state of the exchanger. Thus, when a Ca2+ transient was elicited by ATP in the absence of Tg, the subsequent rate of exchange-mediated La3+ uptake was only about one-third of that seen in the presence of Tg. Even in the absence of Tg, however, La3+ uptake remained greater than that seen in the absence of a prior Ca2+ transient (Fig. 10, C and D), suggesting that SERCA activity did not completely abrogate persistent Ca2+ activation but merely accelerated its decay. Similar results were obtained with exchange-mediated Ba2+ uptake (unpublished data). Since global [Ca2+]i was well below Kh in these experiments, the results suggest that in the absence of SERCA activity, the local [Ca2+] beneath the plasma membrane may have been high enough to maintain exchanger activation. Another possibility is that a local rise in Ca2+ activates a Ca2+-dependent signaling process (e.g., calmodulin-dependent protein kinase) that secondarily maintains exchanger activation. In either case, SERCA activity would presumably reduce the local Ca2+ concentration and accelerate the relaxation of the activated state.
A gradient of free Ca2+ would be expected to dissipate by diffusion within a very brief period after a reduction in global [Ca2+]i. Therefore, we speculate that the most likely source for a local elevation in Ca2+ is the loss of Ca2+ from a membranous compartment that may be in close proximity to the plasma membrane. Mitochondria are unlikely to be involved since persistent Ca2+ activation was not blocked by Cl-CCP (unpublished data). One candidate for such a compartment is the ER, consistent with the close apposition of the ER to the plasma membrane and the efficiency of the SERCA pump in accelerating the decay of the activated state (Fig. 10). For the experiments with ATP-induced Ca2+ release (Figs. 5–7, and 10), residual stores of unreleased Ca2+ within the ER could be the source of a local Ca2+ elevation. For the experiments where the activating elevation of [Ca2+]i was initiated by store-operated Ca2+ channel activity (Figs. 8 and 9), some of the Ca2+ taken up by the cells may have been delivered to the ER by a SERCA-independent mechanism. Clearly, further investigation is needed to settle these speculative issues.
The persistence of Ca2+ activation suggests that exchange activity may monitor the integral of Ca2+ transients over multiple beats in functioning cardiac myocytes. Its integrating function would be markedly affected by conditions that influence the relaxation rate of the activated state. This possibility has profound implications with regard to the importance of exchange activity in mediating chronotropic and ionotropic alterations in cardiac function. For this reason, it will be important in future studies to determine if the Ca2+-activated state of the exchanger persists in intact cardiac myocytes, and to identify potential mechanisms for regulating its relaxation rate.
Reeves and Condrescu
Acknowledgments
We are grateful to Dr. Roman Shirokov for his comments on the manuscript and to Ms. M. Larissa Bonilla for technical assistance.
This work was supported by grants from the National Institutes of Health (HL49932) and the American Heart Association (0151201T).
Olaf S. Andersen served as editor.
APPENDIX –
POSSIBLE SOURCES OF ERROR
Rate of Exchanger Activation
In this study, we assumed that activation of the exchanger by Ca2+ is instantaneous and that the Kh for Ca2+ activation can be determined from the values of [Ca2+]i at each time point during the course of Ca2+ uptake. This assumption is compatible with the rapid rates of Ca2+ activation observed in giant patch studies (see discussion). However, if an appreciable number of exchangers had entered an inactive state that is induced by cytosolic Na+ (Na+-dependent or I1 inactivation, see Hilgemann, 1996), the rate of Ca2+ activation would be very much slower (Hilgemann et al., 1992b). In this case, Kh could be overestimated since activation would occur at times earlier than the time point identified by the matching procedure, i.e., at lower [Ca2+]i. Na+-dependent inactivation is most pronounced at high cytosolic Na+ concentrations (∼100 mM) and is counteracted by ATP, which acts by effecting the synthesis of phosphatidylinositol-4,5-bisphosphate (Hilgemann and Ball, 1996). Since [Na+]i under normal conditions is low and ATP (and presumably phosphatidylinositol-4,5-bisphosphate) levels are high, we infer that most exchange carriers are not in the Na+-inactivated state and that Ca2+ activation occurs rapidly.
This inference is supported by experiments with cells expressing a mutant exchanger that is resistant to I1 inactivation (Condrescu and Reeves, 1999); these cells behave essentially identically to cells expressing the wild-type exchanger and display a Kh of ∼290 nM (unpublished data). Other lines of evidence consistent with a rapid activation of the exchanger by Ca2+ include the following: (a) There is no correlation between Vmax and Kh among the individual cells in a population or under experimental conditions resulting in differing exchange rates (e.g., 1.0 vs. 0.1 mM external Ca2+) (unpublished data). If Ca2+ activation were slow, Kh would be progressively overestimated as the rate of Ca2+ uptake increased and a positive correlation between Kh and exchange rates would be observed. (b) No systematic variations in Kh values were observed in experiments where gramicidin was used to stabilize cytosolic [Na+] between 5 and 20 mM. If I1 inactivation were a factor in our experiments, we would expect more inactivated exchangers at the higher [Na+]i and a corresponding increase in Kh. Together, our results are consistent with the assumption that little I1 inactivation occurs under our experimental conditions and that activation of the exchanger by Ca2+ therefore occurs rapidly.
Mitochondrial Ca2+ Uptake
Mitochondrial Ca2+ uptake during reverse exchange activity (Opuni and Reeves, 2000), could lead to an underestimate of the true rate of Ca2+ influx under the conditions of these experiments. When assays were conducted in the presence of 5 μM Cl-CCP, an uncoupling agent that depolarizes the mitochondrial membrane and blocks active mitochondrial Ca2+ uptake, we found Kh values slightly higher than those obtained in the absence of uncouplers (unpublished data). To explore the effect of mitochondrial Ca2+ uptake more precisely, we performed the experiment presented in Fig. 11 . Fig. 11 A presents the average [Ca2+]i values for 53 cells from a single coverslip in which K-PSS + 0.1 mM Ca2+ was applied twice, once in the absence of Cl-CCP (closed circles) and again, after a 10-min interval in Na-PSS + 0.1 mM EGTA, in the presence of 5 μM Cl-CCP (open circles). The two traces are superimposed in Fig. 11 B, where t = 0 corresponds to the application of K-PSS + CaCl2 for each trace. [Ca2+]i attained higher values in the presence of Cl-CCP, consistent with a substantial accumulation of Ca2+ by the mitochondria.
Figure 11.

Effect of Cl-CCP on exchange-mediated Ca2+ influx. Cells were treated with 200 μM ATP and 2 μM Tg in Na-PSS + 0.1 mM EGTA 10 min before beginning the experiment. (A) K-PSS + 0.1 mM CaCl2 was applied and 90 s later Ca2+ uptake was terminated with Na-PSS + 0.1 mM EGTA (filled circles). After an additional 10 min, Na-PSS + 0.1 mM EGTA containing 5 μM Cl-CCP was applied and then K-PSS + 0.1 mM CaCl2 containing 5 μM Cl-CCP was applied 45 s later (open circles). Traces are the average of 52 cells. (B) Traces in A are superimposed; t = 0 corresponds to the addition of K-PSS + 0.1 mM CaCl2 (symbols as in A). (C–E) Superimposed traces for three individual cells from experiment depicted in A (symbols as in A). The arrows labeled “Ca” indicate the time of K-PSS + 0.1 mM CaCl2 application. Numerical values are for the estimated Kh obtained by matching procedure and data points corresponding to ∼0.5 Vmax are indicated by diagonal arrows.
Fig. 11, C–E, present the data for three individual cells from this experiment. Note that the peak [Ca2+]i values in Fig. 11 C were very high. Under these conditions, fura-2 is very close to saturation, and small variations in the fluorescence intensity at 380 nM excitation (the denominator of the fura-2 ratio) produce large fluctuations in the calculated [Ca2+]i; these very high [Ca2+]i values and their fluctuations should not be taken as precise measurements. The Kh values obtained by the matching procedure with and without Cl-CCP are given in the figure and the data points corresponding to the estimated Kh are indicated by the diagonal arrows. For these cells, and most (but not all) of the other cells that were monitored, the apparent Kh was higher in the presence of Cl-CCP. Comparing the cells that responded under each condition (Vmax ≥ 5 nM/s; n = 44), the average Kh (±SD) values were 257 ± 77 nM under control conditions and 336 ± 124 nM in the presence of Cl-CCP (P < 10−4, paired t test). When the results from four coverslips were pooled, the average Kh values (±SEM) were 242 ± 6.0 nM and 347 ± 7.4 nM in the absence and presence of Cl-CCP respectively (P ∼0.003, paired t test; n = 4). Thus, blocking mitochondrial Ca2+ accumulation increased the average Kh values for exchanger activation by 44 ± 5.5%.
Rates of Ca2+ Uptake
Another potential source of error in our analysis involves the influence of cytosolic Ca2+ buffering on the velocity of Ca2+ uptake. In our experiments, transport rates were measured as d[Ca2+]i/dt and expressed as nM/s. Conversion to units reflecting net Ca2+ uptake (nmol/s) requires knowledge of cytosolic buffering by cellular constituents as well as by the fura-2 present within the cell. Previous results (Fang et al., 1999) suggest that the fura-2 concentration within the cytosol is ∼30 μM.
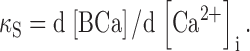
Neher and Augustine (1992) defined the calcium binding capacities of endogenous buffering systems in the following manner:
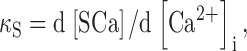 |
(1) |
where SCa represents the total amount of Ca bound to the endogenous buffers. An analogous relation was used to define the binding capacity of the exogenous buffer, i.e., fura-2:
 |
(2) |
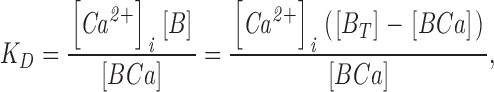
The equilibrium relation for the interaction between Ca2+ and fura-2 is
 |
(3) |
where KD is the dissociation constant for the Ca2+/fura-2 complex, [B] is the concentration of unbound fura-2, [BCa] is the concentration of Ca2+-bound fura-2 and BT = [B] + [BCa] is the total concentration of fura-2. With this relation, the expression for κB becomes (Neher and Augustine, 1992)
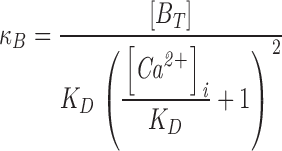 |
(4) |
For [Ca2+]i ∼KB, [BT] = 30 μM and KB = 0.274 μM, κB ∼27. For bovine chromaffin cells, Neher and Augustine (1992) found a mean value for κS of 70, which was relatively constant over the range [Ca2+]i = 0.2–1 μM. Thus, fura-2 makes an important contribution to the buffering power of the cytosol. Moreover, the buffering capacity of fura-2 changes significantly with [Ca2+]i, becoming progressively less as [Ca2+]i increases. Changes in the buffering capacity of fura-2 during the course of Ca2+ uptake are therefore likely to alter the relation between d[Ca2+]i/dt and the rate of Ca2+ influx.
To estimate the influence of these factors on Kh we used the following relation to convert the rate of change in [Ca2+]i to the rate of Ca2+ uptake (Neher and Augustine, 1992).
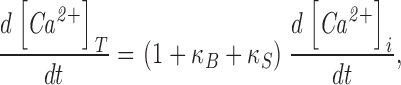 |
(5) |
where [Ca2+]T refers to the change in total cytosolic Ca2+ (nmol/L cell water). This relation assumes Ca2+ buffering is rapid and neglects slower processes, including Ca2+ uptake by cellular organelles. We used Eq. 4 to define the Ca2+ dependence of κB and assumed that κS was independent of [Ca2+]i and equal to the value of 70 obtained by Neher and Augustine (1992) for bovine chromaffin cells. Rates of Ca2+ uptake, computed using Eq. 5 with BT = 30 μM, were analyzed by the curve-fitting procedure as described for Fig. 4 and the combined results for the 21 cells discussed in results (see text relating to Fig. 4) are compared with the uncorrected values in Table I . As shown, correcting for Ca2+ buffering decreased the value of Kh significantly, reflecting the reduced buffering power of fura-2 at high Ca2+ concentrations. The Kh values obtained by the matching procedure were also reduced when velocities were analyzed using Eq. 5. As shown in Table I, the average Kh decreased from 231 to 171 nM after correcting for Ca2+ buffering for the six coverslips analyzed by the matching procedure. Thus, with an assumed BT of 30 μM, the effects of fura-2 buffering result in an overestimate of Kh by ∼25%.
TABLE I.
Ca2+ Buffering: Effect on Kh
| Procedure | Buffering correction | Kh | n | Vmax |
|---|---|---|---|---|
| nM | ||||
| Curve-fitting | No | 232 ± 18 | 2.8 ± 0.15 | 153 ± 22(nM/s) |
| Curve-fitting | Yes | 201 ± 19a | 2.8 ± 0.31 | 12,854 ± 1,700 (nmol/L cell water·s) |
| Matching | No | 231 ± 14 | ||
| Matching | Yes | 171 ± 13b |
The buffering correction involved the use of equations 4 and 5 with BT = 30 μM, κs = 70 (Neher and Augustine, 1992) and KD for fura-2 of either 224 nM (37°C) or 274 nM (22°C), as appropriate. n, Hill coefficient. Parameters for the curve fitting approach were based on 21 cells; parameters for the matching approach were based on 6 coverslips. Results are mean values ± SEM.
P < 0.01 compared to no correction.
P ∼0.03 compared to no correction.
The impact of the correction for fura-2 buffering was dependent on the assumed concentration for fura-2. When the six cells displayed in Fig. 4 were reanalyzed by the curve-fitting approach assuming a value for BT of 100 μM, the average Kh value (±SD) was 151 ± 60 nM compared with 191 ± 68 nM with BT = 30 μM and 248 ± 89 nM with no correction for Ca2+ buffering. Thus, at the higher fura-2 concentration, the apparent overestimate of Kh obtained with uncorrected velocities increased to ∼40%. The fura-2 levels vary considerably among individual cells, to judge by the variation in individual cellular fluorescence intensities. Thus, a cell-by-cell correction for the effects of fura-2 buffering is not possible and we will assume that the effects of buffering by fura-2 result in an overestimate of Kh between 25–40%, depending on the amount of fura-2 within the cell.
Abbreviations used in this paper: CHO, Chinese hamster ovary; Cl-CCP, carbonyl cyanide m-chlorophenylhydrazone; PSS, physiological salts solution; SERCA, sarco(endo)plasmic reticulum Ca2+-ATPase; Tg, thapsigargin.
References
- Blaustein, M.P., and W.J. Lederer. 1999. Sodium/calcium exchange: its physiological implications. Physiol. Rev. 79:763–854. [DOI] [PubMed] [Google Scholar]
- Collins, A., A.V. Somlyo, and D.W. Hilgemann. 1992. The giant cardiac membrane patch method: stimulation of outward Na(+)- Ca2+ exchange current by MgATP. J. Physiol. 454:27–57. [DOI] [PMC free article] [PubMed] [Google Scholar]
- Condrescu, M., G. Chernaya, V. Kalaria, and J.P. Reeves. 1997. Barium influx mediated by the cardiac sodium-calcium exchanger in transfected Chinese hamster ovary cells. J. Gen. Physiol. 109:41–51. [DOI] [PMC free article] [PubMed] [Google Scholar]
- Condrescu, M., and J.P. Reeves. 1999. Mutagenesis of the XIP region of the sodium-calcium exchanger does not alter calcium-dependent regulation of exchange activity in transfected CHO cells. Biophys. J. 76:A253. [Google Scholar]
- DiPolo, R. 1979. Calcium influx in internally dialyzed squid giant axons. J. Gen. Physiol. 73:91–113. [DOI] [PMC free article] [PubMed] [Google Scholar]
- Dong, H., J. Dunn, and J. Lytton. 2002. Stoichiometry of the cardiac Na+/Ca2+ exchanger NCX1.1 measured in transfected HEK cells. Biophys. J. 82:1943–1952. [DOI] [PMC free article] [PubMed] [Google Scholar]
- Fang, Y., M. Condrescu, and J.P. Reeves. 1998. Regulation of Na+/Ca2+ exchange activity by cytosolic Ca2+ in transfected Chinese hamster ovary cells. Am. J. Physiol. 275:C50–C55. [DOI] [PubMed] [Google Scholar]
- Fang, Y., M. Condrescu, and J.P. Reeves. 1999. Na/Ca exchange and Ca efflux in transfected Chinese hamster ovary cells. Cell Calcium. 26:15–24. [DOI] [PubMed] [Google Scholar]
- Fujioka, Y., K. Hiroe, and S. Matsuoka. 2000. a. Regulation kinetics of Na+-Ca2+ exchange current in guinea-pig ventricular myocytes. J. Physiol. 529:611–623. [PubMed] [Google Scholar]
- Fujioka, Y., M. Komeda, and S. Matsuoka. 2000. b. Stoichiometry of Na+-Ca2+ exchange in inside-out patches excised from guinea-pig ventricular myocytes. J. Physiol. 523:339–351. [DOI] [PMC free article] [PubMed] [Google Scholar]
- Grynkiewicz, G., M. Poenie, and R.Y. Tsien. 1985. A new generation of Ca2+ indicators with greatly improved fluorescence properties. J. Biol. Chem. 260:3440–3450. [PubMed] [Google Scholar]
- Hilgemann, D.W. 1996. The cardiac Na-Ca exchanger in giant membrane patches. Ann. NY Acad. Sci. 779:136–158. [DOI] [PubMed] [Google Scholar]
- Hilgemann, D.W., and R. Ball. 1996. Regulation of cardiac Na+,Ca2+ exchange and KATP potassium channels by PIP2. Science. 273:956–959. [DOI] [PubMed] [Google Scholar]
- Hilgemann, D.W., A. Collins, and S. Matsuoka. 1992. a. Steady-state and dynamic properties of cardiac sodium-calcium exchange. Secondary modulation by cytoplasmic calcium and ATP. J. Gen. Physiol. 100:933–961. [DOI] [PMC free article] [PubMed] [Google Scholar]
- Hilgemann, D.W., S. Matsuoka, G.A. Nagel, and A. Collins. 1992. b. Steady-state and dynamic properties of cardiac sodium-calcium exchange. Sodium-dependent inactivation. J. Gen. Physiol. 100:905–932. [DOI] [PMC free article] [PubMed] [Google Scholar]
- Iwamoto, T., S. Wakabayashi, T. Imagawa, and M. Shigekawa. 1998. Na+/Ca2+ exchanger overexpression impairs calcium signaling in fibroblasts: inhibition of the [Ca2+] increase at the cell periphery and retardation of cell adhesion. Eur. J. Cell Biol. 76:228–236. [DOI] [PubMed] [Google Scholar]
- Kappl, M., and K. Hartung. 1996. Rapid charge translocation by the cardiac Na(+)-Ca2+ exchanger after a Ca2+ concentration jump. Biophys. J. 71:2473–2485. [DOI] [PMC free article] [PubMed] [Google Scholar]
- Langille, S.E., V. Patki, J.K. Klarlund, J.M. Buxton, J.J. Holik, A. Chawla, S. Corvera, and M.P. Czech. 1999. ADP-ribosylation factor 6 as a target of guanine nucleotide exchange factor GRP1. J. Biol. Chem. 274:27099–27104. [DOI] [PubMed] [Google Scholar]
- Levitsky, D.O., D.A. Nicoll, and K.D. Philipson. 1994. Identification of the high affinity Ca(2+)-binding domain of the cardiac Na(+)-Ca2+ exchanger. J. Biol. Chem. 269:22847–22852. [PubMed] [Google Scholar]
- Lytton, J., M. Westlin, and M.R. Hanley. 1991. Thapsigargin inhibits the sarcoplasmic or endoplasmic reticulum Ca- ATPase family of calcium pumps. J. Biol. Chem. 266:17067–17071. [PubMed] [Google Scholar]
- Matsuoka, S., D.A. Nicoll, Z. He, and K.D. Philipson. 1997. Regulation of cardiac Na(+)-Ca2+ exchanger by the endogenous XIP region. J. Gen. Physiol. 109:273–286. [DOI] [PMC free article] [PubMed] [Google Scholar]
- Matsuoka, S., D.A. Nicoll, L.V. Hryshko, D.O. Levitsky, J.N. Weiss, and K.D. Philipson. 1995. Regulation of the cardiac Na(+)-Ca2+ exchanger by Ca2+. Mutational analysis of the Ca(2+)-binding domain. J. Gen. Physiol. 105:403–420. [DOI] [PMC free article] [PubMed] [Google Scholar]
- Matsuoka, S., D.A. Nicoll, R.F. Reilly, D.W. Hilgemann, and K.D. Philipson. 1993. Initial localization of regulatory regions of the cardiac sarcolemmal Na(+)-Ca2+ exchanger. Proc. Natl. Acad. Sci. USA. 90:3870–3874. [DOI] [PMC free article] [PubMed] [Google Scholar]
- Miura, Y., and J. Kimura. 1989. Sodium-calcium exchange current. Dependence on internal Ca and Na and competitive binding of external Na and Ca. J. Gen. Physiol. 93:1129–1145. [DOI] [PMC free article] [PubMed] [Google Scholar]
- Neher, E., and G.J. Augustine. 1992. Calcium gradients and buffers in bovine chromaffin cells. J. Physiol. 450:273–301. [DOI] [PMC free article] [PubMed] [Google Scholar]
- Noda, M., R.N. Shepherd, and D.C. Gadsby. 1988. Activation by [Ca2+]i, and block by 3′,4′-dichlorobenzamil, of outward Na/Ca exchange current in guinea-pig ventricular myocytes. Biophys. J. 53:342a. [Google Scholar]
- Opuni, K., and J.P. Reeves. 2000. Feedback inhibition of sodium/calcium exchange by mitochondrial calcium accumulation. J. Biol. Chem. 275:21549–21554. [DOI] [PubMed] [Google Scholar]
- Reeves, J.P. 1998. Na+/Ca2+ exchange and cellular Ca2+ homeostasis. J. Bioenerg. Biomembr. 30:151–160. [DOI] [PubMed] [Google Scholar]
- Reeves, J.P., and M. Condrescu. 2003. Lanthanum is transported by the sodium-calcium exchanger and regulates its activity. Am. J. Physiol. Cell Physiol. 285:C763–C770. [DOI] [PubMed] [Google Scholar]
- Reeves, J.P., and C.C. Hale. 1984. The stoichiometry of the cardiac sodium-calcium exchange system. J. Biol. Chem. 259:7733–7739. [PubMed] [Google Scholar]
- Shigekawa, M., and T. Iwamoto. 2001. Cardiac Na(+)-Ca(2+) exchange: molecular and pharmacological aspects. Circ. Res. 88:864–876. [DOI] [PubMed] [Google Scholar]
- Shuttleworth, T.J., and J.L. Thompson. 1991. Effect of temperature on receptor-activated changes in [Ca2+]i and their determination using fluorescent probes. J. Biol. Chem. 266:1410–1414. [PubMed] [Google Scholar]
- Vazquez, M., Y. Fang, and J.P. Reeves. 1997. Acceleration of sodium-calcium exchange activity during ATP-induced calcium release in transfected Chinese hamster ovary cells. J. Gen. Physiol. 109:53–60. [DOI] [PMC free article] [PubMed] [Google Scholar]
- Weber, C.R., K.S. Ginsburg, K.D. Philipson, T.R. Shannon, and D.M. Bers. 2001. Allosteric regulation of Na/Ca exchange current by cytosolic Ca in intact cardiac myocytes. J. Gen. Physiol. 117:119–131. [DOI] [PMC free article] [PubMed] [Google Scholar]