Abstract
Changes in extracellular pH occur during both physiological neuronal activity and pathological conditions such as epilepsy and stroke. Such pH changes are known to exert profound effects on neuronal activity and survival. Heteromeric KCNQ2/3 potassium channels constitute a potential target for modulation by H+ ions as they are expressed widely within the CNS and have been proposed to underlie the M-current, an important determinant of excitability in neuronal cells. Whole-cell and single-channel recordings demonstrated a modulation of heterologously expressed KCNQ2/3 channels by extracellular H+ ions. KCNQ2/3 current was inhibited by H+ ions with an IC50 of 52 nM (pH 7.3) at −60 mV, rising to 2 μM (pH 5.7) at −10 mV. Neuronal M-current exhibited a similar sensitivity. Extracellular H+ ions affected two distinct properties of KCNQ2/3 current: the maximum current attainable upon depolarization (Imax) and the voltage dependence of steady-state activation. Reduction of Imax was antagonized by extracellular K+ ions and affected by mutations within the outer-pore turret, indicating an outer-pore based process. This reduction of Imax was shown to be due primarily to a decrease in the maximum open-probability of single KCNQ2/3 channels. Single-channel open times were shortened by acidosis (pH 5.9), while closed times were increased. Acidosis also recruited a longer-lasting closed state, and caused a switch of single-channel activity from the full-conductance state (∼8 pS) to a subconductance state (∼5 pS). A depolarizing shift in the activation curve of macroscopic KCNQ2/3 currents and single KCNQ2/3 channels was caused by acidosis, while alkalosis caused a hyperpolarizing shift. Activation and deactivation kinetics were slowed by acidosis, indicating specific effects of H+ ions on elements involved in gating. Contrasting modulation of homomeric KCNQ2 and KCNQ3 currents revealed that high sensitivity to H+ ions was conferred by the KCNQ3 subunit.
Keywords: acidosis, conductance, K+ channel, M-current, pH
INTRODUCTION
Dynamic changes in extracellular pH occur during periods of physiological neuronal activity, such as synaptic activation (Chesler, 1990). Changes in extracellular pH also occur during pathological events such as epileptic seizures and cerebral ischemia (Chesler and Kaila, 1992; Tombaugh and Sapolsky, 1993). Extracellular pH can vary over a wide range, falling to below pH 6.5 during ischemia (von Hanwehr et al., 1986) and rising by several tenths of pH units during seizure activity and spreading depression (Chesler and Kaila, 1992; de Curtis et al., 1998; Xiong and Stringer, 2000). Fluctuations of extracellular pH cause marked functional changes to neurons (Chesler and Kaila, 1992), and during synaptic transmission H+ ions may act to modulate both pre- and postsynaptic function (Traynelis and Cull-Candy, 1990; DeVries, 2001). During pathological events such as ischemia and seizure, the consequences of pH changes are unclear. Changes in pH may exascerbate neuronal excitation and damage, or may give rise to neuroprotective processes (Tombaugh and Sapolsky, 1993). Effects of H+ on neuronal activity have been attributed to the modulation of a variety of different neuronal ion channel types (Tombaugh and Somjen, 1996; Mott et al., 2003).
The KCNQ family of potassium channels contains five members to date, with mutations of KCNQ1–4 showing linkage to human disease (Robbins, 2001). Mutations in the genes encoding KCNQ2 and KCNQ3 channels are thought to give rise to benign familial neonatal convulsions (BFNC), an inherited form of human epilepsy (Biervert et al., 1998; Charlier et al., 1998; Singh et al., 1998). Heteromeric KCNQ2/3 channels have been proposed to underlie the neuronal M-current (Wang et al., 1998), a potassium current that is active in the sub-threshold voltage range for action potential initiation (Brown and Adams, 1980). The M-current contributes to the resting membrane potential in a variety of neurons, dictates general neuronal excitability, controls spike frequency adaptation after stimulation, and facilitates network oscillations within the brain (Brown, 1988; Marrion, 1997; Brown and Yu, 2000; Hu et al., 2002). Blockade or receptor-mediated suppression of M-current is associated with depolarization of the resting membrane potential, increased neuronal excitability, and a propensity for epileptic events (Brown and Adams, 1980; Aiken et al., 1995). Conversely, enhancement of M-current causes a hyperpolarization of the resting membrane potential and reduces neuronal excitability (Tatulian et al., 2001; Otto et al., 2002).
KCNQ2 and KCNQ3 subunits are expressed widely within the nervous system at postsynaptic sites and regions of the central nervous system expressing these subunits are known to be involved in the generation, perpetuation, and termination of seizure activity (Tinel et al., 1998; Yang et al., 1998; Rogawski, 2000; Cooper et al., 2001). In addition, KCNQ2 subunits have been localized to presynaptic regions (Cooper et al., 2001). KCNQ2 and KCNQ3 subunits are therefore likely candidates for modulation by extracellular H+, as they are associated with physiological processes and disease states in which pH changes are known to occur and are present in brain regions that exhibit marked fluctuations of extracellular pH.
In this study, extracellular H+ ions were found to modulate KCNQ2/3 channels and neuronal M-current in a concentration- and voltage-dependent manner. Regulation of KCNQ2/3 channels by H+ ions was subunit dependent, with homomeric KCNQ3 channels exhibiting a high sensitivity and homomeric KCNQ2 subunits exhibiting a relatively low sensitivity. The mechanism of action of H+ ions was investigated on a single-channel level. Single KCNQ2/3 channel open-probability (Po) was reduced by acidosis and gating kinetics were altered, with open times being dramatically reduced and channels recruited into a relatively long-lived (τ ∼50–200 ms) closed state. The sensitivity of KCNQ2/3 current and neuronal M-current to extracellular H+ ions suggests that these currents are tonically regulated by relatively small fluctuations in extracellular pH. Such modulation by extracellular pH is likely to have marked effects on neuronal activity and neuronal survival observed during physiological processes such as synaptic transmission as well as pathological events such as ischemia and epilepsy.
MATERIALS AND METHODS
Molecular Biology
Rat KCNQ2 (Splice form B, Pan et al., 2001; otherwise, similar to EMBL/GenBank/DDBJ accession no. AF087453) and rat KCNQ3 (EMBL/GenBank/DDBJ accession no. AF091247) constructs were provided by David McKinnon (SUNY, Stony Brook, NY). KCNQ2 and KCNQ3 inserts were subcloned independently into the plasmid vector pcDNA3.1 (Invitrogen). Site-directed mutagenesis was performed using the QuikChange-XL Mutagenesis kit (Stratagene). All sequences were confirmed by dye termination sequencing (Department of Biochemistry, University of Oxford, UK).
Tissue Culture and Transfection
HEK-293 cells (ECACC, UK) and HEK-293T cells (obtained from David Brown, UCL, London, UK and Dr. Galen Flynn, University of Washington, Seattle; also known as tsA-201 cells—an SV-40 virus-transformed HEK-293 cell line known to give rise to enhanced expression of certain plasmid DNA) were grown at 37°C and 5% CO2 in air. The culture medium was MEM for HEK-293 cells, and DMEM for HEK-293T cells, supplemented with 10% fetal calf serum and 0.2% penicillin/streptomycin. Cells were split twice weekly when confluent and were plated in 35 mm dishes (Falcon Primaria) using a reduced serum content (3%) medium in preparation for transfection. Cells were transiently transfected 24 h after plating using Superfect transfection reagent (QIAGEN). Transfected cells were identified for recording by visualization of cotransfected green fluorescent marker EGFP (CLONTECH Laboratories, Inc.). Coexpression experiments were performed in HEK-293 cells, whereas homomeric channels were expressed in HEK-293T cells (due to low expression levels of these channels in HEK-293 cells). A total of 2 μg of DNA was used for each plate of cells, using equal molarities of KCNQ2 and KCNQ3 for coexpression experiments and a channel:marker ratio of 10:1. For expression of homomeric channels, the channel:marker ratio was 2:1. For coexpression studies, cells were used for recording within 24 h of transfection, whereas homomeric channel expression was studied 2–4 d after transfection.
Superior cervical ganglion neurons were obtained from 16- to 20-d-old Sprague-Dawley rats and cultured as described previously (Beech et al., 1991). Neurons were grown in 35-mm dishes (Falcon Primaria) and were used for recording after 1–2 d in culture.
Electrophysiology
Whole-cell voltage-clamp recordings were made from single, uncoupled cells at room temperature (20–24°C) using an Axopatch 200A amplifier (Axon Instruments, Inc.). Fire-polished electrodes (3–5 MΩ) pulled from borosilicate glass contained (in mM): K-gluconate (110), KCl (10), KOH (20), MgCl2 (1.5), HEPES (20), EGTA (10), CaCl2 (4.976; calculated free [Ca2+] = 80 nM), K2ATP (3), pH 7.2 with KOH. The external bathing solution was constantly perfused (∼8–10 ml/min) and contained (in mM): NaCl (144), KCl (2.5), CaCl2 (2.52), MgCl2 (1.2), HEPES/MES/TAPS (10), D-Glucose (22), pH 5.0–8.4 with NaOH. The buffer used was dependent on the pH of the solution: HEPES was used for pH 6.9 and 7.4, MES was used for pH 5.0–6.4, and TAPS was used for pH 8.0 and 8.4. Control experiments showed that buffer type had no effect on current characteristics and that similar effects of pH on current characteristics to those described were seen when HEPES was used (unpublished data). For experiments investigating the effect of K+ on pH sensitivity, NaCl concentration was altered to give a total ([Na+] + [K+]) of 146.5 mM. Otherwise the solutions were the same as above. Initial offset potentials were corrected for before recording. Junction potential shifts associated with solution changes varied by <1 mV and were not adjusted for. Currents were measured with capacitance compensation and series resistance compensation (>90%), filtered at 1 kHz using an 8-pole Bessel filter (Frequency Devices), and sampled at 5 kHz using Pulse (HEKA). Currents were not leak subtracted. Only cells with negligible current rundown after stabilization of whole-cell recording conditions (<1% current amplitude at −30 mV in 30 s) were used for experiments. Small endogenous currents were observed in HEK-293 and HEK-293 T cells at potentials positive to −20 mV (e.g., 9 + 1 pA at −30 mV; 40 ± 4 pA at 0 mV, n = 6 HEK-293T cells). These currents were small in comparison to KCNQ currents studied here (e.g., at −30 mV amplitude was typically >1 nA for KCNQ2 and KCNQ2/3 currents, 344 ± 38 pA for KCNQ3 currents, n = 7). However, in order to minimize the contribution of endogenous current to the relatively small KCNQ3 currents, analysis of KCNQ3 currents was restricted to potentials negative to 0 mV.
Cell-attached patch recordings were made at room temperature in a high K+ concentration bathing solution, which resulted in a resting membrane potential of ∼0 mV. The composition of this solution was (in mM): KCl (150), MgCl2 (5), CaCl2 (0.1), HEPES (10), D-Glucose (22), pH 7.4 with NaOH. The composition of the intrapipette solution (“extracellular” solution under cell-attached patch conditions) was: KCl (5.85), NaCl (144), MgCl2 (5), CaCl2 (0.1), D-Glucose (22), HEPES/MES/TAPS (10), pH 5.9–8.4 with NaOH. The buffer used was dependent on the pH of the solution: HEPES was used for pH 7.4, MES was used for pH 5.9–6.4, and TAPS was used for pH 8.4. Recordings were made using thick-walled quartz electrodes with resistances of 10–14 MΩ. Single-channel currents were recorded using an Axopatch 200A amplifier, filtered at 1 kHz (or 2kHz in one case, see Fig. 6) using an 8-pole Bessel filter (Frequency Devices) and acquired at 10 kHz using Pulse (HEKA).
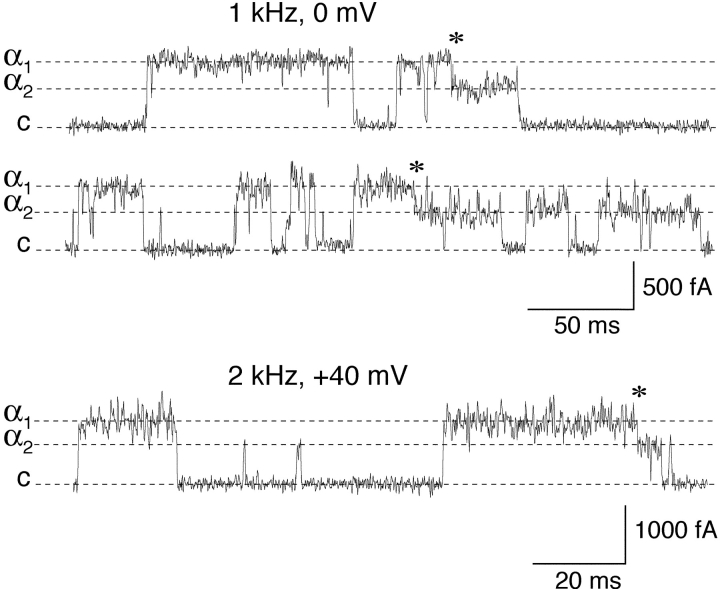
Figure 6.
Subconductance states of single KCNQ2/3 channels. Single-channel recordings from cell-attached patches showing the two amplitude classes (α1 and α2) of KCNQ2/3 channel opening. “Transitions” between these two amplitude levels are indicated by asterisks. A section from a patch recorded at a higher filtration rate (2 kHz) is shown, in addition to records filtered at 1 kHz.
Data Analysis
Voltage dependence of activation and deactivation time constants.
Time constants were measured from whole-cell activation and deactivation relaxations. The dependence of these time constants on the applied voltage was assessed by fitting the mean data at different voltages with a single exponential function of the form:
 |
where τ is the activation time constant or reciprocal deactivation time constant, V is the membrane potential, A is an amplitude coefficient, τ0 is the minimum value of τ, and x is the slope factor (mV/e-fold).
Activation curves.
The voltage dependence of steady-state channel activation was estimated from measurements of tail currents at −120 mV unless stated otherwise. The data were fit with Boltzmann distributions as shown below:
 |
where I(V) is the normalized tail current amplitude at a test potential V, V1/2 is the half-activation potential, k is the slope constant related to the apparent equivalent charge involved in channel gating, and Imax is the maximal amplitude of the Boltzmann distribution (or the maximum Po for single-channel data).
Concentration-response Curves
Curves were fit to mean data using the following equation:
 |
where y is the response, A1 is the minimum limiting value of y, A2 is the maximum limiting value of y, x is the pH, and k is the Hill slope. Hill slopes can indicate the possibility of cooperativity in ligand binding. Hill slopes equal to unity indicate a single binding site or noncooperative binding, whereas Hill slopes >1 can indicate a degree of positive cooperativity in binding. Hill slopes <1 can suggest either multiple binding sites with differing affinity, or an allosteric process affecting ligand binding affinity (e.g., Dahlquist, 1978; Koshland, 1996).
Whole-cell data were analyzed using PulseFit (HEKA) and Origin 6.0 (OriginLab). Single-channel recordings were analyzed using TAC (Bruxton), using the “50% threshold technique” to determine event amplitude and duration. All transitions were visually inspected before being accepted. Open- and closed-state histograms, as well as Po, were generated using TACFit (Bruxton). Statistical significance of multiple components was determined using the ratio of maximum likelihoods method (Horn and Lange, 1983; Colquhoun and Sigworth, 1995). Open- and closed-state histograms were derived only from patches containing a single channel. Patches containing a single channel were defined by the absence of current superimpositions at depolarizing potentials where Po was maximal (e.g., +20 mV) over prolonged time periods (>60s). For example, in the case of a patch containing two channels and an overall Po of 0.8, the likelihood of observing superimposed channel openings in a fixed period would be 0.4 × 0.4 × number of openings. In a 60-s time period containing 1,000 openings, ∼160 examples of channel opening superimpositions would therefore be expected. Even at the lowest Po observed (∼0.15 in pH 5.9), ∼6 superimpositions would be expected from this order of events. Absence of superimpositions within patches of similar or higher Po and duration was used as the working definition of a “single-channel patch.”
For the amplitude histograms, events lasting <1 ms were excluded to prevent analysis of openings that did not reach full amplitude (Cloues et al., 1997). A square-root function was used for the ordinate in order to reduce apparent variance between the number of events at each amplitude (as in Sigworth and Sine, 1987). All events were included in analysis of closed times and all events except those containing transitions were included in analysis of open times. Channel Po was first estimated as NPo, the product of the open probability × number of channels. NPo was calculated as (dwell-time × level number/total time). N was estimated during maximally depolarizing sweeps and Po was obtained by dividing NPo by N.
All values are expressed as mean ± SEM (Origin 6.0). Where error bars are not visible, they lie within symbols. Significance of results was compared using an appropriate t test and considered to be significant if P < 0.05.
Materials
Reagents were obtained as follows: standard chemicals (Sigma-Aldrich), calcium chloride (Fluka), Superfect transfection reagent (QIAGEN), fetal calf serum (Harlan Sera-Lab), DMEM, MEM, penicillin/streptomycin (GIBCO-BRL).
RESULTS
Extracellular H+ Ions Modulate KCNQ2/3 Current
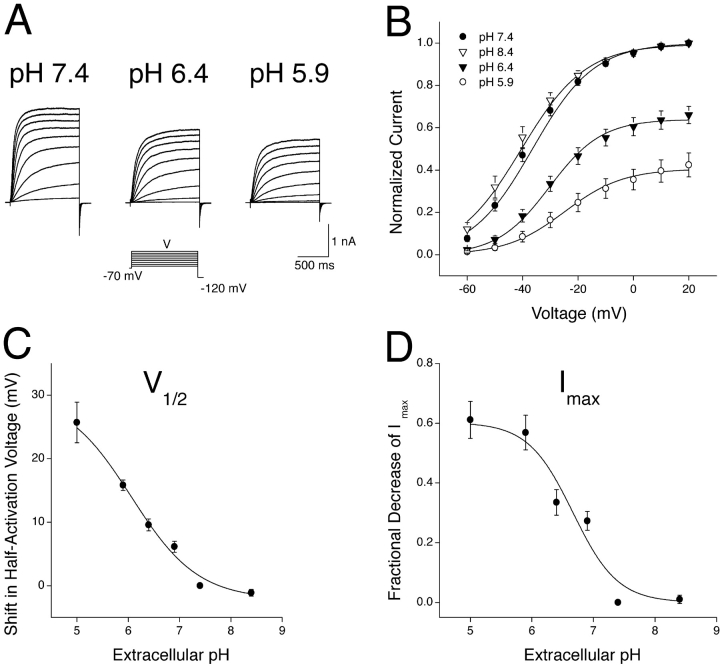
Coexpression of KCNQ2 and KCNQ3 subunits in HEK-293 cells gave rise to voltage-dependent potassium currents that were activated at potentials positive to −70 mV under normal physiological ionic conditions (Fig. 1 A). These currents were blocked by extracellular TEA ions with a sensitivity (IC50 = 3.2 mM, Hill slope = 1.3 ± 0.2; unpublished data) that was appropriate for a single population of heteromeric KCNQ2/3 channels with a fixed 2:2 stoichiometry (Hadley et al., 2003). Expressed KCNQ2/3 currents were sensitive to fluctuations of extracellular pH, with acidosis inducing a reduction of whole-cell currents (Fig. 1 A). This reduction was brought about by a depolarizing shift in the activation curve and a decrease in the maximum whole-cell current (Imax) (Fig. 1 B). The effects of acidosis were rapid (immediate upon exchange of bathing solution) and were reversible upon washout (unpublished data). Alkalosis (pH 8.4) caused an approximately −4 mV shift in the activation curve of whole-cell currents relative to those in pH 7.4 (Fig. 1 B; from individual cells, shift was −1.3 ± 0.5 mV, n = 9; paired t test P < 0.05).
Figure 1.
Modulation of heteromeric KCNQ2/3 current by extracellular H+ ions. (A) Whole-cell KCNQ2/3 currents from a HEK-293 cell in bathing solutions of differing pH were elicited by depolarizing voltage steps (1.5 s duration) from a holding potential of −70 mV. (B) Whole-cell KCNQ2/3 current activation curves in bathing solutions of pH 7.4 (n = 18), pH 8.4 (n = 9), pH 6.4 (n = 9), and pH 5.9 (n = 7). Tail currents at −120 mV were normalized to the amplitude of the tail current subsequent to a voltage pulse to +20 mV in pH 7.4. Curves are Boltzmann distributions fitted to the mean data, with parameters: V1/2 = −36.4 mV, (pH 7.4), −40.5 mV (pH 8.4); −32.6 mV (pH 6.4) and −24.9 mV (5.9); Imax = 1.00 (7.4), 0.99 (pH 8.4), 0.71 (6.4), and 0.41 (5.9); k = 11.1 mV (pH 7.4), 11.7 mV (pH 8.4), 9.7 mV (pH 6.4), and 10.5 mV (pH 5.9). (C) Modulation of the V1/2 of whole-cell KCNQ2/3 currents by extracellular pH. V1/2 values were determined from fits of Boltzmann distributions to mean data in each pH (n = 5–9). Curve shown is the fit of a concentration-response curve (see materials and methods) to the mean data, with the following parameters: minimum shift of V1/2 = −2.15 mV; maximum shift of V1/2 = +30.1 mV; EC50 = 6.13; and slope = −0.67 ± 0.16. This slope was significantly different to unity at the 10% confidence level (i.e., unity lies outside the 90% confidence interval of the mean). (D) Modulation of the Imax of whole-cell currents by extracellular pH. Imax values were determined from fits of Boltzmann distributions to the mean data in each pH (n = 5–9). Curve shown is the fit of a concentration-response curve (see materials and methods) to the mean data, with the following parameters: maximum fractional decrease = 0.60, EC50 = 6.68, and slope = −1.23 ± 0.2.
Sensitivity of KCNQ2/3 Currents to Extracellular H+ Ions
Extracellular H+ ions modulated both the activation curve and the Imax of expressed KCNQ2/3 currents. The sensitivity of these two current attributes to extracellular pH are shown independently in Fig. 1, C and D. Increased H+ concentration caused a depolarizing shift in the V1/2 of channel activation with an apparent KD of 739 nM (pH 6.13) and a Hill slope of −0.67 ± 0.16 (Fig. 1 C). This Hill slope of <1 suggests that H+ ions cause this activation gating change by acting on multiple binding sites, or via an allosteric mechanism. Imax was inhibited by extracellular H+ with an apparent KD of 210 nM (pH 6.68) and a Hill slope of −1.23 ± 0.2 (Fig. 1 D). This Hill slope of ∼1 suggests that H+ ions effect this decrease in Imax via a single coordinate binding site on the KCNQ2/3 channel or by noncooperative binding to several sites.
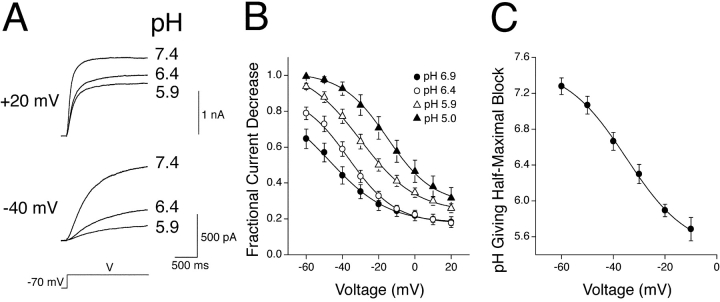
Steady-state KCNQ2/3 currents showed a sensitivity to extracellular H+ that was steeply voltage dependent (Fig. 2, A and B) . This resulted in a large change in current amplitude near the channel activation threshold (e.g., −60 mV). Even small fluctuations in extracellular pH were found to have profound effects on the amplitude of KCNQ2/3 current. The mean pH giving half-maximal block of KCNQ2/3 currents ranged from 7.28 (∼52 nM H+) at −60 mV to 5.69 (∼2 μM H+) at −10 mV (Fig. 2 C). Alkalosis induced by a change from pH 7.4 to pH 8.4 (i.e., 39 to 3 nM H+) resulted in a 50 ± 11% increase of steady-state current at −60 mV and a 16 ± 6% increase at −50 mV (n = 9). At potentials more positive than −50 mV, steady-state current was relatively unaffected by such alkalosis (unpublished data).
Figure 2.
Sensitivity of heteromeric KCNQ2/3 current to extracellular H+ ions. (A) Whole-cell KCNQ2/3 current activation relaxations in bathing solutions of different pH were evoked by depolarizing voltage pulses (1.5 s duration) from a holding potential of −70 mV. Currents shown are from the same cell. (B) Fractional decrease of whole-cell steady-state KCNQ2/3 current in response to pH changes from pH 7.4 to the pH values indicated. Steady-state currents were measured at the end of depolarizing voltage pulses (1.5 s duration). (C) Voltage dependence of the IC50 values for H+-induced KCNQ2/3 current decrease. Concentration-response curves were constructed for KCNQ2/3 current inhibition at each voltage and the IC50 values determined at each voltage. IC50 values are shown plotted against voltage. Solid line is for display purposes only.
Extracellular H+ Ions Modulate Activation and Deactivation Kinetics of KCNQ2/3 Currents
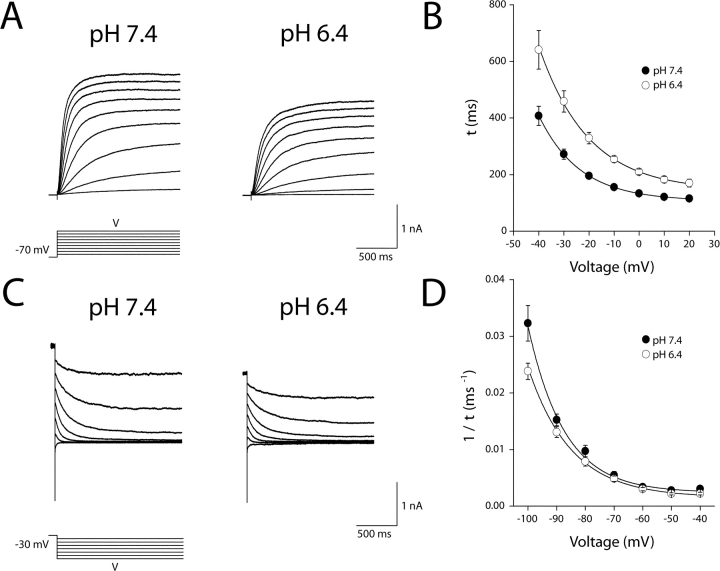
Whole-cell KCNQ2/3 activation and deactivation current relaxations were both affected by increases in external H+ concentration (Fig. 3, A and C) . Acidosis (pH 6.4) caused a pronounced (∼1.5-fold) slowing of KCNQ2/3 current activation kinetics over the entire voltage range (Fig. 3 B). The voltage dependence of activation kinetics was described by an exponential function (Fig. 3 B), consistent with the exponential voltage dependence described for activation kinetics of other potassium channels (Tzounopoulos et al., 1998; Silverman et al., 2000). Acidosis reduced the apparent voltage dependence of activation kinetics. This was seen as an increase of the slope factor from e-fold/17.6 ± 1.3 mV in pH 7.4 to e-fold/20.6 ± 1.2 mV in pH 6.4 (calculated from individual cells, n = 8; P < 0.05, paired t test). Acidosis (pH 6.4) induced a slight (∼1.1–1.4-fold) slowing of deactivation kinetics which was significant over the entire voltage range (Fig. 3 D; paired t test; P < 0.05, n = 9). The voltage dependence of deactivation kinetics was described by an exponential function (Fig. 3 D), consistent with the previously described exponential voltage-dependence for deactivation kinetics of KCNQ2/3 currents (Wang et al., 1998). Acidosis reduced the apparent voltage dependence of deactivation kinetics. This was seen as an increase of the slope factor from e-fold/12.7 ± 1.0 mV in pH 7.4 to e-fold/16.0 ± 0.7 mV in pH 6.4 (calculated from individual cells, n = 9; P < 0.05, paired t test). Slowing of both activation and deactivation kinetics in response to increased extracellular H+ cannot be explained solely by surface charge-neutralization predictions, where slowing of activation and speeding of deactivation would be expected. This suggests that H+ ions also modulate specific channel regions involved in gating transitions. Slowing of activation kinetics by acidosis may have resulted in currents failing to fully attain steady-state by the end of the depolarizing pulse at potentials negative to −40 mV. The sensitivity of steady-state KCNQ2/3 current to acidosis (Figs. 1 and 2) may therefore have been slightly overestimated at these potentials.
Figure 3.
Modulation of KCNQ2/3 current activation and deactivation kinetics by extracellular H+ ions. (A) Whole-cell KCNQ2/3 current activation relaxations in bathing solutions of different pH were evoked by depolarizing voltage pulses (1.5 s duration) from a holding potential of −70 mV. Currents shown are from the same cell. (B) Activation time constants (τ) for KCNQ2/3 current. Time constants were derived by fitting a single exponential to activation relaxations between the times 10 ms (to account for sigmoidal phase of activation) and 1500 ms after the onset of the depolarizing voltage pulse. The solid line shown is the fit of an exponential distribution to the time constants at different voltages. Parameters of this distribution were: A = 26.1 ms (pH 7.4) and 66.7 ms (pH 6.4); τ0 = 107.1 ms (pH 7.4) and 143.3 ms (pH 6.4); and x = e-fold/16.3 mV (pH 7.4), and e-fold/19.7 mV (pH 6.4). (C) Whole-cell KCNQ2/3 current deactivation relaxations in bathing solutions of different pH were evoked by hyperpolarizing voltage steps (1.5 s duration) after a depolarizing voltage pulse to −30 mV (1.5 s duration). Currents shown are from the same cell. (D) Reciprocal deactivation time constants (1/τ) for KCNQ2/3 current. Time constants were derived by fitting a single exponential to deactivation relaxations between the times 6 ms and 1,500 ms after the onset of the hyperpolarizing voltage pulse. Solid line is the fit of an exponential distribution to the time constants at different voltages. Parameters of this distribution were: A = 10−5 ms−1 (pH 7.4) and 3 × 10⁻⁵ ms−1 (pH 6.4); τ0 = 0.0024 ms−1 (pH 7.4) and 0.0015 ms−1 (pH 6.4); and x = e-fold/12.7 mV (pH 7.4) and e-fold/15.1 mV (pH 6.4).
Extracellular K+ Antagonizes the H+-induced Decrease in Imax of KCNQ2/3 Currents
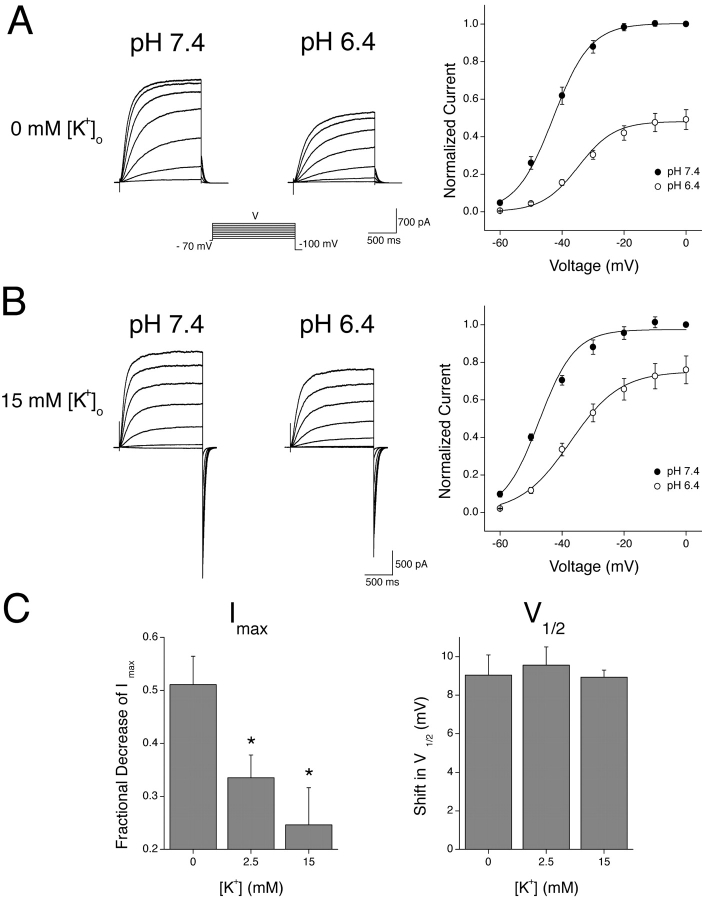
Potassium channels have been shown to possess K+ binding sites within the outer pore region (Doyle et al., 1998; Zhou et al., 2001). Occupation of these sites can antagonize the H+-induced modulation of other potassium channels and provides good evidence for a pore-based action of H+ ions (Perez-Cornejo, 1999; Kehl et al., 2002). Changes in extracellular K+ concentration were similarly found to affect the reduction of KCNQ2/3 Imax seen in response to extracellular acidosis (Fig. 4) . KCNQ2/3 currents were recorded in varying concentrations of extracellular K+ and the responses to changes in extracellular pH from 7.4 to 6.4 were assessed. This change in pH caused a pronounced decrease in Imax and a rightward shift in the activation curve when extracellular K+ was absent (Fig. 4 A). When the concentration of extracellular K+ was increased to 15 mM, the H+-induced decrease in Imax was reduced, but the shift in V1/2 was unchanged (Fig. 4 B). A quantitative assessment of the K+ dependence of these two parameters of H+-induced KCNQ2/3 current modulation is shown in Fig. 4 C. Increasing levels of extracellular K+ antagonized the H+-induced decrease in Imax, while leaving the H+-induced shift in V1/2 unaltered (Fig. 4 C). This suggests that the decrease in Imax and the shift in V1/2 occur via independent processes. The reversal potential of whole-cell currents was not altered by changes in extracellular pH (e.g., Fig. 3 C). Therefore, the observed decrease in Imax was not due to a change in the K+/Na+ selectivity of the KCNQ2/3 channels involved.
Figure 4.
Extracellular K+ ions antagonize the H+-induced decrease in KCNQ2/3 Imax. (A) Whole-cell KCNQ2/3 current activation relaxations in bathing solutions of different pH which contained 0 mM extracellular K+ were evoked by depolarizing voltage pulses (1.5 s duration) from a holding potential of −70 mV. Currents shown are from the same cell. Activation curves shown were calculated from tail currents at −100 mV and were normalized to the tail current obtained subsequent to a depolarizing pulse to 0 mV. Curves are Boltzmann distributions fit to the mean data (n = 5), with the following parameters: V1/2 = −43.1 mV (pH 7.4) and −35.2 mV (pH 6.4); Imax = 1.06 (pH 7.4) and 0.50 (pH 6.4); k = 5.9 mV (pH 7.4) and 5.7 mV (pH 6.4). (B) A similar protocol was used to evoke relaxations in bathing solutions of different pH when 15 mM extracellular K+ was present. Curves are Boltzmann distributions to the mean data (n = 4), with the following parameters: V1/2 = −43.5 mV (pH 7.4) and −38.8 mV (pH 6.4); Imax = 0.99 (pH 7.4) and 0.78 (pH 6.4); k = 7.6 mV (pH 7.4) and 6.4 mV (pH 6.4). (C) Dependence of H+-induced KCNQ2/3 current modulation on extracellular K+ concentration. Imax values and V1/2 values were obtained from Boltzmann distributions fit to data from individual cells exposed to pH 7.4 and pH 6.4. Shifts shown are the shifts induced upon changing the pH from 7.4 to 6.4. Asterisk indicates significantly different to the corresponding value in 0 mM K+ (unpaired t test; P < 0.05).
Modulation of Single KCNQ2/3 Channels by Extracellular H+ Ions
To determine how single-channel properties were modulated by fluctuations in extracellular pH, single-channel recordings were performed in the cell-attached patch configuration from HEK-293 cells expressing KCNQ2/3 currents.
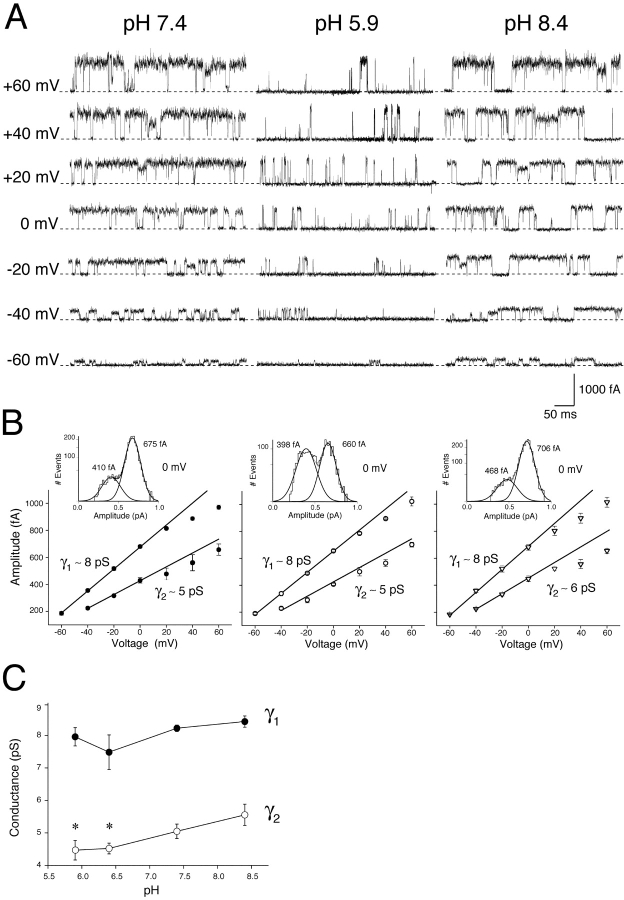
Single KCNQ2/3 channel activity from cell-attached patches under conditions of different extracellular pH is shown in Fig. 5 A. Single KCNQ2/3 channel currents displayed two amplitude levels, both of which displayed sublinear current-voltage relationships at potentials positive to 0 mV (Fig. 5 B). At pH 7.4, a predominant amplitude level (α1) with a slope conductance (γ1) of 8.2 ± 0.1 pS (mean of six individual patches; range: 7.8–8.5 pS) was observed, in addition to a smaller amplitude level (α2) with a slope conductance (γ2) of 5.1 ± 0.2 pS (mean from the same 6 individual patches; range: 4.1–5.6 pS). Both amplitude levels were present in all patches for every pH analyzed. The smaller amplitude level α2 was much less frequent than the larger α1 at pH 7.4 (Fig. 5 B, insets). Under conditions of acidic extracellular pH, the relative occurrence of α1 and α2 became approximately equal, while alkalosis had no obvious effect (Fig. 5 B, insets). Measurement of the number of α1 and α2 events during a fixed time period (50 s, as shown in the insets to Fig. 5 B) enabled a quantitative assessment of the effect of acidosis on the frequency of α1 and α2 events (lasting >1 ms). In pH 7.4, 86% α1 events and 14% α2 events were observed out of a total 2630 events. In pH 5.9, 50% α1 events and 50% α2 events were observed out of a total 2578 events. These results show that acidosis induced a gain of α2 events at the expense of an approximately equal number of α1 events. This suggests that acidosis caused a switch of single-channel activity from the full-conductance state (∼8 pS) to a sub-conductance state (∼5 pS). The frequency of opening events was not markedly altered by acidosis (pH 5.9) at 0 mV, even when all events (including those lasting <1 ms) were analyzed: 3,236 events in pH 7.4 and 3,317 events in pH 5.9 over 50 s. This result has implications for the mechanism underlying alteration of closed-state kinetics by H+ ions (see below).
Figure 5.
Modulation of single KCNQ2/3 channels by extracellular H+ ions. (A) Cell-attached patch recordings from HEK-293 cells expressing KCNQ2/3 channels. Single KCNQ2/3 channel activity from separate patches is shown at a range of voltages under conditions of different extracellular (intrapipette) pH. The dotted lines show the closed-state level, with channel openings being upward. (B) Conductance of single KCNQ2/3 channels exposed to different extracellular pH. Two amplitude classes (α1 and α2) of KCNQ2/3 channels were observed (see insets, showing Gaussian distributions fit to data recorded at 0 mV over a fixed time period of 50 s). Slope conductances of these two amplitude classes (γ1 and γ2, respectively) are shown as solid lines. Slopes are linear fits to the mean data (n = 5–7 patches) between −60 and 0 mV for α1 and between −40 and 0 mV for α2. (C) Mean slope conductance of single KCNQ2/3 channel amplitude classes (derived from individual patches, n = 5–7) under conditions of different extracellular pH. Asterisk indicates significantly different to corresponding value at pH 8.4 (unpaired t test; P < 0.05).
The slope conductances γ1 and γ2 at different extracellular pH are shown in Fig. 5 C. Extracellular H+ was found to have an amplitude class-selective effect on channel conductance. The conductance γ1 was not significantly affected by changes in extracellular pH (Fig. 5 C). In contrast, the conductance γ2 was decreased significantly at acidic pH (Fig. 5 C).
Subconductance States of Single KCNQ2/3 Channels
Multiple conductance values have been described previously for single KCNQ2/3 channels (Schwake et al., 2000; Selyanko et al., 2001). However, it was unclear from these previous studies whether multiple amplitude levels arose from separate channels (for example, by virtue of differing subunit stoichiometry), or whether they represented subconductance states of single KCNQ2/3 channels. Single KCNQ2/3 channels displayed two amplitude levels α1 and α2 (Figs. 5 and 6) . Superimpositions of α1 on α2 were never observed in patches that did not also display superimpositions of α1 on α1 or α2 on α2. In addition, transitions between these two amplitude levels were sometimes observed in nominally single-channel patches (see materials and methods for the working definition of a “single-channel patch”), with no resolvable intervening closures separating the two amplitude levels, even at a higher filtration rate of 2 kHz (Fig. 6, asterisks). Such transitions were rare (n = 15 out of >103 events) and appeared to occur preferentially from large amplitude to small amplitude (n = 13 out of 15 transitions). The absence of α1/α2 superimpositions and the occurrence of transitions suggests that the amplitude levels α1 and α2 are derived from the same single KCNQ2/3 channel, with γ2 representing a sub-conductance state of the full conductance state γ1.
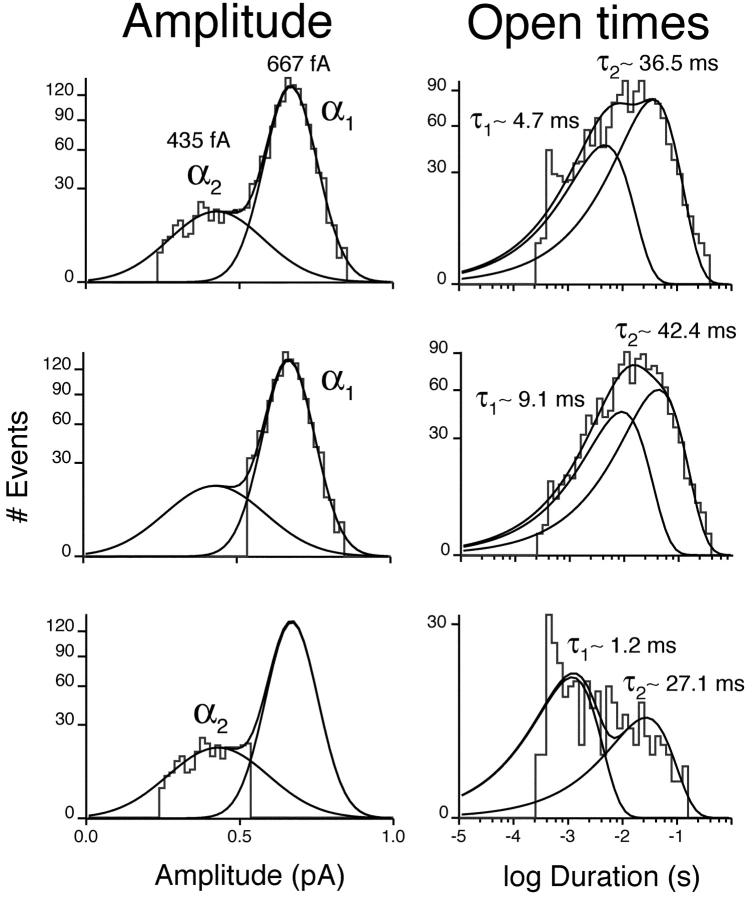
Fig. 7 shows the amplitude and open-duration histograms for a representative patch containing a single KCNQ2/3 channel at pH 7.4. Open-time analysis of all events gave a histogram best fit with the sum of two exponentials with τ values of τ1 ∼4.7 ms and τ2 ∼36.5 ms at 0 mV (Fig. 7, top right). When the α2 amplitude class was excluded from the analysis (Fig. 7, middle row), slightly longer open times were observed for the α1 amplitude class (τ1 ∼9.1 ms and τ2 ∼42.4 ms). When the α1 amplitude class was excluded from the analysis (Fig. 7, bottom row), the α2 amplitude class was observed to exhibit shorter open times (τ1 ∼1.2 ms and τ2 ∼27.1 ms). The two channel states α1 and α2 were therefore found to be kinetically distinct with respect to open times.
Figure 7.
Subconductance states of single KCNQ2/3 channels exhibit distinct open-state kinetics. Top left shows the amplitude histogram obtained at 0 mV from a patch containing a single channel. Mean channel amplitudes at 0 mV, derived from Gaussian distributions, were: α1 = 667 fA and α2 = 435 fA. Open time analysis of all events (excluding openings containing transitions) gave a distribution best fit with the sum of two exponentials with time constants of 4.7 and 36.5 ms (top right). Excluding the smaller amplitude class (α2) from the analysis (center left) showed that the larger amplitude class (α1) displayed open state kinetics described by two exponentials with time constants of 9.1 ms and 42.4 ms (center right). Excluding α1 from the analysis (bottom left) showed that α2 also displayed open-state kinetics described by two exponentials, but with time constants of 1.2 and 27.1 ms (bottom right).
Extracellular H+ Ions Modulate Gating of Single KCNQ2/3 Channels
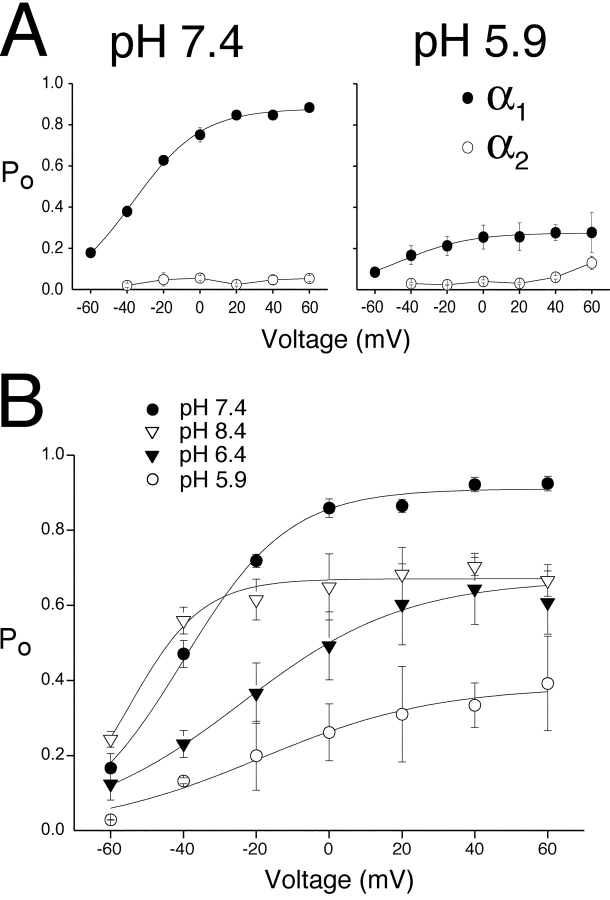
As shown in Fig. 5, exposure of single KCNQ2/3 channels within cell-attached patches to extracellular acidosis resulted in a reduction of channel Po. The conductance and relative frequency of α1 and α2 events were differentially affected by extracellular pH (Fig. 5) and these states were kinetically distinct with respect to open times (Fig. 7). The possibility therefore existed that the gating of α1 and α2 states might also be differentially affected by extracellular pH. We examined the effect of extracellular pH on the Po of the individual KCNQ2/3 amplitude levels α1 and α2. In pH 7.4, the Po values of these two KCNQ2/3 amplitude levels were markedly different (Fig. 8 A). The larger amplitude α1 exhibited a Po that was steeply dependent on voltage and reached a maximum of Po ∼0.9 (Fig. 8 A). In contrast, the smaller amplitude α2 showed a Po that was not obviously voltage sensitive and attained a maximum of Po ∼0.05 (Fig. 8 A). The effect of pH fluctuations on the Po of the two amplitude classes was also different. Acidosis (pH 5.9) led to a large decrease in the Po of α1 over the entire voltage range (Fig. 8 A). In contrast, exposure to pH 5.9 did not cause any significant decrease in the Po of α2 (Fig. 8 A; t test, P > 0.05 over the entire voltage range). The voltage and pH dependence of the total KCNQ2/3 channel Po (including both amplitude classes) is shown in Fig. 8 B. In accordance with whole-cell observations, an increase in extracellular H+ concentration induced both a rightward shift in the activation curve of single KCNQ2/3 channels and a decrease in the maximum Po attainable by depolarization. For example, exposure to pH 5.9 resulted in an approximately +21-mV shift in the activation curve and an ∼75% reduction of maximum Po relative to pH 7.4. Alkalosis (pH 8.4) caused a hyperpolarizing shift in the activation curve (−15 mV) and reduced channel Po at positive potentials (Fig. 8 B). This differed from the effect of alkalosis on macroscopic Imax (Fig. 1). The reasons for this difference are unclear.
Figure 8.
Modulation of single KCNQ2/3 channel open probability by extracellular H+ ions. (A) Voltage dependence of single KCNQ2/3 channel Po for individual amplitude classes is shown under conditions of extracellular (intra-pipette) pH 7.4 and 5.9 (n = 3 patches containing a single channel). All events were included in analysis, except openings containing transitions. Curves are Boltzmann distributions fit to the mean data for the larger amplitude class (α1), with parameters: V1/2 = −35.5 mV (pH 7.4), −46.4 mV (pH 5.9); Maximum Po = 0.88 (pH 7.4), 0.28 (pH 5.9); k = 18.1 mV (pH 7.4) and 20.2 mV (pH 5.9). (B) Voltage and pH dependence of total single KCNQ2/3 channel Po. Solid curves show Boltzmann distributions when all events (both amplitude classes) were pooled (n = 7 patches). Parameters were: V1/2 = −40.0 mV (pH 7.4), −24.1 mV (pH 6.4), −19.1 mV (pH 5.9), −54.7 mV (pH 8.4); Maximum Po = 0.91 (pH 7.4), 0.67 (pH 6.4), 0.38 (pH 5.9), 0.68 (pH 8.4); k = 14.4 mV (pH 7.4), 22.5 mV (pH 6.4), 24.2 mV (pH 5.9) and 15.4 mV (pH 8.4).
Extracellular H+ Ions Modulate Single KCNQ2/3 Channel Open-state Kinetics
The open-state kinetics of single KCNQ2/3 channels under conditions of different extracellular pH are shown in Fig. 9 . Since the two amplitude classes α1 and α2 displayed distinct open-state kinetics (Fig. 7), the open times of these two amplitude classes were analyzed separately in order to assess whether their open-state kinetics were differentially modulated by H+ ions.
Figure 9.
Modulation of single KCNQ2/3 channel open-state kinetics by extracellular H+ ions. (A) Open-state kinetics of large amplitude α1 events exposed to an extracellular (intrapipette) pH of 7.4 or 5.9, recorded at a range of membrane potentials. Values shown are time constants for each kinetically distinct open state, obtained from the fitting of exponential functions to histograms including all events (from three patches containing a single channel). (B) Open-state kinetics of small amplitude α2 events exposed to an extracellular pH of 7.4 or 5.9, recorded at a range of membrane potentials. Values shown are time constants for each kinetically distinct open state, obtained from the fitting of exponential functions to histograms including all events (from the same three single-channel patches used in A). Individual exponential functions and their sum are shown as solid curves. Openings containing transitions were excluded from analysis.
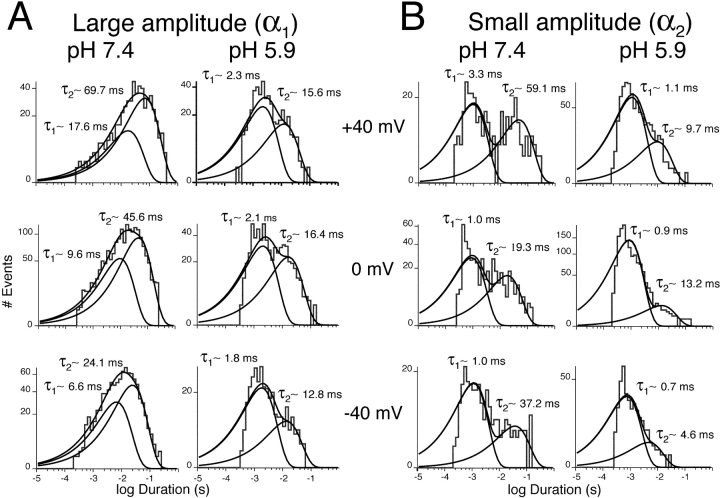
Two kinetically distinct open states of α1 were observed over the entire voltage range in pH 7.4 (Fig. 9 A, left column). Open times displayed marked voltage dependence, with both kinetic components becoming longer at more depolarized potentials. Upon exposure to acidosis (pH 5.9), two open states were still observed, but their open times were shortened (P < 0.05, t test for both open states at all voltages shown; n = 3 patches; Fig. 9 A, right column) and exhibited less voltage dependence. Acidosis also induced a predominance of short duration α1 openings (Fig. 9 A, right column). Two kinetically distinct open states of α2 were also observed over the entire voltage range in pH 7.4 (Fig. 9 B, left column), both of which were relatively voltage insensitive. Upon exposure to acidosis (pH 5.9), two open states were again observed. The time constant describing longer-duration open events was reduced by acidosis (at +40 mV; P < 0.05, t test; n = 3 patches; Fig. 9 B, right column), while the time constant describing shorter duration open events was unaffected (at +40 mV; P > 0.05, t test). Both open times remained relatively voltage insensitive. Acidosis also induced a predominance of short duration α2 openings (Fig. 9 B, right column).
Extracellular H+ Ions Modulate Single KCNQ2/3 Channel Closed-state Kinetics
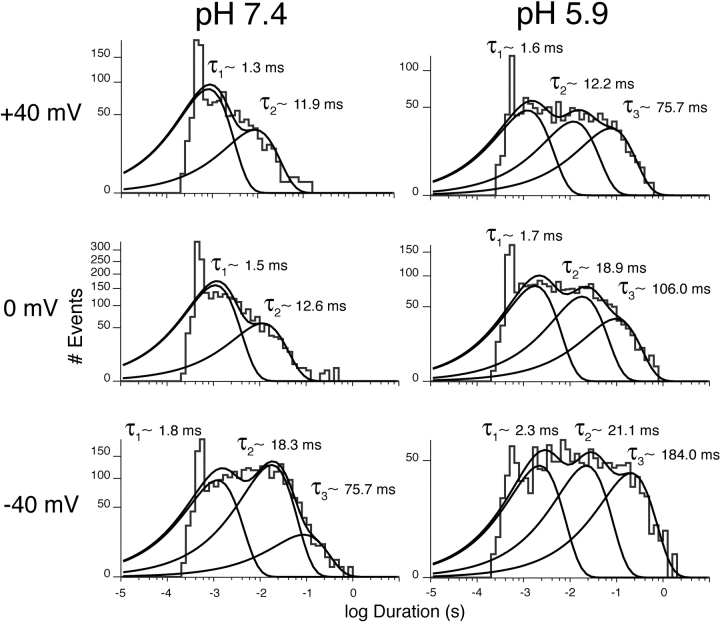
The closed-state kinetics of single KCNQ2/3 channels were found to be modulated by changes in extracellular H+ concentration (Fig. 10) . To assess the effect of H+ ions on the closed-state kinetics of single KCNQ2/3 channels, it was necessary to group closure events from both amplitude levels. KCNQ2/3 channels displayed three kinetically distinct closed states in pH 7.4 (Fig. 10, left column), an observation that is consistent with previous studies (Selyanko et al., 2001; Tatulian and Brown, 2003). One closed state (C1) was described by a time constant of ∼1–2 ms, a second (C2) with a time constant of ∼10–20 ms, and a third (C3) with a time constant of ∼50–200 ms over the voltage range studied. Closed times showed voltage dependence, becoming shorter at more depolarized potentials. The contribution of C3 to total channel closures was negligible at potentials positive to −20 mV. Upon exposure to pH 5.9, closed-state kinetics were altered (Fig. 10, right column). Acidosis caused an increase in the magnitude of the time constants describing each of the closed states at all voltage studied. Acidosis also led to a dramatic increase in the relative contribution of the long-lived closed state C3 to total channel closure events at all voltages studied (P < 0.01, t test; n = 3 patches). In addition, acidosis caused the presence of this closed state to be maintained at depolarized potentials (Fig. 10). These results indicate that at negative membrane potentials (negative to −20 mV), a proportion of long duration closures may correspond to a closed state whose presence is not dependent upon acidosis. This would be similar to the long-lived closed state previously observed for native M-channels, in which channels were proposed to reside at negative membrane potentials (Selyanko and Brown, 1999). Subsequent discussion of the “C3” state will relate to the long closures thought to be derived from acidosis. The duration of long closures were reduced by depolarization, falling from ∼180 ms at −40 mV to ∼80 ms at +40 mV in pH 5.9.
Figure 10.
Modulation of single KCNQ2/3 channel closed-state kinetics by extracellular H+ ions. (A) Closed-state kinetics of single KCNQ2/3 channels exposed to different extracellular (intra-pipette) pH, recorded at a range of membrane potentials. Values shown are time constants for each kinetically distinct closed state. These were obtained from the fitting of exponential functions to histograms including all events (including both amplitude levels). Each set of histograms for each pH is derived from three separate patches containing a single KCNQ2/3 channel. Individual exponential functions and their sum are shown as solid curves.
Subunit-selective Effects of Extracellular H+ Ions
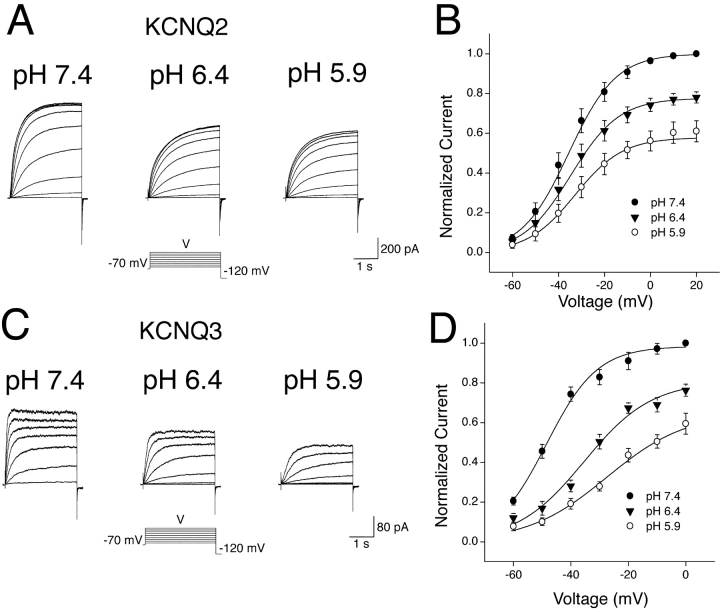
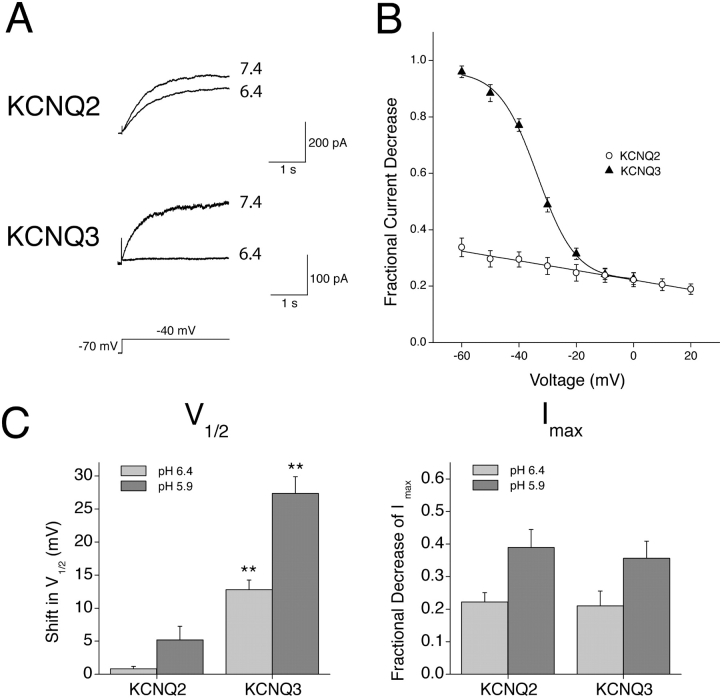
The mechanism of H+-induced modulation of KCNQ2/3 channels was investigated further by examining the potential subunit-selective effects of extracellular H+ ions. KCNQ2 and KCNQ3 subunits were independently expressed in HEK-293T cells, with the resulting whole-cell currents representing expression of homomeric KCNQ2 or KCNQ3 channels. Both of these current types were modulated by extracellular H+ ions (Fig. 11, A and C) . However, the characteristics of modulation were markedly different between the two current types. KCNQ2 currents were decreased by extracellular acidosis solely as a result of a depression of the activation curve, without any change in the half-activation voltage or slope (Fig. 11 B). In contrast, KCNQ3 currents showed a marked depolarizing shift in the half-activation voltage and a decrease in the slope (P < 0.05; paired t test, n = 5), as well as a depression of the activation curve in response to acidosis (Fig. 11 D). The contrasting mechanism of modulation of these two channel types led to marked differences in the overall H+-sensitivity of KCNQ2 and KCNQ3 currents at negative potentials (Fig. 12 A). KCNQ3 currents showed a high sensitivity that was steeply voltage dependent (Fig. 12 B). KCNQ2 currents showed a markedly lower sensitivity over much of the physiological voltage range, with much less voltage dependence (Fig. 12 B). Heteromeric KCNQ2/3 currents were observed to exhibit a sensitivity to acidosis that was approximately intermediate to that of KCNQ2 and KCNQ3 over much of the voltage range studied (Figs. 2 and 12). The decrease in Imax of KCNQ2 and KCNQ3 currents in response to acidosis (pH 6.4) was not significantly different (Fig. 12 C; t test, P > 0.05). In contrast, a depolarizing shift in the V1/2 of KCNQ3 current was observed in response to acidosis (pH 6.4), while the V1/2 of KCNQ2 current was relatively unaffected (Fig. 12 C).
Figure 11.
Subunit-specific modulation of KCNQ channel gating by extracellular H+ ions. (A) Whole-cell KCNQ2 currents from a HEK-293T cell in bathing solutions of different pH were elicited by depolarizing voltage steps (3.0 s duration) from a holding potential of −70 mV. (B) Whole-cell KCNQ2 current activation curves in bathing solutions of pH 7.4 (n = 7), pH 6.4 (n = 6) and pH 5.9 (n = 4). Curves are Boltzmann distributions with parameters: V1/2 = −35.5 mV (pH 7.4), −34.6 mV (pH 6.4), and −32.8 mV (pH 5.9); Imax = 1.00 (pH 7.4), 0.78 (pH 6.4), and 0.58 (pH 5.9); k = 10.3 mV (pH 7.4), 10.5 mV (pH 6.4), and 10.4 mV (pH 5.9). (C) Whole-cell KCNQ3 currents from a HEK-293T cell in bathing solutions of different pH were elicited by depolarizing voltage steps (3.0 s duration) from a holding potential of −70 mV. (D) Whole-cell KCNQ3 current activation curves in bathing solutions of pH 7.4 (n = 7), pH 6.4 (n = 7), and pH 5.9 (n = 5). Curves are Boltzmann distributions with parameters: V1/2 = −48.5 mV (pH 7.4), −35.4 mV (pH 6.4), and −27.5 mV (pH 5.9); Imax = 0.98 (pH 7.4), 0.81 (pH 6.4), and 0.65 (pH 5.9); k = 8.8 mV (pH 7.4), 11.7 mV (pH 6.4), and 13.9 mV. Data used for activation curves were derived from tail currents at −120 mV, which were normalized to the amplitude of the tail current subsequent to a voltage pulse of +20 mV (for KCNQ2) or 0 mV (for KCNQ3) in pH 7.4.
Figure 12.
Subunit-specific sensitivity of KCNQ channels to extracellular H+ ions. (A) Whole-cell currents elicited by depolarizing voltage steps from a holding potential of −70 mV are shown in different extracellular pH. (B) Fractional decrease of whole-cell steady-state KCNQ2 and KCNQ3 currents in response to a pH change from pH 7.4 to 6.4. Curves are for display purposes only. Steady-state currents were measured at the end of depolarizing voltage pulses (3.0 s duration). (C) Shifts in V1/2 and fractional decreases of Imax of whole-cell currents caused by a change in pH from 7.4 to the values indicated. Asterisks indicate significantly different to the corresponding value for KCNQ2 (unpaired t test; P < 0.01).
Both activation and deactivation kinetics of whole-cell homomeric KCNQ2 and KCNQ3 currents were slowed by acidosis (Table I) . KCNQ2 currents experienced an ∼1.5-fold slowing of deactivation kinetics while showing an ∼1.2-fold slowing of activation kinetics upon exposure to pH 6.4. In contrast, KCNQ3 experienced an ∼1.3-fold slowing of deactivation kinetics while showing a much greater (∼3.0-fold) slowing of activation kinetics upon exposure to pH 6.4.
TABLE I.
Effect of External Acidosis on Macroscopic Gating Kinetics of Homomeric KCNQ2 and KCNQ3 Currents
| Activation (−30 mV) | Deactivation (−120 mV) | |||
|---|---|---|---|---|
| pH 7.4 | pH 6.4 | pH 7.4 | pH 6.4 | |
| KCNQ2 | 405 ± 33 (9) | 497 ± 37 (9)a | 22.8 ± 0.4 (7) | 34.8 ± 2.8 (7)b |
| KCNQ3 | 235 ± 29 (7) | 713 ± 43 (7)b | 16.6 ± 0.7 (7) | 22.2 ± 0.7 (7)b |
Values were obtained from the fit of single exponential functions to current relaxations. Activation relaxations were evoked by depolarizing pulses (3.0 s duration) from a holding potential of −70 mV. Deactivation relaxations were evoked by hyperpolarizing pulses (250 ms duration) after a prepulse to −30 mV (3.0 s duration). Values of n are shown in parentheses.
Significantly different to the corresponding value in pH 7.4 (P < 0.05; paired t test).
Significantly different to the corresponding value in pH 7.4 (P < 0.01; paired t test).
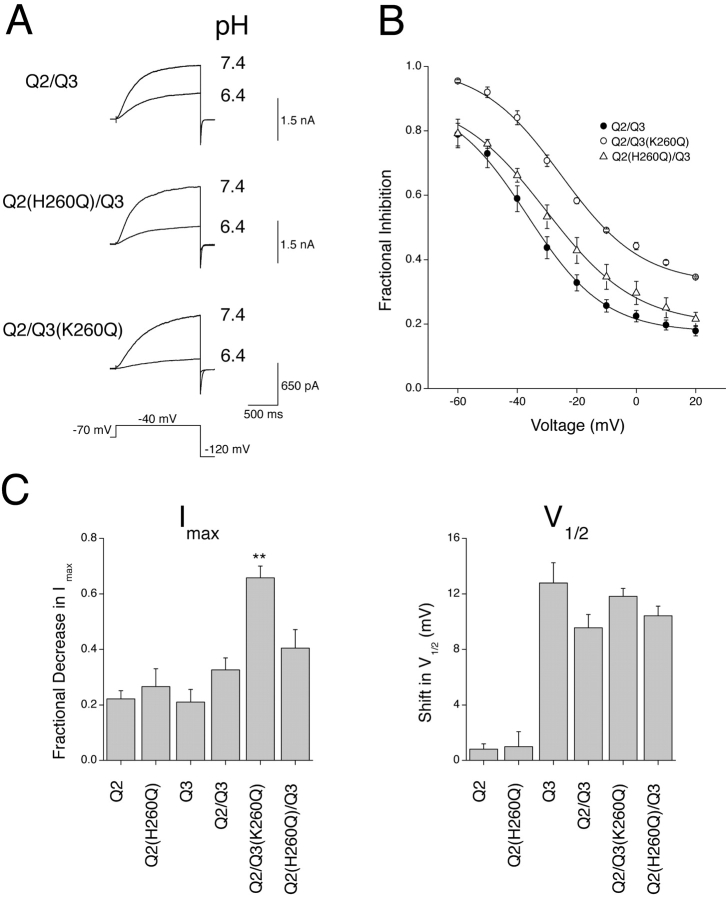
Replacement of a histidine residue in the outer-pore turret region of the voltage-gated potassium channels Kv1.4 and Kv1.5 with a neutral amino acid reduces the extent of acidosis-induced Imax decrease in these channel types (Steidl and Yool, 1999; Claydon et al., 2002). The KCNQ2 subunit possesses a histidine residue (H260) at an analogous position within the outer-pore turret region (Fig. 13) . In contrast to the above observations for Kv1.4 and Kv1.5, mutation of this histidine residue to a neutral glutamine residue in KCNQ2 (H260Q) gave rise to a slight increase in the sensitivity to acidosis of heteromeric KCNQ2/3 channels incorporating this mutant subunit (Fig. 14, A and B ; t test, only significant at −10 mV where P < 0.05). Homomeric channels composed of KCNQ2 (H260Q) subunits did not display any significant change in sensitivity to acidosis (pH 6.4) and neither the acidosis-induced Imax decrease or shift in V1/2 were significantly affected by this mutation (Fig. 14 C; t test, P > 0.05). The KCNQ3 subunit possesses a basic lysine residue (K260) within the outer-pore turret region (Fig. 13). Mutation of this basic lysine residue to a neutral glutamine (K260Q) dramatically increased the sensitivity of KCNQ2/3 current to acidosis (Fig. 14, A and B; t test, P < 0.01 at all voltages studied). This increase in sensitivity was due to a more pronounced decrease of Imax, while the acidosis-induced shift in V1/2 was not significantly altered (Fig. 14 C).
Figure 13.
The S5–pore linker region of KCNQ2/KCNQ3 subunits. Residues discussed in the text are shown in bold, including residues H260 of KCNQ2 and K260 of KCNQ3. EMBL/GenBank/DDBJ accession nos. used were: Kv1.4 (P22459), Kv1.5 (P22460), and Kv2.1 (NP_004966).
Figure 14.
Pore determinants of KCNQ2/3 channel sensitivity to H+ ions. (A) Whole-cell KCNQ2/3 (n = 9), KCNQ2/KCNQ3(K260Q) (n = 4) and KCNQ2(H260Q)/KCNQ3 currents elicited by depolarizing voltage steps from a holding potential of −70 mV are shown in different extracellular pH. “Q2” represents KCNQ2 and “Q3” represents KCNQ3. (B) Fractional decrease in response to a pH change from pH 7.4 to pH 6.4 of whole-cell steady-state wild-type KCNQ currents and mutant KCNQ currents. Curves are for display purposes only. Steady-state currents were measured at the end of depolarizing voltage pulses (1.5 s duration). (C) Shifts in V1/2 and fractional decreases of Imax of whole-cell currents caused by a change in pH from 7.4 to 6.4. Asterisks indicate significantly different to the value for the corresponding wild-type channel (unpaired t test; P < 0.01).
Inhibition of Native Neuronal M-current by H+ Ions
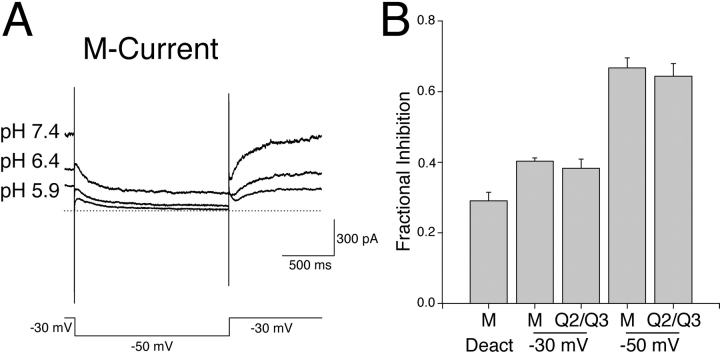
Heteromeric KCNQ2/3 potassium channels have been proposed to underlie native neuronal M-current (Wang et al., 1998). It was tested whether the model M-current native to rat sympathetic neurons of the superior cervical ganglia (SCG) showed a sensitivity to extracellular H+ ions that was similar to KCNQ2/3 current. The effect of changing extracellular pH on M-current is shown in Fig. 15 . To record M-currents from neurons, a protocol was used whereby M-current was activated by holding the neuronal membrane potential at −30 mV and deactivation relaxations were evoked by stepping to a more hyperpolarized potential (−50 mV). Extracellular acidosis caused an inhibition of M-current (Fig. 15 A). A quantitative assessment of the relative sensitivity of M-current and KCNQ2/3 current to acidosis (pH 6.4) is shown in Fig. 15 B. Both current types showed a similar concentration- and voltage-dependent sensitivity of steady-state currents to extracellular H+ ions.
Figure 15.
Modulation of neuronal M-current by extracellular H+ ions. (A) Whole-cell M-currents from a rat SCG neuron in bathing solutions of different pH were elicited by hyperpolarizing voltage steps (1.5 s duration) from a holding potential of −30 mV. The dotted line denotes the zero-current level. (B) Fractional inhibition of current amplitude induced by a switch from extracellular pH 7.4 to 6.4. Inhibition of steady-state M-current (“M”) and KCNQ2/3 current (“Q2/Q3”) at −30 and −50 mV is shown, in addition to the inhibition of M-current deactivation relaxation amplitude (induced by stepping from −30 to −50 mV). No significant difference was seen between the inhibition of M-current (n = 4) and the inhibition of KCNQ2/3 current (n = 9) at any voltage studied (P > 0.05, t test).
DISCUSSION
Extracellular H+ ions were found to modulate two distinct characteristics of macroscopic KCNQ2/3 current: the voltage dependence of activation and the maximum current attainable upon depolarization (Imax). The sensitivity of these two characteristics to extracellular H+ ions was different (Fig. 1) and could be separated by alterations of extracellular ionic conditions (Fig. 4) or by mutagenesis (Fig. 14), indicating that they arise as a consequence of independent modulatory processes. Similarly distinct effects of H+ ions on channel gating and Imax have been observed previously for Kv1.5 potassium channels (Steidl and Yool, 1999; Kehl et al., 2002).
Modulation of KCNQ2/3 Channel Activation Gating by Extracellular H+ Ions
Modulation of the voltage dependence of steady-state activation of KCNQ2/3 current showed an IC50 of ∼740 nM (pH 6.1) and a Hill slope of approximately −0.7. This slope value of <1 may indicate that sensitivity of steady-state activation to H+ ions is dictated by multiple binding sites, or by allosteric effects. The latter possibility would be consistent with conformational changes that occur during channel activation. Both the activation and deactivation kinetics of macroscopic KCNQ2/3 channels were slowed by increasing H+ concentration (Fig. 3). Slowing of both activation and deactivation kinetics in response to increased H+ is inconsistent with simple fixed surface charge-neutralization alone, where slowing of activation and speeding of deactivation would be expected. This suggests that H+ ions also modulate specific channel regions involved in channel activation and deactivation. Although speculative, a mechanism involving neutralization of both surface charge and the charge on specific acidic residues involved in voltage sensor movements seems consistent with the observed slowing of activation/deactivation kinetics along with the decrease in their voltage sensitivity.
Homomeric KCNQ2 currents did not exhibit any significant net changes in the voltage dependence of steady-state activation in response to increased H+ concentration. In contrast, homomeric KCNQ3 currents showed large net changes in the voltage dependence of steady-state activation (Figs. 11 and 12). The elements necessary for effecting the H+-induced net changes in voltage dependence of steady-state activation must therefore be derived from the KCNQ3 subunit. KCNQ2 and KCNQ3 currents exhibited a slowing of both activation and deactivation relaxation kinetics in response to increased H+. A relatively greater effect of increased H+ on activation kinetics compared with deactivation kinetics was observed for KCNQ3 currents. In contrast, KCNQ2 activation and deactivation kinetics were similarly slowed by H+. The above results are again not consistent with a simple fixed surface charge-neutralization process and suggest that specific modulation of gating processes by extracellular H+ ions also occurs. Consistent with the H+-induced modulation of steady-state activation that was observed for macroscopic KCNQ2/3 currents, increasing H+ ion concentration induced depolarizing shifts in the steady-state activation curve of single KCNQ2/3 channels and reduced the maximal Po attainable by depolarization (Fig. 8).
Single KCNQ2/3 channel open times were shortened by acidosis. This shortening of open times was pronounced (two- to threefold) and was seen at potentials as depolarized as +40 mV (Fig. 9). In contrast, the macroscopic deactivation time course of KCNQ2/3 current was slowed by acidosis. This suggests that recruitment of the long-lived closed state C3 may have been responsible for the shortening of open times, rather than an acceleration of transitions to existing closed states. Acidosis shortened the open times of α2 events and increased the proportion of short-duration events. This occurred without any significant decrease in the Po of α2 events (Fig. 9). These results were reconciled by the observation that the frequency of α2 events increased upon exposure to acidosis (Fig. 5).
Macroscopic activation kinetics were slowed by acidosis (Fig. 3). Consistent with this, closed-state durations were lengthened by acidosis (Fig. 10). Lengthening of long-duration closures may also account for the observed shift in the voltage dependence of steady-state activation upon exposure to acidosis.
Mechanism of Decrease in Imax
An H+ ion–induced decrease in Imax has been reported for other ion channels. The mechanism of this decrease has been shown to vary between channel types. For example, H+ ions reduce the conductance of some sodium, calcium, and potassium channels (Prod'hom et al., 1987; Zhang and Siegelbaum, 1991; Coulter et al., 1995), while reducing channel availability in some voltage-dependent potassium channels (Claydon et al., 2002; Zhang et al., 2003). In the case of the latter channel types, the reduction of channel availability has been attributed to an effect of H+ ions on the extent of outer pore-based P/C-type inactivation (Perez-Cornejo, 1999; Claydon et al., 2002; Kehl et al., 2002; Peretz et al., 2002; Zhang et al., 2003). In contrast to the majority of native and cloned potassium channels, KCNQ2/3 channels and neuronal M-current have been reported to lack inactivation (Constanti and Brown, 1981; Brown and Yu, 2000). This raises the question of how H+ ions induced a reduction in the Imax of KCNQ2/3 current.
Increasing extracellular K+ antagonized the H+-induced decrease in Imax (Fig. 4). In addition, replacement of a basic lysine residue within the outer-pore turret of the KCNQ3 subunit with a neutral amino acid (K260Q) led to a more pronounced H+-induced decrease in Imax (Fig. 14). These results suggest the existence of an outer-pore delineated process in KCNQ2/3 channels, which is modulated by the concentration of extracellular H+ and K+ ions and by electrostatic interactions within the outer pore. An outer-pore histidine residue in the potassium channels Kv1.4 and Kv1.5 (Fig. 13) has been shown to be a determinant of the H+-induced decrease in Imax of these channels (Steidl and Yool, 1999; Claydon et al., 2002). In contrast, mutation of a histidine residue at the equivalent position in the KCNQ2 subunit enhanced the H+-induced decrease in Imax of heteromeric KCNQ2/3 channels (Fig. 14). Interestingly, the equivalent residue in Kv2.1 (Fig. 13) has been shown to affect outer-pore conformation and K+ occupancy (Wood and Korn, 2000). The KCNQ3 subunit does not possess a histidine residue at this position, but still showed a robust H+-induced decrease in Imax. These observations suggest that a different mechanism of pore-based H+-modulation exists between KCNQ channels and other Kv channels. The results presented here suggest that a positive charge on residues K260 in KCNQ3 and H260 in KCNQ2 may tonically inhibit a form of outer pore-based closure in wild-type KCNQ2/3 channels.
Single-channel data revealed that the slope conductance of the dominant amplitude class (α1) of KCNQ2/3 channel opening was not affected by H+ ions over the concentration range tested (pH 5.9–8.4). In contrast, H+ ions did affect the slope conductance of the α2 amplitude class of KCNQ2/3 channels, with acidosis resulting in a decrease of conductance (Fig. 5). However, this effect made a negligible contribution to the overall decrease in Imax, due to the very low relative Po of this amplitude class. Acidosis caused a switch from α1 to α2 openings (Fig. 5). This may indicate that H+ ions themselves give rise to the α2 amplitude class, an effect that would be similar to the H+-mediated induction of subconductance states described previously for calcium channels (Prod'hom et al., 1987; Chen et al., 1996).
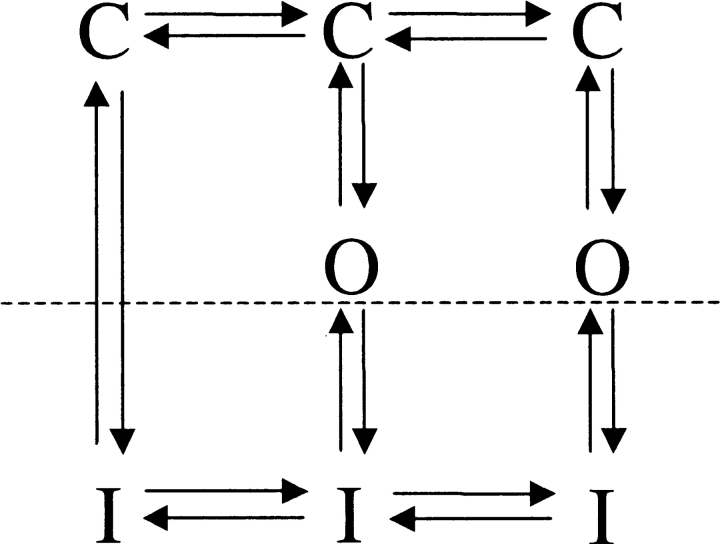
Acidosis promoted the relatively long-lived closed state C3 (τ ∼50–200 ms). Given the localization of the Imax decrease to sites within the outer pore, this C3 state (which largely accounts for the decrease in maximum Po/macroscopic Imax) is likely to be induced by an outer-pore–based process. This could involve physical occlusion of the outer pore, or disturbance of K+ binding sites along the pore axis. Entry into the C3 state appeared to be state dependent, since the frequency of opening events was not altered despite a marked increase in the frequency of these long duration C3 events. The observation that single-channel open times were decreased by acidosis despite a slowing of macroscopic deactivation kinetics suggests that acidosis might induce entry into a closed state (C3) that is accessible from channel open states. Structural changes have been shown to occur within the outer pore of potassium channels during activation gating (Yellen et al., 1994; Liu et al., 1996; Cha and Bezanilla, 1997; Perozo et al., 1999). In addition, structural changes within the outer pore of potassium channels have been shown to be capable of inducing subconductance states and modulation of single-channel gating kinetics (Lu et al., 2001). The results shown here are consistent with the effects of H+ ions being linked to such structural changes within the outer pore during KCNQ2/3 channel gating. Reduction of C3 occupancy by depolarization (Fig. 10) and relief of current inhibition at depolarized potentials (Figs. 12 and 14) suggests that the C3 closed state may be destabilized by increased K+ ion flux through the channel pore. In addition, extracellular K+ ions prevented reduction of Imax by H+ ions (Fig. 4). The latter observation is reminiscent of the prevention of P/C-type inactivation by K+ ions within the outer pore of Shaker potassium channels (Baukrowitz and Yellen, 1996). However, the reduction of C3 occupation and relief of KCNQ2/3 current inhibition by depolarization differ from observations of Shaker potassium channels, where depolarization has been shown to increase the extent of P/C-type inactivation (Olcese et al., 1997; Loots and Isacoff, 1998). A simplified model of gating that accounts for the observed data is shown below (Scheme I) .
SCHEME I.
Transitions below the dotted line in Scheme I were assumed to occur only under conditions of acidosis. In this model, acidosis accelerates entry into an inactivated state (I), which corresponds kinetically to long-duration (C3) closures. Entry into this state (I) is assumed to occur predominantly from the open state, as acidosis did not reduce the frequency of events (Fig. 5). We have adopted a gating scheme incorporating sequential transitions between closed states. In this respect the scheme is similar to those proposed for Shaker and other Kv channels (Zagotta et al., 1994; Schoppa and Sigworth, 1998; Zhang et al., 2003). Such a scheme differs from that proposed previously for M-channels (Selyanko and Brown, 1999). The existence of sequential transitions between closed states is more consistent with the sigmoidal time course of activation observed for KCNQ2/3 currents (this study and Selyanko et al., 2000), which contrasts with the exponential time course reported for M-current activation (Selyanko and Brown, 1999).
Physiological Significance of KCNQ2/3 Channel Modulation by Extracellular H+
Modulation of neuronal M-current results in marked changes to neuronal activity (Adams et al., 1982; Aiken et al., 1995; Tatulian et al., 2001). Modulation of the KCNQ2/3 channels proposed to underlie this current (Wang et al., 1998) is therefore of considerable physiological and pathological importance. Homomeric KCNQ2 channels may also be expressed in some regions, including synaptic sites and hippocampal neurons (Cooper et al., 2001; Shah et al., 2002). Differences between the modulation of homomeric and heteromeric KCNQ channels may therefore be important for region-specific modulation of neuronal properties. It is interesting to note that high sensitivity to H+ ions and effects of H+ ions on the net voltage dependence of steady-state activation gating were conferred by the KCNQ3 subunit. The KCNQ3 subunit is the most promiscuous of the KCNQ subunits, forming heteromeric channels with KCNQ2, KCNQ4 and KCNQ5 subunits (Jentsch, 2000). High sensitivity to H+ ions may therefore correlate with KCNQ3 occurrence within a wide variety of neuronal M-type channels formed by KCNQ channels.
Potent inhibitory modulation of KCNQ2/3 currents and M-current by H+ ions occurred at negative membrane potentials that lie within the subthreshold range for action potential firing in many neurons (Figs. 2 and 15). Marked pH changes are known to occur during physiological processes such as neuronal firing and synaptic transmission. Acidification of the synaptic cleft is likely to occur upon release of vesicular contents (Krishtal et al., 1987; DeVries, 2001). Such acidification has been proposed to serve a modulatory role in synaptic transmission by acting on presynaptic calcium channels and postsynaptic ligand-gated ion channels (Traynelis and Cull-Candy, 1990; DeVries, 2001; Mott et al., 2003). The presence of postsynaptic KCNQ2/KCNQ3 subunits and the presence of KCNQ2 subunits at presynaptic sites suggests that channels composed of these subunits may also contribute to H+-induced modulation of synaptic transmission.
At negative potentials, KCNQ2/3 current was greatly augmented by alkalosis, a process known to exacerbate neuronal injury following ischemia (Giffard et al., 1992). This effect would tend to hyperpolarize the cell membrane and prevent excessive excitation caused by alkaline-induced activation of NMDA, AMPA, kainate, sodium, and calcium channels in neurons (Traynelis and Cull-Candy, 1990, 1991; Tombaugh and Somjen, 1996; Mott et al., 2003). Interestingly, both blockade of M-current and acidosis have also been associated with neuroprotective events in some neurons (Tombaugh and Sapolsky, 1993; Xia et al., 2002). Therefore, acidosis-induced inhibition and alkalosis-induced enhancement of KCNQ2/3 channels and neuronal M-current may underlie neuroprotective responses, depending on the neuronal cell type.
We have shown that modulation of KCNQ2/3 channels by extracellular H+ occurs in a subunit-dependent manner via the combination of a novel outer-pore mediated process and modulation of specific processes involved in channel activation gating. Modulatory actions of extracellular H+ ions on KCNQ2/3 channels and neuronal M-current are likely to be important contributors to physiological processes such as neuronal firing and synaptic transmission, as well as to regional changes in neuronal activity and neuronal survival observed during pathological events such as ischemia and epilepsy.
Acknowledgments
We thank Dr. David McKinnon (SUNY, Stony Brook, NY) for providing KCNQ2 and KCNQ3 constructs. We also thank Professor David Brown (UCL, London) and Dr. Galen Flynn (University of Washington, Seattle) for providing HEK-293T cells.
This work was supported by the UK Medical Research Council.
Olaf S. Andersen served as editor.
References
- Adams, P.R., D.A. Brown, and A. Constanti. 1982. Pharmacological inhibition of the M-current. J. Physiol. 332:223–262. [DOI] [PMC free article] [PubMed] [Google Scholar]
- Aiken, S.P., B.J. Lampe, P.A. Murphy, and B.S. Brown. 1995. Reduction of spike frequency adaptation and blockade of M-current in rat CA1 pyramidal neurones by linopirdine (DuP 996), a neurotransmitter release enhancer. Br. J. Pharmacol. 115:1163–1168. [DOI] [PMC free article] [PubMed] [Google Scholar]
- Baukrowitz, T., and G. Yellen. 1996. Use-dependent blockers and exit rate of the last ion from the multi-ion pore of a K+ channel. Science. 271:653–656. [DOI] [PubMed] [Google Scholar]
- Beech, D.J., L. Bernheim, A. Mathie, and B. Hille. 1991. Intracellular Ca2+ buffers disrupt muscarinic suppression of Ca2+ current and M current in rat sympathetic neurons. Proc. Natl. Acad. Sci. USA. 88:652–656. [DOI] [PMC free article] [PubMed] [Google Scholar]
- Biervert, C., B.C. Schroeder, C. Kubisch, S.F. Berkovic, P. Propping, T.J. Jentsch, and O.K. Steinlein. 1998. A potassium channel mutation in neonatal human epilepsy. Science. 279:403–406. [DOI] [PubMed] [Google Scholar]
- Brown, D.A. 1988. M-currents. Ion Channels. 1:55–94. [DOI] [PubMed] [Google Scholar]
- Brown, D.A., and P.R. Adams. 1980. Muscarinic suppression of a novel voltage-sensitive K+ current in a vertebrate neurone. Nature. 283:673–676. [DOI] [PubMed] [Google Scholar]
- Brown, B.S., and S.P. Yu. 2000. Modulation and genetic identification of the M channel. Prog. Biophys. Mol. Biol. 73:135–166. [DOI] [PubMed] [Google Scholar]
- Cha, A., and F. Bezanilla. 1997. Characterizing voltage-dependent conformational changes in the Shaker K+ channel with fluorescence. Neuron. 19:1127–1140. [DOI] [PubMed] [Google Scholar]
- Charlier, C., N.A. Singh, S.G. Ryan, T.B. Lewis, B.E. Reus, R.J. Leach, and M. Leppert. 1998. A pore mutation in a novel KQT-like potassium channel gene in an idiopathic epilepsy family. Nat. Genet. 18:53–55. [DOI] [PubMed] [Google Scholar]
- Chen, X.H., I. Bezprozvanny, and R.W. Tsien. 1996. Molecular basis of proton block of L-type Ca2+ channels. J. Gen. Physiol. 108:363–374. [DOI] [PMC free article] [PubMed] [Google Scholar]
- Chesler, M. 1990. The regulation and modulation of pH in the nervous system. Prog. Neurobiol. 34:401–427. [DOI] [PubMed] [Google Scholar]
- Chesler, M., and K. Kaila. 1992. Modulation of pH by neuronal activity. Trends Neurosci. 15:396–402. [DOI] [PubMed] [Google Scholar]
- Claydon, T.W., M.R. Boyett, A. Sivaprasadarao, and C.H. Orchard. 2002. Two pore residues mediate acidosis-induced enhancement of C-type inactivation of the Kv1.4 K+ channel. Am. J. Physiol. Cell Physiol. 283:C1114–C1121. [DOI] [PubMed] [Google Scholar]
- Cloues, R.K., S.J. Tavalin, and N.V. Marrion. 1997. Beta-adrenergic stimulation selectively inhibits long-lasting L-type calcium channel facilitation in hippocampal pyramidal neurons. J. Neurosci. 17:6493–6503. [DOI] [PMC free article] [PubMed] [Google Scholar]
- Colquhoun, D., and F.J. Sigworth. 1995. Fitting and statistical analysis of single-channel records. Single-channel Recording. 2nd Edition. B. Sakmann and E. Neher, editors. Plenum Press, New York. 438–588.
- Constanti, A., and D.A. Brown. 1981. M-currents in voltage-clamped mammalian sympathetic neurones. Neurosci. Lett. 24:289–294. [DOI] [PubMed] [Google Scholar]
- Cooper, E.C., E. Harrington, Y.N. Jan, and L.Y. Jan. 2001. M channel KCNQ2 subunits are localized to key sites for control of neuronal network oscillations and synchronization in mouse brain. J. Neurosci. 21:9529–9540. [DOI] [PMC free article] [PubMed] [Google Scholar]
- Coulter, K.L., F. Perier, C.M. Radeke, and C.A. Vandenberg. 1995. Identification and molecular localization of a pH-sensing domain for the inward rectifier potassium channel HIR. Neuron. 15:1157–1168. [DOI] [PubMed] [Google Scholar]
- Dahlquist, F.W. 1978. The meaning of Scatchard and Hill plots. Methods Enzymol. 48:270–299. [DOI] [PubMed] [Google Scholar]
- de Curtis, M., A. Manfridi, and G. Biella. 1998. Activity-dependent pH shifts and periodic recurrence of spontaneous interictal spikes in a model of focal epileptogenesis. J. Neurosci. 18:7543–7551. [DOI] [PMC free article] [PubMed] [Google Scholar]
- DeVries, S.H. 2001. Exocytosed protons feedback to suppress the Ca2+ current in mammalian cone photoreceptors. Neuron. 32:1107–1117. [DOI] [PubMed] [Google Scholar]
- Doyle, D.A., J. Morais Cabral, R.A. Pfuetzner, A. Kuo, J.M. Gulbis, S.L. Cohen, B.T. Chait, and R. MacKinnon. 1998. The structure of the potassium channel: molecular basis of K+ conduction and selectivity. Science. 280:69–77. [DOI] [PubMed] [Google Scholar]
- Giffard, R.G., J.H. Weiss, and D.W. Choi. 1992. Extracellular alkalinity exacerbates injury of cultured cortical neurons. Stroke. 23:1817–1821. [DOI] [PubMed] [Google Scholar]
- Hadley, J.K., G.M. Passmore, L. Tatulian, M. Al-Qatari, F. Ye, A.D. Wickenden, and D.A. Brown. 2003. Stoichiometry of expressed KCNQ2/KCNQ3 channels and subunit composition of native ganglionic M-currents deduced from block by tetraethylammonium (TEA). J. Neurosci. 23:5012–5019. [DOI] [PMC free article] [PubMed] [Google Scholar]
- Horn, R., and K. Lange. 1983. Estimating kinetic constants from single channel data. Biophys. J. 43:207–223. [DOI] [PMC free article] [PubMed] [Google Scholar]
- Hu, H., K. Vervaeke, and J.F. Storm. 2002. Two forms of electrical resonance at theta frequencies, generated by M-current, h-current and persistent Na+ current in rat hippocampal pyramidal cells. J. Physiol. 545:783–805. [DOI] [PMC free article] [PubMed] [Google Scholar]
- Jentsch, T.J. 2000. Neuronal KCNQ potassium channels: physiology and role in disease. Nat. Rev. Neurosci. 1:21–30. [DOI] [PubMed] [Google Scholar]
- Kehl, S., C. Eduljee, D.C.H. Kwan, S. Zhang, and D. Fedida. 2002. Molecular determinants of the inhibition of human Kv1.5 potassium currents by external protons and Zn2+ . J. Physiol. 541:9–24. [DOI] [PMC free article] [PubMed] [Google Scholar]
- Koshland, D.E., Jr. 1996. The structural basis of negative cooperativity: receptors and enzymes. Curr. Opin. Struct. Biol. 6:757–761. [DOI] [PubMed] [Google Scholar]
- Krishtal, O.A., Y.V. Osipchuk, T.N. Shelest, and S.V. Smirnoff. 1987. Rapid extracellular pH transients related to synaptic transmission in rat hippocampal slices. Brain Res. 436:352–356. [DOI] [PubMed] [Google Scholar]
- Liu, Y., M.E. Jurman, and G. Yellen. 1996. Dynamic rearrangement of the outer mouth of a K+ channel during gating. Neuron. 16:859–867. [DOI] [PubMed] [Google Scholar]
- Loots, E., and E.Y. Isacoff. 1998. Protein rearrangements underlying slow inactivation of the Shaker K+ channel. J. Gen. Physiol. 112:377–389. [DOI] [PMC free article] [PubMed] [Google Scholar]
- Lu, T., A.Y. Ting, J. Mainland, L.Y. Jan, P.G. Schultz, and J. Yang. 2001. Probing ion permeation and gating in a K+ channel with backbone mutations in the selectivity filter. Nat. Neurosci. 4:239–246. [DOI] [PubMed] [Google Scholar]
- Marrion, N.V. 1997. Control of M-current. Annu. Rev. Physiol. 59:483–504. [DOI] [PubMed] [Google Scholar]
- Mott, D.D., M.S. Washburn, S. Zhang, and R.J. Dingledine. 2003. Subunit-dependent modulation of kainite receptors by extracellular protons and polyamines. J. Neurosci. 23:1179–1188. [DOI] [PMC free article] [PubMed] [Google Scholar]
- Olcese, R., R. Latorre, L. Toro, F. Bezanilla, and E. Stefani. 1997. Correlation between charge movement and ionic current during slow inactivation in Shaker K+ channels. J. Gen. Physiol. 110:579–589. [DOI] [PMC free article] [PubMed] [Google Scholar]
- Otto, J.F., M.M. Kimball, and K.S. Wilcox. 2002. Effects of the anticonvulsant retigabine on cultured cortical neurons: changes in electroresponsive properties and synaptic transmission. Mol. Pharmacol. 61:921–927. [DOI] [PubMed] [Google Scholar]
- Pan, Z., A.A. Selyanko, J.K. Hadley, D.A. Brown, J.E. Dixon, and D. McKinnon. 2001. Alternative splicing of KCNQ2 potassium channel transcripts contributes to the functional diversity of M-currents. J. Physiol. 531:347–358. [DOI] [PMC free article] [PubMed] [Google Scholar]
- Peretz, A., H. Schottelndreier, L.B. Aharon-Shangar, and B. Attali. 2002. Modulation of homomeric and heteromeric KCNQ1 channels by external acidification. J. Physiol. 545:751–766. [DOI] [PMC free article] [PubMed] [Google Scholar]
- Perez-Cornejo, P. 1999. H+ ion modulation of C-type inactivation of Shaker K+ channels. Pflugers Arch. 437:865–870. [DOI] [PubMed] [Google Scholar]
- Perozo, E., D.M. Cortes, and L.G. Cuello. 1999. Structural rearrangements underlying K+-channel activation gating. Science. 285:73–78. [DOI] [PubMed] [Google Scholar]
- Prod'hom, B., D. Pietrobon, and P. Hess. 1987. Direct measurement of proton transfer rates to a group controlling the dihydropyridine-sensitive Ca2+ channel. Nature. 329:243–246. [DOI] [PubMed] [Google Scholar]
- Robbins, J. 2001. KCNQ potassium channels: physiology, pathophysiology, and pharmacology. Pharmacol. Ther. 90:1–19. [DOI] [PubMed] [Google Scholar]
- Rogawski, M.A. 2000. KCNQ2/KCNQ3 K+ channels and the molecular pathogenesis of epilepsy: implications for therapy. Trends Neurosci. 23:393–398. [DOI] [PubMed] [Google Scholar]
- Schoppa, N.E., and F.J. Sigworth. 1998. Activation of Shaker potassium channels. III. An activation gating model for wild-type and V2 mutant channels. J. Gen. Physiol. 111:313–342. [DOI] [PMC free article] [PubMed] [Google Scholar]
- Schwake, M., M. Pusch, T. Kharkovets, and T.J. Jentsch. 2000. Surface expression and single channel properties of KCNQ2/KCNQ3, M-type K+ channels involved in epilepsy. J. Biol. Chem. 275:13343–13348. [DOI] [PubMed] [Google Scholar]
- Selyanko, A.A., and D.A. Brown. 1999. M-channel gating and simulation. Biophys. J. 77:701–713. [DOI] [PMC free article] [PubMed] [Google Scholar]
- Selyanko, A.A., J.K. Hadley, and D.A. Brown. 2001. Properties of single M-type KCNQ2/KCNQ3 potassium channels expressed in mammalian cells. J. Physiol. 534:15–24. [DOI] [PMC free article] [PubMed] [Google Scholar]
- Selyanko, A.A., J.K. Hadley, I.C. Wood, F.C. Abogadie, T.J. Jentsch, and D.A. Brown. 2000. Inhibition of KCNQ1-4 potassium channels expressed in mammalian cells via M1 muscarinic acetylcholine receptors. J. Physiol. 522:349–355. [DOI] [PMC free article] [PubMed] [Google Scholar]
- Shah, M.M., M. Mistry, S.J. Marsh, D.A. Brown, and P. Delmas. 2002. Molecular correlates of the M-current in cultured rat hippocampal neurons. J. Physiol. 544:29–37. [DOI] [PMC free article] [PubMed] [Google Scholar]
- Sigworth, F.J., and S.M. Sine. 1987. Data transformations for improved display and fitting of single-channel dwell time histograms. Biophys. J. 52:1047–1054. [DOI] [PMC free article] [PubMed] [Google Scholar]
- Silverman, W.R., C.Y. Tang, A.F. Mock, K.B. Huh, and D.M. Papazian. 2000. Mg2+ modulates voltage-dependent activation in ether-a-go-go potassium channels by binding between transmembrane segments S2 and S3. J. Gen. Physiol. 116:663–678. [DOI] [PMC free article] [PubMed] [Google Scholar]
- Singh, N.A., C. Charlier, D. Stauffer, R. DuPont, R.J. Leach, and R. Melis. 1998. A novel potassium channel gene, KCNQ2, is mutated in an inherited epilepsy of newborns. Nat. Genet. 18:25–29. [DOI] [PubMed] [Google Scholar]
- Steidl, J.V., and A.J. Yool. 1999. Differential sensitivity of voltage-gated potassium channels Kv1.5 and Kv1.2 to acidic pH and molecular identification of pH sensor. Mol. Pharmacol. 55:812–820. [PubMed] [Google Scholar]
- Tatulian, L., and D.A. Brown. 2003. Effect of the KCNQ potassium channel opener retigabine on single KCNQ2/3 channels expressed in CHO cells. J. Physiol. 549:57–63. [DOI] [PMC free article] [PubMed] [Google Scholar]
- Tatulian, L., P. Delmas, F.C. Abogadie, and D.A. Brown. 2001. Activation of expressed KCNQ potassium currents and native neuronal M-type potassium currents by the anti-convulsant drug retigabine. J. Neurosci. 21:5535–5545. [DOI] [PMC free article] [PubMed] [Google Scholar]
- Tinel, N., I. Lauritzen, C. Chouabe, M. Lazdunski, and M. Borsotto. 1998. The KCNQ2 potassium channel: splice variants, functional and developmental expression. Brain localization and comparison with KCNQ3. FEBS Lett. 438:171–176. [DOI] [PubMed] [Google Scholar]
- Tombaugh, G.C., and R.M. Sapolsky. 1993. Evolving concepts about the role of acidosis in ischemic neuropathology. J. Neurochem. 61:793–803. [DOI] [PubMed] [Google Scholar]
- Tombaugh, G.C., and G.G. Somjen. 1996. Effects of extracellular pH on voltage-gated Na+, K+, and Ca2+ currents in isolated rat CA1 neurons. J. Physiol. 493:719–732. [DOI] [PMC free article] [PubMed] [Google Scholar]
- Traynelis, S.F., and S.G. Cull-Candy. 1990. Proton inhibition of N-methyl-d-aspartate receptors in cerebellar neurons. Nature. 345:347–350. [DOI] [PubMed] [Google Scholar]
- Traynelis, S.F., and S.G. Cull-Candy. 1991. Pharmacological properties and H+ sensitivity of excitatory amino acid receptor channels in rat cerebellar granule neurones. J. Physiol. 433:727–763. [DOI] [PMC free article] [PubMed] [Google Scholar]
- Tzounopoulos, T., J. Maylie, and J.P. Adelman. 1998. Gating of IsK channels expressed in Xenopus oocytes. Biophys. J. 74:2299–2305. [DOI] [PMC free article] [PubMed] [Google Scholar]
- von Hanwehr, R., M.L. Smith, and B.K. Siesjo. 1986. Extra- and intracellular pH during near-complete forebrain ischemia in the rat. J. Neurochem. 46:331–339. [DOI] [PubMed] [Google Scholar]
- Wang, H.-S., Z. Pang, W. Shi, B.S. Brown, R.S. Wymore, I.S. Cohen, J.E. Dixon, and D. McKinnon. 1998. KCNQ2 and KCNQ3 potassium channel subunits: molecular correlates of the M-channel. Science. 282:1890–1893. [DOI] [PubMed] [Google Scholar]
- Wood, M.J., and S.J. Korn. 2000. Two mechanisms of K+-dependent potentiation in Kv2.1 potassium channels. Biophys. J. 79:2535–2546. [DOI] [PMC free article] [PubMed] [Google Scholar]
- Xia, S., P.A. Lampe, M. Deshmukh, A. Yang, B.S. Brown, S.M. Rothman, E.M. Johnson, Jr., and S.P. Yu. 2002. Multiple channel interactions explain the protection of sympathetic neurons from apoptosis induced by nerve growth factor deprivation. J. Neurosci. 22:114–122. [DOI] [PMC free article] [PubMed] [Google Scholar]
- Xiong, Z.Q., and J.L. Stringer. 2000. Extracellular pH responses in CA1 and the dentate gyrus during electrical stimulation, seizure discharges, and spreading depression. J. Neurophysiol. 83:3519–3524. [DOI] [PubMed] [Google Scholar]
- Yang, W.P., P.C. Levesque, W.A. Little, M.L. Conder, P. Ramakrishnan, M.G. Neubauer, and M.A. Blanar. 1998. Functional expression of two KvLQT1-related potassium channels responsible for an inherited idiopathic epilepsy. J. Biol. Chem. 273:19419–19423. [DOI] [PubMed] [Google Scholar]
- Yellen, G., D. Sodickson, T.Y. Chen, and M.E. Jurman. 1994. An engineered cysteine in the external mouth of a K+ channel allows inactivation to be modulated by metal binding. Biophys. J. 66:1068–1075. [DOI] [PMC free article] [PubMed] [Google Scholar]
- Zagotta, W.N., T. Hoshi, and R.W. Aldrich. 1994. Shaker potassium channel gating. III: Evaluation of kinetic models for activation. J. Gen. Physiol. 103:321–362. [DOI] [PMC free article] [PubMed] [Google Scholar]
- Zhang, S., H.T. Kurata, S.J. Kehl, and D. Fedida. 2003. Rapid induction of P/C-type inactivation is the mechanism for acid-induced K+ current inhibition. J. Gen. Physiol. 121:215–225. [DOI] [PMC free article] [PubMed] [Google Scholar]
- Zhang, J.F., and S.A. Siegelbaum. 1991. Effects of external protons on single cardiac sodium channels from guinea pig ventricular myocytes. J. Gen. Physiol. 98:1065–1083. [DOI] [PMC free article] [PubMed] [Google Scholar]
- Zhou, Y., J.H. Morais-Cabral, A. Kaufman, and R. MacKinnon. 2001. Chemistry of ion coordination and hydration revealed by a K+ channel-Fab complex at 2.0 Å resolution. Nature. 414:43–48. [DOI] [PubMed] [Google Scholar]


