

Abstract
Humans can recognize and navigate in a room when its contents have been rearranged. Rats also adapt rapidly to movements of objects in a familiar environment. We therefore set out to investigate the neural machinery that underlies this capacity by further investigating the place cell–based map of the surroundings found in the rat hippocampus. We recorded from single CA1 pyramidal cells as rats foraged for food in a cylindrical arena (the room) containing a tall barrier (the furniture). Our main finding is a new class of cells that signal proximity to the barrier. If the barrier is fixed in position, these cells appear to be ordinary place cells. When, however, the barrier is moved, their activity moves equally and thereby conveys information about the barrier's position relative to the arena. When the barrier is removed, such cells stop firing, further suggesting they represent the barrier. Finally, if the barrier is put into a different arena where place cell activity is changed beyond recognition (“remapping”), these cells continue to discharge at the barrier. We also saw, in addition to barrier cells and place cells, a small number of cells whose activity seemed to require the barrier to be in a specific place in the environment. We conclude that barrier cells represent the location of the barrier in an environment-specific, place cell framework. The combined place + barrier cell activity thus mimics the current arrangement of the environment in an unexpectedly realistic fashion.
Keywords: hippocampus, spatial navigation, place cell, pyramidal cell, cognitive map
INTRODUCTION
For humans, the ability to recognize and navigate within a room is usually not disturbed by movements, additions, or deletions of furniture and other objects between visits to the room. Similarly, people are generally able to recognize specific objects even when such objects are located in different rooms. How does the brain represent a room and its contents to allow flexible navigation in environments susceptible to unpredictable changes? Can signals related to such high-level cognitive capacities be detected in the discharge of individual nerve cells?
Our purpose in this paper is to show that the layout of a small recording chamber (the “room”) and the whereabouts of a moveable barrier within the chamber (the “furniture”) are in fact represented by the discharge of separate classes of pyramidal cells in the hippocampus of freely moving rats. In agreement with a great deal of previous work, we see that many hippocampal pyramidal cells act as place cells whose characteristic location-specific firing reflects the animal's current position within the chamber (O'Keefe and Dostrovsky, 1971; Muller et al., 1987; Wilson and McNaughton, 1993; for review see Muller, 1996). We see other cells that discharge in relation to the animal's proximity to the barrier regardless of its location in the chamber. Crucially, the same cells continue to discharge in relation to the barrier even when it and the rat are placed in a different chamber where other cells undergo remapping. It appears that the place cell signal and the barrier-related signal can be combined to form a representation of the environment that includes the object's current position. A representation in which neuronal resources are separately allocated to the structure of the chamber and to its contents may permit accurate navigation despite strong variations of sensory information. We also see a small number of cells that are active only when the object is at a certain location in the environment. Cells of this type imply that the representation of the arena and the contained object are not entirely independent.
The experiments described here stem most directly from two earlier studies on how objects inside recording arenas affect hippocampal pyramidal cell activity. In one investigation (Gothard et al., 1996), rats were trained to leave a box, obtain food near a pair of vertical poles and then return to the box that in the mean time had been moved. On each trial the start box, the poles and the end box were at different places in the arena. Three main classes of pyramidal cells were seen: (a) Place cells that discharged in a fixed location in the environment. (b) Box cells, some that were active when the rat was departing to seek food and others that were active when the rat returned to the box to end the trial. (c) Goal cells that fired near the poles indicating food. Box and goal cells were described as firing in spatial frames tied to objects important for the food-seeking task. Of these classes, the goal cells are most similar to the object cells described here; an essential difference is that barrier cells continue to fire in a different environment that causes fundamental changes in the positional firing patterns of cells whose activity is far from the barrier.
The second object experiment (Muller and Kubie, 1987) showed that placing an opaque vertical barrier to bisect the firing field of a place cell strongly suppressed its discharge; a transparent barrier worked equally well. In contrast, when the barrier was away from the firing field, discharge was unchanged even though views of salient stimuli from inside the field were strongly modified. These observations suggest that the effects of a barrier are local to its vicinity but raise important questions: Is a “spatial scotoma” created in the region where the barrier suppresses place cell activity so that the rat can no longer locally compute its position? If no such neglected region is produced, how is the representation modified in the region of the barrier?
To begin to answer these questions, we recorded CA1 pyramidal cells in the presence of a transparent barrier, after the barrier was moved by a small amount, a large amount, removed from the apparatus, or placed in a similar apparatus. In general, pyramidal cells that fired near the barrier in the original condition continued to fire near the barrier when it was moved, ceased firing when the barrier was removed but once again were active while the barrier was in the second apparatus. Cells whose fields were relatively far from the barrier acted as ordinary place cells; their activity was unchanged with barrier movements or removal but greatly altered (remapped) in the second environment. It is therefore our conclusion that the ability to distinguish a bounded region from its contents is directly reflected at the single cell level in the rat hippocampus, which after all may be the locus of a map-like representation of space.
MATERIALS AND METHODS
The general methods are similar to those used in previous work (Muller and Kubie 1987; Fenton et al., 2000). We therefore focus on procedures specific to this study.
Subjects
All animal procedures complied with guidelines for animal experimentation published in the National Institutes of Health publication “Principles of Laboratory Animal Care”. The subjects were eight male Long Evans rats that weighed between 400 and 550 g before surgery during free access to food and water. They were kept in individual cages on a 12:12 h light/dark cycle. The 12 h of light were between 7:00 a.m. and 7:00 p.m. during which all training and electrophysiological recording was done.
Electrode Assembly
Single unit recordings were made with tetrodes (O'Keefe and Recce, 1993). Each tetrode consisted of four 25-μm teflon-insulated nichrome wires twisted to form a stable unit. Four tetrodes were threaded through a 26-gauge stainless steel tube that acted to guide the recording elements into the brain. Each of the external ends of the tetrode wires was attached with silver paint to one pin of a 24 pin Mill-Max connector. The guide tube was soldered to another pin at the middle of the connector to provide mechanical support and act as a ground. The connector plus guide tube assembly was embedded in dental acrylic that formed a tripod that was attached to the rat's skull. Each leg of the tripod consisted of a 2–56 size stainless steel screw whose bottom end was threaded for a small distance into a tapped nylon cuff that formed the skull attachment. By turning the screws into the cuffs the 4 tetrodes could be advanced into the brain. In this simple design, all four tetrodes moved as a unit such that one turn advanced their tips by ∼400 microns.
Electrode Implantation
The electrode assembly was implanted under general pentobarbital anesthesia (45 mg/kg). The rat was placed in a stereotaxic unit, its scalp reflected back and holes drilled in the skull. Three holes were made for screws used to anchor the assembly using dental cement. A fourth hole was drilled to allow the guide tube and electrodes to enter the brain. The actual implantation was done after the dura was cut. The electrode tips were aimed at stereotaxic coordinates −3.8 mm AP, 2.7 mm lateral to bregma, and 1.5 mm below the brain surface so that their initial position was 1.0 mm above the CA1 pyramidal cell layer of the hippocampus. Routine histology confirmed electrode placement for each rat. The animals were allowed at least 1 wk after surgery for recovery. No recordings were attempted until it was possible to firmly grasp the electrode assembly (as is necessary to connect the recording cable) without any emotional display by the rat.
Recording Chamber
The main recording chamber was a 76-cm diameter cylinder with 50-cm walls. The inner surface of the cylinder was gray except for a white cue card that occupied 45° of arc centered at 3:00 o'clock in an overhead view (see Fig. 1) . The floor of the cylinder was gray photographic backdrop paper that was replaced after each recording session. During training (see below) and in the standard recording condition a transparent plexiglas barrier 23.5 cm wide, 33.0 cm high, and 0.5 cm thick was present in the cylinder. This barrier extended from the cylinder center along the 7:30 o'clock radius and was held in place by a 0.5-cm groove in a lead base 23.5 cm long, 1.7 cm high, and 3.7 cm deep.
Figure 1.

Arrangements of the recording chamber plus barrier in the five session types. In all session types, a cue card occupying 45° of arc of the cylinder wall was centered at 3:00. The card was white in the gray cylinder and black in the white cylinder so that in both cases there was a strong contrast between the card and the wall. In “standard” sessions the barrier was put with one end at the center of the gray cylinder along the 7:30 o'clock radius. In 45° sessions the barrier was rotated around the cylinder center to run along either the 6:00 or 9:00 o'clock radius. In 180° sessions the barrier was rotated around the cylinder center to run along the 1:30 o'clock radius. In removal sessions the barrier was not placed into the cylinder. In second environment sessions the barrier was put with one end at the center of the white cylinder running along the 7:30 o'clock radius.
In addition to the main chamber, a second cylinder of identical size was used to test the effects of putting the barrier and the rat into a different environment. The second cylinder was white except for a black cue card that occupied 45° of arc centered at 3:00 o'clock. In this second chamber, the barrier was always present and again ran along the 7:30 o'clock radius from the cylinder center.
In use, the recording cylinder was visually isolated from the 3 by 3 m laboratory room with a gray circular curtain 2.0 m in diameter that extended from the floor nearly to the ceiling. The center of the curtain was in the middle of the laboratory room. Lighting was provided by four 25-W bulbs in reflectors set on the corners of a square 1.0 m on a side. A TV camera 2.2 m overhead pointing down with its optic axis aimed at the cylinder center was used to track the position of a headlight attached to the electrode assembly. The location of the headlight was determined at 60 Hz in a 64 by 64 grid of pixels 2.5 cm on a side.
Situated next to the TV camera were an automatic pellet feeder and a 25-channel commutator. The pellet feeder delivered 25-mg food pellets at a rate of ∼3 per minute. The pellets landed on the cylinder floor where they were retrieved by the hungry rats (see below). The commutator kept the recording cable from kinking during the complex movements by the rats.
Behavioral Training
After recovery from surgery, rats were food deprived to 85% of their initial weight. They were then introduced into the recording chamber with 40 or more 25-mg food pellets on the floor and allowed to forage for 10 min. In general, rats ate all of the available pellets after the second or third training session and thereafter readily visited all parts of the cylinder. Once they moved freely they were introduced without any pellets and the automatic feeder was switched on. Rats rapidly learned to find and eat dropped pellets that could scatter anywhere in the cylinder. Once this behavior was established, the rats spent enough time everywhere in the cylinder to reliably estimate the time-averaged positional firing patterns of place cells.
Cell Screening
After training in the foraging task the recording cable was attached at least once per day to search for single unit activity. If none was seen the electrode assembly was advanced by 30–40 μm and the rat was returned to its home cage for at least 2 h for the electrode tips to relax to a new stable position. Once sufficiently large amplitude unitary activity was resolved the rat was returned to its home cage for several hours. If upon reconnection the same waveforms were present a series of recording sessions was initiated. The recordings were made in session sets such that each session was for a certain constant group of place cells. When the waveforms for a given session could no longer be recognized or all four barrier manipulations were done, the electrodes were moved and if possible another series of recording sessions was done.
Recording Protocol
Five types of recording sessions were done (see Fig. 1). The first session of a series was always a standard session in the gray cylinder with the barrier in the position used during training. One of the other session types was then randomly selected and a second session was done ∼5 min later after changing the floor paper. After the second session, another standard session was done followed by another manipulated session and a final standard session. Thus, in a day at most five sessions were done with standard sessions always alternating with manipulated sessions and with the two manipulated sessions always of a different type.
The next day, if the same waveforms were detected, an additional set of five sessions was run; sessions 1, 3, and 5 were standards. Sessions 2 and 4 were of the types not done the previous day, in random order. If on the second day the waveforms could not be recognized the recording sequence was reset.
In addition to standard sessions the other four types were 45° barrier rotations, barrier translations, barrier removals, and cylinder replacements. In a 45° rotation the outer end of the barrier was put onto either the 6:00 or 9:00 o'clock radius. We saw no differences between these subtypes and treat them as equivalent. In a translation the barrier was slid along its length so that it extended from the cylinder center onto the 1:30 o'clock radius. Note that this rearrangement would also occur if the barrier were rotated by 180° from its original position.
In barrier removal sessions, the barrier was not placed in the cylinder. In cylinder replacement sessions, the white cylinder with black card was substituted for the gray cylinder with white card.
As an additional precaution we randomized the side of the barrier facing the clockwise direction. We saw no differences in otherwise equivalent sessions and do not deal further with this issue.
Data Analysis
Spike sorting.
Because the analogue to digital converter sampling rate was at most 250 KHz we recorded only from the two tetrodes that showed the most single unit activity; each tetrode wire was sampled at 30 KHz. The signals from each wire were filtered with AM Systems amplifiers between 300 Hz and 10 KHz. Sorting of waveforms into clusters was initially done with Spike Sort and Autocut from Datawave and later with an off-line spike analysis program from Plexon. We included in our final analysis only waveforms that generated complex spikes and whose initial phase was at least 300 μs in duration. The datasets included in the results contained between 3 and 17 simultaneously recorded units.
Time, spike, and firing rate arrays.
After spike sorting we counted the number of 1/60-s intervals the rat's head was detected in each pixel and the number of spikes fired by each cell in the corresponding pixels. The spike array for each cell was divided by the time array on a pixel-by-pixel basis to generate a firing rate array. These arrays were numerically analyzed (see below) and visualized as color-coded time, spike, or firing rate maps (e.g., Fig. 2) . In such maps, increasing values of the encoded property were represented in the color order: yellow, orange, red, green, blue, and purple. With this order, intense place cell and “barrier-related” cell activity appeared as dark areas on a yellow background. To emphasize the tight positional confinement of place cell and barrier cell discharge, yellow encodes pixels in which the firing rate was exactly zero. No positional averaging or thresholding was applied to rate distributions or maps.
Figure 2.
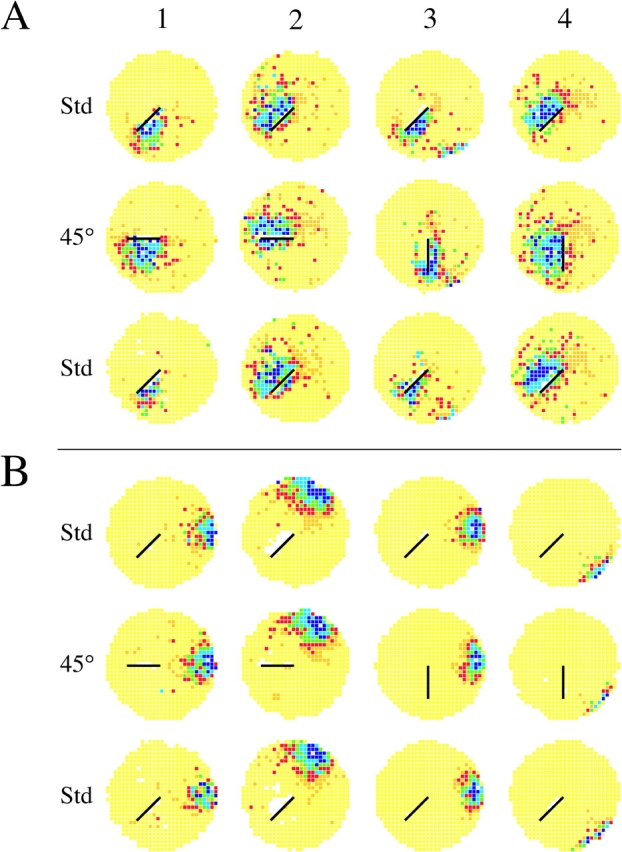
45° barrier rotations. Each colored circle is a firing rate map that shows the time-averaged spatial firing rate distribution of a single hippocampal pyramidal cell recorded for 16 min. Yellow indicates pixels in which the firing rate was exactly zero. Darker colors represent increased rates of activity so that firing fields appear as dark areas on a yellow background. (A) Rate maps for four cells whose fields were near the barrier in the first standard session are shown in the top row. The middle row is for the 45° barrier rotation session. The bottom row is for a second standard session. Cells 1 and 2 were tested with 45° clockwise rotations; cells 3 and 4 with 45° counterclockwise rotations. For each cell the field rotates with the barrier. In some cases, for instance cells 1 and 4, the field expands into the region occupied during the standard session. That the effects of barrier rotation were reversible is shown by the very similar rate maps in the top and bottom rows. The in-field rate (spikes/s) for each cell in the three sessions was: Cell A1 (B11G02P1C4): 4.94, 5.39, 1.32. Cell A2 (B15G10P0C3): 2.50, 1.93, 2.12. Cell A3 (B17G02P1C2:) 3.83, 2.55, 2.96. Cell A4 (B15G08P0C2): 1.98, 3.02, 2.59. (B) Rate maps for four cells whose fields were far from the barrier in the first standard session are in the top row. The middle row is for 45° barrier rotation sessions. The bottom row is for a second standard session. Cells 1 and 2 were tested with 45° clockwise rotations; cells 3 and 4 with 45° counterclockwise rotations. In no case did the field move during the rotation session. The in-field rate (spikes/s) for each cell in the three sessions was: Cell A1 (B11G02P1C1): 5.97, 4.39, 2.70. Cell A2 (B15G02P0C1): 4.31, 4.15, 3.25. Cell A3 (B17G03P0C1): 9.36, 7.18, 5.18. Cell A4 (B11G05P0C1): 3.25, 2.18, 4.92.
Measuring the distance of firing fields from the barrier.
In line with earlier findings (Muller and Kubie, 1987), inspection of firing rate maps revealed that changes in positional firing patterns varied with the distance between the firing field and the barrier. To describe these changes we first calculated the location of the field centroid (Fenton et al., 2000). The coordinates Xc, Yc of the centroid are the means of xi and yi, the X and Y positions of ith pixel in the field weighted by ri, the firing rate in the ith pixel.
 |
 |
A pixel is part of the field if ri > 0 and it shares an edge with at least one other pixel known to be part of the field. The minimum field size is 9 pixels.
Given field location, how can the distance to the extended barrier be obtained?
We used the separation between the centroid and the nearest point on the barrier. To find this distance, the environment is broken up into three sections by constructing the two perpendiculars to the ends of the barrier. If the field centroid is between the ends of the barrier, the distance is the vertical projection of the centroid on the barrier. If the field centroid is outside the ends of the barrier, the distance is the length of the segment from the centroid to the nearer end of the barrier.
Classifying the effects of manipulations on firing fields.
Independent of the distance from a field to the barrier we classified cells according to firing rate changes and positional firing pattern changes. To do this, the positional firing patterns of pyramidal cells were divided into two groups: (a) Cells with a single firing field in the standard condition and a single firing field for any manipulation. (b) Cells that had a firing field in either the standard condition or in a manipulated condition but that were silent in the other session. The separation was done using a “rate change score”:
 |
(1) |
where CS is the change score, S = field rate in standard conditions, and M = field rate in manipulated conditions. Max(S, M) = S if S ≥ M or M otherwise; min(S, M) = S if M ≥ S or M otherwise. If CS < 0.35, the cell was considered to go from active to silent or silent to active and therefore to be a “rate change” cell. Other cells were considered have persistent rates.
RESULTS
Overview
CA1 pyramidal cells were recorded from eight rats that experienced different numbers of session sets depending on the ability to isolate cells. For rats that yielded several sets we saw no serial order effects when barrier manipulations were repeated and did not raise this issue again.
The outcomes of 45° barrier rotations, translations, removals, and placements in a second environment are described separately in the next four sections. The main goal in each case is to show that the distance between a firing field and the position of the barrier in the standard condition largely determines the effects of a manipulation. For rotations, translations, and removals, fields near the barrier underwent clear changes, whereas fields far from the barrier were hardly affected. This situation was reversed with the barrier in the second environment; fields near the barrier tended to be unchanged, whereas fields far from the barrier underwent major changes. The overall conclusion is that the population of CA1 pyramidal cells provides distinct representations of the arena and the barrier, although a few cells did not discharge unless the barrier was in a certain part of the arena.
45° Rotations
A total of 57 pyramidal cells from five of the eight rats were recorded during 14 sequences of standard and 45° barrier rotation sessions. No systematic changes were seen between the preceding and following standard sessions, indicating that changes in positional firing patterns caused by 45° rotation were reversible. Measurements of changes induced by rotation were made by comparison with the preceding standard session. Of the 57 cells, 27 were recorded with the barrier rotated to 6:00 o'clock and 30 with the barrier rotated to 9:00 o'clock. No differences were seen for clockwise and counterclockwise rotations and the results from these two manipulations were therefore combined.
In agreement with the effects of other gentle perturbations of the environment (Fenton et al., 2000; Lenck-Santini et al., 2003), 45° rotations caused a small (18%) but significant decrease of in-field firing rate (rate in standard sessions = 4.08 spikes/s; rate in 45° sessions = 3.34 spikes/s; t55 = −2.89, P = 0.0054). After excluding a silent near cell that became active when the barrier was rotated by 45° (see below), the rate decrease was seen for both far fields (t40 = −2.47, P = 0.0177) and near fields (t12 = −2.67, P = 0.0194). The rate decreases for near and far fields were statistically the same.
Firing rate maps for eight examples of the effects of 45° rotations are shown in Fig. 2. Here, maps for both bracketing standard sessions are shown to demonstrate the reversibility of positional rate patterns, but the following standard session is suppressed in later examples.
Fig. 2 A shows that firing fields <10 cm from barrier tended to rotate in the same direction as the barrier regardless of whether the rotation was clockwise (Fig. 2, A1 and A2) or counterclockwise (Fig. 2, A3 and A4). The near fields are from three different rats, suggesting that corotation of near fields with the barrier occurs in most if not all rats.
Figure 3.

Similarity between standard and 45° rotations session as a function of the shortest distance between the field centroid and the barrier. (A) Null transform. Similarity was calculated by superimposing the standard session on the 45° rotation session. Similarity grows with distance between the field centroid and the barrier. (B) +45° transform. Here similarity is calculated after rotating the standard session firing pattern 45° in the same direction as barrier rotation. Now similarity decreases with distance from the barrier. (C) −45° transform. Similarity is calculated after rotating the standard session firing pattern 45° in the direction opposite barrier rotation. Except for a few outliers at intermediate distances, similarity is quite low at all distances.
In contrast to near fields, the rate maps in Fig. 2 B for fields >10 cm from the barrier indicate that their positions and shapes were hardly affected by 45° barrier rotation. Again, these fields are from three different rats, implying that the invariance of far fields during 45° rotations is a common property of the pyramidal cell representation.
To demonstrate that the examples in Fig. 2 represent trends in the cell sample we showed that near fields tended to rotate by 45° in the direction of the barrier rotation, whereas far fields tended to remain in the same location. We computed three “similarity scores” for each cell based, respectively, on the assumption that a field does not move, that it moves by 45° in the same direction as the barrier rotation, and that it moves by 45° in the opposite direction as the barrier rotation. To measure similarity for the assumption that the fields stay still, a pixel-by-pixel correlation was calculated for each cell when its positional rate distribution for the unmodified standard session (“null transformation”) was superimposed on its positional rate distribution for the 45° rotation session. These similarity scores were plotted in Fig. 3 A against distance from the center of gravity of the field to the barrier, as defined in materials and methods. The overall trend for similarity to increase with field distance from the barrier means that barrier rotation affects near fields more strongly than far fields (correlation between distance and similarity: r = +0.61, df = 55, P < 0.000001).
More information about the 45° barrier rotation effect is seen in Fig. 3 B, where a second similarity score was computed in two steps. First, the positional firing pattern in the preceding standard session was rotated by 45° in the direction of barrier rotation (“+45° transformation”). Second, this transformed pattern was superimposed on the pattern for the rotation session and a pixel-by-pixel correlation was computed. The resulting score measures how well the transformed standard pattern approximates the modified pattern. Similarity between the +45° transformed standard session and the manipulated session decreased with distance between the field and the barrier (r = 0.61, df = 55, P < 0.000001).
To test for specificity, we rotated the pattern in each standard session 45° in the direction opposite the barrier rotation (−45° transformation). The similarities calculated after this transformation are plotted in Fig. 3 C, which shows that except for a few middistance cells whose fields are near the cylinder center the values were small. No correlation between distance and similarity was detected (r = −0.24, df = 55, P = 0.075).
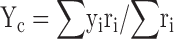
Of the 57 cells recorded during 45° rotations, the fields of 56 underwent at most small changes in the manipulated session. Therefore, for 56 cells the similarity score was high for either the null or +45° transformations; the field was either unchanged or rotated with the barrier. In contrast, the last cell (shown in Fig. 4) had a very different response; it was nearly silent during the standard session but developed a clear field after 45° barrier rotation to 6:00 o'clock. This outcome was the complement of the firing suppression seen after bisecting a field by a barrier (Muller and Kubie, 1987). In fact, the suppression is reproduced when the barrier is returned to 7:30 o'clock during the following standard session (not depicted).
Figure 4.
A rate-change cell with a field that appeared after the barrier was rotated counterclockwise by 45°; moving the barrier uncovered the field of a previously inactive cell. The in-field rate in the rotation session was 5.01 spikes/s.
Since only 1 of 57 cells underwent a major modification of its spatial firing pattern after 45° barrier rotation, this cell could be treated as part of the sample or as a special case without affecting overall conclusions. For other manipulations, however, cells that go from silent to active or active to silent made up an appreciable fraction of the observed cases. To be consistent, we therefore deal with cells that undergo large firing rate changes as a separate category.
Barrier Translations (180° Rotations)
Out of 43 cells recorded from six rats during standard and translation sessions, six were eliminated from further consideration because they had two firing fields in one session or the other. Of the remaining 37 cells, eight “rate-change” cells were treated separately because they were inactive or showed only scattered firing in one session or the other.
The average in-field firing rate of pyramidal cells underwent a 20% decrease from 4.33 spikes/s during standard sessions to 3.46 spikes/s during translation sessions (paired t28 = −2.96, P = 0.006). There was a tendency for near cells to become less active (paired t5 = −1.53; P = 0.137) and a reliable decrease in the rate for far cells (paired t23 = −2.39; P = 0.024). Again, a small perturbation of the environment gives rise to a position-independent decrease of firing rate. The magnitude of the rate decrease was not detectably different for near and far fields.
The effects of barrier translations are exemplified in Fig. 5 A for near fields and Fig. 5 B for far fields. The overall trend visible in Fig. 5 was for near fields to move along with the barrier and for far fields to remain in place. Each example in Fig. 5 A was from a different rat, as was each example in Fig. 5 B, indicating that the two most common responses to barrier translation were not confined to just one or two rats.
Figure 5.

(A) Rate maps in standard (Std) and translation (Trans) sessions for four cells with fields close to the barrier in the standard session. In each case, the field translates with the barrier. For cell 1, the field stretches, leaving behind an active region in the original location. For cell 4, the whole field translates, but the part nearest the cylinder center moves less, once again leaving the impression that it stretches. In-field rates (spikes/s): Cell 1 (B17G02P1C2): 2.96, 2.20. Cell 2 (B19G03P1C4): 3.10, 3.60. Cell 3 (B15G09P0C2): 4.24, 4.28. Cell 4 (B18G01P0C1): 9.82, 5.16. (B) Rate maps in standard (Std) and translation (Trans) sessions for four cells with fields away from the barrier in the standard session. In each case, the field remains fixed in the environment after barrier movement. In-field rates (spikes/s): Cell 1 (B11G03P0C2): 5.91, 4.36. Cell 2 (B17G02P1C1): 4.57, 3.62. Cell 3 (B16G01P0C1): 6.39, 7.46. Cell 4 (B19G03P0C4): 2.02, 2.07.
In addition to the strong tendency of near fields to follow the barrier translation, a second and remarkable phenomenon is visible in Fig. 5, A1–A3. In each of these cases, the field stayed on the same side of the barrier as in the standard session. In other words, if it is imagined the field is attached to the barrier, then these outcomes would be seen if the barrier were slid by its length along the 7:30 to 1:30 diameter and not if the barrier were rotated by 180° around its end at the center of the cylinder. The same result was seen for three other cells whose field ran along one side of the barrier and we saw no instance of a field that moved as if the barrier had been rotated. It is on this basis that we consider the manipulation to be a translation rather than a rotation of the barrier. We also asked if a feature peculiar to one side of the barrier acted as a trigger by rotating the barrier 180° around its middle while leaving it in the standard position. On no occasion did this manipulation affect field position.
The similarity versus distance scattergrams in Fig. 6 suggest that the examples in Fig. 5 reflect the responses of the cell sample to barrier translations. The similarities in Fig. 6 A are for the null transformation. The tendency of similarity to increase with distance between the field center and the barrier indicates that barrier translation has mainly local effects (r = 0.64, df = 28, P = 0.0014). The similarities in Fig. 6 B were computed after the firing pattern in the standard session was translated by the length of the barrier along the 7:30 to 1:30 diameter such that only pixels common to both the original and translated barrier locations were considered. In this case, there is a strong trend for the similarity to decrease with increasing field-to-barrier distance, as if near fields translate along with the barrier (r = −0.52, df = 28, P = 0.003). In contrast, except for two near cells, rotating the standard session firing pattern by 180° before computing similarity results in uniformly low values. The basis for the relatively high similarity (0.175) of the field at 1.5 cm is visible in the rate maps of Fig. 5 A1 where some discharge was seen on both sides of the barrier, although it was considerably stronger on one side. This asymmetry was reflected in the fact that similarity after translation was twice as great (0.350) as similarity after 180° rotation. The highest similarity after 180° rotation was for a rather large field close to the cylinder center where no rotation would much affect its configuration.
Figure 6.

Similarity between standard and translation session as a function of the shortest distance between the field centroid and the barrier. (A) Null transform. Similarity grows with distance between the field centroid and the barrier. (B) Translation transform. Similarity was calculated after sliding the standard session firing pattern along the 7:30 to 1:30 diameter to imitate barrier translation. Here, similarity decreases with distance from the barrier. (C) 180° transform. Similarity was calculated after rotating the standard session firing pattern 180°. Similarity is low at all distances.
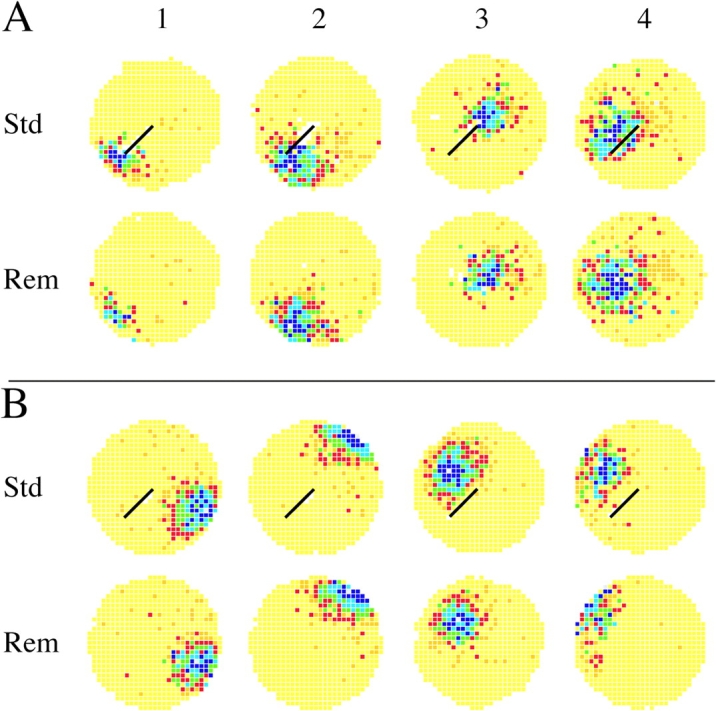
In addition to fields that were either stationary or that moved with the barrier after translation, eight rate-change cells had a robust field in only one type of session and were nearly silent or showed dispersed firing in the other type. For four cells, barrier translation either “uncovered” a previously silent field at the original barrier location (two cases) or suppressed a previously active cell at the new barrier location (two cases; cell 1 in Fig. 7) ; cells of this type are similar to the example in Fig. 4. The discharge in the fields of the other four cells seemed to require the barrier to be at a certain location in the environment, as if stimuli from the barrier and the cylinder had to summate. In one case, translating the barrier caused in-field firing to slow quite considerably but the remaining discharge was in the original location (Fig. 7, cell 2). In a clearer example, barrier translation seemed to induce a new field at the new position (Fig. 7, cell 3).
Figure 7.

Examples of rate-change cells after barrier translation. For the first cell, the new barrier position bisected the original field position and firing was suppressed. Cell 2 apparently required the barrier to be in its original position for robust firing. Cell 3 developed a new firing field after barrier translation, as if the conjunction of the object and the object position were necessary to support firing. Cell 1 (B17G02P1C5): 1.32, 0.00. Cell 2 (B17G03P0C3): 3.89, 1.30. Cell 3 (B19G03P0C2): 0.00, 4.12.
In sum, the translation manipulation revealed four classes of pyramidal cells: (a) Ordinary place cells whose fields appeared to be invariant to barrier location. Fields far from the barrier were generally unchanged after barrier translation. Some fields along the cylinder wall near the outer end of the barrier also were unaffected. (b) Place cells whose fields were either suppressed or revealed by barrier translation. (c) Barrier-attached cells whose activity relative to the barrier was independent of the barrier location. (d) A few “conjunction cells” that were active near the barrier only when it was in one position or the other. In no case, however, did we see a field away from the barrier whose activity required a certain barrier placement.
Barrier Removals
A total of 71 cells in six rats were recorded in standard sessions and after barrier removal. Five cells had two firing fields in at least one session and were eliminated from the sample. Of the remaining 66 cells, 13 were “rate change” cells that were inactive in one session or another and were treated differently than the main sample.
After removing the barrier, the in-field firing rate of the main sample underwent a significant decrease by 20% from 4.49 to 3.59 spikes/s (paired t52 = −4.498, P = 3.87 × 10⁻⁵). The decrease was also significant for 9 near cells (paired t8 = 3.153, P = 0.01354) and for the remaining 44 far cells (t43 = 5.035, P = 0.00101). The rate decrease was not distinguishable for near and far fields and was therefore position independent after barrier removal.
Examples of firing rate maps for barrier removal effects on near cells are shown in Fig. 8 A. After separating cells that were nearly silent in either the standard or the removal session, the selected examples (from three rats) were for the four fields closest to the barrier. It is striking that in each case the field was quite unchanged in the presence or absence of the barrier. The same lack of change after barrier removal is also seen for far cells, as shown by the examples from three rats in Fig. 8 B. Thus, for cells active in both the standard and removal sessions, spatial firing patterns appeared to be constant, independent of the distance from the field to the barrier.
Figure 8.
The effects of barrier removal on cells with fields in the presence and absence of the barrier. (A) Rate maps in standard (Std) and barrier removal (Rem) sessions for four cells with fields close to the barrier in the standard session. In each case, the field is unchanged, as if it fires in relation to the cylinder despite the proximity of the field to the barrier. In-field rates (spikes/s): Cell 1 (B15G06P0C2): 7.73, 3.84. Cell 2 (B11G01P1C5): 7.45, 3.47. Cell 3 (B18G01P0C1): 4.50, 3.60. Cell 4 (B15G10P0C3): 2.12, 1.47. (B) Rate maps in standard (Std) and barrier removal (Rem) sessions for four cells with fields away from the barrier in the standard session. In each case, the field remains fixed in the environment after barrier movement. In-field rates (spikes/s): Cell 1 (B11G02P0C3): 5.16, 3.50. Cell 2 (B11G02P1C5): 5.62, 5.17. Cell 3 (B16G01P0C1): 8.44, 4.46. Cell 4 (B17G04P0C2): 3.82, 2.74.
This impression is reinforced by the scattergram in Fig. 9 A, which shows that similarity scores for the null transform were uniformly quite high regardless of the separation between the field and the barrier (r = 0.06, df = 49, P = 0.67). It should be noticed, however, that the smallest distance is 4.5 cm; fields closer to the barrier are inactive in one session or the other.
Figure 9.

Similarity between standard and removal sessions as a function of the shortest distance between the field centroid and the barrier. Null transform. For cells with fields in both cylinders, similarity is high regardless of the distance between the field centroid and the barrier.
Examples of the 13 cells for which the firing intensity changed strongly between standard and removal conditions are shown in Fig. 10 . Five cells, one of which is shown in Fig. 10 (cell 1), went from silent to active. The remaining nine cells went from active to nearly inactive, an effect illustrated in Fig. 10 (cells 2, 3, and 4) where the order is from small change to large.
Figure 10.

Examples of rate-change cells after barrier removal. The first cell was silent in the standard conditions and developed a field in the original barrier location after removal. Cells 2, 3, and 4 had clear fields in the standard session but their intensity diminished greatly after barrier removal. Fields of this kind may represent the barrier. Cell 1 (B17G04P0C1): 0.00, 8.21. Cell 2 (B11G02P1C4): 5.28, 1.74. Cell 3 (B17G03P0C3): 4.82, 0.00. Cell 4 (B19G03P1C2): 4.26, 0.00.
Are rate-change cells distinct in another way? By inspection, it appears that their firing fields tended to be near the barrier. This impression was corroborated by an unequal-variance t test of the distance from field to the barrier. For rate-change cells, the mean distance was 7.49 cm, whereas for ordinary cells the mean distance was 20.43 cm; the probability the means were equal is extremely small (t64 = 7.46, P = 3.22 × 10⁻⁹). Thus, cells whose fields were near the barrier were much more likely to be strongly affected by its removal.
The five cells that underwent large rate increases after removal are additional examples in which the field was suppressed by the barrier. Cells of this type may represent the cylinder since they were active only when a region of the floor was freed of a competing influence. In contrast, the eight cells whose activity dramatically weakened when the barrier was removed may represent the barrier itself since their activity required its presence. This possibility is explored further below.
Second Environment
When several cells are recorded together in the gray cylinder + white cue card and then in a white cylinder + black cue card, “remapping” occurs such that one of three outcomes is seen for each cell (Kentros et al., 1998): (a) Some cells have a field in the gray cylinder but are silent in the white cylinder; (b) some cells have a field in the white cylinder but are silent in the gray cylinder; and (c) some cells have fields in both cylinders, but the location, size, shape, and intensity of the fields change dramatically so that the fields appear unrelated in the two cylinders. (Note that if the field location changes randomly for cells that are active in both environments, a small fraction of the cells may have congruent fields.) To better understand both remapping and the way in which the barrier is represented we recorded standard sessions in the gray cylinder and “second environment” sessions in a white cylinder; in both cases the barrier was at the same place relative to the cue card.
A total of 49 cells from six rats were recorded in the original cylinder and in a white cylinder + black cue card. Two cells had two fields and were eliminated from further consideration. Of the 47 remaining cells, 22 had fields in both environments, making it possible to compare firing rates and to ask about firing pattern similarity. The remaining 25 satisfied the rate-change criterion and are treated later.
For cells with fields in both cylinders, exposure to the second environment caused a very small, nonsignificant rate increase from 3.94 to 3.97 spikes/s (paired t21 = 0.072, P = 0.934). Thus, in contrast to the other manipulations, the average rate of cells with fields in both cylinders was unaffected while recording in the second one. In short, perturbing a fixed environment caused decreases because of mismatches between expectation and observation, whereas recording in a different environment did not affect rates.
The spatial firing patterns of individual cells with fields in both cylinders are exemplified in Fig. 11 . Four near cells from three rats (Fig. 11 A) had very similar firing fields in both cylinders. In cases where firing was confined mainly to one side of the barrier in one cylinder it was confined to the same side in the other cylinder. In contrast, for four far cells from four rats (Fig. 11 B), the firing fields in the two cylinders appeared unrelated. Thus two-field far cells acted as if a remapping had occurred whereas two-field near cells acted as if they responded to the barrier.
Figure 11.

The effects of putting the barrier into a second cylinder on cells with fields in both cylinders. (A) Rate maps in standard (Std) and second cylinder (Sec) sessions for four cells with fields close to the barrier in the standard session. In each case, the field was unchanged, as if the cell fired in relation to the barrier. In-field rates (spikes/s): Cell 1 (B15G08P0C2): 2.59, 5.33. Cell 2 (B17G02P1C2): 4.20, 2.68. Cell 3 (B19G03P0C1): 3.82, 7.86. Cell 4 (B11G04P1C3): 4.31, 2.18. (B) Rate maps in standard (Std) and second cylinder (Sec) sessions for four cells with fields away from the barrier in the standard session. In each case, the field remapped; its location was different than in the standard session. In-field rates (spikes/s): Cell 1 (B15G02P0C3): 5.91, 4.36. Cell 2 (B16G01P0C1): 6.32, 3.57. Cell 3 (B15G04P0C3): 4.20, 7.99. Cell 4 (B22G01P0C2): 5.82, 7.70.
How firing fields in the second cylinder depended on the distance between the barrier and the field in the first cylinder is summarized in the scattergram of Fig. 12 A where similarity after the null transformation is plotted against distance. In contrast to the increased similarity with distance after the null transformation for 45° rotations and translations and the invariance of fields after barrier removal, similarity decreased with distance in the second cylinder (r = −0.55, df = 20, P = 0.009).
Figure 12.

Similarity for cells with fields in the original and second cylinders as a function of the shortest distance between the field centroid and the barrier in the original cylinder. Null transform. There is a strong trend for similarity to decrease with the distance between the field centroid and the barrier.
In addition to cells active in both environments a somewhat larger number of cells were active in only the original or the second cylinder. These cells are examples of the other two kinds of remapping event in which an active cell shuts off or a silent cell begins to fire. Of the 25 rate-change cells, 20 went from active to silent and 5 went from silent to active. Reflecting this proportion, four active→silent and one silent→active cells are shown as examples in Fig. 13 . Two of the active→silent cells (Fig. 13, cells 1 and 2) were selected to show that fields near the barrier can undergo remapping.
Figure 13.

Examples of rate-change cells recorded in the two cylinders. Cells 1 and 2 have fields near the barrier but undergo a form of remapping, as if they represent the cylinder despite their proximity to the barrier. Cells 3 and 4 are more typical; their fields are far from the barrier in the original cylinder and become silent in the second cylinder. Cell 5 is an example of cell that was silent in the original cylinder but become active in the second cylinder. Note that the field it develops is near the barrier. Cell 1 (B11G06P1C2): 3.40, 0.00. Cell 2 (B22G01P0C3): 4.83, 0.00. Cell 3 (B17G02P1C1): 4.25, 0.00. Cell 4 (B15G06P1C2): 8.57, 0.00. Cell 5 (B11G06P1C4): 0.00, 8.09.
Responses of Cell Sets to the Manipulations
Up to now we have presented each manipulation as if it were a separate experiment. Often, however, a cell set was recorded during several manipulations and in a several cases it was followed for the entire 10 session, 2 d protocol. Data of this kind are extremely valuable since they allow us to see if the change caused by one manipulation predicts changes caused by others. Sequential results allow us, in other words, to see if individual cells have a consistent style that accounts for effects produced by each manipulation. In addition to sequential recordings, parallel recordings of many cells yield a picture of how the pyramidal cell population represents the state of the animal's surroundings.
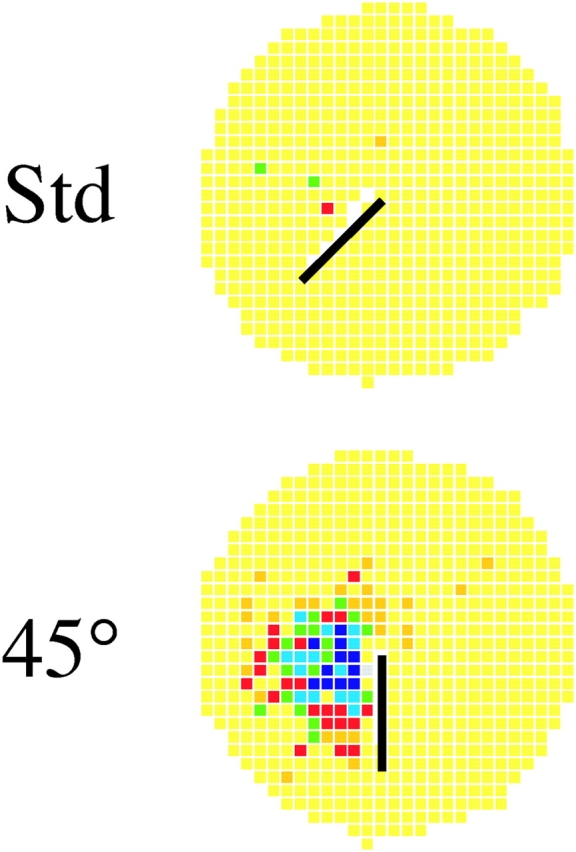
In the best example of sequential, parallel recordings, all four manipulations were done with 17 cells. Of these, four fired only sporadically in most or all of the 10 sessions, one stopped firing or was lost in the last several session, and three had two fields in one or both cylinders. The remaining nine cells are shown in Fig. 14 and Table I in the following order: Cells 1–4 had far fields in the first standard session, cell 5 was silent in the first standard session, and cells 6–9 had near fields in the first standard session. The session sequence is shown in the order: standard, 45° (9:00 o'clock), removal, translation, second environment, standard. The second standard session is the last standard session on day 2 of the sequence; intermediate standard sessions are suppressed since they resemble the first standard session as closely as does the last standard session.
Figure 14.

Simultaneous recording of nine cells during each of the manipulations. These cells were followed for the entire protocol of five sessions on the first day and five sessions on the second day. Only the initial standard session on day 1 and the final standard session on day 2 are shown since these are sufficient to demonstrate stability. Sessions shown from the top down are: standard, 45° clockwise rotation, removal, translation, second cylinder, standard. Cells 1–4 are ordinary place cells whose fields are unchanged under all circumstances except in the second cylinder where they undergo remapping. Cell 5 develops a field only with the large barrier movement associated with translation or during barrier removal. Cells 6–9 are barrier attached; their fields are near the barrier, follow the 45° rotation if the field is away from the cylinder center (cells 8 and 9), stop firing after removal, follow the barrier during translation, and persist in the second cylinder, although the persistence for cell 9 is barely detectable. In-field firing rates for sessions are given in Table I.
TABLE I.
Firing Rates of Nine Simultaneously Recorded Cells in Each of the Experimental Conditions
| Cell number | |||||||||
|---|---|---|---|---|---|---|---|---|---|
| Manipulation | 1 | 2 | 3 | 4 | 5 | 6 | 7 | 8 | 9 |
| Standard | 3.09 | 3.10 | 2.81 | 3.86 | 0.00 | 3.56 | 5.09 | 3.80 | 4.26 |
| 45°-rotation | 3.77 | 3.61 | 4.96 | 3.13 | 0.00 | 2.71 | 2.88 | 1.45 | 2.37 |
| Removal | 2.72 | 2.53 | 2.89 | 3.30 | 2.16 | 0.00 | 0.00 | 0.00 | 0.00 |
| Translation | 2.01 | 2.07 | 3.41 | 1.23 | 4.12 | 1.15 | 7.02 | 3.60 | 0.00 |
| Second | 0.00 | 3.08 | 2.06 | 2.05 | 0.85 | 1.44 | 7.86 | 3.85 | 0.00 |
| Standard | 1.84 | 2.24 | 1.96 | 2.31 | 0.00 | 2.25 | 4.16 | 2.87 | 2.76 |
The infield firing rates (spikes/s) are for the rate maps of Fig. 14.
The first four cells are ordinary place cells. Their firing is unchanged in the 45° rotation, translation, and removal sessions; they continue to fire as the barrier is moved around. Presumably their activity would be same in the original cylinder so long as the barrier does not encroach on the firing field. On the other hand, when the barrier is put in the second cylinder they undergo remapping; cell 1 shuts down, whereas cells 2–4 develop new fields. The cross-session response profile therefore suggests that cells 1–4 represent the cylinder. Note also the precision with which the last standard session recapitulates the first standard session despite an interval of 30 h.
Cell 5 is silent in the standard cylinder but gains a field after the barrier is removed or translated. From the removal session, this cell represents a certain place in the cylinder as long as the barrier is not in its standard or 45°CW position. Barrier translation uncovers the firing field although it is unclear why the field moves toward the barrier. Additional work could determine the range of barrier locations for which the cell would discharge. It is also unclear if the silence in the second environment means that the cell has remapped or if the standard position of the barrier suppresses firing in both cylinders. Nevertheless, the cross-session firing profile strongly implies that this is a cylinder cell.
Cells 6–9 have near fields in the original cylinder. The fields of cells 6 and 9 rotate with the barrier during the 45° session but the central location of the fields for cells 7 and 8 makes their responses indeterminate. In each case, the cell stops firing when the barrier is removed, as if activity depends on the barrier's presence. The fields of cells 6–9 move along with the barrier in the translation session although the activity of cell 9 is weaker. Crucially, these cells also fire in the second cylinder, as if they recognize the barrier even after a remapping for the place cells. Cell 9 is once again a special case since its firing is very weak during the second cylinder session. The last four cells in Fig. 14 are therefore considered barrier attached cells—they represent the object, regardless of whether the true place cells are in their gray cylinder or white cylinder configuration. In addition to the four cells just mentioned in Fig. 14 we saw three additional cells whose cross-session firing profile suggests they are barrier attached.
DISCUSSION
Using rats trained to find and eat food pellets inside a cylinder fitted with a white cue card and a tall, transparent vertical barrier we recorded hippocampal CA1 pyramidal cells in the original environment and after it was modified in four ways. (a) When the barrier was rotated by 45°, firing fields near the barrier tended to rotate by the same amount whereas fields far from the barrier tended to remain stationary. (b) When the barrier was translated by its length along a diameter, many fields near the original barrier position translated with the barrier. Barrier translation also caused new cells to fire in the original barrier location and suppressed firing at the new barrier location. A few cells whose fields were near but not at the original barrier location stopped firing, as if they required input from both the barrier and the cylinder. (c) When the barrier was removed from the cylinder, cells whose firing rate was stable did not undergo changes in field position regardless of their distance from the barrier. In contrast, rate-change cells that went from active to silent or from silent to active showed a very strong tendency to be concentrated near the barrier. Cells whose fields shutdown presumably represent the barrier, whereas cells that became active presumably represent the cylinder. (d) When the barrier was put into a second environment known to cause rapid remapping (Kentros et al., 1998), some cells had a field in each environment. Of these, if their fields were near the barrier in the first environment they continued to fire near the barrier in the second environment. In contrast, if their fields were far from the barrier in the first environment the field in the second environment tended to be altered in position, size, shape, and intensity, one of the three “styles” of remapping. Rate-change cells with fields in only one environment usually had fields far from the barrier and either shutdown or began to discharge, the other two recognized styles of the remapping process.
Beyond selective changes in field position we noted two other effects of barrier manipulations. First, the rat hippocampus appears to resolve as a translation the ambiguous motion that takes the barrier from its standard position to lie along the 1:30 o'clock radius. Additional work could reveal the threshold that separates rotations from translations. Nevertheless, it is fascinating that the processing of information before and in the hippocampus dictates how the barrier is to be represented. This sort of choice is another indication that the hippocampus participates in perceptual and not merely sensory processes (Rotenberg and Muller, 1997).
The second interesting aspect of changing the environment is the decreased pyramidal cell firing during 45° rotations, translations, and removals. This decrease cannot be due entirely to fatigue since the rate recovers in a standard session after the manipulated session. Moreover, the rate does not decrease after remapping in a second cylinder. These observations suggest that rate decreases occur when the current and remembered appearance of an environment fail to match (Fenton et al., 2000). Such decreases are compatible with models in which the activity of each cell is the summed product of stored synaptic weights, times, and inputs that depend on the current cue configuration. The fact that rates decrease regardless of distance of the field from the barrier may mean that each cell is influenced by both the cylinder and the barrier. Thus, in the current circumstances, the separation of control by the two main stimulus components is much stronger than in “double rotation” experiments (Shapiro et al., 1997), but is not absolute.
What would happen with further exposures of a rat to one of the manipulated conditions? So far as we can tell, the network returns to its initial state whenever the rat is returned to the original environment. Repeated exposure to, say, barrier translation might, however, lead to an adjustment of synaptic weights such that field rates would decrease if the rat were eventually returned to the original circumstance. Alternatively, remapping might occur, either all at once (Hill, 1978; Wilson and McNaughton, 1993; Kentros et al., 1998), with an animal-specific time course (Bostock et al., 1991), or slowly and piecemeal (Sharp et al., 1995; Shapiro et al., 1997; Lever et al., 2002).
Kinds of Pyramidal Cells
The response of cells to barrier manipulations depends strongly on the distance from the barrier to the firing field in the standard condition. Thus, in the original cylinder, near fields are modified by barrier manipulations, whereas far fields are stable. In contrast, in the second cylinder, near fields are stable but far fields undergo remapping. For the most part, these regularities hold across all the barrier manipulations; far cells and near cells behave differently but the responses of each class are consistent. A third class of cells, reminiscent of the conjunction cells reported by Shapiro et al. (1997) is discussed below.
How do object cells compare with cell types reported earlier? According to O'Keefe and Nadel (1978), place cells fire only in a certain location in the environment but “misplace cells” fire in a location only if some other condition obtains. Object cells are therefore not misplace cells since they fire whenever the barrier is present, regardless of its location. Note, however, that several cells recorded during barrier translation acted as misplace cells; they were active with the barrier in its original position but stopped firing after a large movement. Such conjunction cells resemble cells that require proximal and distal stimuli to be in register during double rotations (Shapiro et al., 1997; see also Wood et al., 1999).
Why did we see few cells whose firing depends on the barrier being in a certain location compared with results from experiments in which proximal and distal stimuli are put into conflict by counter-rotation? A reasonable speculation is that the barrier and the cylinder are more easily separated by sensory and perceptual processes that supply information to the hippocampus than are sets of proximal and distal marker stimuli that are originally in register. In this view, the ability to detect barrier-attached cells and their constant response in a second environment is a direct reflection of the strong distinction between the barrier and the apparatus.
Barrier cells are also reminiscent cells of cells recorded during goal seeking behavior (Gothard et al., 1996; Hollup et al., 2001). In contrast to previous studies, however, the fields of barrier cells persisted in a second environment that caused remapping of far cells, showing their ability to encode the object independent of the surroundings. Note also that barrier cells were found even though we used no explicit goal nor required any spatial problem solving. This is in contrast to the post-goal cells of Gothard et al. (1996) and the platform-goal cells of Hollup et al. (2001). It is also very different from the start-box and finish-box cells of Gothard et al. (1996) since these cells required the rat to be inside the box. Finally, the barrier cells were seen even though the object had no significant motivational or task significance for the rat, in contrast to goal and box cells.
We therefore infer that there are (at least) two kinds of hippocampal pyramidal cells, namely place cells and object cells (exemplified, respectively, by cells 1–4 and cells 6–9 in Fig. 14). We think that the coexistence of these types provides a substrate for animals to properly navigate in a familiar environment in which moveable objects are displaced and in a second familiar environment in which an object encountered first in a different context appears. The place cells provide a stationary, environment-specific framework, whereas the object cells signal the location of the barrier relative to the framework.
The finding of barrier cells is contrary to our previous report that objects near the center of a cylinder barely influence firing field locations (Cressant et al., 1997). We note, however, that the barrier used here is structurally very different than the slender objects used in the previous work. Specifically, the barrier has a much stronger influence on the kinematically possible paths for the animal and therefore may be represented in a very different way. Another possibility concerns the presence of a cue card from the beginning of the present experiment. The card may provide a stable spatial cue (Knierim et al., 1995) that is useful as a reference for the barrier. The preexposure of the rat to reliable spatial information provided by both the card and the barrier before any manipulations could cause the barrier to become a good predictor of spatial location and to thus acquire the ability to exert cue control over nearby fields.
Direct support for the two classes of pyramidal cells identified here comes from a current investigation into the relationship between place cells and reexploration induced by rearranging objects (Lenck-Santini et al., 2003). Prior work (Save et al., 1992) found that hippocampal lesions do not affect reexploration induced by substituting a novel object for a familiar one. On the other hand, reexploration induced by movement of familiar objects was strongly attenuated. When pyramidal cell recordings were made during object substitution their activity was unchanged even though reexploration was induced. On the other hand, recordings made during object repositioning revealed major changes in the activity of some pyramidal cells during reexploration. The key is that the affected cells had firing fields near the objects, whereas far fields were invariant fixed (Lenck-Santini et al., 2003), in full agreement with our present work. This result is also compatible with the work of Cressant et al. (1997) since object rotations caused unpredictable changes nearby fields.
Are Barrier and Cylinder Cells Fixed Classes?
We have explored only a tiny fraction of the parameter space that would be needed to fully characterize how hippocampal pyramidal cells represent behaviorally interesting variables such as environmental geometry, decor, contents events and so on. With this limitation in mind, it is our strong impression that most of the recorded cells maintain their characteristics over the range of manipulations used; they are either cylinder or barrier cells and the main feature to which they are tuned does not change. The fixed properties of the preponderance of cells means that the two classes can act together in coordinated ways, an issue discussed in the next section.
There are at least two ways in which a cell's properties could depart from this simple picture. In the first, the cell does not behave in the expected way in all manipulations; an example is the ninth cell in Fig. 14. The second departure would be for a cell to be simultaneously controlled by combined inputs from the barrier and the cylinder and in fact we saw a few such cells (e.g., cell 3 in Fig. 7). Additional work will be necessary to determine if cells in either of these categories are stable and common enough to warrant incorporation into models of hippocampal function.
An interesting, available approach to classifying hippocampal pyramidal cells is provided by the “boundary vector model” (Hartley et al., 2000). In this model, each place cell is driven by the summed input from several hypothetical “boundary vector cells”, each of which is activated according to the rat's distance from a delimited segment of the environment boundary. In the original model, the boundary vector cells that converge on a place cell are chosen randomly and are then fixed, allowing predictions of field transforms produced by environmental manipulations. If this picture is expanded to include the barrier as an additional boundary, it would be possible to distinguish two very different cases. In one, boundary vector cells are chosen randomly from cells tuned to the cylinder wall and the barrier. In the other case, boundary vector cells are grouped according to whether they are responsive to the cylinder wall or to the barrier. By performing the simulation with these two different starting assumptions it might be possible to see if the features that drive place cells are arbitrary subsets of available features, as suggested from double rotation experiments (e.g., Shapiro et al., 1997) or if preprocessing in structures afferent to the hippocampus ensures that features that drive a given place cell are derived from unitary objects. Our results lead us to believe that good fits using the boundary vector model will be considerably easier to generate on the assumption that object features relayed to a given pyramidal cell are derived from related and not random boundaries.
How Does the Whole Representation Behave?
In the standard condition, a characteristic set of cells discharge at each position in the environment. After each manipulation firing fields remain constant, move, appear, or disappear. How do these changes look across the entire pyramidal cell population? Using the notion of a chart in which fields are laid out according to their position in the environment and not according to the position of their cells in the brain (Samsonovich and McNaughton, 1997), a cartoon of the layout of firing fields in the standard condition is shown in Fig. 15 A. In Fig. 15 A and the other parts of Fig. 15, the semitransparent ellipses and crescents indicate that firing fields overlap to cover the surface of the environment. In the standard condition, after 45° rotation, translation and barrier removal, light blue is used to indicate fields that represent the barrier and red is used to indicate barrier-attached cells. Dark blue shows fields whose fields appear when the barrier is removed from their vicinity and yellow fields that are suppressed when the barrier moves to their position. Finally, gray is used to represent the remapped fields in the second environment. Using this color scheme, cartoons of the environment and the arrangement of firing fields after each manipulation are shown in Fig. 15, B–E. What is remarkable is that the observed outcome for each manipulation accurately mimics the rearrangement of the environment: the CA1 pyramidal cell population realistically represents the environment.
Figure 15.
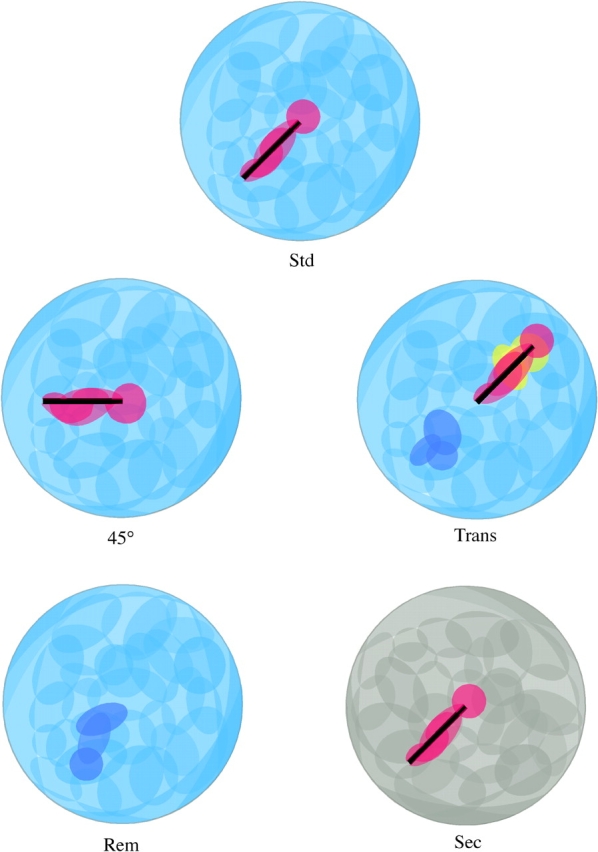
Cartoon representation of firing fields for multiple simultaneous pyramidal cell activity in the five conditions. The fields for all of the cells have been arranged according to their position in the environment in the standard condition. The figure emphasizes the isometry between the layout of the environment and population pyramidal cell activity. Light blue represents place cell firing fields in the original cylinder, dark blue represents new firing fields, red represents object cell firing fields, yellow represents fields suppressed by the barrier, and gray represents place cell fields in the second environment.
We are therefore led to ask how pyramidal cells turn on and off in just the right ways to mimic the layout of the manipulated environment. We think that the required information has two components, namely, signals from entorhinal cortex and the activity of the network of hippocampal interneurons. In particular, we imagine that “detaching” and “reattaching” the barrier representation from the cylinder representation involves the coordinated discharge of interneuron classes whose identities are currently unknown. In this view, interneuron discharge has a dynamic component that varies as the rat moves inside the cylinder and a static component that reflects the layout of the environment. These functions may be subserved by different types of interneurons or by complex modulations of the temporal firing of a more homogeneous network. In any case, it is essential to begin to classify the various interneuronal types during behavior according to their waveforms and firing patterns with an eye to determining their anatomical identities. Efforts along these lines will complement the excellent work by Klausberger et al. (2003) on establishing interneuron identity with juxtacellular staining methods and discharge correlates during sleep stages.
In conclusion, we think that object cells may represent the location of relatively fixed obstacles in a space represented by place cells. That the representational method used by rats may share many features with the method used by humans is in line with recent results on the discharge properties of cells in the human hippocampus recorded during virtual navigation (Ekstrom et al., 2003).
Acknowledgments
We thank Dr. Emerson Hawley for excellent support.
The work presented here was supported by NIH grant NS 20464 and an MRC Overseas Initiative Grant to R.U. Muller. CNRS support to B. Poucet.
Angus C. Nairn served as editor.
References
- Bostock, E., R.U. Muller, and J.L. Kubie. 1991. Experience-dependent modifications of hippocampal place cell firing. Hippocampus. 1:193–206. [DOI] [PubMed] [Google Scholar]
- Cressant, A., R.U. Muller, and B. Poucet. 1997. Failure of centrally placed objects to control the firing fields of hippocampal place cells. J. Neurosci. 17:2531–2542. [DOI] [PMC free article] [PubMed] [Google Scholar]
- Ekstrom, A.D., M.J. Kahana, J.B. Caplan, T.A. Fields, E.A. Isham, E.L. Newman, and I. Fried. 2003. Cellular networks underlying human spatial navigation. Nature. 425:184–187. [DOI] [PubMed] [Google Scholar]
- Fenton, A.A., G. Csizmadia, and R.U. Muller. 2000. Conjoint control of hippocampal place cell firing by two visual stimuli. I. The effects of moving the stimuli on firing field positions. J. Gen. Physiol. 116:191–209. [DOI] [PMC free article] [PubMed] [Google Scholar]
- Gothard, K.M., W.E. Skaggs, K.M. Moore, and B.L. McNaughton. 1996. Binding of hippocampal CA1 neural activity to multiple reference frames in a landmark-based navigation task. J. Neurosci. 16:823–835. [DOI] [PMC free article] [PubMed] [Google Scholar]
- Hartley, T., N. Burgess, C. Lever, F. Cacucci, and J. O'Keefe. 2000. Modeling place fields in terms of the cortical inputs to the hippocampus. Hippocampus. 10:369–379. [DOI] [PubMed] [Google Scholar]
- Hill, A.J. 1978. First occurrence of hippocampal spatial firing in a new environment. Exp. Neurol. 62:282–297. [DOI] [PubMed] [Google Scholar]
- Hollup, S.A., S. Molden, J.G. Donnett, M.B. Moser, and E.I. Moser. 2001. Accumulation of hippocampal place fields at the goal location in an annular watermaze task. J. Neurosci. 21:1635–1644. [DOI] [PMC free article] [PubMed] [Google Scholar]
- Kentros, C., E. Hargreaves, R.D. Hawkins, E.R. Kandel, M. Shapiro, and R.V. Muller. 1998. Abolition of long-term stability of new hippocampal place cell maps by NMDA receptor blockade. Science. 280:2121–2126. [DOI] [PubMed] [Google Scholar]
- Klausberger, T., P.J. Magill, L.F. Marton, J.D. Roberts, P.M. Cobden, G. Buzsaki, and P. Somogyi. 2003. Brain-state- and cell-type-specific firing of hippocampal interneurons in vivo. Nature. 421:844–848. [DOI] [PubMed] [Google Scholar]
- Knierim, J.J., H.S. Kudrimoti, and B.L. McNaughton. 1995. Place cells, head direction cells, and the learning of landmark stability. J. Neurosci. 15:1648–1659. [DOI] [PMC free article] [PubMed] [Google Scholar]
- Lenck-Santini, P.P., B. Rivard, R.U. Muller, and B. Poucet. 2003. A study of place cell activity and exploratory behavior following spatial and non-spatial changes in the environment. Soc. Neurosci. Abstr. 198:4. [DOI] [PubMed] [Google Scholar]
- Lever, C., T. Willis, F. Cacucci, N. Burgess, and J. O'Keefe. 2002. Long-term plasticity in hippocampal place-cell representation by environmental geometry. Nature. 416:90–94. [DOI] [PubMed] [Google Scholar]
- Muller, R.U. 1996. A quarter of century of place cells. Neuron. 17:813–822. [DOI] [PubMed] [Google Scholar]
- Muller, R.U., and J.L. Kubie. 1987. The effects of changes in the environment on the spatial firing of hippocampal complex-spike cells. J. Neurosci. 7:1951–1968. [DOI] [PMC free article] [PubMed] [Google Scholar]
- Muller, R.U., J.L. Kubie, and J.B. Jr. Ranck. 1987. Spatial firing patterns of hippocampal complex-spike cells in a fixed environment. J. Neurosci. 7:1935–1950. [DOI] [PMC free article] [PubMed] [Google Scholar]
- O'Keefe, J., and J. Dostrovsky. 1971. The hippocampus as a spatial map. Preliminary evidence from unit activity in the freely moving rat. Brain Res. 34:171–175. [DOI] [PubMed] [Google Scholar]
- O'Keefe, J., and L. Nadel. 1978. Hippocampus as a Cognitive Map. Clarendon Press, Oxford. 570 pp.
- O'Keefe, J., and M.L. Recce. 1993. Phase relationship between hippocampal place units and the EEG theta rhythm. Hippocampus. 3:317–330. [DOI] [PubMed] [Google Scholar]
- Rotenberg, A., and R.U. Muller. 1997. Variable place-cell coupling to a continuous viewed stimulus: Evidence that the hippocampus acts as a perceptual system. Philos. Trans. R. Soc. Lond. B Biol. Sci. 352:1505–1513. [DOI] [PMC free article] [PubMed] [Google Scholar]
- Samsonovich, A., and B.L. McNaughton. 1997. Path integration and cognitive mapping in a continuous attractor neural network model. J. Neurosci. 17:5900–5920. [DOI] [PMC free article] [PubMed] [Google Scholar]
- Save, E., B. Poucet, N. Foreman, and M.C. Buhot. 1992. Object exploration and reactions to spatial and non-spatial changes in hooded rats following damage to parietal cortex or dorsal hippocampus. Behav. Neurosci. 106:447–456. [PubMed] [Google Scholar]
- Shapiro, M.L., H. Tanila, and H. Eichenbaum. 1997. Cues that hippocampal place cells encode: Dynamic and hierarchical representation of local and distal stimuli. Hippocampus. 7:624–642. [DOI] [PubMed] [Google Scholar]
- Sharp, P.E., H.T. Blair, D. Etkin, and D.B. Tzanetos. 1995. Influences of vestibular and visual motion information on the spatial firing patterns of hippocampal place cells. J. Neurosci. 15:173–189. [DOI] [PMC free article] [PubMed] [Google Scholar]
- Wilson, M.A., and B.L. McNaughton. 1993. Dynamics of the hippocampal ensemble code for space. Science. 261:1055–1058. [DOI] [PubMed] [Google Scholar]
- Wood, E.R., P.A. Dudchenko, and H. Eichenbaum. 1999. The global record of memory in hippocampal neuronal activity. Nature. 397:613–616. [DOI] [PubMed] [Google Scholar]