

Abstract
Tetrodotoxin-resistant (TTX-R) Na+ channels are much less susceptible to external TTX but more susceptible to external Cd2+ block than tetrodotoxin-sensitive (TTX-S) Na+ channels. Both TTX and Cd2+ seem to block the channel near the “DEKA” ring, which is probably part of a multi-ion single-file region adjacent to the external pore mouth and is involved in the selectivity filter of the channel. In this study we demonstrate that other multivalent transitional metal ions such as La3+, Zn2+, Ni2+, Co2+, and Mn2+ also block the TTX-R channels in dorsal root ganglion neurons. Just like Cd2+, the blocking effect has little intrinsic voltage dependence, but is profoundly influenced by Na+ flow. The apparent dissociation constants of the blocking ions are always significantly smaller in inward Na+ currents than those in outward Na+ current, signaling exit of the blocker along with the Na+ flow and a high internal energy barrier for “permeation” of these multivalent blocking ions through the pore. Most interestingly, the activation and especially the inactivation kinetics are slowed by the blocking ions. Moreover, the gating changes induced by the same concentration of a blocking ion are evidently different in different directions of Na+ current flow, but can always be correlated with the extent of pore block. Further quantitative analyses indicate that the apparent slowing of channel activation is chiefly ascribable to Na+ flow–dependent unblocking of the bound La3+ from the open Na+ channel, whereas channel inactivation cannot happen with any discernible speed in the La3+-blocked channel. Thus, the selectivity filter of Na+ channel is probably contiguous to a single-file multi-ion region at the external pore mouth, a region itself being nonselective in terms of significant binding of different multivalent cations. This region is “open” to the external solution even if the channel is “closed” (“deactivated”), but undergoes imperative conformational changes during the gating (especially the inactivation) process of the channel.
Keywords: ion permeation, flux-coupling, single-file region, inactivation, activation
INTRODUCTION
Voltage-gated Na+ channels are important membrane proteins essential for the activity of many excitable cells. In mammalian neurons some Na+ channels are effectively inhibited by nanomolar or subnanomolar external tetrodotoxin (TTX) and are classified as the TTX-sensitive (TTX-S) channels. However, the other Na+ channels are inhibited only when there is micromolar or submicromolar TTX and are classified as the TTX-resistant (TTX-R) channels (Kleinhaus and Pritchard, 1976; Cohen et al., 1981; Lombet et al., 1982; Roy and Narahashi, 1992). In addition to TTX sensitivity, TTX-R and TTX-S channels are also different in the pore-blocking effect of transitional metal ions such as Cd2+ and Zn2+ (Frelin et al., 1986; Backx et al., 1992; Sheets and Hanck, 1992). For example, IC50 of Cd2+ block of the TTX-R channels in cardiac myocytes or Purkinje cells is ∼100-fold lower than that of the TTX-S channels in skeletal muscle cells (Visentin et al., 1990; Ravindran et al., 1991; Sheets and Hanck, 1992). Interestingly, it has been shown that the amino acid at position 374 of the channel protein plays a critical role in both TTX and Cd2+ sensitivity. In TTX-S channels this amino acid is phenylalanine or tyrosine, but in TTX-R channels it is cysteine or serine. TTX-R channels with a point mutation C374Y show markedly decreased affinity to Cd2+ but increased affinity to TTX (Satin et al., 1992), whereas Y374C mutant TTX-S channels show markedly increased affinity to Cd2+ but decreased affinity to TTX (Backx et al., 1992).
The highly conserved aspartate, glutamate, lysine, and alanine in the pore loops of domain I, II, III, and IV in the Na+ channel protein, respectively (the “DEKA” ring), have been implicated to form the selectivity filter of the channel, because mutations in the ring significantly change ionic selectivity (Heinemann et al., 1992; Favre et al., 1996; Pérez-Garcia et al., 1997; Sun et al., 1997). As position 374 is located next to the aspartate residue in the DEKA ring (D373), the Cd2+ blocking site very likely is contiguous to the DEKA ring region in the pore. Recently, we have demonstrated that the blocking effect of external Cd2+ on TTX-R Na+ currents has little intrinsic voltage dependence, but is significantly altered by the direction of Na+ flow, indicating coexistence of Na+ ions with the blocking Cd2+ ion in a single-file pore region at the external pore mouth (Kuo et al., 2002). This is reminiscent of the case of Ca2+ channels, where Cd2+ is also a potent pore blocker and binds to the “EEEE” ring (the glutamate residues in the Ca2+ channel protein at the loci corresponding to the DEKA ring). The EEEE ring presumably also confers the selectivity for Ca2+ ions of the Ca2+ channel by participating in the buildup of a “set” of contiguous ion binding sites capable of accommodating at least two Ca2+ ions simultaneously (Hess and Tsien, 1984; Kuo and Hess, 1993a,b; Yang et al., 1993, Ellinor et al., 1995). The Na+ and the Ca2+ channel pores thus seem to share a common structural feature in terms of a single-file, multi-ion, selectivity-related region at the external pore mouth.
Gating conformational changes in the pore are important issues concerning the molecular operation of ion channels. Because a trivial conformational change in the filter presumably could significantly affect ionic selectivity and thus channel function, one might expect little conformational changes in the selectivity filter region during the gating process. Indeed both the activation and the (fast) inactivation gates are probably located at the internal pore mouth rather than the external pore mouth where the DEKA and EEEE rings are (Armstrong et al., 1973; Vassilev et al., 1988; West et al., 1992; Eaholtz et al., 1994; Townsend and Horn, 1999; Kuo and Liao, 2000). However, Tomaselli et al. (1995) found that mutation of a residue in the external pore mouth of the Na+ channel not only reduces single-channel conductance but also accelerates the activation kinetics of the channel. Moreover, there are reports that mutations in the DEKA ring enhance the entry of Na+ channels into an ultraslow inactivated state (Hilber et al., 2001), or alter fast inactivation kinetics and recovery of the immobilized gating charges (Kuhn and Greeff, 2002). Significant conformational changes at the DEKA ring region thus seem plausible not only during the slow inactivation (similar to the C-type inactivation in K+ channels; Panyi et al., 1995; Liu et al., 1996; Starkus et al., 1997), but also during the fast inactivation processes. We therefore probe the single-file, multi-ion selectivity filter region in TTX-R Na+ channel in more detail with different multivalent metal cations, which have been shown to inhibit TTX-R Na+ currents (Frelin et al., 1986; Visentin et al., 1990; Sheets and Hanck, 1992). We found that the blocking effect of all these multivalent ions is Na+ flow dependent, being much more manifest in inward than in outward Na+ currents. Moreover, the gating (especially the inactivation) process of the channel is altered by these ions in a way well correlated with the blocking effect (and consequently correlated with the direction of Na+ flow). We conclude that the selectivity filter pore region in TTX-R Na+ channels is “open” to the external solution in the closed (deactivated) channel, and significant gating conformational changes seem to happen in this region especially during channel inactivation.
MATERIALS AND METHODS
Cell Preparation
The dorsal root ganglia in the cervical and lumbar parts of the spinal column of 7–12-d-old Wistar rats were removed and put into Ca2+-free Tyrode's solution (150 mM NaCl, 4 mM KCl, 2 mM MgCl2, and 10 mM HEPES, pH 7.4), where the remnant nerves and connective tissues were removed from the ganglia. The cleaned ganglia were incubated in the dissociation medium (82 mM Na2SO4, 30 mM K2SO4, 3 mM MgCl2, 10 mM HEPES, pH 7.4) containing 1.25 mg/ml collagenase type I and 1.2 mg/ml protease type XXIII for 30–40 min at room temperature. The enzyme action was terminated by washes with enzyme-free dissociation medium. The enzyme-treated ganglia were then triturated in dissociation medium with fire-polished Pasteur pipette to release single neurons. Small neurons (diameter 18–30 μm) with intact cell membrane but without attached satellite cells were picked for electrophysiological studies. Usually the isolated cells were used within 8 h of preparation.
Whole-cell Recording
The dissociated neurons were put in a recording chamber containing Tyrode's solution (Ca2+-free Tyrode's solution with 2 mM CaCl2 added). Whole-cell voltage-clamp recordings were obtained using pipettes pulled from borosilicate micropipettes (OD 1.55–1.60 mm; Hilgenberg, Inc.), and fire polished. The pipette resistance was 1.5–2 MΩ when filled with one of the following two internal solutions. The “150 mM Cs+” internal solution was composed of 75 mM CsCl, 75 mM CsF, 3 mM MgCl2, 10 mM HEPES, 5 mM EGTA, pH 7.4. The “150 mM Na+” internal solution had the same component except that 75 mM CsCl and 75 mM CsF were replaced by 75 mM NaCl and 75 mM NaF. After whole-cell configuration was obtained the neuron was lifted from the bottom of the recording chamber and moved in front of an array of flow pipes emitting either “150 mM Na+” or “150 mM Cs+” external solutions. The “150 mM Na+” external solution contained 150 mM NaCl, 2 mM MgCl2, 2 mM CaCl2, and 10 mM HEPES, pH 7.4. The “150 mM Cs+” external solution had the same components except that 150 mM NaCl was replaced by 150 mM CsCl. The chloride salts of the transitional metal ions were added to the external solutions to make the final concentrations desired without replacement of any of the foregoing basic constituents of the solutions. Hydrolysis of La3+ (and probably also the other multivalent metal ions) may result in a decrease of the free trivalent concentration with the formation of hydroxide complexes such as La(OH)2+. However, the error should be no larger than a few percent at pH 7.4 (∼8%, calculated based on pKs of 8.5, 17, and 38; Richens, 1997). Because our major goal is to characterize the remarkable differences in pore-blocking effect and gating modulation by the same concentrations of La3+ in different directions of Na+ current flow, but not to measure the exact values of the binding constants between La3+ and TTX-R Na+ channel, we do not correct the relatively consistent but small error in the free ion concentration. All external solutions also contained 0.3 μM TTX, 1 μM nimodipine, and 0.5 μM ω-conotoxin MVIIC to block TTX-S Na+ and most Ca2+ currents. The residual Ca2+ currents, chiefly including the T-type Ca2+ currents, did not seem to produce significant contamination because the amplitude of transient Ca2+ currents was in general no larger than 0.2–0.3 nA at −20 mV and was even smaller at more positive test potentials (examined in an external solution composed of 150 mM tetraethylammonium chloride and 2 mM CaCl2, in which the residual currents are Ca2+ sensitive and show different gating properties from the TTX-R Na+ currents; unpublished data). It has been shown that the TTX-R Na+ channels in dorsal root ganglion neurons require more positive potentials than TTX-S Na+ channels to activate and inactivate (Roy and Narahashi, 1992; Akopian et al., 1996; Rush et al., 1998). Moreover, the activation and inactivation kinetics at the same voltage (e.g., 0 mV) are both ∼3-fold slower in TTX-R channels than in TTX-S channels (Scholz et al., 1998). These parameters are helpful for the identification of the TTX-R currents. Thus, only the neurons which fulfill the following three criteria are included for further analysis: (a) The Na+ currents decay with a time constant between 2 to 5 ms at 0 mV in the control condition (Because the dorsal root ganglion neurons could contain multiple types of Na+ currents with different sensitivities to TTX and transitional metal ions, this kinetic feature helps us to focus on a relatively more homogeneous group of TTX-R channels.). (b) Leak current is no larger than 0.5 nA at a holding potential at −120 mV. (c) The amplitude of the steady-state current (at ∼90 ms) does not exceed 15% of the amplitude of the peak current (to avoid significant contamination by the residual Ca2+ currents, which were estimated to cause no more than 5–10% error in the measurement of peak amplitude or decay kinetics of the TTX-R Na+ current at +10 to +50 mV with the selection criteria). Measurement of the inactivation kinetics is done by fitting a monoexponential function to the decay phase of the current (from a point clearly after the current peak, i.e., from ∼90% of the peak current level), whereas the time to peak current denotes the time between the onset of the pulse and the point of the maximal absolute amplitude of inward or outward currents. Currents were recorded at room temperature (∼25°C) with an Axoclamp 200A amplifier, filtered at 10 kHz with four-pole Bessel filter, digitized at 20-μs intervals, and stored using a Digidata-1200 analogue/digital interface with the pCLAMP software (Axon Instruments, Inc.). All statistics are given as mean ± standard error of mean.
RESULTS
La3+ Blocks Inward TTX-R Na+ Currents and Slows Channel Activation as Well as Inactivation
Fig. 1 A shows sample inward TTX-R Na+ currents from a dorsal root ganglion cell. The peak Na+ currents are reduced by 30 and 100 μM external La3+ in a dose-dependent fashion. Also, it seems that both the activation and the inactivation phases of the macroscopic currents are altered by La3+. When the peak currents in Fig. 1 A are rescaled to the same size (Fig. 1 B), it is evident that La3+ delays the time to peak current as well as slows the kinetics of macroscopic current decay, and these effects on channel gating are also more manifest in 100 μM than in 30 μM La3+. Because La3+ might screen the surface charges and thus result in the observed changes in channel gating, we examine the steady-state inactivation curve in different concentrations of La3+ (Fig. 1 C). 30 and 100 μM La3+ produces negligible shift of the curve, and even 300 μM La3+ shifts the curve by only ∼3 mV. The gating changes in Fig. 1 B thus cannot be ascribable to alterations in surface potential, but a more specific effect of La3+ on the TTX-R Na+ channel. We further characterize the reduction of peak inward Na+ current at different membrane potentials in Fig. 2 A, which plots the relative peak currents in 3–1,000 μM of La3+ at +10 to +50 mV. The relative current in a fixed concentration of La3+ remains roughly similar between membrane potentials +10 and +50 mV, indicating little apparent voltage dependence of La3+ block in this experimental configuration. The mean values in Fig. 2 A are reorganized in Fig. 2 B, which plots the relative current at each different membrane potential against La3+ concentration. Each set of data could be reasonably fitted by a one-to-one binding curve. The fitting curves are almost superimposed on one another and the dissociation constants from the fits are similar (∼80 μM) at different membrane potentials, consistent with the lack of apparent voltage dependence of the blocking effect of La3+. It might be a concern that the reduction of peak current itself does not faithfully reflect the pore-blocking effect of La3+, because La3+ also significantly alters the activation and inactivation kinetics of the channel and may consequently alter the peak of the currents. We therefore carefully performed a quantitative analysis to examine such a possibility (see below, Fig. 11). The simulation results clearly indicate that although the gating changes may slightly alter the peak current amplitude, the reduction of peak current is chiefly ascribable to La3+ block of the channel pore.
Figure 1.
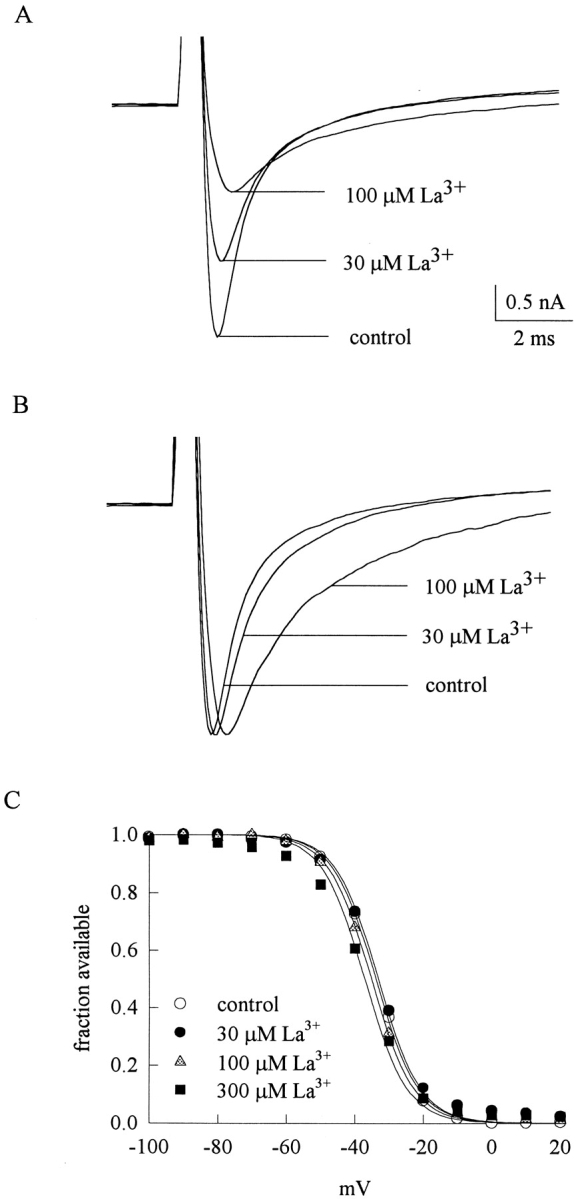
Inward TTX-R Na+ currents inhibited by external La3+. (A) The cell was held at −120 mV and stepped every 3 s to the test pulse (+30 mV) for 100 ms to elicit Na+ currents. With 150 mM Na+ external solution and 150 mM Cs+ internal solution, inward TTX-R Na+ currents are elicited by the test pulses and are inhibited by 30 and 100 μM La3+. (B) The sweeps in A are rescaled to the same size to demonstrate that La3+ delays the time to peak current as well as slows the kinetics of macroscopic current decay. (C) The cell was held at -120 mV and stepped every 3 s to the inactivating pulse (−120 to −50 mV) for 100 ms. The channels which remain available after each inactivating pulse were assessed by the peak currents during the following 5-ms test pulse to 0 mV. The fraction available is defined as the normalized peak current (relative to the current evoked with an inactivating pulse at −120 mV) and is plotted against the voltage of the inactivating pulse to make the inactivation curve. The lines are fits of a Boltzmann function 1/(1 + exp((V − Vh)/k)), with the k value fixed at 6.2 (the best fit for the control data) and Vh values (in mV) of −33.8, −33.1, −35.1, and −37.1 for control, 30, 100, and 300 μM La3+, respectively. In 3–10 cells, the cumulative results show that the inactivation curve is shifted (defined by the difference of Vh in La3+ and in control) by −0.67 ± 0.66, −1.15 ± 0.55, and −3.53 ± 0.39 mV in 30, 100, and 300 μM La3+, respectively.
Figure 2.

Inward TTX-R Na+ currents inhibited by external La3+ at different membrane potentials. (A) Inhibition of inward TTX-R Na+ currents by different concentrations (3–1,000 μM, as indicated beside each symbol) of La3+ at different test pulse voltages. The experimental conditions and pulse protocols were the same as those described in Fig. 1, except that the test pulse was varied from +10 to +50 mV in 10-mV steps (the horizontal axis). The relative current (the vertical axis) at each test pulse potential is defined by normalization of the peak currents in the presence of La3+ to the peak current in the control (La3+-free) solution (n = 4–8). The inhibition is clearly La3+ concentration-dependent yet shows little voltage dependence. (B) The mean relative current in A is plotted against [La3+] (the concentration of La3+) in semilogarithmic scale. The lines are best fits for each set of data points and are of the form: relative current = 1/(1 + ([La3+]/K La,i)), where K La,i stands for the apparent dissociation constant of external La3+ in the presence of inward Na+ currents. The K La,i from the fits at each test pulse voltage is given in the figure.
Figure 11.

Simulation of the inhibitory effect of La3+ on TTX-R Na+ currents. (A) A simplified gating scheme similar to that in Fig. 6 A. k1, k2, k3, k4 are rate constants related to channel activation and inactivation in the control condition, and are set as (in s−1) 2,000, 2, 300, and 3, respectively. These numbers would fit a ∼1-ms time to peak current, and also fit that the macroscopic TTX-R Na+ current decays with a time constant of 2–5 ms. The voltage dependence of these rate constants are neglected for simplicity because the experimental findings in Figs. 1–4 are barely voltage dependent. k5 and k6 are the activation and deactivation rate constants of the La3+-bound channel, and are set as (in s−1) 1,000 and 1, respectively. We had tried to make k5 equal to k1, but found that k5 must be slightly smaller than k1 to lengthen the time to peak currents to the extent comparable to experimental observations. We then deliberately kept k5/k6 equal to k1/k2, showing that the La3+ affinities toward the closed and the open channel are not necessarily different. k7 is the unbinding rates of La3+ from the open Na+ channel, and are (in s−1) 1000 and 9000 in inward and outward Na+ currents, respectively. k8 is the binding rate of La3+ to the open Na+ channel and is [La3+] * 1.4 * 107 M−1s−1, where [La3+] denote La3+ concentration (1.4 * 107 M−1s−1 is a reasonable number comparable to the binding rate of La3+ onto the open Ca2+ channel in the presence of 110 mM Ba2+; Lansman, 1990). The very small arrows between OLa3+ and ILa3+ indicate very slow transitional rates, which are neglected in the modeling procedures (i.e., assuming near zero transitional rates between OLa3+ and ILa3+). The arrows between I and ILa3+ are omitted not because such transitions are impossible, but because there is no criteria and also no need to conjecture the relative size of the arrows. La3+ is assumed to bind to the closed Na+ channels with a dissociation constant of 100 μM, and the binding has reached an equilibrium during the −120-mV interpulse interval which keeps essentially all Na+ channel in the closed state. The distribution of Na+ channels in states C and CLa3+ is thus derived with the 100-μM dissociation constant and serves as the initial condition at the beginning of each depolarizing pulse, during which the opening probability (occupancy of the O state) at each time point is calculated with Runge-Kutta method. The final current at each time point is set as the product of the opening probability and 5 nA (an arbitrarily assigned value for the current when all channels are open). (B, left) The simulated inward currents in control and in 30, 100, 300, 1,000 μM La3+ (in the order from the largest to the smallest currents). The dashed line indicates zero current level. (B, right) The sweeps in the left panel are rescaled to the same size (the peak currents are scaled to the same level) for a better illustration of the effect of La3+ on channel gating (longer time to peak current and slower decay phase in higher La3+ concentration). (C, left) The simulated outward currents in control and in 30, 100, 300, 1,000 μM La3+ (in the order from the largest to the smallest currents). The dashed line indicates zero current level. (C, right) The sweeps in the left panel are rescaled to the same size for a better illustration of the effect of La3+ on channel gating. Note that the gating effects here are evidently smaller than that in B. (D) The relative current (the vertical axis) is defined by normalization of the peak simulated currents in the presence of La3+ to the peak current in control, and is plotted against [La3+] (the concentration of La3+) in semilogarithmic scale. The lines are best fits for each set of data points and are of the form: relative current = 1/(1 + ([La3+]/K d)), where K d stands for the apparent dissociation constant of external La3+, and are 75.3 and 598 μM for the inward and outward Na+ currents, respectively. One can readily see that although the gating changes do slightly alter the current amplitude, the Kd obtained from the relative peak currents reasonably approximates the “true” binding affinity of La3+ to the open Na+ channel in the presence of inward (k7/k8 = 71.4 μM) or outward (k7 /k8 = 643 μM) Na+ currents. (E) The relative inactivation speed is obtained by normalization of the inverse of the decay time constant of each simulated inward or outward current in different concentrations of external La3+ to that in control, and is plotted against the fraction of unblocked channels (defined by the relative current described in D). The line is drawn based on a linear function of Y = X (i.e., relative inactivation speed = fraction of unblocked channels), and well describes the data points. Note that for the sake of simplicity we have assumed near zero inactivation rate of the channel bound with a La3+ ion (i.e., near zero transitional rates between OLa3+ and ILa3+). Thus, the relative inactivation speed closely approximates the product of the quasi steady-state occupancy of state O between states O and OLa3+, or K7/(K7 + K8), and the inactivation speed of the La3+-free channel. (F) The time to peak current is measured in the simulated currents in different concentrations of La3+ and is normalized to the time to peak current in control to give the relative time to peak current, which is evidently La3+ concentration dependent, and is longer in inward Na+ currents than in outward Na+ currents especially in high La3+ concentrations.
La3+ Blocks Outward TTX-R Na+ Currents and Alters Channel Gating With Much Less Potency
Fig. 3 A shows sample outward TTX-R Na+ currents in the control solution and in the presence of 100 and 300 μM external La3+. The peak Na+ currents are reduced by La3+ in a dose-dependent fashion, although the blocking effect of La3+ on the outward currents is much weaker than that on the inward currents in Fig. 1. Most interestingly, both the activation and the inactivation phases of the macroscopic currents are again altered by La3+, but the effect is much weaker on the outward currents. The peak currents in Fig. 3 A are rescaled to the same size in Fig. 3 B for a better illustration of the effect of La3+ on channel gating. In contrast to the case of inward currents in Fig. 1 B, here 100 μM La3+ only slightly delays the time to peak current as well as slows the kinetics of macroscopic current decay. Even 300 μM La3+ does not have an as large effect as that of 100 μM La3+ in Fig. 1 B. We further characterize the reduction of peak outward Na+ currents at different membrane potentials in Fig. 4 A, which plots the relative peak currents in 30–3,000 μM of La3+ at +10 to +50 mV. The relative current in a fixed concentration of La3+ shows a slight tendency to become larger with more positive membrane potentials from +10 to +50 mV. The mean values in Fig. 4 A are reorganized in Fig. 4 B, which plots the relative current at each different membrane potential against La3+ concentration. Each set of data again could be reasonably fitted by a one-to-one binding curve. All of the dissociation constants obtained from the fits in Figs. 2 B and 4 B are summarized in Fig. 4 C. It is clear that the apparent dissociation constants obtained in outward Na+ currents are nearly one order of magnitude larger than those obtained in inward Na+ currents. Also, the voltage dependence of La3+ block is slightly different with different directions of Na+ ion flow. La3+ block of inward Na+ currents shows only negligible voltage dependence, yet La3+ block of outward Na+ currents seems to have a slight voltage dependence as the dissociation constants tend to be larger at more depolarized membrane potentials.
Figure 3.

Outward TTX-R Na+ currents inhibited by external La3+. (A) The cell was held at −120 mV and stepped every 3 s to the test pulse (+30 mV) for 100 ms. With 150 mM Na+ internal solution and 150 mM Cs+ external solution, outward TTX-R Na+ currents were elicited by the test pulses and were inhibited by 100 and 300 μM La3+. The inhibitory effect of La3+ is evidently weaker than that in Fig. 1 A. (B) The sweeps in A are rescaled to the same size (the peak currents are scaled to the same level). The activation phase and the inactivation phase of the macroscopic currents are altered by La3+, but these gating effects on outward Na+ currents are much weaker than those on inward Na+ currents in Fig. 1 B.
Figure 4.
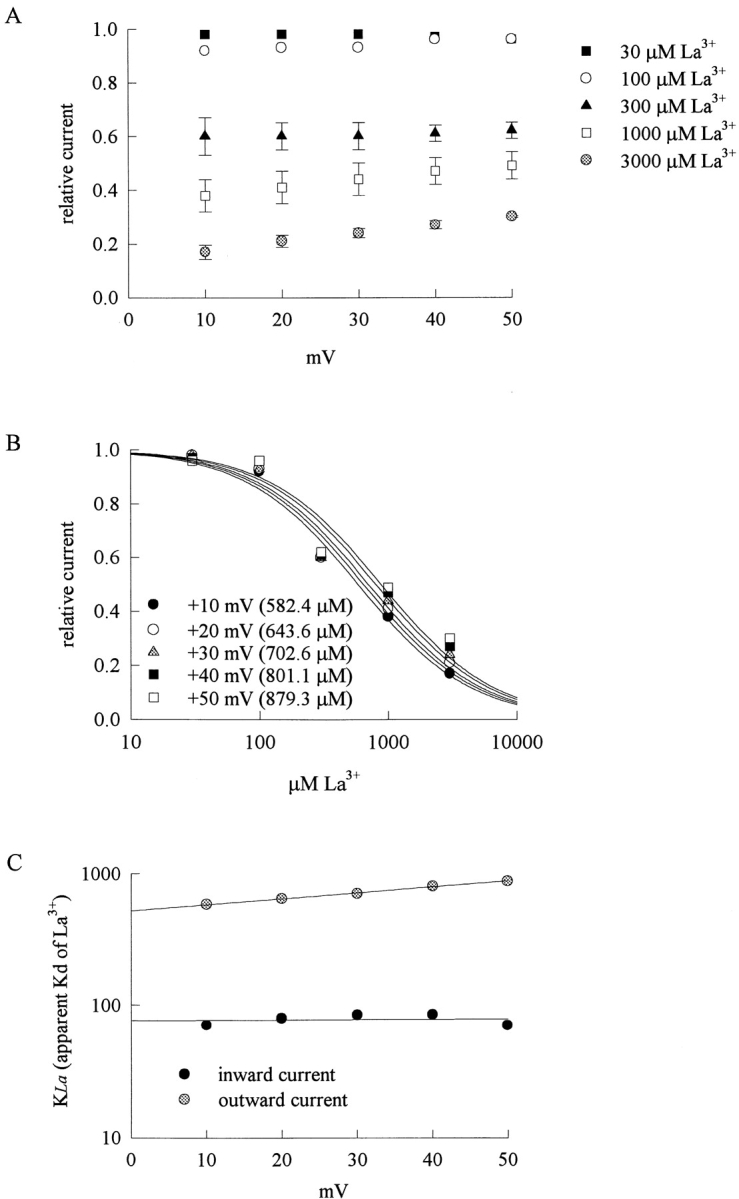
Outward TTX-R Na+ currents inhibited by external La3+ at different membrane potentials. (A) Inhibition of outward TTX-R Na+ currents by different concentrations (30–3,000 μM, as indicated beside each symbol) of La3+ at different test pulse voltages. The experimental conditions and pulse protocols were the same as those described in Fig. 3, except that the test pulse was varied from +10 to +50 mV in 10-mV steps (the horizontal axis). The relative current (the vertical axis) at each test pulse potential is defined by normalization of the peak currents in the presence of La3+ to the peak current in the control (La3+-free) solution (n = 3–5). (B) The mean relative current in A is plotted against [La3+] (the concentration of La3+) in semilogarithmic scale. The lines are best fits for each set of data points and are of the form: relative current = 1/(1 + ([La3+]/K La,o)), where K La,o stands for the apparent dissociation constant of external La3+ in the presence of outward Na+ currents. The K La,o from the fits at each test pulse voltage is given in the figure. (C) The K La,i and K La,o obtained in Fig. 2 B are plotted against test pulse voltage in semilogarithmic scale. The lines are the best fits to the data points and are of the forms: K La,i = 76.4 μM * exp(V/1622 mV), and K La,o = 521 μM * exp(V/95.4 mV), where V stands for the test pulse voltage in mV.
The Effect of La3+ on the Macroscopic Inactivation Kinetics Is Dependent on the Direction of Na+ Flow Rather Than the External Na+ Concentration
We have seen that La3+ not only reduces peak Na+ currents, but also slows down the activation and especially the inactivation kinetics of the Na+ channel. Moreover, just analogous to the reduction of the peak currents, the slowing of gating kinetics are strongly dependent on the direction of Na+ currents. Fig. 5, A and B , documents the kinetics of the macroscopic current decay in more detail. It is evident that there is always much stronger slowing effect on the decay of inward Na+ currents than outward currents when the same concentrations of La3+ is present. For example, 1,000 μM La3+ produces ∼8-fold lengthening of the inactivation time constant in inward Na+ currents at +10 to +50 mV, but produces only ∼2-fold changes in outward Na+ currents at the same voltages. 100 μM La3+ produces ∼2-fold lengthening of the inactivation time constant in inward Na+ currents, but has only negligible effect in outward Na+ currents. The findings in Fig. 5, A and B, thus clearly demonstrate that the Na+ channel gating changes are La3+ dose dependent and are tightly correlated with the direction of Na+ flow, but are not voltage sensitive and remain similar over a wide range of membrane potentials. Because the inactivation kinetics show only minimal voltage dependence in the control condition in 40 mV (the time constant of current decay at +10 mV is only ∼1.6 times as long as that at +50 mV, see the legend of Fig. 5 A), 100–300 μM La3+ should have a surface charge screening effect much larger than 40 mV if it causes the ∼2–4-fold change in decay kinetics (Fig. 5 A) by alteration of the surface potential. This is very much incompatible with the findings in Fig. 1 C, where 100–300 μM La3+ barely shifts the inactivation curve. Also, the evident Na+ flow dependence of the gating changes caused by La3+ (the remarkably different gating effects produced by the same concentrations of La3+ in inward and in outward Na+ currents) would further argue against that the effect of La3+ on Na+ channel gating is due to alterations in surface potential. On the other hand, it should be noted that in the foregoing experiments we have used very different internal and external Na+ concentrations to obtain preponderant inward (150 mM external Na+ and 0 mM internal Na+, Figs. 1 and 2) or outward (150 mM internal Na+ and 0 mM external Na+, Figs. 3 and 4) Na+ current through TTX-R channels. To confirm that the observed differential inhibitory effect of La3+ is indeed correlated with the different direction of Na+ flow but not the different external and internal solutions used in different experiments, we studied the inhibitory effect of La3+ in an experimental condition with equimolar (150 mM) internal and external Na+ (Fig. 5 C). At voltages similar to previous experiments (i.e., +20 to +50 mV, the data at +10 mV is not included because the current might be too small to make an accurate analysis of the gating kinetics), the effect of 300 and 1,000 μM La3+ on the kinetics of macroscopic inactivation of the outward Na+ currents is essentially the same whether there is 0 or 150 mM external Na+. This finding strongly argues that the effect of La3+ on the macroscopic inactivation kinetics is indeed dependent on the direction of Na+ flow rather than on the external Na+ concentrations, exactly analogous to the peak Na+ current reducing effect of Cd2+ in the same preparation (Kuo et al., 2002).
Figure 5.

The effect of external La3+ on the inactivation kinetics of TTX-R Na+ channel inactivation. (A) At each test pulse voltage (+10 to +50 mV), the time constants of the decay phase of the macroscopic inward Na+ currents (150 mM external Na+ and 150 mM internal Cs+) in the presence of different concentrations of external La3+ are normalized to the time constants of current decay in control (in the absence of external La3+) to give the relative inactivation τ. The cumulative results (n = 3–5) show that the inactivation time constant is evidently lengthened with increasing La3+ concentration but the effect is barely voltage dependent. For the sake of simplicity, the relative inactivation τ in control is set as one for all five different potentials and is not shown in the figure. However, it should be noted that the absolute value of the inactivation time constant in control does slightly shorten with increasing depolarization from +10 to +50 mV (the time constant at +10 mV is 1.60 ± 0.08 times as long as that at +50 mV, n = 7). (B) The relative inactivation τ for the outward Na+ currents (150 mM external Cs+ and 150 mM internal Na+) is obtained by the same way as that described in A. The cumulative results (n = 3–5) show that the inactivation time constant is again La3+ concentration dependent but essentially voltage independent. However, the effect of external La3+ on the inactivation kinetics is much stronger in inward Na+ currents than in outward Na+ currents. Note that the vertical axes in the plots in A and B have the same scale. Also, bars of the same style represent one order of magnitude higher La3+ concentration in B than in A, but reach roughly the same vertical level in both figures. (C) At +20 to +50 mV, the relative inactivation τ for the outward Na+ currents remains very similar in the same concentrations of La3+ (300 or 1,000 μM) whether there is 150 mM external Cs+ and 150 mM internal Na+ (i.e., “zero external Na+”, n = 3–4) or 150 mM external and internal Na+ (i.e., “150 mM symmetrical Na+”, n = 2–4).
The La3+-blocked Channels Cannot Inactivate with a Discernible Speed
The inactivation time constants of macroscopic Na+ currents in Fig. 5, A and B, seem to increase monotonously with increasing concentrations of La3+, showing no signs of saturation (even when the La3+ concentration has reached 1,000–3,000 μM, concentrations much higher than the dissociation constants of La3+ binding to the channel in Figs. 2 B and 4 B). We have argued that the apparent slowing of macroscopic current decay indicates deterred inactivation process by binding of La3+ to the channel pore rather than by nonspecific screening of surface charges. If the binding-unbinding of La3+ (interaction between an ion and a protein molecule) is significantly faster than the inactivation rate of the channel (a conformational change of the protein), then the apparent kinetics of macroscopic current decay would be a weighted average of the inactivation rate of the La3+-free channel and that of the La3+-bound channel (Fig. 6 A). Under such circumstances, the decay rate of the macroscopic currents should be linearly correlated with the fraction of the blocked (or unblocked) channels in different concentrations of La3+. This is exactly the case for both inward and outward Na+ currents, no matter the membrane potential is varied between +10 and +50 mV (Fig. 6, B and C). Because the blocking effect of external La3+ on the Na+ currents is very much flow dependent (Fig. 4 C), these findings also explain why the kinetic changes of macroscopic current decay produced by the same concentrations of La3+ are so different in the inward and outward Na+ currents. Moreover, the extrapolation of the fitting lines in both Fig. 6, B and C, to 0% unblocked channel (the zero point of the transverse axis) approaches the zero point of the longitudinal axis, indicating nearly 0 (0.05 and 0.04 in inward and outward Na+ currents, respectively) relative inactivation speed if all channels are blocked by La3+. In other words, it appears that the La3+-blocked Na+ channels can hardly inactivate with a discernible speed.
Figure 6.
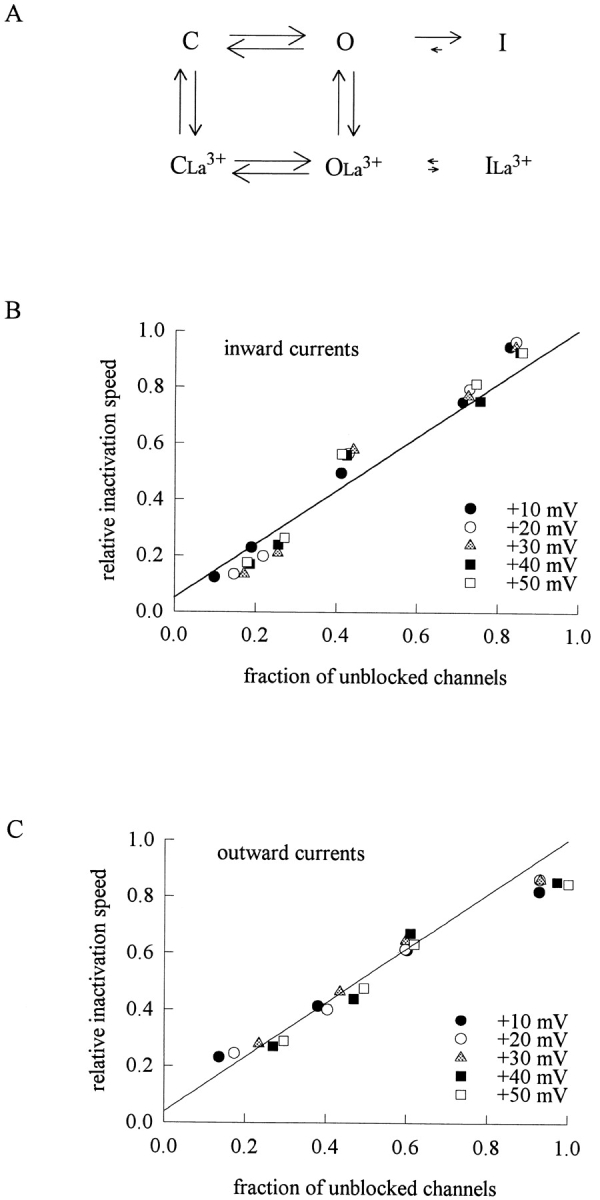
The correlation between the blocking effect on Na+ current and the slowing effect on Na+ channel inactivation by external La3+. (A) A simplified gating scheme illustrating the possible gating process of TTX-R Na+ channel in the presence of external La3+. C, O, and I are the closed, open, and inactivated states of the channel in the control condition (the La3+-free channel), respectively. CLa3+, OLa3+, and ILa3+ are the closed, open, and inactivated states of the La3+-bound channel, respectively. Inactivation is completely coupled to activation in the scheme for the sake of simplicity. The arrows between states O and I and states OLa3+ and ILa3+ are relatively small because the inactivation rates are assumed to be significantly slower than La3+ binding and unbinding rates to and from the open TTX-R Na+ channel pore. The macroscopic inactivation rates thus would be a weighted average of the O to I rate and OLa3+ to ILa3+ rate, weighted according to the quasi steady-state occupancy between states O and OLa3+ (see also Fig. 11). The arrows between I and ILa3+ are omitted not because such transitions are impossible, but because there is no criteria and also no need to conjecture the relative size of the arrows. (B) The relative inactivation speed of the inward currents in different concentrations of external La3+ (the inverse of the relative inactivation τ in Fig. 5 A) is plotted against the fraction of unblocked channels (taken from the mean values of the relative current data in Fig. 2 A). Because both parameters are barely voltage dependent, the data at different test pulse voltages are plotted together. The line is a linear regression fit to the data points and is of the form: relative inactivation speed = fraction of unblocked channels + 0.05 * (1 − fraction of unblocked channels). (C) The relative inactivation speed of the outward currents in different concentrations of external La3+ (the inverse of the relative inactivation τ in Fig. 5 B) is plotted against the fraction of unblocked channels (taken from the mean values of the relative current data in Fig. 4 A). Because both parameters are barely voltage dependent, the data at different test pulse voltages are plotted together. The line is a linear regression fit to the data points and is of the form: relative inactivation speed = fraction of unblocked channels + 0.04 * (1 − fraction of unblocked channels).
La3+ Also Has an Apparent Na+ Flow–dependent Slowing Effect on Na+ Channel Activation
In addition to the decay phase, the rising phase of the Na+ currents is also altered by La3+ (Figs. 1 A and 3 A). In Fig. 6 we have fitted the decay phase of the current with a monoexponential function after a point reasonably away from the current peak, so that we can have a relatively “pure” estimate of the inactivation speed as channel activation presumably is mostly completed from that point on. It is more difficult to get a reliable quantitative analysis of the La3+ effect on channel activation. In theory, inactivation is coupled to (happens subsequent to) activation, and therefore one may expect a relatively “pure” estimate on the activation kinetics by analysis of the very initial rising phase of the currents. However, such a detailed kinetic analysis is difficult because the initial part of the rapidly rising Na+ currents is usually covered by the capacity transients arising from the given pulse. We therefore took the time to peak current as a rough indicator of changes in activation kinetics in Fig. 7 . It is evident that La3+ lengthens the time to peak Na+ currents in a concentration-dependent fashion. This effect is again much more pronounced in inward than in outward Na+ currents, indicating a gating change closely related to the pore-blocking action of La3+. If the slowing of activation kinetics indicates that La3+ could bind to the closed Na+ channel and retard its activation, then the flow dependence of this slowing effect would be very intriguing because the closed channel should allow no Na+ flow (see discussion for more details).
Figure 7.

The effect of external La3+ on the activation phase of TTX-R Na+ channels. At a test pulse voltage of +30 mV, the time to peak current is measured in 30 to 1,000 μM La3+ and is normalized to the time to peak current in the absence of La3+ to give the relative time to peak current. The cumulative results (n = 3–10) show that the relative time to peak current is La3+ concentration-dependent, and is longer in inward Na+ currents than in outward Na+ currents especially in high La3+ concentrations.
Zn2+, Ni2+, Mn2+, and Co2+ Also Block TTX-R Na+ Currents with Strong Dependence on the Direction of Na+ Flow
We further test the effect of other multivalent transitional metal ions (Zn2+, Ni2+, Mn2+, and Co2+) on TTX-R Na+ currents. All of these ions are also blockers of the TTX-R Na+ currents in dorsal root ganglion neurons, with the blocking potency roughly in the order of Zn2+ ≥ Ni2+ > Mn2+ ≥ Co2+ according to the dissociation constants obtained from the fitting curves in Fig. 8 . Interestingly, for all of these ions the blocking effect is again much more manifest in inward Na+ currents than in outward Na+ currents, suggesting block of the Na+ channel pore at a single-file multi-ion region. Moreover, the blocking effects of Zn2+, Ni2+, Mn2+, and Co2+ also show little voltage dependence in inward Na+ currents, but more evident voltage dependence in outward Na+ currents (Fig. 9) . These findings are similar to the cases of La3+ (Figs. 1–4) and Cd2+ (Kuo et al., 2002) in terms of both flow and voltage dependence. The qualitatively very similar interactions with the channel and with the permeating Na+ ions strongly suggest that all these blocking ions bind to the same pore region.
Figure 8.
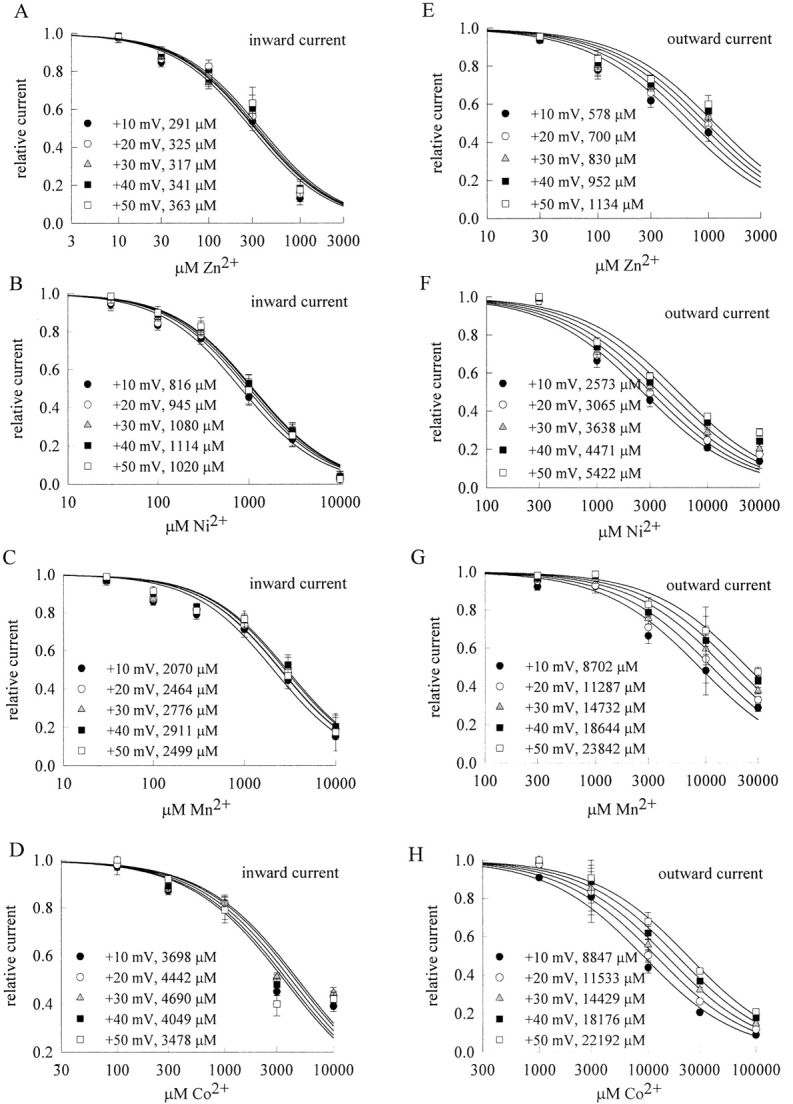
Inward and outward TTX-R Na+ currents inhibited by external Zn2+, Ni2+, Co2+, and Mn2+. The experimental protocols and data analyses are essentially the same as those in Fig. 2 B (for the inward currents) and Fig. 4 B (for the outward currents). (A–D) For test pulse voltages of +10 to +50 mV, the relative inward Na+ currents are plotted against the concentrations of Zn2+, Ni2+, Co2+, or Mn2+ in semilogarithmic scale (n = 4–9). The lines are best fits for each set of the mean values of the relative currents and are of the form: relative current = 1/(1 + ([X2+]/K X,i)), where X2+ stands for Zn2+, Ni2+, Co2+, or Mn2+ and K X,i stands for the apparent dissociation constant of each of these blocking ion in inward Na+ currents. The K X,i value (in μM) at each test pulse voltage is given in the figures. (E–H) For test pulse voltages of +10 to +50 mV, the relative outward Na+ currents are plotted against the concentrations of Zn2+, Ni2+, Co2+, or Mn2+ in semilogarithmic scale (n = 4–9). The lines are best fits for each set of the mean values of the relative currents and are of the form: relative current = 1/(1 + ([X2+]/K X,o)), where X2+ stands for Zn2+, Ni2+, Co2+, or Mn2+ and K X,o stands for the apparent dissociation constant of each of these blocking ion in outward Na+ currents. The K X,o value (in μM) at each test pulse voltage is given in the figures. It is evident that the blocking effect of Zn2+, Ni2+, Co2+, and Mn2+ is stronger in inward than in outward Na+ currents.
Figure 9.

The voltage dependence of the apparent dissociation constants in terms of the blocking effect of Zn2+, Ni2+, Co2+, and Mn2+ on the inward (K X,i) and outward (K X,o) Na+ currents. (A) The K X,i values obtained in Fig. 8, A to D, are plotted against test pulse voltage in semilogarithmic scale. The lines are the best fits to the data points of the form: K X,i = Ki * exp(V/qi), where V stands for the test pulse voltage in mV. The Ki values are 282, 842, 2199, and 4307 μM, and the qi values are 204, 182, 209, and 531 mV for Zn2+, Ni2+, Co2+, and Mn2+, respectively. (B) The K X,o values obtained in Fig. 8, E–H, are plotted against test pulse voltage in semilogarithmic scale. The lines are the best fits to the data points and are of the form: K X,o = Ko * exp(V/qo), where V stands for the test pulse voltage in mV. The Ko values are 500, 2096, 6886, and 7314 μM, and the qo values are 61.1, 52.8, 40.2, and 44.7 mV for Zn2+, Ni2+, Co2+, and Mn2+, respectively.
Zn2+, Ni2+, Mn2+, and Co2+ Also Affect TTX-R Na+ Channel Inactivation in a Way Correlative to Their Blocking Effect
We have seen in Fig. 6, B and C, that the Na+ channel blocked by La3+ can hardly inactivate with a discernible speed. If Zn2+, Ni2+, Mn2+, and Co2+ block the Na+ channel at the same pore region as La3+ does, it would be interesting to examine whether these blocking ions also has an effect on TTX-R Na+ channel gating. Fig. 10, A and B , show that Zn2+, Ni2+, Mn2+, and Co2+ indeed also slow the macroscopic inactivation kinetics of the channel. Moreover, the slowing effect can be reasonably correlated with the fraction of the blocked channel (and thus the direction of Na+ flow), exactly analogous to the case of La3+ in Fig. 6, B and C. It is also interesting to note that once the channel is blocked by La3+, Zn2+, Ni2+, Co2+, or Mn2+, the change in the inactivation speed is roughly the same for each blocking ion no matter the Na+ current is inward or outward (Fig. 10 C). In other words, the coordinating ligands that are “abducted” by each blocking ion and the extent of such abduction are probably the same irrespective of the direction of Na+ current flow. Thus, the transitional metal ion probably reaches the same blocking site in the multi-ion region no matter the Na+ currents are inward or outward. In other words, each blocking ion tends to stay in a certain binding site (a position of significant energy minimum) in this multi-ion pore region, and the permeating Na+ supplied by the 150 mM Na+ in the bulk solution would only regulate the direction of exit of the blocking ion from the blocking site (by different Na+ occupancy of the other ionic sites flanking the blocking site) rather than effectively “push” the blocking ion to the other positions in this region. Moreover, the slowing of macroscopic inactivation of the blocked channel shows an order similar to the order of the blocking potency of these ions. This is also consistent with the idea that stronger affinity would be related to stronger abduction of the ligands coordinating the blocking ion, and consequently stronger retardation effect on the gating processes which necessarily lead to some conformational changes of the blocking site.
Figure 10.
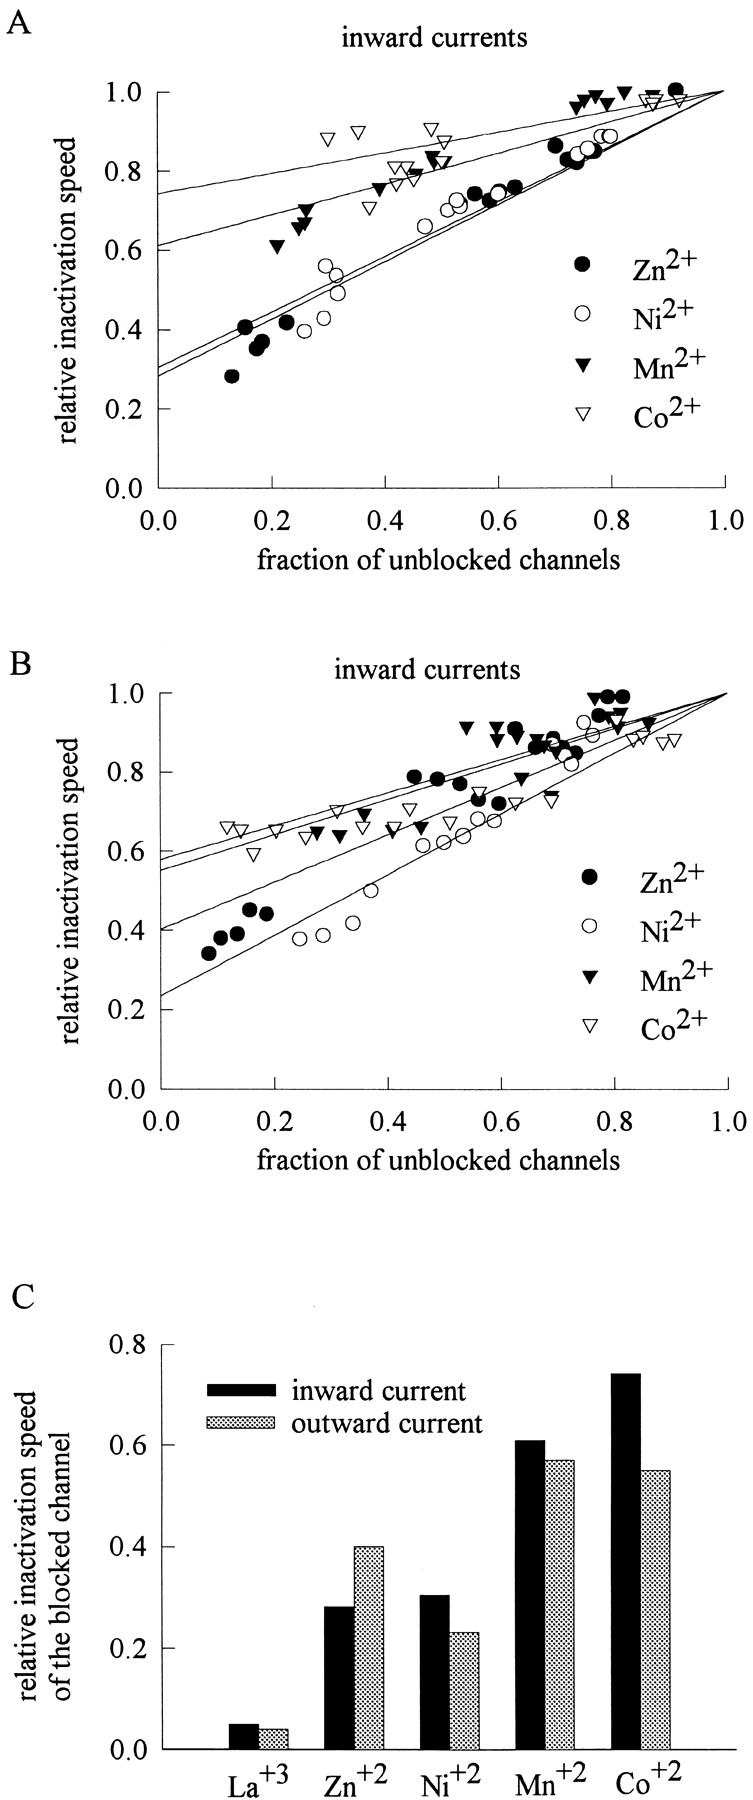
The correlation between the blocking effect on Na+ current and the slowing effect on Na+ channel inactivation by external Zn2+, Ni2+, Co2+, and Mn2+. The relative inactivation speed is obtained and plotted with the same approaches as those in Fig. 6, B and C. (A) The relative inactivation speed is plotted against the fraction of unblocked channels (i.e., the relative currents or normalized residual currents) for different concentrations of external Zn2+, Ni2+, Co2+, or Mn2+ in the presence of inward Na+ currents. The data at different test pulse voltages are pooled together in a similar way to Fig. 6 B to facilitate comparison. The lines are linear regression fits to the data and are of the form: relative inactivation speed = fraction of unblocked channels + pi * (1 − fraction of unblocked channels), with pi values of 0.28, 0.31, 0.61, and 0.74 for Zn2+, Ni2+, Co2+, or Mn2+, respectively. (B) The relative inactivation speed is plotted against the fraction of unblocked channels for different concentrations of external Zn2+, Ni2+, Co2+, or Mn2+ in outward Na+ currents. The data at different test pulse voltages are pooled together in a similar way to Fig. 6 C to facilitate comparison. The lines are linear regression fits to the data and are of the form: relative inactivation speed = fraction of unblocked channels + po * (1 − fraction of unblocked channels), with po values of 0.40, 0.28, 0.58, and 0.55 for Zn2+, Ni2+, Co2+, or Mn2+, respectively. (C) The relative inactivation speeds of the blocked channels in inward and outward Na+ currents are compared with each other. The relative inactivation speed of the blocked channel is taken from the pi, po, 0.05, and 0.04 from A and B, and Fig. 6, B, and C, respectively. The relative inactivation speeds of the blocked channels for each blocking ion (La3+, Zn2+, Ni2+, Co2+, or Mn2+) do not greatly differ whether the Na+ currents are inward or outward.
DISCUSSION
La3+, Zn2+, Ni2+, Mn2+, and Co2+ All Block TTX-R Na+ Channel Pore by Binding to a Single-file Multi-ion Region at the External Pore Mouth
We have characterized the inhibitory effect of different multivalent transitional cations, namely La3+, Zn2+, Ni2+, Mn2+, and Co2+, on the TTX-R Na+ currents in rat dorsal root ganglion neurons. Along with our previous results of Cd2+, whose apparent dissociation constants are similar to Zn2+ (Kuo et al., 2002), the order of blocking potency is roughly La3+ ≥ Zn2+ ≥ Cd2+ ≥ Ni2+ > Mn2+ ≥ Co2+. Except for the trivalent cation La3+, the order is consistent with what was reported for the TTX-R channels in heart cells (Ravindran et al., 1991; Sheets and Hanck, 1992) or nodose ganglion neurons (Ikeda and Schofield, 1987), although the absolute values of the measured affinity may be different among different preparations. Most interestingly, the blocking effect of these multivalent cations is always more pronounced when there are inward than outward Na+ currents. The flow dependence implies that these blocking ions all bind to a single-file multi-ion region of the pore (Kuo et al., 2002). Because point mutations right next to the aspartate residue in the DEKA ring significantly affect Cd2+ sensitivity of the channel (Satin et al., 1992; Backx et al., 1992), the single-file pore region probably involves the DEKA ring (the presumable selectivity filter of the Na+ channel; Lipkind and Fozzard, 1994; Favre et al., 1996; Pérez-Garcia et al., 1997; Sun et al., 1997) as well as adjacent areas. Moreover, the apparent voltage dependence of the blocking effect is small for all blocking ions. The electrical distance of the blocking site is 0.005 to ∼0.07 in inward and 0.09 to ∼0.3 in outward Na+ currents, consistent with the view that the blocking site(s) are located close to a wide vestibule at the external pore mouth (Kuo et al., 2002).
Binding of the Transitional Metal Ions to the Dorsal Root Ganglion TTX-R Na+ Channel Pore May Involve Oxygen Ligands at the Negative End of Strong Dipoles
The TTX-R channels in the rat dorsal root ganglion neurons chiefly involves the Nav1.8 and Nav1.9 clones, which have a serine rather than a cysteine residue at the position equivalent to the aforementioned C374 (Akopian et al., 1996; Tate et al., 1998). Because La3+ prefers coordination by oxygen-containing ligands (Nieboer, 1975), serine may offer a better La3+ binding site than cysteine. This may be the reason why La3+ has a stronger blocking effect on TTX-R Na+ currents in this study than those previously reported in cardiac TTX-R channels (apparent dissociation constant ∼0.5–11 mM, which indicates an even lower affinity than those of Cd2+ and Zn2+; Ravindran et al., 1991; Sheets and Hanck, 1992). In this regard, it is interesting to note that although La3+ and Ca2+ have similar ionic radii (1.16 and 1.12 Å, assuming a coordination number of eight for both ions; Evans, 1992) and chemical properties (irregularity or flexibility in both bond angles and bond lengths in the coordination complexes, tendency to form complexes preferably with oxygen donor groups, and lack of crystal field stabilization energy or significant covalent binding; Nieboer, 1975), Ca2+ has a much weaker inhibitory effect on TTX-R Na+ currents than La3+. For example, the IC50 of external Ca2+ on Na+ currents were estimated to be ∼37 to 67 mM in cardiac TTX-R channels (Ravindran et al., 1991; Sheets and Hanck, 1992). We also found that 5 mM Ca2+ has only a slight effect on TTX-R Na+ currents in the dorsal root ganglion neurons (Kuo et al., 2002). Such an evident difference in the blocking potency between La3+ and Ca2+ most likely is ascribable to the different ionic charges, implying an important role played by the electrostatic force in the interaction between the blocking La3+ ion and the channel pore. The ligands coordinating La3+ in the external pore mouth of the TTX-R channels in dorsal root ganglion neurons thus probably involve oxygen atoms at the negative end of strong dipoles, or even the negatively charged (deprotonated) carboxyl groups.
The Transitional Metal Ions Are Permeant Blockers Facing a Higher Internal Barrier in a Relatively Flexible Single-file Region at the External Pore Mouth
We have argued that the blocking Cd2+ ion coming from the external solution mostly exits inwardly in inward Na+ currents, making Cd2+ a permeant blocker of the TTX-R channel pore (Kuo et al., 2002). The same argument may also apply to the blocking ions in this study. Briefly, if there were such a huge, insurmountable energy barrier internal to this single-file region for the transitional metal ions that the blocking ion could only exit back to the external solution, then the overall unbinding rate of the blocker would be the product of the absolute outward exit rate and the relative tendency of outward movement of the ions in this single-file region. Because the tendency of outward versus inward movement of the blocking ion (with the permeating Na+ ion) in this single-file region must be very small but increase exponentially as the membrane potential goes more positive in inward Na+ currents, the overall unbinding rate and consequently the apparent dissociation constant in inward Na+ currents would be small at +10 mV yet significantly increased at +50 mV (i.e., strongly voltage dependent). This is inconsistent with the findings in this study, where the dissociation constants of all blocking ions do not show significant voltage dependence, and are only about three- to ninefold rather than very much smaller than those in outward currents (Figs. 4 C and 9, A and B). These blocking ions thus should exit the single-file region both inwardly and outwardly with the chances of moving in either direction determined by the Na+ flow, and are thus “permeant blockers” of the TTX-R Na+ channel. On the other hand, it is interesting that the transitional ions of different sizes (∼0.65 Å for Co2+ and Mn2+ to 1.16 Å for La3+; Evans, 1992) and different coordination geometry (e.g., octahedral, tetragonal, tetrahedral, and square pyramidal; Cowen, 1997) could all bind to the single-file multi-ion region more tightly than Na+ and consequently block Na+ flow. Thus, this pore region in the native TTX-R Na+ channels seems to be quite flexible. This is consistent with the findings that the pore segment composed of the ∼3 to 4 residues next to the DEKA ring in each domain is capable of sizable molecular motions, and thus is probably arranged in flexible peptide loops rather than more fixed secondary structures such as α-helices or β-strands (Chiamvimonvat et al., 1996; Pérez-Garcia et al., 1996; Bénitah et al., 1997; Tsushima et al., 1997). From a functional point of view, because many different transitional metal ions are capable of binding to the single-file multi-ion region with even higher affinity than Na+, this region itself cannot serve as the most critical selectivity “filter” that selects against the unwanted ions (although mutations in this region might somewhat change the ionic selectivity). The high internal barrier, which flanks the single-file region and deters (but not excludes) the inward exit of the transitional metal cations, most likely is responsible for the essential filter mechanism that makes the Na+ channel selective for the passage of Na+.
The Gating Voltage Sensors Probably Move in Very Close Apposition to the Single-file Region at the External Pore Mouth upon Membrane Depolarization
We have demonstrated that La3+ slows the decay phase of macroscopic TTX-R Na+ currents and lengthens the time to peak current (Figs. 5 and 7). These effects are closely dependent on the direction of current flow, and could be quantitatively well correlated with the extent of pore block (Fig. 6). There are also similar observations with the other multivalent blocking ions (Fig. 10). These findings are consistent with earlier observations that La3+ modified Na+ channel gating in a way not explainable by surface charge theory (Armstrong and Cota, 1990) or that Ca2+ could be a cofactor in Na+ channel gating by binding within the channel pore (Armstrong and Cota, 1991). Although Na+ channel inactivation is coupled to activation, the multivalent blocking ions seem to have a primary (slowing) effect on channel inactivation. For example, 30 μM La3+ has only negligible effect on the time to peak current in the presence of inward Na+ currents (Fig. 7), but already slows the decay of macroscopic Na+ currents by ∼30% (Fig. 5 A). Also, we deliberately measured the kinetics of the decay phase clearly after the peak current, where channel activation should be mostly over. The effect on channel inactivation seems so strong that the La3+-blocked channel can hardly inactivate with a discernible speed. It has been shown that pore mutations may alter gating processes of K+, Na+, and Ca2+ channels (Tomaselli et al., 1995; Molina et al., 1998; Xiong et al., 2003; Talavera et al., 2003), and that significant gating conformational changes happen in the external pore mouth of K+ channels during fast inactivation (Kuo, 1998). There are also precedents that ions bound at the external pore mouth affect slow inactivation of K+ channels (Yellen et al., 1994; Baukrowitz and Yellen, 1995; Ogielska and Aldrich, 1999). However, our data further indicate that fast inactivation could be specifically and profoundly affected by ion binding to the single-file region at the external pore mouth. The profound effect of La3+ and other multivalent blocking ions on fast inactivation is especially interesting if one considers that the fast inactivation “gate” presumably is located at the intracellular end of the pore but the blocking ions bind to the external pore mouth. This gating modification effect therefore is probably allosteric in nature, with a transmembrane segment working as the transducer. In this regard it is worthy of note that the fourth transmembrane segments (S4), presumably the major voltage sensor of the voltage-gated Na+, K+, and Ca2+ channel proteins, are found to move in close apposition to the residues in the extracellular end of the pore domain during membrane depolarization (Cha et al., 1999; Elinder et al., 2001; Broomand et al., 2003; Gandhi et al., 2003). Moreover, the extent and kinetics of Na+ channel inactivation are tightly and delicately correlated with the movement of S4 in the fourth domain of the channel protein (S4/D4; Yang and Kuo, 2003). It seems plausible that the binding of a multivalent blocking ion in the single-file region at the external pore mouth may significantly retard the outward movement of S4/D4. S4/D4 (and probably other gating voltage sensors to a lesser degree) might move in so close apposition to the single-file region at the external pore mouth that some ligands coordinating (and thus “abducted” by) the multivalent blocking ion must be reoriented during channel inactivation and activation, and/or that the increase of local positive charges from the blocking ion would deter the movement of the positively charged residues in the voltage sensors.
The Single-file Pore Region Is “Open” to the External Solution Even in the Closed Channel
In Fig. 7 we demonstrate that channel activation is also slowed by binding of La3+. This slowing effect is dependent on the direction of Na+ flow and again cannot be ascribed to surface potential changes. Because at those relative positive test potentials (+10 to +50 mV) channel activation should be very much faster than channel deactivation, an evident slowing effect on the rising phase of the macroscopic currents would strongly imply a significant amount of preexistent La3+-bound closed channels. However, the intriguing flow dependence of the activation slowing effect would indicate that the underlying mechanism must also involve the open channels, because the closed channels should allow no Na+ flow. Based on the simplified gating scheme in Fig. 6 A, the foregoing statements would mean a significant amount of channels in state CLa3+ at rest, and these channels traverse the CLa3+-OLa3+-O route to reach state O upon membrane depolarization. Moreover, the OLa3+ state must be nonconducting (i.e., La3+ must be an open channel blocker), and the OLa3+ to O step must be at least partially rate-limiting in the CLa3+-OLa3+-O route so that the slowing effect on the rising phase of the macroscopic current is flow-dependent. Based on the simplified scheme in Fig. 6 A and the foregoing mechanistic reasoning, we present a quantitative model which well recapitulates all essential findings in this study (Fig. 11) . We would therefore propose that the single-file pore region must be “open” to the external solution even in the closed channel, an interesting but not completely unexpected finding considering that the activation gate of Na+ channels is probably located close to the internal pore mouth (Townsend and Horn, 1999; Kuo and Liao, 2000). La3+ binding to this single-file region at the external pore mouth retards not only the flow of permeating Na+ ions but also the movement of some gating voltage sensors of the channel. At this point it might be interesting to reconsider the possible correlation between G-protein modulation of channel activation (e.g., Bean, 1989) and of divalent cation permeation (possibly by conformational changes in the EEEE ring; Kuo and Bean, 1993) in N-type Ca2+ channels. Modulation of channel gating and modulation of ion permeation thus are not necessarily separate processes, because modulatory conformational changes of channel protein may happen in an area where both processes are interrelated, such as in the single-file region at the external pore mouth.
Acknowledgments
This work was supported by Grant NSC-91-2320-B-002-079 from the National Science Council, Taiwan.
Olaf S. Andersen served as editor.
Abbreviation used in this paper: TTX, tetrodotoxin.
References
- Akopian, A.N., L. Sivilotti, and J.N. Wood. 1996. A tetrodotoxin-resistant voltage-gated sodium channel expressed by sensory neurons. Nature. 379:257–262. [DOI] [PubMed] [Google Scholar]
- Armstrong, C.M., and G. Cota. 1990. Modification of Na+ channel gating by Lanthanum: some effects that cannot be explained by surface charge theory. J. Gen. Physiol. 96:1129–1140. [DOI] [PMC free article] [PubMed] [Google Scholar]
- Armstrong, C.M., and G. Cota. 1991. Calcium ion as a cofactor in Na channel gating. Proc. Natl. Acad. Sci. USA. 88:6528–6531. [DOI] [PMC free article] [PubMed] [Google Scholar]
- Armstrong, C.M., F. Bezanilla, and E. Rojas. 1973. Destruction of sodium conductance inactivation in squid axons perfused with pronase. J. Gen. Physiol. 62:375–391. [DOI] [PMC free article] [PubMed] [Google Scholar]
- Backx, P.H., D.T. Yue, J.H. Lawrence, E. Marban, and G.F. Tomaselli. 1992. Molecular localization of an ion binding site within the pore of mammalian sodium channels. Science. 257:248–251. [DOI] [PubMed] [Google Scholar]
- Baukrowitz, T., and G. Yellen. 1995. Modulation of K+ current by frequency and external K+: a tale of two inactivation mechanisms. Neuron. 15:951–960. [DOI] [PubMed] [Google Scholar]
- Bean, B.P. 1989. Neurotransmitter inhibition of neuronal calcium currents by changes in channel voltage dependence. Nature. 340:153–156. [DOI] [PubMed] [Google Scholar]
- Bénitah, J.-P., R. Ranjan, T. Yamagishi, M. Janecki, G.F. Tomaselli, and E. Marban. 1997. Molecular motions within the pore of voltage-dependent sodium channels. Biophys. J. 73:603–613. [DOI] [PMC free article] [PubMed] [Google Scholar]
- Broomand, A., R. Mannikko, H.P. Larsson, and F. Elinder. 2003. Molecular movement of the voltage sensor in a K channel. J. Gen. Physiol. 122:741–748. [DOI] [PMC free article] [PubMed] [Google Scholar]
- Cha, A., P.C. Ruben, A.L. George Jr., E. Fujimoto, and F. Bezanilla. 1999. Voltage sensors in domains III and IV, but not I and II, are immobilized by Na+ channel fast inactivation. Neuron. 22:73–87. [DOI] [PubMed] [Google Scholar]
- Chiamvimonvat, N., M.T. Pérez-Garcia, R. Ranjan, E. Marban, and G.F. Tomaselli. 1996. Depth asymmetries of the pore-lining segments of the Na+ channel revealed by cysteine mutagenesis. Neuron. 16:1037–1047. [DOI] [PubMed] [Google Scholar]
- Cohen, C.J., B.P. Bean, T.J. Colatski, and R.W. Tsien. 1981. Tetrodotoxin block of Na+ channels in rabbit Purkinje fibers: the interactions between toxin binding and channel gating. I. Gen. Physiol. 78:383–411. [DOI] [PMC free article] [PubMed] [Google Scholar]
- Cowen, J.A. 1997. Inorganic Biochemistry: An Introduction. 2nd ed. John Wiley & Sons, New York, NY. 440 pp.
- Eaholtz, G., T. Scheuer, and W.A. Catterall. 1994. Restoration of inactivation and block of open sodium channels by an inactivation gate peptide. Neuron. 12:1041–1048. [DOI] [PubMed] [Google Scholar]
- Elinder, F., R. Mannikko, and H.P. Larsson. 2001. S4 charges move close to residues in the pore domain during activation in a K channel. J. Gen. Physiol. 118:1–10. [DOI] [PMC free article] [PubMed] [Google Scholar]
- Ellinor, P.T., J. Yang, W.A. Sather, J. Zhang, and R.W. Tsien. 1995. Ca2+ channel selectivity at a single locus for high-affinity Ca2+ interactions. Neuron. 15:1121–1132. [DOI] [PubMed] [Google Scholar]
- Evans, H.T. 1992. Ionic radii in crystals. In CRC Handbook of Chemistry and Physics. 73rd ed. D.R. Lide, editor. CRC Press, Boca Raton, FL. 12-8–12-9.
- Favre, I., E. Moczydlowski, and L. Schild. 1996. On the structural basis for ionic selectivity among Na+, K+, and Ca2+ in the voltage-gated Na+ channel. Biophys. J. 71:3110–3125. [DOI] [PMC free article] [PubMed] [Google Scholar]
- Frelin, C., C. Cognard, P. Vigne, and M. Lazdunski. 1986. Tetrodotoxin-sensitive and tetrodotoxin-resistant Na+ channels differ in their sensitivity to Cd2+ and Zn2+. Eur. J. Pharmacol. 122:245–250. [DOI] [PubMed] [Google Scholar]
- Gandhi, C.S., E. Clark, E. Loots, A. Pralle, and E.Y. Isacoff. 2003. The orientation and molecular movement of a K+ channel voltage-sensing domain. Neuron. 40:515–525. [DOI] [PubMed] [Google Scholar]
- Heinemann, S. H., H. Terlau, W. Stuhmer, K. Imoto, and S. Numa. 1992. Calcium channel characteristics conferred on the sodium channel by single mutations. Nature. 356:441-443. [DOI] [PubMed] [Google Scholar]
- Hess, P., and R.W. Tsien. 1984. Mechanisms of ion permeation through calcium channels. Nature. 309:453–456. [DOI] [PubMed] [Google Scholar]
- Hilber, K., W. Sandtner, O. Kudlacck, I.W. Glaaser, E. Weiszi, J.W. Kyle, R.J. French, H.A. Fozzard, S.C. Dudley, and H. Todt. 2001. The selectivity filter of the voltage-gated sodium channel is involved in channel activation. J. Biol. Chem. 276:27831–27839. [DOI] [PubMed] [Google Scholar]
- Ikeda, S.R., and G.G. Schofield. 1987. Tetrodotoxin-resistant sodium current of rat nodose neurons: monovalent cation selectivity and divalent cation block. J. Physiol. 389:255–270. [DOI] [PMC free article] [PubMed] [Google Scholar]
- Kleinhaus, A.L., and J.W. Pritchard. 1976. Sodium-dependent tetrodotoxin-resistant action potentials in leech neurons. Brain Res. 102:368–373. [DOI] [PubMed] [Google Scholar]
- Kuhn, F.J., and N.G. Greeff. 2002. Mutation D384N alters recovery of the immobilized gating charge in rat brain IIA sodium channels. J. Membr. Biol. 185:145–155. [DOI] [PubMed] [Google Scholar]
- Kuo, C.-C. 1998. Imipramine inhibition of transient K+ current: an external open channel blocker preventing fast inactivation. Biophys. J. 75:2845–2857. [DOI] [PMC free article] [PubMed] [Google Scholar]
- Kuo, C.-C., and B.P. Bean. 1993. G-protein modulation of ion permeation through N-type calcium channels. Nature. 365:258–262. [DOI] [PubMed] [Google Scholar]
- Kuo, C.-C., and P. Hess. 1993. a. Ion permeation through the L-type Ca2+ channel in rat phaeochromocytoma cells: two sets of ion binding sites in the pore. J. Physiol. 466:629–655. [PMC free article] [PubMed] [Google Scholar]
- Kuo, C.-C., and P. Hess. 1993. b. Characterization of the high-affinity Ca2+ binding sites in the L-type Ca2+ channel pore in rat phaeochromocytoma cells. J. Physiol. 466:657–682. [PMC free article] [PubMed] [Google Scholar]
- Kuo, C.-C., and S.-Y. Liao. 2000. Facilitation of recovery from inactivation by external Na+ and location of the activation gate in neuronal Na+ channels. J. Neurosci. 20:5639–5646. [DOI] [PMC free article] [PubMed] [Google Scholar]
- Kuo, C.-C., T.-J. Lin, and C.-P. Hsieh. 2002. Effect of Na+ flow on Cd2+ block of tetrodotoxin-resistant Na+ channels. J. Gen. Physiol. 120:159–172. [DOI] [PMC free article] [PubMed] [Google Scholar]
- Lansman, J.B. 1990. Blockade of current through single calcium channels by trivalent lanthanide cations: effect of ionic radius on the rates of ion entry and exit. J. Gen. Physiol. 95:679–696. [DOI] [PMC free article] [PubMed] [Google Scholar]
- Lipkind, G.M., and H.A. Fozzard. 1994. A structural model of the tetrodotoxin and saxitoxin binding site of the Na+ channel. Biophys. J. 66:1–13. [DOI] [PMC free article] [PubMed] [Google Scholar]
- Liu, Y., M.F. Jurman, and G. Yellen. 1996. Dynamic rearrangement of the outer mouth of a K+ channel during gating. Neuron. 16:859–867. [DOI] [PubMed] [Google Scholar]
- Lombet, A., C. Frelin, J.F. Renaud, and M. Lazdunski. 1982. Na+ channels with binding sites of high and low affinity for tetrodotoxin in different excitable and nonexcitable cells. Eur. J. Biochem. 124:199–203. [DOI] [PubMed] [Google Scholar]
- Molina, A., P. Ortega-Saenz, and J. Lopez-Barneo. 1998. Pore mutations alter closing and opening kinetics in Shaker K+ channels. J. Physiol. 509:327–337. [DOI] [PMC free article] [PubMed] [Google Scholar]
- Nieboer, E. 1975. The Lanthanide ions as structural probes in biological and model systems. Structure Bonding. 22:1–47. [Google Scholar]
- Ogielska, E.M., and R.W. Aldrich. 1999. Functional consequences of a decreased potassium affinity in a potassium channel pore: ion interactions and C-type inactivation. J. Gen. Physiol. 113:347–358. [DOI] [PMC free article] [PubMed] [Google Scholar]
- Panyi, G., Z. Sheng, L. Tu, and C. Deutsch. 1995. C-type inactivation of a voltage-gated K+ channel occurs by a cooperative mechanism. Biophys. J. 69:896–903. [DOI] [PMC free article] [PubMed] [Google Scholar]
- Pérez-Garcia, M.T., N. Chiamvimonvat, E. Marban, and G.F. Tomaselli. 1996. Structure of the sodium channel pore revealed by serial cysteine mutagenesis. Proc. Natl. Acad. Sci. USA. 93:300–304. [DOI] [PMC free article] [PubMed] [Google Scholar]
- Pérez-Garcia, M.T., N. Chiamvimonvat, R. Ranjan, J.R. Balser, G.F. Tomaselli, and E. Marban. 1997. Mechanisms of sodium/calcium selectivity in sodium channels probed by cysteine mutagenesis and sulfhydryl modification. Biophys. J. 72:989–996. [DOI] [PMC free article] [PubMed] [Google Scholar]
- Ravindran, A., L. Schild, and E. Moczydlowski. 1991. Divalent cation selectivity for external block of voltage-dependent Na+ channels prolonged by Batrachotoxin: Zn2+ induces discrete substates in cardiac Na+ channels. J. Gen. Physiol. 97:89–115. [DOI] [PMC free article] [PubMed] [Google Scholar]
- Richens, D.T. 1997. The Chemistry of Aqua Ions. John Wiley & Sons, West Sussex, England.
- Roy, M.L., and T. Narahashi. 1992. Differential properties of tetrodotoxin-sensitive and tetrodotoxin-resistant sodium channels in rat dorsal root ganglion neurons. J. Neurosci. 12:2104–2111. [DOI] [PMC free article] [PubMed] [Google Scholar]
- Rush, A.M., M.E. Brau, A.A. Elliott, and J.R. Elliott. 1998. Electrophysiological properties of sodium current subtypes in small cells from adult rat dorsal root ganglia. J. Physiol. 511:771–789. [DOI] [PMC free article] [PubMed] [Google Scholar]
- Satin, J., J.W. Kyle, M. Chen, P. Bell, L.L. Cribbs, H.A. Fozzard, and R.B. Rogart. 1992. A mutant of TTX-resistant cardiac sodium channels with TTX-sensitive properties. Science. 256:1202–1205. [DOI] [PubMed] [Google Scholar]
- Scholz, A., N. Kuboyama, G. Hempelmann, and W. Vogel. 1998. Complex blockade of TTX-resistant Na+ currents by lidocaine and bupivacaine reduce firing frequency in dorsal root ganglion neurons. J. Neurophysiol. 79:1746–1754. [DOI] [PubMed] [Google Scholar]
- Sheets, M.F., and D.A. Hanck. 1992. Mechanisms of extracellular divalent and trivalent cation block of the sodium current in canine cardiac Purkinje cells. J. Physiol. 454:299–320. [DOI] [PMC free article] [PubMed] [Google Scholar]
- Starkus, J.G., L. Kuschel, M.D. Rayner, and S.H. Heinemann. 1997. Ion conduction through C-type inactivated Shaker channels. J. Gen. Physiol. 110:551–564. [DOI] [PMC free article] [PubMed] [Google Scholar]
- Sun, Y.-M., I. Favre, L. Schild, and E. Moczydlowski. 1997. On the structural basis for size-selective permeation of organic cations through the voltage-gated sodium channel: effect of alanine mutations at the DEKA locus on selectivity, inhibition by Ca2+ and H+, and molecular sieving. J. Gen. Physiol. 110:693–715. [DOI] [PMC free article] [PubMed] [Google Scholar]
- Talavera, K., A. Janssens, N. Klugbauer, and G. Droogmans. 2003. Pore structure influences gating properties of the T-type Ca2+ channel α1G. J. Gen. Physiol. 121:529–540. [DOI] [PMC free article] [PubMed] [Google Scholar]
- Tate, S., S. Benn, C. Hick, D. Trezise, V. John, R.J. Mannion, M. Costigan, C. Plumpton, D. Grose, Z. Gladwell, et al. 1998. Two sodium channels contribute to the TTX-R sodium current in primary sensory neurons. Nat. Neurosci. 1:653–655. [DOI] [PubMed] [Google Scholar]
- Tomaselli, G.F., N. Chiamvimonvat, H.B. Nuss, J.R. Balser, M.T. Pérez-Garcia, R.H. Xu, D.W. Orias, P.H. Backx, and E. Marban. 1995. A mutation in the pore of the sodium channel alters gating. Biophys. J. 68:1814–1827. [DOI] [PMC free article] [PubMed] [Google Scholar]
- Townsend, C., and R. Horn. 1999. Interaction between the pore and a fast gate of the cardiac sodium channel. J. Gen. Physiol. 113:321–331. [DOI] [PMC free article] [PubMed] [Google Scholar]
- Tsushima, R.G., R.A. Li, and P.H. Backx. 1997. P-loop flexibility in Na+ channel pores revealed by single- and double-cysteine replacements. J. Gen. Physiol. 110:59–72. [DOI] [PMC free article] [PubMed] [Google Scholar]
- Vassilev, P.M., T. Scheuer, and W.A. Catterall. 1988. Identification of an intracellular peptide segment involved in sodium channel inactivation. Science. 241:1658–1661. [DOI] [PubMed] [Google Scholar]
- Visentin, S., A. Zaza, A. Ferroni, C. Tromba, and C. DiFrancesco. 1990. Sodium current block caused by group IIb cations in calf Purkinje fibers and in guinea-pig ventricular myocytes. Pflugers Arch. 417:213–222. [DOI] [PubMed] [Google Scholar]
- West, J.W., D.E. Patton, T. Scheuer, Y. Wang, A.L. Goldin, and W.A. Catterall. 1992. A cluster of hydrophobic amino acid residues required for fast Na+ channel inactivation. Proc. Natl. Acad. Sci. USA. 89:10910–10914. [DOI] [PMC free article] [PubMed] [Google Scholar]
- Xiong, W., R.A. Li, Y. Tian, and G.F. Tomaselli. 2003. Molecular motions of the outer ring of charge of the sodium channel: do they couple to slow inactivation? J. Gen. Physiol. 122:323–332. [DOI] [PMC free article] [PubMed] [Google Scholar]
- Yang, J., P.T. Ellinor, W.A. Sather, J.-F. Zhang, and R.W. Tsien. 1993. Molecular determinants of Ca2+ selectivity and ion permeation in L-type Ca2+ channels. Nature. 366:158–161. [DOI] [PubMed] [Google Scholar]
- Yang, Y.-C., and C.-C. Kuo. 2003. The position of the fourth segment of domain 4 determines status of the inactivation gate in Na+ channels. J. Neurosci. 23:4922–4930. [DOI] [PMC free article] [PubMed] [Google Scholar]
- Yellen, G., D. Sodickson, T.-Y. Chen, and M.E. Jurman. 1994. An engineered cysteine in the external mouth of a K+ channel allows inactivation to be modulated by metal binding. Biophys. J. 66:1068–1075. [DOI] [PMC free article] [PubMed] [Google Scholar]