

Abstract
Ion channels of high conductance (>200 pS) are widespread among prokaryotes and eukaryotes. Two examples, the Escherichia coli mechanosensitive ion channels Ec-MscS and Ec-MscL, pass currents of 125–300 pA. To resolve temporal details of conductance transitions, a patch-clamp setup was optimized for low-noise recordings at a time resolution of 3 μs (10–20 times faster than usual). Analyses of the high-resolution recordings confirm that Ec-MscL visits many subconductance states and show that most of the intersubstate transitions occur more slowly than the effective resolution of 3 μs. There is a clear trend toward longer transition times for the larger transitions. In Ec-MscS recordings, the majority of the observed full conductance transitions are also composite. We detected a short-lived (∼20 μs) Ec-MscS substate at 2/3 of full conductance; transitions between 2/3 and full conductance did not show fine structure and had a time course limited by the achieved resolution. Opening and closing transitions in MscS are symmetrical and are not preceded or followed by smaller, rapid currents (“anticipations” or “regrets”). Compared with other, lower-conductance channels, these measurements may detect unusually early states in the transitions from fully closed to fully open. Increased temporal resolution at the single-molecule level reveals that some elementary steps of structural transitions are composite and follow several alternative pathways, while others still escape resolution. High-bandwidth, low-noise single-channel measurements may provide details about state transitions in other high-conductance channels; and similar procedures may also be applied to channel- and nanopore-based single-molecule DNA measurements.
Keywords: MscL, MscS, patch clamping, single channel, substate
INTRODUCTION
Bacterial mechanosensitive (MS) channels of large and small conductance (MscL and MscS) belong to a class of proteins that play an important role in bacterial osmoregulation. Crystal structures of two such channels, Ec-MscL and Ec-MscS, have recently been resolved at 3.5 and 3.9 Å, respectively (Chang et al., 1998; Bass et al., 2002). These structures have been useful as starting coordinates for a number of molecular dynamics (MD) simulations (Elmore and Dougherty, 2001; Anishkin et al., 2003; Colombo et al., 2003) and as a reference in developing models of channel gating from biophysical data, such as from EPR experiments (Perozo et al., 2002a,b). Though the ultimate aim of MD simulations and biophysical experiments is to determine the structural trajectory of the channel from the closed to the open state, challenges remain: (a) MD simulations require unrealistic forces to evoke mechanosensitive channel gating transition during the accessible time frame at the present state of available computing power; and (b) experiments to date give information on either the closed or some undetermined open states, with little information on the dynamics of channel opening. Most information on mechanosensitive channel dynamics has come from kinetic analysis of electrophysiological data. Though such data cannot describe atomic-scale structural rearrangements that occur during channel gating, the observed conductance transitions represent a time-resolved free energy profile and presumably reveal changes in pore diameter at any given time during gating.
The development of high-speed, low-noise recording methodology will allow a more detailed description of channel dynamics and lead to a better understanding of ion channel function. Recent advances in electrophysiological equipment allow high bandwidth studies, such as resolving the gating currents of Shaker K+ channels (Sigg et al., 2003) at a bandwidth of 350 kHz. Thus far, however, no data at comparable resolution have been acquired at the single-channel level or for mechanosensitive channel activity. MscL and MscS ion channels are appropriate for study with high-speed methodology, because their large conductance, 1–3 nS (Sukharev et al., 1993; Hase et al., 1995; Sukharev et al., 1999) allows one to detect transitions despite the inevitable increase in noise as higher frequencies are included. For the most part, the studies of single MS channel activity are normally performed at a bandwidth of 10 kHz and give a limited detail on MS channel kinetics. Thus Ec-MscS kinetics are considered to be very simple with only one conductive state reported previously (Martinac et al., 1987; Sukharev, 2002).
Here we report and exploit techniques that use high temporal resolution but also limit the noise in single-channel recording instrumentation. Single-channel data on Ec-MscL and Ec-MscS were acquired at a time resolution of ∼3 μs, a 10–20-fold higher resolution than previously used for studies on these (Sukharev et al., 1999; Sukharev, 2002; Anishkin et al., 2003) or other channels. The acquisition of Ec-MscL and Ec-MscS currents at an effective bandwidth of ∼250 kHz has allowed us to observe and analyze previously undefined features of single-channel kinetics.
MATERIALS AND METHODS
Reconstitution of Ec-MscL and Ec-MscS Proteins into Artificial Liposomes
Ec-MscL Reconstitution
Ec-MscL was a generous gift from the Doug Rees group at California Institute of Technology (Chang et al., 1998). Vesicle reconstitution of Ec-MscL was performed as previously described (Sukharev et al., 1993; Hase et al., 1995). In brief, 50 μl of azolectin dissolved in chloroform (500 mg/ml) was dried on a glass surface and then resuspended into 950 μl of 23 mg/ml choline and 10 mM MOPS at pH 7.2. This suspension was sonicated at 60°C for 20 min, and then 50 μl of protein (20 mg/ml) in 0.05% DDM was added to the mixture (protein to lipid ratio of ∼1:2,500), and it was vortexed briefly. Small unilamellar vesicles were formed by dilution of the mixture in 2000 ml of 5 mM HEPES, pH 7.2, over 24 h in a rotating chamber with a membrane having a molecular weight cutoff of 5 kD. Aliquots of small unilamellar vesicles (50 μl) were dried on Teflon in a vacuum over 2 h and then rehydrated overnight via addition of a small drop of rehydration buffer (250 mM KCl, 5 mM HEPES, 0.2 mM EDTA, pH 7.2) so that the resultant lipid concentration was 100 mg/ml. An aliquot of the multilamellar vesicles formed by this procedure were dispersed into a recording chamber containing 400 μl of 200 mM KCl, 40 mM MgCl2, 10 mM MOPS at pH 7.2, and blister formation was allowed to proceed for 30 min.
Ec-MscS Reconstitution
Protein was provided by Doug Rees group (Bass et al., 2002). For the reconstitution of Ec-MscS, 10 μl of azolectin dissolved in methanol (100 mg/ml) was transferred to a small cavity formed on a Teflon surface and allowed to dry until the majority of methanol was evaporated. 3 μl of a 15 mg/ml solution of Ec-MscS protein in 0.05% foscholine-14 was then mixed with the lipid by repetitive pipetting (protein to lipid ratio of ∼1:3,000), and the mixture was dehydrated overnight with Drierite. The pellet formed from this dehydration was rehydrated with 5 μl of rehydration buffer for 2 h. If necessary the rehydrated pellet was stored at 4°C in a Petri dish on a wet paper towel for several weeks. 1 μl of this rehydrated lipid was applied to the glass coverslide of the electrophysiological recording cell and allowed to dry for 10 min. 0.5 μl of 400 mg/ml MgCl2 solution was then spread on the coverslide and dried for 10 min. Then 400 μl of rehydration buffer was added to the recording cell, and blister formation was allowed to proceed for 30 min (Clayton et al., 2004).
Instrumentation for Low-noise and High Frequency Acquisition
Several modifications were made to the electrophysiological recording rig to enable the acquisition of high temporal resolution and low-noise current traces. A specially modified headstage (Axon Instruments) was used that had a low-noise field-effect transistor substituted at the input stage (FET model no. Axon 4600–005; Axon Instruments). The headstage was modified mechanically to house a special Teflon pipette holder as previously described (Parzefall et al., 1998). To decrease stray capacitance, thick-wall, hard borosilicate (WPI 1B150F-4; World Precision Instruments) or quartz (Sutter QF150-75-7.5; Sutter Instrument) glass pipettes were used. These were pulled to form a tip opening of ∼1 μm. The Axopatch 200B amplifier was modified to bypass the internal filters, and the differentiator was modified so that the gain was decreased 10-fold in order to increase the bandwidth.
Other modifications decreased the interference produced by power supplies and other sources in the environment. The Faraday cage was an Al garden shed (House of Redwood) scraped to remove paint at joints, and fitted with an Al floor. The switching power supply was removed from the Axopatch 200B amplifier, placed outside the Faraday cage in a separate enclosure, and powered by an isolating transformer (0211T35ST; Topaz Electronics). The microscope bulb was powered by a 12-V battery. After a gigaohm seal was formed and the pipette tip positioned, the power supply of the piezoelectric micromanipulators (Burleigh PCS-5000) was shut off. The internal wiring that fed the piezos was connected to the common ground. In general, ground loops were eliminated. Additional shielding was employed by forming a small cover of aluminum foil around the recording chamber.
While these modifications dramatically decreased apparent peak-to-peak and rms noise, they did not completely abolish peaks in the noise spectrum from external sources (Fig. 1 B). When the reset circuitry of the headstage, as shipped by supplier, was tuned for maximum suppression of capacitive reset transients, it produced a noticeable interference pattern that had a characteristic frequency ramping from 500 kHz down to 300 kHz. This interference pattern clearly correlated to the accumulated charge on the feedback capacitor. We therefore tuned the compensation circuitry for a suitable compromise between compensation of reset transients and diminished interference by the reset circuitry.
Figure 1.

Sample step response and power spectra of signals recorded with the improved instrumentation. (A) Exemplar instrumentation step response. Transitions were generated by capacitively coupling a triangular waveform to the headstage in its working position with a gigaohm seal formed. The waveform amplitude and the distance from the electrode to the recording chamber were adjusted so that the amplitude of the injected current was equal to that of the studied Ec-MscS transitions (40 and 120 pA). The average transition time was 3 ± 0.2 μs. (B) Power spectrum representing a combination of baseline noise (smooth data) and interference (spikes). The gray trace shows data from the headstage, near the recording chamber and within the inner aluminum shield, with pipette holder, but without the pipette. The black trace shows data obtained with the pipette in solution and with a gigaohm seal formed on a membrane patch. Episodes were acquired between two consecutive resets of the feedback capacitance. Fast Fourier transforms employed the routine provided in CLAMPFIT 9. Area under the interference spikes comprises <6% of the total area under the curve for the gigaohm seal configuration.
Fig. 1 B shows power spectra generated from traces that measured levels of noise with a headstage in a working position inside a secondary shield both lacking the pipette and with the pipette forming a gigaohm seal on an artificial liposome. Intervals between two consecutive resets of a headstage feedback capacitor (15 s in a shielded headstage trace and 3 s in a sealed on liposome trace) were chosen for performing FFT transformations. It can be seen that at intermediate frequencies (100 Hz to 10 kHz), the thermal noise of the patch is clearly greater than the noise produced by the headstage electronics in a capacitive-feedback mode, whereas at frequencies >100 kHz both power spectra are similar. This suggests that in order to achieve low levels of noise at bandwidths >100 kHz, it is necessary to provide adequate shielding for the instrumentation in the immediate vicinity of the recording chamber. However, at bandwidths <50 kHz, it was critical to keep the stray capacitance as low as possible and the seal resistance as high as possible by using low-noise techniques, such as the use of quartz pipettes with small tip diameter (Hamill et al., 1981).
Single-channel Recordings
Prior to recordings, the response of the instrumentation was tested by capacitively feeding a 10-kHz square wave into the system. This was achieved by bringing an electrode connected to a triangle generator near the recording chamber (we verified that the transition from positive to negative slope occurred in <0.5 μs). The measurements were also performed after forming a gigaohm seal, essentially recreating conditions under which ion channel data were recorded. Waveform amplitude and the distance from the electrode to the recording chamber were adjusted so that the amplitude of the injected current was equal to that of the studied transitions (40 and 120 pA).
Single channel patch-clamp recordings were performed as previously described (Clayton et al., 2004), with 100 mV applied across the membrane (intracellular medium is negative) in symmetrical 250 mM KCl, 5 mM HEPES (pH 7.1). Suction was applied manually with a 5-ml syringe connected via plastic tubing to the pipette holder and monitored with a pressure transducer (243PC15M; Omega Engineering) powered by a custom made box that also provided an LED readout display. Currents were acquired with amplifier modified as described above and anti-alias filtered with an external 8-pole Bessel unit (AP220-5-FP; Avens Signal), with the anti-aliasing filter set at a bandwidth of 400 kHz. The ideal 10–90% rise time of such a filter is 1 μs; however, we found that a 1.5-kΩ resistor used to stabilize a cable connection introduced additional filtering, so that the 10–90% rise time measured with the square-wave stimulus was ∼2 μs, corresponding to an effective bandwidth of ∼250 kHz. Signals were digitized with a Digidata 1322A modified to run at 1 MHz (Axon Instruments), and recorded with pCLAMP 8 software (Axon Instruments). To reserve the full digitization bandwidth of 1 MHz for the measured current, the suction was monitored visually and was kept at a level corresponding to Popen of ∼0.5 (1 PSI for Ec-MscL and 0.6 PSI for Ec-MscS) during data acquisition. All recordings were done at room temperature.
Collection and Analyses of Inter-substate Transitions
Elementary transition events were collected using a template search routine from Clampfit 9. The template used in the collection procedure recognized currents that were constant for 10–20 μs before, and 10–20 μs after, the transition. For capacitively coupled test pulses of 40–120 pA (the amplitude of the single-channel transitions measured here), noise introduced an additional uncertainty of 0.5–1 μs when signals were retrospectively synchronized (see below), so that the measured 10–90% rise time was 3 μs (Table I, ΔI = 120 pA). To study Ec-MscS sojourns at 2/3 conductance, additional steps were taken to reliably identify transitions, due to low signal-to-noise ratio. Traces recorded at the full bandwidth of ∼250 kHz were first subjected to 100 kHz Gaussian digital filter, and the template search routine was then employed to identify downward transitions. Subsequently, fragments of original unfiltered traces were extracted starting 50 μs before the onset of the transition and with the duration of 350 μs for the purpose of dwell time identification. The fragments starting 30 μs before the transition and with a duration of 60 μs were used for sub-μs alignment as described below. A similar procedure was used to extract MscS substate-2/3 → full conductance transitions.
TABLE I.
10-90 Transition Times
| To/from 2/3 conductance | To/from fully closed | |||
|---|---|---|---|---|
| Average 10-90 transition times (μs) | Test pulses ΔI = 40 pA |
MscS 2/3 ↔ Open ΔI = 40 pA |
Test pulses ΔI = 120 pA |
MscS Closed ↔ Open ΔI = 120 pA |
| To fully open | 2.9 ± 0.2 | 3.2 ± 0.15 | 3.0 ± 0.1 | 5.5 ± 0.15 |
| From fully open | 3.0 ± 0.3 | 3.1 ± 0.1 | 2.9 ± 0.2 | 5.2 ± 0.2 |
Average 10-90% transition times of Ec-MscS compared to test step responses. Presented are transitions between closed and fully open states as well as between substates-2/3 and full conductance.
Individual MscL/MscS transitions as well as test pulse responses were fitted with
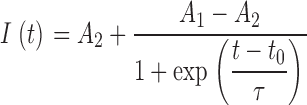 |
(a Boltzman function), where A 1 and A 2 are the amplitudes before and after the transition, t 0 and τ are the transition midpoint and the slope at midpoint correspondingly. The slopes at the midpoint were collected and converted to 10–90% transition times (T 10-90 = 2*ln(9)*τ). Transition amplitudes were also collected for the analysis of MS ion channel activity.
Retrospective alignment of selected transitions with sub-μs resolution was performed using software developed in house, and realigned fragments were averaged. In some cases, remaining interference was eliminated as follows: the averaged traces were fit with the sum of two sine waves at frequencies corresponding to the major interference peaks in the power spectrum (∼125 and 250 kHz; Fig. 1) and the resultant waveform was subtracted. Ec-MscS dwell times at substate-2/3 were accumulated with the use of the single-channel search routine of Clampfit 9, applied to the extracted fragments.
RESULTS
Summary of the Methods
Many aspects of patch-clamp instrumentation were modified in order to achieve test traces with 10–90% rise time of 3 μs for current transitions on the order of 40–200 pA (Fig. 1 A), which is the signal produced by MscL and MscS channels in our experiments. We used quartz micropipettes in a patch-clamp headstage with a modified circuit. We reconfigured filtering and amplification functions of the subsequent stages. We employed a faster analog-to-digital converter than usual. Several layers of electrostatic and electromagnetic shielding protected the rig. The bandwidth of this instrumentation corresponded to ∼250 kHz (Fig. 1 B), and the total rms noise was ∼12.7 pA. Our analyses made use of template-matching routines that aligned noisy traces to produce averages.
To exploit these advances in instrumentation, we required patch-clamp seals of higher resistance (>3 GΩ) than the usual spheroplast recordings. Therefore we employed reconstituted vesicle preparations for both MscL and MscS recordings. The most stable recordings were obtained from unilamellar blisters on artificial liposomes. These were produced in adequate numbers from multilamellar vesicles by a rehydration/dehydration cycle (Sukharev et al., 1993), modified and performed directly in the recording chamber (Clayton et al., 2004).
Ec-MscL channel demonstrates rich gating kinetics as evidenced by traces of activity at a bandwidth of ∼250 kHz
Fig. 2 presents fragments of Ec-MscL activity recorded at ∼250 kHz. The top panel shows a sample of typical Ec-MscL activity, and the middle and the bottom panels show an individual full conductance transition at full bandwidth and further digitally filtered at 10 kHz, respectively. Comparison of the middle and bottom panels shows that at the higher bandwidth, the channel activity is captured in greater detail. Traces at 10 kHz (bottom panel) make the majority of transitions appear smooth, and there are few, if any, datapoints present at substate conductances. In contrast, recordings performed at the full bandwidth of ∼250 kHz (middle panel) show that all of the transitions are significantly faster than those on 10-kHz traces, and the substates are represented by multiple datapoints (acquisition interval was 1 μs). Visual inspection of Ec-MscL traces reveals the existence of a large number of different subconductive states, more than the five (Sukharev et al., 1999) or seven (Sukharev et al., 2001) that have been previously reported.
Figure 2.

Sample Ec-MscL channel activity. Data were acquired at a bandwidth of ∼250 kHz. The top panel shows 1.2 s of Ec-MscL activity, the middle and bottom panels present an individual full conductance transition. The data in the bottom panel were further digitally filtered to a bandwidth of 10 kHz.
Most Ec-MscL Transitions Are Slower Than Test 10–90% Rise Time
We analyzed 672 intersubstate transitions using an automated search routine that (a) used the instruments' response to test pulses as a template and (b) accepted transitions of any amplitude (examples shown in Fig. 3 A). The noise level with the anti-aliasing filter set at 400 kHz allowed collection of transitions with amplitudes >30 pA. Collected transition amplitudes ranged up to 220 pA, and transition times (10–90%) ranged from ∼2 to ∼40 μs. These sections of the recordings thus represent the definition of “elementary” Ec-MscL transitions as resolved in the present study. By definition, one may not analyze events faster than the response of the recording instrumentation (10–90% rise time of ∼3 μs). We point out, however, (a) that some of these transitions show two or three datapoints (1 μs acquisition rate) at intermediate amplitudes, consistent with the presence of unresolved substates, but (b) that most transitions have a smooth time course, with no evidence for the presence of intermediate amplitudes.
Figure 3.

Analysis of Ec-MscL transitions. The dataset consisted of 672 transitions between arbitrary substates defined by the search routine as having no detectable intermediate phase (see text). (A) 10 exemplar transitions randomly selected from the dataset and aligned at the starting amplitude. Short horizontal lines indicate the final amplitude level for each transition. (B) Analysis of the 672 transitions. The central plot is a scatterplot of individual transition amplitudes and transition times (10–90%). The horizontal histogram presents the distribution of transition times. The vertical histogram presents the distribution of transition amplitudes.
Fig. 3 B shows a scatterplot of transition amplitudes versus 10–90% transition times. There is a clear trend toward longer transition times for the larger transitions. While the broad distribution of datapoints on this plot does not allow the identification of a unique functional relationship, linear fits to the dataset on log-linear (Fig. 3 B) or linear-linear scales (not depicted) resulted in a correlation coefficient of 0.6.
The individual distributions of the transition amplitudes and their durations are also presented in Fig. 3 B, and complementary plots are aligned with the corresponding axes. Both distributions are smooth, lacking distinguishable subpeaks. This plot also shows that the average observed 10–90% transition time (6.2 ± 0.2 μs) is significantly greater than that of the test pulses (3.0 ± 0.2 μs). These results suggest that, on average, Ec-MscL transitions are longer than the response of instrumentation; however, their fine details still escape resolution at the effective bandwidth of ∼250 kHz. We note that the presence of a large number of substate conductances resulted in continuous distributions of their amplitudes and durations (Fig. 3 B). The plot and average time for downward transitions was essentially identical to the data for upward transitions (unpublished data).
Ec-MscS Has Conductance Substates
Fig. 4 A presents samples of Ec-MscS activity recorded at ∼250 kHz with 100 mV applied across the membrane. The top panel shows 12 s of typical single-channel activity, illustrating the simpler kinetics of Ec-MscS as compared with Ec-MscL (Fig. 3 A). The middle and bottom panels show both an individual transition from the closed to the fully open state, and a sojourn in a subconductance state of ∼2/3 full conductance (denoted “substate-2/3”). The middle subpanel shows data at full bandwidth and the bottom subpanel shows the same fragments further filtered at 10 kHz with a Gaussian digital filter. The sojourn in substate-2/3 is resolved more completely at 250 kHz than at 10 kHz. Control recordings of liposomes formed following a reconstitution procedure performed with a buffer containing only Foscholine-14 (0.05%) and without Ec-MscS protein did not show any activity (unpublished data).
Figure 4.

Ec-MscS transitions fall into two classes. The analysis uses the procedures of Fig. 3. (A) Sample Ec-MscS activity. The top panel displays 12 s of sample Ec-MscS activity at full bandwidth of ∼250 kHz. The middle and the bottom panels show a full conductance opening transition followed (after a break of several hundred ms) by a brief sojourn in “substate-2/3”. The data in the bottom panel were further filtered at 10 kHz by a Gaussian digital filter. (B) Analysis of 302 collected transitions. The central plot is a scatterplot of individual transition amplitudes and transition times (10–90%). The horizontal histogram presents the distribution of transition times and the vertical histogram presents the distribution of transition amplitudes.
We performed the transition collection and analysis following the procedure described above for the Ec-MscL channel. Fig. 4 B shows the scatterplot of transition amplitudes versus 10–90% transition times as well as the individual distributions of these values. The scatterplot shows that datapoints form two groups with average amplitudes of ∼40 and 120 pA, corresponding to the observed transitions, closed ↔ fully open state and substate-2/3 ↔ fully open state. There were very few transitions, closed state ↔ substate-2/3, and this observation is equivalent to the observation that only a few datapoints lie in the region of ∼80 pA amplitude and ∼3 μs duration.
To investigate the substate-2/3 in greater detail, we analyzed a set of 370 sojourns in this substate. The distribution of the identified dwell times is presented in Fig. 5 B. As can be seen, the dwell times are exponentially distributed and have a time constant of 19 ± 4 μs. We have also performed alignment of the extracted fragments that enclose downwards transitions (unpublished data). The post-transition region of the average waveform yielded an exponential relaxation toward the fully open state with a time constant of 21 ± 4 μs, showing good agreement between these two analyses of the same events. It should be noted that in order to achieve a reasonable rate of false positives during transition identification, we have used a template that had a 10-μs long post-transition interval with constant amplitude. This procedure may overestimate the average dwell time of substate-2/3. Other recordings suggest that the MscS channel has additional, longer-lived substates of partial conductance (Martinac et al, 1987; Lee, L. W., personal communication); these sojourns have not been analyzed systematically.
Figure 5.

Analysis of Ec-MscS transitions. (A) An exemplar fragment of Ec-MscS activity. This trace contains a transition from the closed state to the fully open state, followed by a sojourn in substate-2/3 (see text). Recordings were performed at 100 mV membrane potential. (B) Distribution of dwell times for 370 sojourns in substate-2/3. The transition amplitude of ∼40 pA represents the approximate lower limit of our analysis procedures at ∼250 kHz. Therefore instead of directly applying a single-channel search algorithm, full → to substate-2/3 transitions were identified with the help of a template search procedure. Fragments starting 50 μs before the transition onset and with duration of 350 μs were collected, and dwell times were then extracted using the single-channel search routine of Clampfit 9. An exponential fit to the data yielded a time constant of 19 ± 4 μs, and this time constant is superimposed on the data. The inset shows an exponential relaxation toward the fully open state with the time course corresponding to that of the dwell time distribution, observed in the average of 370 sojourns aligned by the transition into the substate. (C) Top, retrospectively aligned and averaged full conductance (120 pA) transitions in upwards and downwards directions (47 and 53 transitions, respectively). Bottom, the upwards and downwards transitions are added. Points show 0.5-μs intervals. The dotted traces show SEM, indicating that there are no deviations from the open or closed state preceding or following the transitions. (D) The analysis of C is repeated for the transitions between 2/3 conductance and full conductance (224 and 278 transitions to and from substate-2/3, respectively). (E) Cartoons show that the data rule out several types of possible complications to the transitions. These complications are termed overshoot, anticipation, and regret. Based on the analysis of C and D, such complications, if present at all, have average amplitudes <5% of the full Ec-MscS transition.
Full Conductance Ec-MscS Transitions Can Be Resolved, Suggesting At Least One Intermediate State
To better characterize individual transitions, we analyzed the time course of full conductance Ec-MscS openings that were instantaneous at the temporal resolution of previously published studies. The collected transitions as well as the responses to test pulses having a matching amplitude of ∼120 pA were individually fit with a Boltzmann function as described, and the individual slopes at the midpoints were converted to 10–90% transition times. The average transition times for Ec-MscS full conductance transitions and for test pulses are presented in Table I.
As can be seen, the 10–90% Ec-MscS transition times (5.4 ± 0.2 μs, average of the upwards and downwards) exceed those of the test pulses of corresponding amplitude (3.0 ± 0.2 μs). Inspection of the selected transitions shows that in many cases, multiple datapoints can be observed at intermediate conductance during the transition. While the time spent in these transients is typically smaller than the resolution achieved, it indicates that the majority of Ec-MscS transitions are in fact composite. We also noted that ∼10% of the transitions did have 10–90% times near the resolution limit of 3 μs.
We have also compared full conductance Ec-MscS openings and closings. Average 10–90% transition times are statistically equivalent at 5.4 ± 0.2 μs, as can be seen in Table I.
We searched for “anticipations” or “regrets”; that is for temporally correlated brief changes in the current before or after MscS transitions (Sigworth, 1986). As a first step, we performed retrospective alignment of fragments containing identified transitions in each direction (Fig. 5 C). Temporal distortions caused by the instruments, such as residual <1% creep right after the transition, may be a complicating factor when one tries to compare channel openings or closings to the step response. Therefore, we superimposed and added the aligned and averaged opening transitions to the corresponding closing transitions (Fig. 5 C, bottom subpanel). As can be seen from the figure, the transitions are symmetric and no statistically significant difference in their time course can be inferred from their average. The uncertainty in these measurements is ∼5 pA, or 4% of the full amplitude of the transition. This implies that, on a time scale of ∼3 μs and 4% of the transition amplitude, no anticipations precede channel opening or closing, and no regrets follow opening or closing. This conclusion is summarized in Fig. 5 E. The only possible exceptions would be a deviation before opening that is symmetric in time with a deviation before closing, and vice versa.
Substate-2/3 to Fully Open State Transitions of Ec-MscS Are Faster than ∼3 μs
We have analyzed substate-2/3 ↔ full conductance transitions of Ec-MscS in a manner similar to that described above. Visual observation of selected transitions showed no evidence of intermediate states. To test the limits of our knowledge about these transitions, we performed additional analyses (Fig. 6). Average 10–90% transition times both to and from fully open state are listed in Table I. As can be seen, average transition times match in both directions, and for both Ec-MscS transitions and test pulses, at 3 ± 0.2 μs on average. We have also performed retrospective alignment of extracted transitions as described above. Fig. 6 shows the superimposition of averaged Ec-MscS transitions and responses to test pulses (top panel) as well as difference of these averages (bottom panel). No significant variance can be observed in a subtraction plot.
Figure 6.

Ec-MscS full conductance ↔ substate-2/3 transitions are faster than the temporal resolution of the instruments. Top, 224 retrospectively aligned and averaged Ec-MscS transitions (0.5-μs intervals), as well as the averaged and aligned response to steps. A set of responses to square test pulses was collected with transition amplitude matching that of the investigated Ec-MscS transition (35–40 pA) and was aligned and averaged like the MscS data. Bottom, the two average traces are subtracted; dashed line represents SEM. The subtracted trace does not differ significantly from zero.
Taken together with the similarity between substate-2/3 ↔ full conductance Ec-MscS transitions and test pulse responses, this analysis allows us to conclude that the investigated transitions show no fine detail. Their time course is limited by the achieved resolution.
DISCUSSION
The optimized electrophysiological techniques allowed acquisition of single-channel data for MscL and MscS activity at a bandwidth of ∼250 kHz, ∼20-fold faster than previously used for recording single MS channel activity (Fig. 2). This recording speed allows a far more detailed description of single-channel activity, which is important for understanding the kinetics of channel gating and correlating them with the available structural information.
The high conductance of the MscL and MscS channels suggests a correspondingly large diameter, with opportunities for side chain and domain arrangements while the channel is partially conducting. Yet the MscL protein is smaller than most channel proteins. There is no reason to suspect that lower-conductance channels (such as those found in excitable cells and epithelia) occupy a smaller spectrum of states, but most of these states are presumably nonconducting and revealed only by gating currents (Sigg et al., 2003). Therefore, the present results are best viewed in a general context: the high conductance of these channels allows us to detect unusually early states in the transitions from fully closed to fully open. Data such as Fig. 3 emphasize the general point that conformational transitions in single protein molecules can follow several alternative trajectories, on time scales in the microsecond range.
In macroscopic averaged recordings, voltage-gated K+ channels manifest a gating charge motion, representing a conformational change, with a time constant <10 μs after a voltage step (Sigg et al., 2003). Acetylcholine receptor channels begin to open <10 μs after agonist appears nearby (Lester et al., 1980). Mechanosensitive transduction channels in hair cells begin to open within <40 μs during a stimulus (Corey and Hudspeth, 1979). This paper, like other attempts (Benndorf, 1995; Parzefall et al., 1998), extends high-frequency analyses of ion channels to the single-channel level.
Complex Ec-MscL Channel Kinetics Suggest Many States
Our results confirm and extend the complex nature of MscL channel kinetics. At lower frequencies, we and others (Sukharev et al., 1999; Shapovalov et al., 2003; Chiang et al., 2004; Clayton et al., 2004) find peaks in the all-points amplitude histogram at several intermediate amplitudes between the fully closed and fully open channel, suggesting that some conductance states are frequently visited. Interestingly, the observed number of Ec-MscL substates increases as more electrophysiological data becomes available; from five (Sukharev et al., 1999) to seven (Sukharev et al., 2001) and finally nine (Chiang et al., 2004) in the latest analysis of Ec-MscL activity in spheroplasts. We have analyzed all-points histograms like those of Chiang et al. (2004), and we agree that there are at least nine conductive substates during the single-channel activity of Ec-MscL. Moreover, we find a broad, featureless, smooth spectrum of intersubstate transition amplitudes and times (Fig. 3 B). The 10–90% rise times increase as the transition amplitude increases, again suggesting many unresolved substates. We believe that, even on time scale of 3 μs, the majority of Ec-MscL transitions are composite. Other recent data show that some transitions are asymmetric, involving just one or two of the five subunits (Shapovalov et al., 2003). These observations suggest that kinetic analyses based on a Markov model with discrete states may be inappropriate to describe Ec-MscL activity, as that would require a large number of substates with little basis for assigning the parameters. It may be more appropriate to employ schemes that emphasize continuous models (Levitt, 1989).
Properties of Elementary Transitions: Neither “Anticipation” Nor “Regret”
Although it is not yet clear which kinetic formalism will prove most fruitful for analyzing high-frequency data such as these, the experiments do support a major assumption of many formal kinetic schemes for ion channels, that conformational transitions show no history dependence. This observation derives from the observation that no detectable changes in conductance precede or follow upward and downward transitions; that is, the transitions show neither “anticipation” nor “regret”. In this analysis, applied to MscS, we added averaged upward and downward transitions and found no statistically significant deviation from zero (Fig. 5, C and D) (Sigworth, 1986). The result also implies that the transitions are symmetrical within statistical error. Summarizing these symmetries by a single parameter, the 10–90% times of the majority of full MscS transitions, although longer than the effective resolution, were similar for upward and downward transitions of the same magnitude for Ec-MscS (Table I). Although the 10–90% rise times for MscL transitions were broadly distributed, these distributions were similar for upward and downward transitions.
Ec-MscS Gating Is Also More Complex Than Previously Known
The majority of full conductance Ec-MscS transitions are slower than the instruments' resolution limit and display multiple datapoints at intermediate conductances during the time course of the transition. We conclude that full conductance Ec-MscS transitions are composite, though less complex than MscL transitions. A transition such as this, whose time course can be partially resolved, becomes subject to the question, “does the opening transition occur via the same set of intermediate states as the closing transition?” The observation of resolvable but symmetrical transitions is compatible with the idea that the channel protein does traverse the same set of states for openings as for closings. A contrasting mechanism would involve, for instance, closing into an absorbing state such as (a) inactivation in voltage-gated channels or (b) cross-linking in MscL Cys mutants (Sukharev et al., 2001; Shapovalov et al., 2003).
The observation that ∼10% of the transitions did have 10–90% times near the resolution limit of 3 μs is consistent with, but does not prove, the existence of a single state of intermediate conductance, with an exponentially distributed lifetime of 2–4 μs. This intermediate state would be reached from either the open or closed state.
High-speed recordings of Ec-MscS activity also allowed us to observe a previously unknown substate at 2/3 of full conductance, having an average dwell time of no longer than 20 μs. We do not believe that this substate-2/3 is also the postulated state usually visited during transitions between zero and full conductance; its lifetime would lengthen the transitions beyond the measured value. Instead, the substate-2/3 is probably a “dead-end” state reached only from the fully open state. A linear free-energy analysis of the partial and full transitions would clarify this point.
The Ec-MscS substate-2/3 ↔ full conductance transitions were the only transitions in this study that showed no detectable fine structure: they resembled the test pulses in their shape and duration (Fig. 6). Thus it can be said that the quest to resolve an elementary single-channel transition (Hamill et al., 1981) is still incomplete. The level of the accessible detail on Ec-MscS transitions that, at the effective resolution of 3 μs, appear as elementary is still apparently limited by the attained resolution of the electrophysiological setup and not by the properties of the channel itself.
Simulations and Measurements Are Still Greater Than Two Orders of Magnitude Apart
The observation that the majority of Ec-MscL and Ec-MscS transitions are slower than 3 μs has implications for simulations of channel dynamics. The general approach of MD simulations is to use the crystal structure as a starting point and to perform simulations of the channel openings by using available computing power. Though these experiments on membrane-embedded channels are by nature computationally challenging, recent advances in methodology and increases in available computing power have allowed simulating MscL channel dynamics on the timescale of 10 ns. These simulations do not yet realistically reveal major reorientation of the transmembrane helices, an event deemed necessary in order for large conductance channels to form a pore of ∼30 Å (Elmore and Dougherty, 2001). To facilitate a reorientation in the transmembrane helices on a 10-ns timescale, unphysiologically large forces needed to be applied (Colombo et al., 2003). However, the majority of transition durations observed in this study are on the order of 3–10 μs, demonstrating that there is a significant (300–1,000-fold) discrepancy between the timescale of simulation and experimental determination. The only distinct transition class observed during this study that was faster than or equal to 3 μs was the MscS substate-2/3 ↔ full conductance transition, representing a conductance change of only 40 pS. Although the present timescale of MD simulations is appropriate for modeling more moderate rearrangements of channel structure, new computational algorithms should be developed to exploit the ability to measure microsecond timescale gating events in mechanosensitive channels.
High Time Resolution, Low-noise Measurements of Current Transitions
Single-channel instrumentation has conventionally been optimized for the 5–100-pS ion channels common in excitable tissue and epithelia. High-conductance channels (>200 pS) are also widespread among prokaryotes (Korchev et al., 1998; Miles et al., 2002; Contreras et al., 2003; this paper) as well as among eukaryotes, where they occur in mitochondria (Mirzabekov et al., 1993), glial and other plasma membranes (Guibert et al., 1998; Liang et al., 2003), connexons (Contreras et al., 2003), and nuclear membranes (Danker et al., 2001). We hope that others will study these high-conductance channels with resolution similar to the present experiments. Also, single DNA molecules are being studied with high-conductance channels and with fabricated nanopores (Deamer and Branton, 2002; Sauer-Budge et al., 2003; Vercoutere et al., 2003). From the experimental viewpoint, we believe that straightforward modifications to the techniques presented here can bring the temporal resolution of single-channel recording to <1 μs.
Acknowledgments
We thank Fred Sigworth, Dennis Dougherty, and Doug Rees for guidance, Josef Dudel for instruction on optimizing headstages and quartz pipettes, Randal Bass and Yan Poon for protein samples, Lori Lee for providing unpublished data, Alan Finkel, Richard Lobdill, and Eric Fung for help with Axopatch and Digidata modifications, and Daniel Clayton for help with the manuscript and discussions.
This work was supported by a grant from the National Institutes of Health (GM-062532).
Olaf S. Andersen served as editor.
Abbreviations used in this paper: Ec-MscL, mechanosensitive channel of large conductance of E. coli; Ec-MscS, mechanosensitive channel of small conductance of E. coli; MD, molecular dynamics.
References
- Anishkin, A., V. Gendel, N.A. Sharifi, C.S. Chiang, L. Shirinian, H.R. Guy, and S. Sukharev. 2003. On the conformation of the COOH-terminal domain of the large mechanosensitive channel MscL. J. Gen. Physiol. 121:227–244. [DOI] [PMC free article] [PubMed] [Google Scholar]
- Bass, R.B., P. Strop, M. Barclay, and D.C. Rees. 2002. Crystal structure of Escherichia coli MscS, a voltage-modulated and mechanosensitive channel. Science. 298:1582–1587. [DOI] [PubMed] [Google Scholar]
- Benndorf, K. 1995. Low-noise recording. Single-Channel Recording. B. Sakmann and E. Neher, editors. Plenum Press, New York. 129–146.
- Chang, G., R.H. Spencer, A.T. Lee, M.T. Barclay, and D.C. Rees. 1998. Structure of the MscL homolog from Mycobacterium tuberculosis: a gated mechanosensitive ion channel. Science. 282:2220–2226. [DOI] [PubMed] [Google Scholar]
- Chiang, C.S., A. Anishkin, and S. Sukharev. 2004. Gating of the large mechanosensitive channel in situ: estimation of the spatial scale of the transition from channel population responses. Biophys. J. 86:2846–2861. [DOI] [PMC free article] [PubMed] [Google Scholar]
- Clayton, D., G. Shapovalov, J.A. Maurer, D.A. Dougherty, H.A. Lester, and G.G. Kochendoerfer. 2004. Total chemical synthesis and electrophysiological characterization of mechanosensitive channels from Escherichia coli and Mycobacterium tuberculosis. Proc. Natl. Acad. Sci. USA. 101:4764–4769. [DOI] [PMC free article] [PubMed] [Google Scholar]
- Colombo, G., S.J. Marrink, and A.E. Mark. 2003. Simulation of MscL gating in a bilayer under stress. Biophys. J. 84:2331–2337. [DOI] [PMC free article] [PubMed] [Google Scholar]
- Contreras, J.E., J.C. Saez, F.F. Bukauskas, and M.V. Bennett. 2003. Functioning of cx43 hemichannels demonstrated by single channel properties. Cell Commun. Adhes. 10:245–249. [DOI] [PubMed] [Google Scholar]
- Corey, D.P., and A.J. Hudspeth. 1979. Response latency of vertebrate hair cells. Biophys. J. 26:499–506. [DOI] [PMC free article] [PubMed] [Google Scholar]
- Danker, T., V. Shahin, A. Schlune, C. Schafer, and H. Oberleithner. 2001. Electrophoretic plugging of nuclear pores by using the nuclear hourglass technique. J. Membr. Biol. 184:91–99. [DOI] [PubMed] [Google Scholar]
- Deamer, D.W., and D. Branton. 2002. Characterization of nucleic acids by nanopore analysis. Acc. Chem. Res. 35:817–825. [DOI] [PubMed] [Google Scholar]
- Elmore, D.E., and D.A. Dougherty. 2001. Molecular dynamics simulations of wild-type and mutant forms of the Mycobacterium tuberculosis MscL channel. Biophys. J. 81:1345–1359. [DOI] [PMC free article] [PubMed] [Google Scholar]
- Guibert, B., R. Dermietzel, and D. Siemen. 1998. Large conductance channel in plasma membranes of astrocytic cells is functionally related to mitochondrial VDAC-channels. Int. J. Biochem. Cell Biol. 30:379–391. [DOI] [PubMed] [Google Scholar]
- Hamill, O.P., A. Marty, E. Neher, B. Sakmann, and F.J. Sigworth. 1981. Improved patch-clamp techniques for high-resolution current recording from cells and cell-free membrane patches. Pflugers Arch. 391:85–100. [DOI] [PubMed] [Google Scholar]
- Hase, C.C., A.C. Le Dain, and B. Martinac. 1995. Purification and functional reconstitution of the recombinant large mechanosensitive ion channel (MscL) of Escherichia coli. J. Biol. Chem. 270:18329–18334. [DOI] [PubMed] [Google Scholar]
- Korchev, Y.E., C.L. Bashford, C. Pederzolli, C.A. Pasternak, P.J. Morgan, P.W. Andrew, and T.J. Mitchell. 1998. A conserved tryptophan in pneumolysin is a determinant of the characteristics of channels formed by pneumolysin in cells and planar lipid bilayers. Biochem. J. 329(Pt 3):571–577. [DOI] [PMC free article] [PubMed] [Google Scholar]
- Lester, H.A., M.M. Nass, M.E. Krouse, J.M. Nerbonne, N.H. Wassermann, and B.F. Erlanger. 1980. Electrophysiological experiments with photoisomerizable cholinergic compounds: review and progress report. Ann. NY Acad. Sci. 346:475–490. [DOI] [PubMed] [Google Scholar]
- Levitt, D.G. 1989. Continuum model of voltage-dependent gating. Macroscopic conductance, gating current, and single-channel behavior. Biophys. J. 55:489–498. [DOI] [PMC free article] [PubMed] [Google Scholar]
- Liang, F., A. Niedzielski, B.A. Schulte, S.S. Spicer, D.J. Hazen-Martin, and Z. Shen. 2003. A voltage- and Ca2+-dependent big conductance K channel in cochlear spiral ligament fibrocytes. Pflugers Arch. 445:683–692. [DOI] [PubMed] [Google Scholar]
- Martinac, B., M. Buechner, A.H. Delcour, J. Adler, and C. Kung. 1987. Pressure-sensitive ion channel in Escherichia coli. Proc. Natl. Acad. Sci. USA. 84:2297–2301. [DOI] [PMC free article] [PubMed] [Google Scholar]
- Miles, G., H. Bayley, and S. Cheley. 2002. Properties of Bacillus cereus hemolysin II: a heptameric transmembrane pore. Protein Sci. 11:1813–1824. [DOI] [PMC free article] [PubMed] [Google Scholar]
- Mirzabekov, T., C. Ballarin, M. Nicolini, P. Zatta, and M.C. Sorgato. 1993. Reconstitution of the native mitochondrial outer membrane in planar bilayers. Comparison with the outer membrane in a patch pipette and effect of aluminum compounds. J. Membr. Biol. 133:129–143. [DOI] [PubMed] [Google Scholar]
- Parzefall, F., R. Wilhelm, M. Heckmann, and J. Dudel. 1998. Single channel currents at six microsecond resolution elicited by acetylcholine in mouse myoballs. J. Physiol. 512:181–188. [DOI] [PMC free article] [PubMed] [Google Scholar]
- Perozo, E., L.G. Cuello, D.M. Cortes, Y.S. Liu, and P. Sompornpisut. 2002. a. EPR approaches to ion channel structure and function. Novartis Found Symp. 245:146–158; discussion 158–164, 165–168. [DOI] [PubMed] [Google Scholar]
- Perozo, E., A. Kloda, D.M. Cortes, and B. Martinac. 2002. b. Physical principles underlying the transduction of bilayer deformation forces during mechanosensitive channel gating. Nat. Struct. Biol. 9:696–703. [DOI] [PubMed] [Google Scholar]
- Sauer-Budge, A.F., J.A. Nyamwanda, D.K. Lubensky, and D. Branton. 2003. Unzipping kinetics of double-stranded DNA in a nanopore. Phys. Rev Lett. 90:238101. [DOI] [PubMed] [Google Scholar]
- Shapovalov, G., R. Bass, D.C. Rees, and H.A. Lester. 2003. Open-state disulfide crosslinking between Mycobacterium tuberculosis mechanosensitive channel subunits. Biophys. J. 84:2357–2365. [DOI] [PMC free article] [PubMed] [Google Scholar]
- Sigg, D., F. Bezanilla, and E. Stefani. 2003. Fast gating in the Shaker K+ channel and the energy landscape of activation. Proc. Natl. Acad. Sci. USA. 100:7611–7615. [DOI] [PMC free article] [PubMed] [Google Scholar]
- Sigworth, F.J. 1986. Open channel noise. II. A test for coupling between current fluctuations and conformational transitions in the acetylcholine receptor. Biophys. J. 49:1041–1046. [DOI] [PMC free article] [PubMed] [Google Scholar]
- Sukharev, S. 2002. Purification of the small mechanosensitive channel of Escherichia coli (MscS): the subunit structure, conduction, and gating characteristics in liposomes. Biophys. J. 83:290–298. [DOI] [PMC free article] [PubMed] [Google Scholar]
- Sukharev, S., M. Betanzos, C.S. Chiang, and H.R. Guy. 2001. The gating mechanism of the large mechanosensitive channel MscL. Nature. 409:720–724. [DOI] [PubMed] [Google Scholar]
- Sukharev, S.I., B. Martinac, V.Y. Arshavsky, and C. Kung. 1993. Two types of mechanosensitive channels in the Escherichia coli cell envelope: solubilization and functional reconstitution. Biophys. J. 65:177–183. [DOI] [PMC free article] [PubMed] [Google Scholar]
- Sukharev, S.I., W.J. Sigurdson, C. Kung, and F. Sachs. 1999. Energetic and spatial parameters for gating of the bacterial large conductance mechanosensitive channel, MscL. J. Gen. Physiol. 113:525–540. [DOI] [PMC free article] [PubMed] [Google Scholar]
- Vercoutere, W.A., S. Winters-Hilt, V.S. DeGuzman, D. Deamer, S.E. Ridino, J.T. Rodgers, H.E. Olsen, A. Marziali, and M. Akeson. 2003. Discrimination among individual Watson-Crick base pairs at the termini of single DNA hairpin molecules. Nucleic Acids Res. 31:1311–1318. [DOI] [PMC free article] [PubMed] [Google Scholar]