

Abstract
The CFTR chloride channel is regulated by phosphorylation by protein kinases, especially PKA, and by nucleotides interacting with the two nucleotide binding domains, NBD-A and NBD-B. Giant excised inside-out membrane patches from Xenopus oocytes expressing human epithelial cystic fibrosis transmembrane conductance regulator (CFTR) were tested for their chloride conductance in response to the application of PKA and nucleotides. Rapid changes in the concentration of ATP, its nonhydrolyzable analogue adenylylimidodiphosphate (AMP-PNP), its photolabile derivative ATP-P3-[1-(2-nitrophenyl)ethyl]ester, or ADP led to changes in chloride conductance with characteristic time constants, which reflected interaction of CFTR with these nucleotides. The conductance changes of strongly phosphorylated channels were slower than those of partially phosphorylated CFTR. AMP-PNP decelerated relaxations of conductance increase and decay, whereas ATP-P3-[1-(2-nitrophenyl)ethyl]ester only decelerated the conductance increase upon ATP addition. ADP decelerated the conductance increase upon ATP addition and accelerated the conductance decay upon ATP withdrawal. The results present the first direct evidence that AMP-PNP binds to two sites on the CFTR. The effects of ADP also suggest two different binding sites because of the two different modes of inhibition observed: it competes with ATP for binding (to NBD-A) on the closed channel, but it also binds to channels opened by ATP, which might either reflect binding to NBD-A (i.e., product inhibition in the hydrolysis cycle) or allosteric binding to NBD-B, which accelerates the hydrolysis cycle at NBD-A.
Keywords: ATP-binding cassette transporters, protein phosphorylation, caged ATP, cystic fibrosis transmembrane conductance regulator gating, ATP hydrolysis
Introduction
10 yr ago, the gene that is mutated in the hereditary disease cystic fibrosis was cloned and sequenced and named cystic fibrosis transmembrane conductance regulator (CFTR)1 (Riordan et al. 1989). In accordance with the reduced chloride conductance of epithelial tissue from cystic fibrosis patients described earlier (Quinton 1983), CFTR was shown to be a chloride channel that can be activated by cAMP-dependent PKA (Anderson et al. 1991; Tabcharani et al. 1991; Bear et al. 1992).
Early on, it was recognized (Riordan et al. 1989) that CFTR belongs to a large family of membrane transport facilitators that were called TM6-NBF (Riordan et al. 1991), traffic ATPases (Ames et al. 1990), or ATP-binding cassette transporters (Hyde et al. 1990). The common feature is a twofold repetition of a transmembrane domain (TMD), often comprised of six hydrophobic sequences, followed by a nucleotide binding fold or domain (NBF or NBD) with the characteristic Walker A and Walker B consensus sequences (Walker et al. 1982). Unique to the CFTR is an additional large cytoplasmic domain inserted in the sequence between NBF1 and TMD2 with many consensus sites for phosphorylation by PKA or PKC. This domain was termed the R domain (Riordan et al. 1989).
Although it is undisputed that nucleoside triphosphates are necessary to open CFTR channels after phosphorylation by PKA, the mechanism of action of ATP is the topic of some controversy. In some studies, it was suggested that ATP is hydrolyzed during CFTR gating, based on the inability of the nonhydrolyzable ATP-analogue adenylylimidodiphosphate (AMP-PNP) to open CFTR channels (Anderson et al. 1991; Nagel et al. 1992), whereas others concluded nonhydrolytic binding of ATP was sufficient because of a perceived lack of binding of AMP-PNP to CFTR in single-channel studies with heterologously expressed CFTR (Schultz et al. 1995, Schultz et al. 1996), or because mixtures of ATP and AMP-PNP stimulated endogenous CFTR (Quinton and Reddy 1992; Reddy and Quinton 1996).
The stimulatory effect of AMP-PNP on CFTR channels opened by ATP was confirmed later (Gunderson and Kopito 1994; Hwang et al. 1994) and a model was presented where ATP hydrolysis at one NBF (termed NBD-A) leads to channel opening, and ATP binding at another NBF (termed NBD-B) prevents channel closing (Hwang et al. 1994; Gadsby et al. 1995). The effect of AMP-PNP was interpreted as reflecting its ability to bind but not be hydrolyzed at NBD-B, where ATP is normally hydrolyzed (Gunderson and Kopito 1994; Hwang et al. 1994; Gadsby et al. 1995).
Most studies of CFTR gating have investigated single-channel or multichannel nucleotide-dependent gating under steady state conditions. Under these conditions, it may be difficult to separate the effects of a nucleotide interacting in more than one way with the two NBDs of the CFTR. Therefore, we designed experiments under pre–steady state conditions and followed the relaxation of large populations of CFTR channels to a new steady state. To achieve fast access to the cytosolic membrane surface, and to improve the signal-to-noise ratio, we used the giant patch technique (Hilgemann 1989, Hilgemann 1995), using pipettes with a tip opening diameter of >20 μm. This allowed recording of an initial PKA and ATP-induced chloride current corresponding typically to ∼4,000 simultaneously open CFTR channels (Weinreich et al. 1997).
We employed flash photolysis of ATP-P3-[1-(2-nitrophenyl)ethyl]ester (NPE-ATP, or caged ATP; Kaplan et al. 1978) or fast solution changes to generate rapid changes in the nucleotide concentration. In this manner, the relaxation current seen upon ATP addition to closed channels as well as the current decay upon ATP removal could be analyzed, providing new information on the nucleotide dependence of CFTR opening. An up to now not observed binding of AMP-PNP to NBD-A could be clearly demonstrated, which clarifies further the requirements for CFTR channel opening. The newly observed effect of ADP-induced acceleration of channel closing leads to a revision of current gating cycle schemes.
Materials and Methods
Expression of CFTR in Xenopus Oocytes
cRNA was prepared from the plasmid, pCFTR(SP), containing the human CFTR cDNA as described (Bear et al. 1991). Intact ovary lobes were removed from female Xenopus frogs anaesthetized by immersion into a tricaine solution (0.2%) for 5–10 min. Oocytes were prepared and injected with the CFTR cRNA as described previously (Weinreich et al. 1997). Oocytes were kept in a modified Ringer's solution containing 110 mM NaCl, 5 mM KCl, 2 mM CaCl2, 1 mM MgCl2, 5 mM HEPES, pH 7.6, and incubated at 18°C for 2–4 d before measurement.
Giant Excised Patch Clamping
Oocytes were shrunken by brief immersion in a hypertonic solution containing 200 mM potassium aspartate, 20 mM KCl, 2 mM MgCl2, 5 mM EGTA, 10 mM HEPES, pH 7.4. Thereafter, the vitelline membrane could be removed using sharpened watchmaker's forceps. The oocyte was placed in a small petri dish (35 mm) filled with 60 mM N-methyl-glucamine-Cl, 40 mM NaCl, 20 mM tetraethylammonium-Cl, 2 mM MgCl2, 5 mM EGTA, 10 mM HEPES, pH 7.4, which was mounted on the stage of an inverted microscope (Zeiss Telaval 31; Carl Zeiss Jena). Seals were formed using borosilicate glass pipettes with tip openings of 18–24 μm.
The pipette solution contained 150 mM N-methyl-glucamine (NMG)-Cl, 2 mM BaCl2, 2 mM MgCl2, 0.5 mM CdCl2, 10 mM HEPES, pH 7.4. To accelerate seal formation, slight suction was applied to the pipette. Withdrawal of the pipette yielded large inside-out membrane patches having seal resistances of 2–20 GΩ. The excised patch was then transferred to a temperature controlled chamber (Friedrich et al. 1996). The recording chamber was continuously perfused at a rate of 0.8–1.2 ml/min with a standard solution composed of 140 mM NMG, 20 mM tetraethylammonium-OH, 5 mM glutathione (reduced form), 5 mM EGTA, 2 mM MgCl2, 10 mM HEPES, titrated to pH 7.4 with aspartate, resulting in a chloride gradient between pipette and bath of ∼40:1. To this solution, additions were made from concentrated stock solutions of nucleotides and other drugs. Electrical valves (General Valve, modified by us) were employed for solution switching. The bath volume was maintained at a low level (10–15 μl) by continuous vacuum-driven solution drain from the chamber.
To perform time-resolved relaxation measurements after a concentration jump, the system time constant for the solution exchange in the measuring chamber had to be determined. To do this, the chloride current through the oocyte's endogenous calcium-activated chloride channels (Miledi 1982; Young et al. 1984) was recorded. When these channels were opened by elevating the calcium concentration in the bath, subsequent changes in the chloride concentration of the bath produced current steps, the time course of which depended on the speed with which the solution in the measuring chamber was exchanged (Fig. 1 A). When a logarithmic dependence of the current amplitude on the chloride gradient across the membrane and a continuous dilution of the buffer in the chamber was assumed, a time constant for the solution exchange could be obtained from the current record (Fig. 1 B). This system time or solution exchange time constant was expected to vary depending on the position of the pipette within the chamber, the perfusion rate, as well as the geometry of the pipette tip, and was found to be in the range of 15–150 ms in most cases. The calibration for the solution exchange time constant was done at least once during each patch clamp experiment.
Figure 1.

Calibration of the solution exchange rate by chloride concentration jumps and photolysis of caged ATP. (A) Current through endogenous calcium-activated chloride channels in the presence of 500 μM free calcium and at two different chloride concentrations in the bath. Chloride concentration in the pipette is 150 mM, the holding potential is set to 0 mV. A slow inactivation of the calcium-induced current is seen that is negligible on the time scale of the solution exchange. Bars indicate the presence of calcium and the chloride concentration of the bath solution; the arrow indicates zero current. (B) Current steps in response to a chloride jump shown at a higher time resolution. The traces are from the recording shown in A at the position marked by the asterisk. The broken lines represent fitted functions simulating mixing of the two chloride concentrations by continuous dilution of a fixed solution volume. Time constants for the solution mixing are 16 ms for the jump from 120 to 10 mM chloride and 37 ms for the jump back to 120 mM. (C) Photolysis of 450 μM NPE-ATP with a 10-ns laser pulse of 275 mJ/cm2 and 308 nm wavelength generates an exponentially rising current. In this example, the exponential time constant is 1,280 ms. The vertical arrow signifies the application of the UV light pulse, which is also visible from the artifact induced by the discharge of the excimer laser, the horizontal arrow indicates zero current.
Measurements of nucleotide-induced relaxations were rejected for kinetic analysis if the observed relaxation time constants were not significantly (i.e., by a factor of five or more) larger than the solution exchange time constant. The experimental conditions also necessitated a delay (system delay or solution exchange delay) between the switching of the valve and the arrival of the solution at the pipette tip. This solution exchange delay could be measured as the time between valve switching and the onset of the current response. It was determined to 0.5 ± 0.1 s for the chloride concentration changes and 0.7 ± 0.2 s for changes from 0 to 500 μM ATP, whereas it was 1.6 ± 0.5 s for changes from 500 to 0 μM ATP  . We therefore concluded that the delay observed with ATP addition is not significantly different from the “solution exchange delay” (see also caged ATP photolysis experiments, below), whereas the delay observed with ATP removal is significantly longer. Although this delay time is considered to reveal a valuable parameter of CFTR gating, it was not included in the analysis of this study.
Under the conditions used to measure CFTR currents, the calcium-activated chloride channels did not contribute to the current signal, as intracellular calcium was kept low by the addition of the chelator EGTA. The chamber was further equipped with a duct through which a quartz fibre serving as a light guide could be positioned in close proximity (100–200 μm) to the pipette tip (see Friedrich et al. 1996). 10-ns light pulses of 308-nm wavelength generated by a XeCl excimer laser (Lambda Physik) were fed into the light guide. The UV light was employed to generate rapid ATP pulses by photolysis of the photolabile NPE-ATP. Due to the short pulse duration of the excimer laser, it was not usually possible to liberate more than one third of the NPE-ATP during a single laser pulse, as the energy densities required for near-complete photolysis would cause the patch membrane to disintegrate.
An example of a current induced by incomplete photolysis of 450 μM NPE-ATP is shown in Fig. 1 C. The rise in current resulting from the ATP liberation was not instantaneous, but showed a short delay of several milliseconds that may be attributed to the time required for the photolysis reaction to generate ATP. More importantly, the signal rise time was rather slow with time constants of 500–1,500 ms if an exponentially rising signal was assumed. As was obvious from the slow rise times seen with a 10-ns pulse, the pulse duration could safely be extended to several milliseconds using a low-power continuous wave He/Cd laser of 325-nm wavelength (Kimmon Electric Co., Ltd.) without compromising the time resolution of the current signal. The 325-nm continuous laser beam was pulsed by means of an electrical shutter device (Uniblitz; Vincent Associates) with a response time of ∼1 ms.
Pipette current was measured with an EPC-7 patch clamp amplifier (List Medical) at a holding potential of 0 mV. Seal resistance was checked before and after each experiment. All experiments were carried out at 25°C.
Data Acquisition and Analysis
Membrane currents and solution switching pulses were routinely recorded on a chart recorder (Kipp & Zonen). Currents were filtered online at 20 Hz and continuously recorded at 100 Hz on the hard disk of a personal computer using KAN1 software (MFK; Michael Friedrich, Neidernhausen, Germany). In addition, currents filtered at 100 Hz were recorded at 500 Hz on a second personal computer using PCLAMP 6 software (Axon Instruments), which was also employed to trigger the laser pulses and for electric valve switching. Relaxation currents were fitted using either the PCLAMP simplex fitting algorithm or the Levenberg-Marquardt fitting tool from the ORIGIN 5.0 analysis program (Microcal Software).
Drugs and Chemicals
Mg-ATP (from equine muscle), ADP, and AMP (free acid) were from Sigma Chemical Co., NPE-ATP was from Molecular Probes, Inc., AMP-PNP was from Boehringer Mannheim, and PKA catalytic subunit was from Promega Corp. Buffer chemicals were from Merck or Sigma Chemical Co.
Results
Jumps in the ATP Concentration Generate Characteristic Relaxation Currents
When a giant patch was excised from an unstimulated oocyte expressing human CFTR channels, activity in response to the channel opener ATP was negligible, indicating a low basal PKA activity in the resting oocyte. Application of exogenous PKA catalytic subunits in conjunction with ATP gave rise to a substantial chloride current in the range of hundreds of picoamperes to a few nanoamperes (compare Fig. 2 A), recorded at a holding potential of 0 mV and with a chloride gradient of 150 mM:4 mM between pipette and bath. Upon removal of the kinase, the signal underwent first a rapid and subsequently a slow rundown that was partly reversible by readdition of the PKA (not shown, but see Weinreich et al. 1997).
Figure 2.
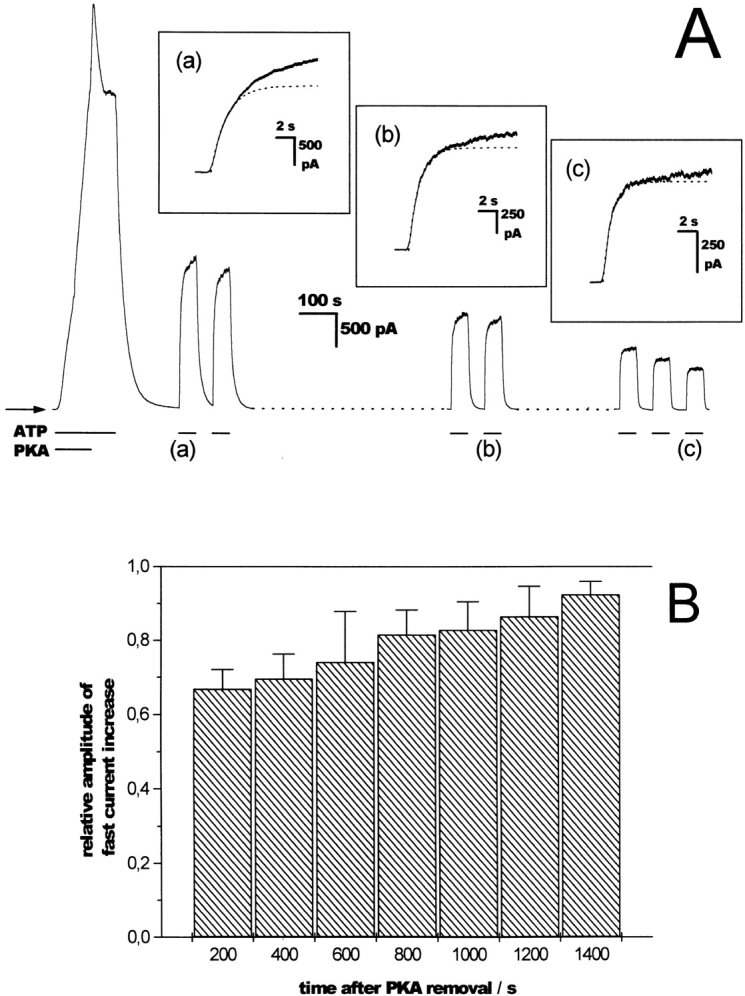
Time-dependent changes in chloride current amplitude and relaxation kinetics. (A) A representative trace of a complete patch clamp experiment is shown, with initial activation by PKA catalytic subunit (100 U/ml) and repeated ATP (500 μM) pulses generated by rapid solution exchange. Chloride concentrations in the pipette and bath were 150 and 4 mM, respectively. Holding potential was set to 0 mV. Parts of the trace were left out for greater clarity. At the positions indicated by the lowercase letters, the ATP-induced current rise is shown at a higher time resolution as an insert. The ATP-induced steady state current exhibits a time-dependent rundown. Furthermore, a gradual change in the overall shape of the current trace is seen, with the relaxation time course changing from biexponential to monoexponential. The dotted lines represent monoexponential fits to the initial part of the traces shown in the inserts with the following time constants: 1,660, 1,130, and 890 ms at positions a, b, and c. The fractional amplitude of this fast component in relation to the steady state current was 68, 75, and 93% at positions a, b, and c. The bars below the trace identify additions to the bath solution, the arrow indicates zero current. (B) The histogram shows the fraction of steady state current fitted by the fast exponential component after ATP addition in relation to the time interval after PKA removal. The fractional amplitude of the slow component diminishes from 33% shortly after PKA removal to <10% after 1,400 s. The values are taken from 54 relaxation experiments, including the data shown in A with 4–12 data points per bin. Bin size is 200 s, the error bars represent the SD of the means.
In the absence of PKA and in the presence of millimolar concentrations of magnesium ions, the prephosphorylated channels could be opened by ATP alone. The application of an ATP pulse thus provided a means to analyze the kinetics of channel gating from the multichannel current signal. To judge whether the observed relaxation kinetics were determined by the interaction of ATP with CFTR or by the solution exchange at the patch membrane, the solution exchange speed was always calibrated with chloride concentration jumps under conditions when endogenous chloride channels in the oocyte membrane were open (see the description in methods). This provided a CFTR-independent estimation of the solution exchange time and of the delay between valve switching and arrival of the solution at the patch membrane. When ATP was added to closed channels, the current followed an exponential time course in approaching the new steady state level.
Usually, relaxation kinetics could best be approximated by the sum of two exponentials with a fast time constant in the range of several hundreds of milliseconds that accounted for 60–95% of the signal amplitude and a slow time constant ∼10× greater that was often difficult to determine because of its small amplitude (see Fig. 2). The slow time constants, as well as the above mentioned delay times, were not systematically evaluated. In most cases, therefore, our analysis is restricted to the rates of the fast-relaxing current component.
Changes in Kinetics Accompany the Rundown of CFTR Activity
When ATP pulses were applied consecutively, the resulting currents exhibited a time-dependent change in both signal amplitude and relaxation rates. The relative amplitude of the slowly relaxing current always diminished with time and the signal could then be approximated reasonably well by a monoexponential function. This is shown in Fig. 2 for the current rise upon ATP addition, but was similarly observed for the current decay upon ATP withdrawal. For the kinetic analysis, the slowly relaxing amplitude of the current signal was neglected and the signal was fitted with a simple monoexponential function using only the initial part of the record. In all cases (68 of 68 experiments) the rundown of the current signal was accompanied by an acceleration of the fast relaxation rate.
Presumably because of differing phosphatase activity in different patches, the relaxation rates exhibited considerable variance between measurements (see below). This necessitated the use of a standard ATP jump (between 0 and 500 μM ATP) as an internal reference, which was applied at regular intervals during the course of an experiment. The average value of all these standard rates was 1.2 ± 0.4 s−1 (means ± SD, n = 189) for the current rise after ATP addition and 0.8 ± 0.4 s−1
 for the current decay after ATP removal. Referencing relaxation rates to the standard rate enabled us to compare normalized relaxation rates obtained from different patches. Because ATP jump experiments were performed after much of the rundown had already taken place (∼10 min after washout of PKA, see Fig. 2 B and figure legends), the change in the kinetics over time was not large.
Flash Photolysis of Caged ATP Confirms the Data Obtained Via Fast Solution Exchange
To confirm the physiological significance of the observed relaxation rates, a second approach was followed to complement the calibration via chloride concentration jumps (see materials and methods). It has been shown for CFTR reconstituted into a black lipid membrane (Nagel et al. 1997) that the photolabile ATP analogue NPE-ATP (Kaplan et al. 1978) can be used to open the CFTR after photolytic cleavage to ATP and 2-nitrosoacetophenone. The photolysis reaction proceeds with a rate of ∼40 s−1 at pH 7.4 due to a [H+]-dependent rate-limiting step in the liberation of ATP from its caged precursor (McCray et al. 1980; Walker et al. 1988). Since the unphotolyzed NPE-ATP caused inhibition of the ATP-induced current in mixtures of ATP and NPE-ATP (data not shown, but see below), near complete photolysis of the caged ATP seemed necessary to avoid a distortion of the relaxation signal. The energy density and thus the efficiency of the photolysis reaction could be regulated by the length of the light pulse employed to liberate the ATP. As shown in Fig. 3 A, a photolysis time of 50 ms was necessary for a release ratio of >90%.
Figure 3.

Comparison of ATP concentration jumps by rapid solution exchange and by photolysis of NPE-ATP. (A) The trace shows four ATP pulses by solution exchange and by photolytic cleavage of NPE-ATP using the 325-nm light of a He/Cd laser. As the pulse length is increased, the steady state current generated by photolysis of NPE-ATP (450 μM) approaches the current seen with ATP (500 μM). The power density of the UV radiation leaving the light guide was 25 W cm−2. Note that the signal induced by photolytic cleavage of the NPE-ATP is not stable, because the ATP released at the patch membrane is slowly diluted with unphotolyzed NPE-ATP from the surrounding solution. Bars identify additions to the bath solution, the hatched areas indicate interruption of the otherwise continuous perfusion. Arrows below the trace identify laser pulses with pulse lengths indicated next to the arrows. The horizontal arrow denotes zero current. (B) Comparison of an ATP jump by photolysis of 450 μM NPE-ATP with a 50-ms laser pulse with an ATP jump from 0 to 500 μM ATP by rapid solution exchange. The two ATP jumps are from the experiment shown in A at the positions identified by the lowercase letters. The traces were fitted with an exponential function that yielded relaxation rates of 1.3 s−1 for the photolysis jump (a) and 1.4 s−1 for the solution exchange jump (b). Fits are superimposed on the traces (broken lines), the arrow indicates the laser pulse.
The relaxation rates after a photolytically engineered ATP jump were compared with the relaxation observed after an ATP jump by rapid solution change and were found to be virtually identical (example in Fig. 3 B). Thus, by means of flash photolysis of NPE-ATP, we were able to ascertain that the fastest component in the current rise after an ATP jump had a time constant of several hundred milliseconds and could thus readily be resolved by rapid solution switching. Because removal of ATP from the membrane was only possible by perfusing the bath with an ATP-free solution, a comparison between ATP jumps by solution exchange and by photolysis was limited to ATP addition. Nevertheless, because the kinetics of ATP removal showed relaxation rates in the same time range as those of ATP addition (see the examples in Fig. 5, Fig. 8, and Fig. 9) and because these were slower than the routinely performed chloride concentration jumps (yielding the solution exchange time), we are confident that the rates obtained with rapid solution exchange reflect the true kinetics of the channels.
Figure 5.

Effects of AMP-PNP on the relaxation current after an ATP jump. The trace shows three consecutive ATP pulses, one of which represents a jump from AMP-PNP to ATP and back to AMP-PNP. The presence of AMP-PNP profoundly alters the relaxation kinetics of both ATP addition and ATP removal. Nucleotide concentrations are 500 μM for ATP and for AMP-PNP. Bars indicate additions to the bath solution. The change from AMP-PNP to ATP was 300 s after washout of PKA.
Figure 8.

Relaxation kinetics of jumps between ADP and ATP. (A) The trace shows three ATP pulses, one of which represents a jump from ADP to ATP and back to ADP. Nucleotides were used at a concentration of 500 μM. Bars indicate additions to the bath solution, the arrow indicates zero current. (B) The current response to ATP addition (left) and removal (right) is shown at a higher time resolution for the three pulses depicted in A, as identified by the lowercase letters. Relaxation rates for ATP addition were 1.3, 0.41, and 1.4 s−1, and for ATP removal were 0.54, 1.39, and 0.78 s−1 for pulses a, b, and c, respectively. The arrows indicate zero current.
Figure 9.

Relaxation kinetics of ATP jumps in the presence of ADP. The relaxation current after ATP addition (left) and removal (right) is shown for three ATP pulses taken from the same experiment. The ATP pulse shown in b was applied in the continued presence of ADP. Note the lower steady state current due to the inhibition by ADP. Nucleotides were used at a concentration of 500 μM. Relaxation rates for ATP addition were 0.96, 0.25, and 1.03 s−1, and for ATP removal were 0.44, 0.71, and 0.45 s−1 for pulses a, b, and c, respectively. The arrows indicate zero current.
The Presence of ATP Analogues Alters the Kinetics
The observed inhibition of the ATP-induced steady state current by NPE-ATP was investigated by means of relaxation experiments. When channels were incubated with NPE-ATP and the NPE-ATP was subsequently replaced by ATP, an additional slow component was introduced into the relaxation kinetics (in 12 of 12 cases, compare the example shown in Fig. 4). This slowly relaxing current was not seen in the absence of NPE-ATP or when the NPE-ATP was converted into ATP by photolysis (Fig. 4). The rate of the fast relaxing component was not affected by the NPE-ATP nor was the relaxation when ATP was replaced by NPE-ATP. This shows that NPE-ATP may bind to the CFTR in the absence of ATP; i.e., when all channels are closed.
Figure 4.

Effects of NPE-ATP on the relaxation current after an ATP jump. (A) The trace shows four consecutive ATP jumps, one of which is an NPE-ATP to ATP jump and one is by photolysis of NPE-ATP. Nucleotide concentrations are 500 μM for both ATP and NPE-ATP. Bars identify additions to the bath solution, the hatched area indicates interruption of the otherwise continuous perfusion. The arrow below the trace identifies the laser pulse used to photolyze the NPE-ATP (325 nm, 25 W cm−2). The horizontal arrow denotes zero current. (B) Comparison of a jump from 0 to 500 μM ATP with two NPE-ATP to ATP jumps, one of which is by rapid solution exchange and one by photolytic cleavage of the NPE-ATP. The ATP jumps are taken from the experiment shown in A at the positions identified by the lowercase letters. The relaxation currents in a and c could be fitted with monoexponential functions with rates of 1.9 s−1 for the solution exchange jump and 2.2 s−1 for the photolysis jump. The relaxation current in b necessitated a fit with two exponentials of approximately equal amplitude, a fast relaxing current with a rate of 2.1 s−1, and a slowly relaxing current with a rate of 0.11 s−1. Experiments were performed ∼800 s after washout of PKA. Similar results were obtained in 12 more solution changes (from nine patches) at 570 ± 150 s after washout of PKA.
Although the concentration dependence of the effect of NPE-ATP was not investigated, the slowly relaxing component in the current after ATP addition most likely is caused by those channels that have bound NPE-ATP, which prevents ATP binding until it has dissociated. The fast relaxing component then represents those channels without bound NPE-ATP that can open normally once ATP is applied.
As shown for NPE-ATP, the comparison of a standard ATP-induced relaxation current with the relaxation signal after preincubation with other substances allows detection of interactions with the closed channel. When this is done using the nonhydrolyzable ATP analogue AMP-PNP instead of NPE-ATP, a slow component is again introduced into the relaxation after ATP addition (Fig. 5), indicating binding of AMP-PNP to the closed channel (at NBD-A) resulting in competitive inhibition of ATP binding. If the presumed competitive binding of AMP-PNP and ATP at NBD-A was the only AMP-PNP effect on CFTR gating, no alteration of the relaxation after ATP removal is to be expected. This is true for NPE-ATP, but not for AMP-PNP, as shown in Fig. 5.
When ATP was removed in the presence of 500 μM AMP-PNP, an additional slow component with a relaxation rate of 0.033 ± 0.008 s−1
 was observed. The amplitude of this slow component varied and appeared to be higher if AMP-PNP was applied early after phosphorylation; i.e., before most of the rundown had occurred. In all cases, however, more than half of the total amplitude was accounted for by a fast relaxing current with a relaxation rate indistinguishable from the rate in the absence of AMP-PNP, indicating that the greater part of the channels was not affected in its kinetics by AMP-PNP.
The Relaxation Rate of Channel Opening Is a Function of the ATP Concentration
Next, the dependence of the ATP jump relaxation rates on the ATP concentration was determined. There was a pronounced dependence of the relaxation rate after ATP addition (k
ad) on the ATP concentration in the range from 25 μM to 2.5 mM. The ATP dependence could be reasonably well fitted by a simple saturation function:  , with a K
1/2 of ∼100 μM ATP (see Fig. 6, broken line).
, with a K
1/2 of ∼100 μM ATP (see Fig. 6, broken line).
Figure 6.

ATP dependence of the relaxation rates. The rate constants of the fast relaxing component seen upon addition (▪) and withdrawal (○) of the indicated amount of ATP by rapid solution exchange are plotted against ATP concentration. Data represent the means ± SD of at least three independent measurements. All values are normalized to rates measured with 500 μM ATP in the respective experiment; i.e., giant patch. The average of these standard relaxation rates is 1.2 ± 0.4 s−1
 for the current rise after ATP addition and 0.8 ± 0.4 s−1
 for the current decay after ATP removal. Also included are two different fits to the rates upon ATP addition according to the equation (broken line):
  .
.
An even better fit could be obtained by a saturation function including a basal rate k 0 (Fig. 6, solid line): k ad = k 0 + k max * [ATP]/(K 1/2 + [ATP]), with a K 1/2 of 190 μM ATP, a k max of 1.35 s−1, and a basal rate k 0 (at 0 ATP) of 0.22 s−1, leading to a maximal rate (at saturating ATP) of ∼1.6 s−1. The fitted basal rate k o seems high. It is difficult to determine it more accurately by further lowering the ATP concentration as the resulting amplitudes are usually very small and lead to a greater error. It is, however, an important observation that this basal rate is significantly lower than the relaxation upon ATP removal. This observation already excludes certain simple gating models similar to ligand-gated channels.
The relaxation rate obtained after ATP removal was not sensitive to the ATP concentration present before ATP removal (Fig. 6). This relaxation rate was always the same when normalized to the standard rate (which was itself not a constant but subject to a time-dependent acceleration, as described earlier). Such a dependence is to be expected if only ATP-independent events contribute to the relaxation. The ATP-invariant fast closing rate is therefore an additional proof that the rate of solution exchange is not limiting for the observed relaxation rates. If the solution exchange rate were limiting for the observed current decay, then the removal of high ATP concentrations would result in a slower current response than the removal of low concentrations of ATP.
ADP Decreases the Relaxation upon ATP Addition
Finally, we investigated the interaction of ADP with the CFTR, which is known to inhibit ATP-induced opening (Anderson and Welsh 1992; Winter et al. 1994; Schultz et al. 1995). The inhibitory effect of ADP on the ATP-induced steady state current was measured at 500 μM ATP and yielded an apparent K
I of 215 μM (Fig. 7 B). This translates to a K
I of 31 μM, at a K
m for ATP of 84 μM (Fig. 7 A), assuming a competitive binding of ATP and ADP to the CFTR, as suggested by Anderson and Welsh 1992 and Schultz et al. 1995. When an ADP to ATP jump was performed and the resulting relaxation current compared with that of a standard ATP jump, a single relaxation rate was found, which was significantly reduced (Fig. 8). This is at variance with the NPE-ATP to ATP or AMP-PNP to ATP jumps, where a biphasic relaxation was observed. Increasing the ADP concentration from 0.5 to 1 mM caused only a small reduction in the normalized relaxation rate from 0.43 ± 0.08  to 0.40 ± 0.09
  , indicating that at 500 μM the ADP-induced effect on the relaxation rate had almost reached saturation.
Figure 7.
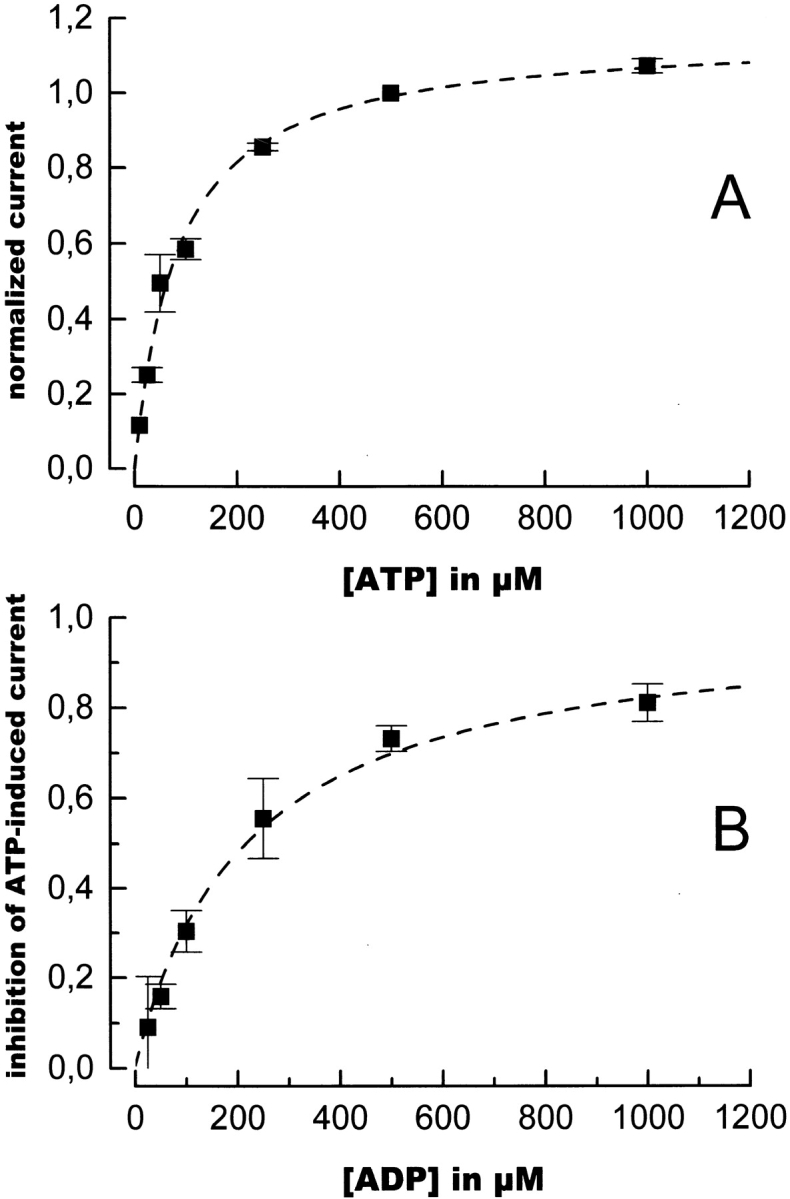
Nucleotide dependence of the ATP-induced stationary current. (A) Dependence of the chloride current on the ATP concentration. Data are shown as means ± SD of at least three determinations. The values could be fitted with a Michaelis-Menten function yielding a K
m for ATP of 84 ± 9 μM (broken line). (B) Inhibition of the current induced by 500 μM ATP as a function of ADP concentration. (IATP − IADP)/IATP is plotted versus [ADP], where IATP represents the current in the presence of 500 μM ATP, and IADP represents the current in the presence of 500 μM ATP and the indicated amount of ADP. Data are shown as means ± SD of at least three determinations. The broken line shows a fit to the data, yielding an apparent inhibition constant for ADP, Kapp, of 215 μM. In the case of competitive inhibition, this corresponds to a K
I of 31 ± 2 μM, according to the equation  .
.
Given that a competitive binding of ADP to the ATP binding site responsible for channel opening occurs, preincubation of the channels with ADP should result in a delayed opening and therefore a lower relaxation rate. Since no biphasic relaxation was seen, it must be postulated that under the conditions employed here all channels have bound ADP at the time the ATP is applied. This is to be expected with 500 μM ADP and a K I of 31 μM, although further experiments should determine the exact K I of ADP binding to closed channels under these pre–steady state conditions. The inhibitory effect of ADP on channel opening should be even more pronounced if ADP is present throughout the entire ATP pulse. In this case, ADP that dissociates from the binding site may be replaced by either ATP or ADP, depending on the concentration ratio of the two nucleotides, thereby reducing the rate of ATP binding. This reduced relaxation rate was indeed observed as shown in Fig. 9.
When an ATP jump in the presence of 500 μM ADP was performed, the relaxation rate of ATP-induced opening was by a factor of 4.0 lower than in the absence of ADP and by a factor of 1.7 lower than the relaxation rate after an ADP to ATP jump (compare Fig. 10). The steady state amplitude of the chloride current was also reduced, as expected from the ADP titration shown in Fig. 7 B. When ADP was replaced by AMP, which was reported to have no effect on CFTR gating (Schultz et al. 1995), the relaxation was not altered (Fig. 10), indicating that the observed effects were specific for ADP.
Figure 10.

Changes in the relaxation rates induced by ADP. (A) Relaxation rates for ATP addition under different nucleotide conditions as indicated below the diagram. AMP represents an AMP to ATP jump, ADP represents an ADP to ATP jump, and ATP+ADP represents a jump from ADP to ADP+ATP. All nucleotides were used at a concentration of 500 μM. Relaxation rates are referenced to standard conditions (jump from 0 to 500 μM ATP), error bars show the SD of the data. The individual values for the three types of jumps are 1.0 ± 0.1  , 0.43 ± 0.08
  , and 0.25 ± 0.04
  , respectively. Concentration jumps were performed 350–940 s after PKA washout without observing significant differences in the deceleration factor. (B) Relaxation rates for ATP removal under different nucleotide conditions as indicated below the diagram. AMP represents an ATP to AMP jump, ADP represents an ATP to ADP jump and ATP+ADP represents a jump from ATP+ADP to ADP. All nucleotides were used at a concentration of 500 μM. Relaxation rates are referenced to standard conditions (jump from 500 to 0 μM ATP), error bars show the SD of the data. The individual values for the three types of jumps are 1.03 ± 0.09
  , 1.6 ± 0.4
  , and 1.7 ± 0.3
  , respectively. Concentration jumps were performed 390–990 s after PKA washout without observing significant differences in the acceleration factor.
ADP Accelerates the Relaxation upon ATP Removal
Interestingly, besides reducing the relaxation rate after ATP addition, ADP enhanced the relaxation rate of channel closing by a factor of ∼1.7 (compare the examples shown in Fig. 8 and Fig. 9) without introducing additional components into the current signal. This effect seemed to saturate at high ADP concentrations since a doubling of the ADP concentration from 0.5 to 1.0 mM lead only to a 25% increase in the relative relaxation rate from 1.6 ± 0.4  to 2.0 ± 0.3
  . Again, equally high concentrations of AMP did not exhibit any effect on the relaxation kinetics. The accelerating effect of ADP on the relaxation rate was the same regardless of whether or not ADP was present before ATP removal (Fig. 10), providing further evidence that only channel closing events contribute to the current signal after ATP removal. The significance of this finding, which to our knowledge has not been reported thus far, will be discussed later with respect to a possible CFTR gating cycle.
Discussion
This study introduces a new experimental approach to efforts to gain insight into the complicated regulation of CFTR channel gating by nucleotides. We applied fast changes of nucleotide concentrations and measured the relaxation of many CFTR channels to a new equilibrium. This pre–steady state experiment is a different and complementary approach to single channel studies that measure rate constants under steady state conditions.
In our discussion, we use the terms NBD-A and NBD-B to differentiate between two nucleotide binding sites as observed in this and previous studies and introduced by Hwang et al. 1994. These do not necessarily correspond to the sequence-based nucleotide binding folds 1 and 2 (NBF1, NBF2; Riordan et al. 1989).
Our experimental approach could only provide meaningful results if the concentration changes are faster than the observed relaxations that were tested by two independent procedures.
Are the Solution Changes Fast Enough?
The time constant of solution exchange was tested for each individual patch and was faster than 150 ms (typically 15–30 ms, Fig. 1) in all experiments used for analysis. The observed relaxation rates were at least five times slower than this solution exchange rate. An additional independent test of the validity of the relaxation rates obtained by solution exchange was provided by flash photolysis of caged ATP to generate a fast increase in ATP concentration. The observed relaxation was indistinguishable from the one obtained by a fast solution change (Fig. 3). Further support for the validity of the observed relaxation rates comes from the [ATP] dependence (see Fig. 6 and below) of the relaxation rates upon ATP withdrawal.
Data Analysis and Interpretation
We interpret these data under the assumption that the observed relaxations of the transmembrane chloride current are caused by conformational changes of CFTR from one or several closed states to one or several “activated states” with a certain open probability or vice versa. The open probability of this activated state might be 1 (i.e., the activated state is an open state) or it might be >0 and <1 (i.e., a fluctuation between an open and a closed state). By stepping the ATP concentration from zero to a given value and back to zero again, we were able to generate two different types of relaxation currents. The current recorded after ATP addition is governed by the kinetics of channel opening and closing, since ATP is present to support the complete gating cycle. The current relaxation recorded after sudden ATP withdrawal might only depend on the kinetics of channel closing or, if ATP-bound closed channels open equally fast or faster than ATP dissociates, might again depend on the kinetics of channel opening and closing.
Although determination of rate constants for channel opening and closing from single channel measurements have produced a wealth of valuable information about nucleotide-dependent CFTR gating (for review, see Gadsby and Nairn 1999), at present stage it is not at all clear if one ATP-binding/hydrolysis event leads to only one channel opening or better opening burst. It is well established that enzymes that catalyze an ATP-driven transport cycle can undergo a shuttle between intermediary states that leads, for example, to Nai +/Nao + exchange in the case of the energized (phosphorylated) Na/K-ATPase (Gadsby et al. 1993). Similarly we cannot a priori exclude that, in the ATP hydrolysis cycle of CFTR, energized CFTR might shuttle between an open and a closed state before finally relaxing to the (low energy-) closed state that strictly needs ATP to open again. We imagine that it might be difficult to discern these hypothetical intermediary (energized) closed states from the “final” (low energy-) closed state. The ability to discern or to dismiss this possibility depends on the individual rate constants and on the ability to collect enough single channel data under stable phosphorylation conditions. To keep CFTR channels stably phosphorylated for a long enough time is a big problem not only in these experiments, as outlined below, but even more so for single channel measurements when considering the much smaller data base.
Gradual Dephosphorylation of CFTR Underlies Rundown of ATP-activated Current
As reported earlier (Weinreich et al. 1997) and shown in Fig. 2, CFTR channel activity undergoes a continuous rundown after the withdrawal of PKA. At least a part of this rundown can be explained by dephosphorylation of CFTR as it can be reversed (to a great part at least) by addition of PKA (Weinreich et al. 1997). Since both the amplitude of the steady state chloride current and the time constants for the relaxation to the activated state are changing, we can conclude that dephosphorylation is not an all or nothing event, but that gradual dephosphorylation leads to graded changes in CFTR gating as already described earlier (Hwang et al. 1993, Hwang et al. 1994).
The rundown accompanying the change from a two- to a mono-exponential relaxation can be explained on the basis of the postulated (Hwang et al. 1994; Gadsby et al. 1995) phosphorylation-dependent involvement of two nucleotide binding folds in channel gating, suggesting ATP binding to only one of the two NBDs (NBD-A) in CFTR when there is a low degree of phosphorylation. Binding of ATP to the second NBD (NBD-B) may stabilize the channel in its open conformation, thereby slowing the gating cycle, which might lead to the observed slow relaxation. This binding of ATP to NBD-B, however, was found possible only if CFTR was sufficiently highly phosphorylated (Hwang et al. 1994).
NPE-ATP and AMP-PNP Bind to the Closed Channel
Early on, it was found that the hydrolysis-resistant ATP-analogue AMP-PNP is unable to open prephosphorylated CFTR (Anderson et al. 1991; Nagel et al. 1992). From this observation, it was concluded that ATP hydrolysis is necessary for ATP-induced opening of CFTR channels. This was later disputed because single-channel measurements with mixtures of AMP-PNP and ATP led to the conclusion that AMP-PNP does not bind to CFTR (Schultz et al. 1995). In contrast to these equilibrium measurements, our relaxation measurements enable detection of AMP-PNP binding to closed CFTR channels even though this binding does not lead to channel opening.
The observed slowing of ATP-induced opening of CFTR channels when ATP was applied concomitant with AMP-PNP removal is a clear indication of AMP-PNP binding to closed CFTR channels via NBD-A, similar to ADP binding (see below). Although such an inhibitory binding of AMP-PNP to NBD-A should be observed also under steady state conditions, so far it has not been, presumably because of the strong stimulatory effect of AMP-PNP on NBD-B. Such an inhibitory binding of AMP-PNP to NBD-A was postulated by Mathews et al. 1998 to explain slowed locking into the open state caused by AMP-PNP. Therefore, Fig. 5 presents the first direct demonstration of inhibitory binding of AMP-PNP to NBD-A. From the amplitude and time dependence of recovery from the AMP-PNP–induced inhibition, an apparent binding constant in the range of several 100 μM and an off rate of ∼0.05 s−1 can be estimated.
Similarly, preincubation with NPE-ATP slowed activation by ATP, suggesting binding of NPE-ATP to NBD-A. On the other hand, NPE-ATP does not seem to bind to NBD-B because the current relaxation when switching from ATP to NPE-ATP was very similar to the one observed when switching to no nucleotide (see Fig. 4A and Fig. B). The slight difference in the observed slow relaxations with small amplitude might either reflect residual ATP in the caged ATP solution (typically 0.5%), or indeed very low affinity binding of NPE-ATP to NBD-B. This seems unlikely, however, because we found inhibition of the steady state ATP-activated current in mixtures with NPE-ATP, in accordance with its competitive binding to NBD-A (data not shown).
AMP-PNP Binds to the Activated Channel and Delays Closing
A stimulating effect of AMP-PNP on CFTR activity under certain conditions was reported for endogenous CFTR in sweat glands (Quinton and Reddy 1992; Reddy and Quinton 1996), for endogenous cardiac CFTR (Hwang et al. 1994), and for black lipid membrane–reconstituted human CFTR (Gunderson and Kopito 1994). In apparent contrast to these observations are studies by Schultz et al. 1995, Schultz et al. 1996, who found neither an inhibiting nor a stimulating effect of AMP-PNP. One explanation for these conflicting results is the strong temperature dependence of the AMP-PNP effect, as noted already by Schultz et al. 1995 and shown in more detail by Mathews et al. 1998.
An important modulator of the action of AMP-PNP on CFTR is the degree of its phosphorylation. It was shown that higher phosphorylation corresponds to a higher open probability of CFTR and is a prerequisite of the “open-locking” action of AMP-PNP (Hwang et al. 1994). We found that a portion of the channels showed a much delayed closing rate in the presence of AMP-PNP, whereas other channels did not show an altered closing rate when AMP-PNP was present, resulting in a biphasic relaxation current (Fig. 5). Obviously, only a subpopulation of channels had the potential to become locked by the binding of AMP-PNP to NBD-B, which might have several causes. Probably not all channels are sufficiently phosphorylated to enable binding of ATP or AMP-PNP to NBD-B. Sufficiently phosphorylated channels, on the other hand, can only bind AMP-PNP on NBD-B if this site is not already occupied by ATP and if the concentration of AMP-PNP is high enough to allow fast binding before the channel relaxes to the closed state, which needs ATP to open.
ATP Dependence of Relaxation Rates
As outlined in methods, at least three time constants might be found in the current relaxation upon ATP withdrawal: a delay time constant, a fast relaxation with a large amplitude, and a slow relaxation with a small amplitude. For this study, we analyzed only the fast relaxation. It is interesting to compare this rate of ∼0.8 s−1 to closing rates obtained from single channel studies. The closing rate is the inverse of the mean open (burst) time obtained from a single channel experiment. Published mean open burst times range from 200 ms to ∼1 s at 25°C or room temperature, corresponding to closing rates in the order of 1–5 s−1 (for review, see Foskett 1998). These mean open burst times are probably influenced by the degree of phosphorylation of CFTR (Hwang et al. 1994) as it is observed for the fast relaxation rate of closing (0.8 s−1) in this study. The tentative agreement between these rates might allow the speculation that ATP hydrolysis leads to one open burst that is a priori assumed in most single channel studies. So far, however, we have no real proof for this assumption. The main impediment to a careful comparison of closing rates and the closing relaxation rate is the uncertain phosphorylation status of CFTR in this study, as well as in all previous single channel studies.
The relaxation upon ATP addition on the other hand appears to have no delay time constant, as evidenced by experiments with photolysis of caged ATP (NPE-ATP). It can be fitted by a fast relaxation with a large amplitude and a slow relaxation with a small amplitude. Again, we only analyzed the fast relaxation. The inverse time constant of the fast relaxation shows a saturating dependence on the ATP concentration that could be fitted best by a model with a maximal value of ∼1.5 s−1, a K 1/2 of ∼200 μM, and a basal value of ∼0.2 s−1. The maximal rate at saturating ATP concentrations corresponds quite well to the opening rate (i.e., the inverse of the long and ATP-dependent mean closed time) derived from single-channel measurements at saturating ATP in several single channel studies (e.g., Aleksandrov and Riordan 1998; Zeltwanger et al. 1999; for review, see Foskett 1998). If only ATP binding and dissociation would gate CFTR like proposed in a simple three-state model (Venglarik et al. 1994), the basal rate of opening and the closing rate should have the same value. The clear deviation therefore is evidence for irreversible steps (see Gunderson and Kopito 1995) in the gating cycle, as expected from the contribution of ATP hydrolysis.
The Relation between the ATP Hydrolysis Cycle and CFTR Gating
A recent publication by Ramjeesingh et al. 1999 questions the assumption of a tight coupling between ATP hydrolysis and channel gating. In fact, their time constants for open time bursts and interburst duration for wild-type (WT) CFTR (roughly 150 ms) are too fast to agree with our observed relaxation time constants and would suggest several openings and closings during one ATP hydrolysis cycle. This would be contrary to present models where channels are opened by ATP binding (Gunderson and Kopito 1995) or hydrolysis (Baukrowitz et al. 1994; Hwang et al. 1994; Carson et al. 1995), and close after dissociation of the last hydrolysis product. Their conclusions were derived from studying the gating (temperature not specified) and the ATPase activity (at 30°C) of purified CFTR protein, either WT or the mutants K464A or K1250A. However, in contrast to their open burst duration for the mutant K1250A of 265 ms (temperature not specified) are dramatically increased open burst durations found by other groups (65 s for Gunderson and Kopito 1995; 3 min for Zeltwanger et al. 1999; both at room temperature). Carson et al. 1995 found an open burst duration for K1250A at 34–36°C of ∼1 s. Further experiments are needed to establish the “tightness” of coupling between ATP hydrolysis and CFTR gating. Therefore, we use in our cyclic models of CFTR gating (Fig. 11 and Fig. 12) an activated state A instead of an open state O in order to not exclude a priori the possibility of several openings and closings during the ATP hydrolysis cycle. The term “activated” was also used in the model proposed by Gunderson and Kopito 1995. In their model, CFTR gets activated by ATP hydrolysis at NBF1, but the channel can only open after ATP binding at NBF2. With activated, we mean that the CFTR channel is able to open once or several times.
Figure 11.
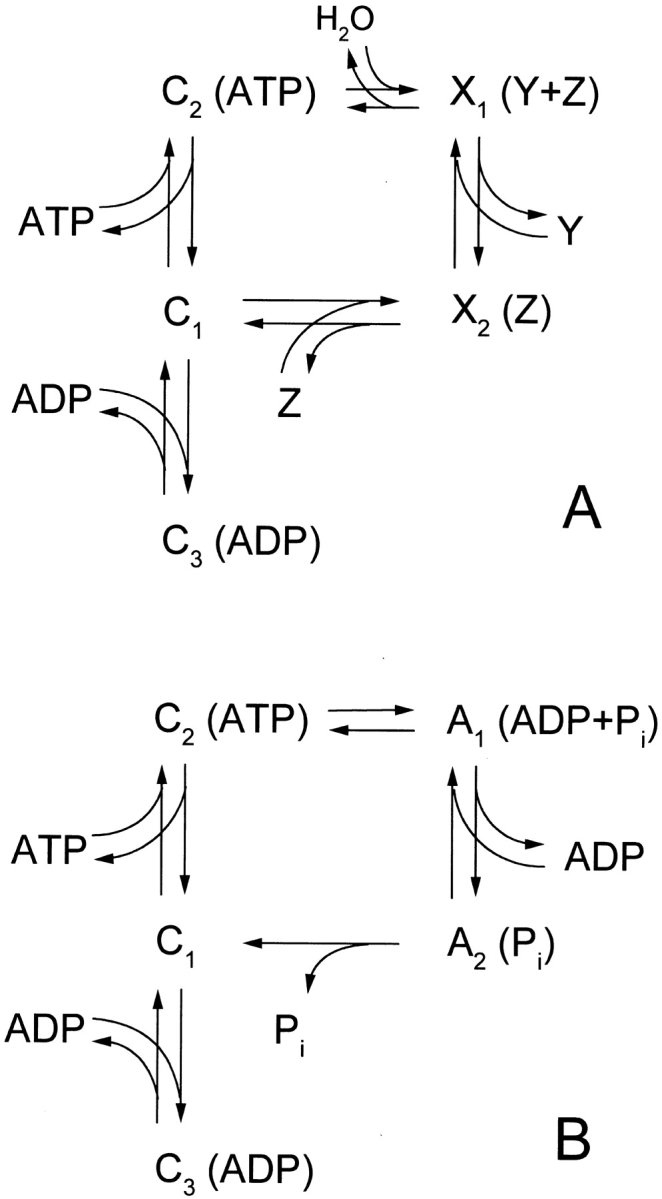
Models of CFTR gating involving only one nucleotide binding domain. (A) General gating cycle including ATP hydrolysis. C1 to C3 are closed states of the channels, X1 and X2 may be closed or open states or fluctuate between open and closed. Y and Z denote either of the two ATP hydrolysis products ADP and Pi. (B) Proposed gating cycle based on the relaxation measurements. A1 and A2 are activated states of the channel with open probability >0 (see main text for details). The A2 to C1 transition was made irreversible because in our experiments  .
.
Figure 12.

Model of CFTR regulation involving both nucleotide binding domains (modified after Gadsby and Nairn 1999). The two NBDs are represented as adjoining squares with NBD-A on the left. Only five major states are given that are important to explain the action of ADP on the activated channel. In this model, NBD-B becomes accessible to nucleotides after the channel has been activated; i.e., in state S3. If ATP is bound to NBD-B, the channel enters a long-lived activated state (S4) that is terminated by hydrolysis of the ATP to ADP. If ADP is bound instead, this long-lived activated state is bypassed and the channel enters a short-lived activated state (S5). If neither ATP nor ADP is bound to NBD-B, the channel may still inactivate from state S3, but not as fast as from the short-lived activated state S5. Note that in this model Pi is always the first ATP hydrolysis product to be released. Only transitions where Pi is released were shown irreversible as in our experiments the concentration of Pi was always zero. See text for further explanation.
Possible Mechanisms of Inhibition by ADP
ADP was recognized as an inhibitor of CFTR soon after the activating role of ATP was detected (Anderson and Welsh 1992). Its inhibitory mechanism could be modeled by competitive binding to the nucleotide binding site. Studies with mutants suggested that ADP binds to NBF2 (Anderson and Welsh 1992). Our results confirm the strong inhibitory action of ADP with an apparent K I of 215 μM at an ATP concentration of 500 μM, which for competitive inhibition corresponds to a K I of 31 μM compared with a K m for ATP of 84 μM. Our pre–steady state experiments when activation by ATP is initiated concomitant with ADP removal showed a clear reduction in the relaxation rate, suggesting competitive binding of ADP and ATP to the nucleotide binding site involved in channel opening (NBD-A).
Contrary to our expectations, however, we also found a significantly increased relaxation rate upon ATP removal when the ATP-free solution contained ADP. It is obvious that this finding cannot be explained by a competition between ATP and ADP at an empty NBD-A site on the closed (not activated) channel. In the absence of ATP, only interactions with the activated channel can contribute to a change of the relaxation rate because a shift from closed channels to closed channels with bound ADP is electrically “silent” under these conditions. We have to conclude, therefore, that ADP may also bind to the activated channel.
We propose two possible mechanisms for the observed accelerated closing by ADP, depending on whether ADP acts at NBD-A or NBD-B. The two models are distinguished by the order of release of the two hydrolysis products; i.e., ADP or Pi first.
Can ADP Reverse ATP-induced Activation by Binding to NBD-A?
We will first discuss a possible explanation of the ADP effect on the basis of a single hydrolysis cycle (at NBD-A). This requires ADP binding to NBD-A after the channel has been opened by ATP interaction at NBD-A. In this case, ADP may only bind after ADP generated by hydrolysis of ATP has been released from NBD-A. ADP would then act via product inhibition, with the channel driven back to the closed state by reversion of ATP hydrolysis, in this way rebuilding ATP. This is thermodynamically feasible since the process takes place at a very low ATP:ADP ratio (during the relaxation, [ATP] is essentially zero, while [ADP] is 0.5 mM). Also, to explain the observed acceleration of channel closing by ADP, the rate of closing by reversal of activation must be about the same as the rate of closing by completion of the ATP hydrolysis cycle.
This explanation for the effect of ADP on the rate of channel closing requires that during the ATP hydrolysis cycle ADP is released before Pi, because otherwise reversion of ATP hydrolysis is impossible under our conditions where  . This is illustrated by the gating model shown in Fig. 11. In Fig. 11 A, a general model of a gating cycle driven by ATP hydrolysis at a single site is presented. The channel is enabled to open simultaneous with or after ATP hydrolysis and loses this ability when the two hydrolysis products, ADP and Pi, are released. This general model does not specify at which step in the hydrolysis cycle the closed-to-open and open-to-closed transitions are located, nor does it specify the order of release of the two hydrolysis products. Included in the model is the competitive binding of ADP to the closed channel (state C1), which explains the slowing of opening upon a change from ADP to ATP, but cannot explain the acceleration by ADP of the relaxation upon ATP withdrawal.
To incorporate the binding of ADP to the activated channel into the model, X2 must be an activated state and must be able to bind ADP. This implies that ADP is released before the phosphate. If one assumes that the closed-to-activated transition is coupled to ATP hydrolysis, rather than to ADP release, X1 is also an activated state. This results in the model in Fig. 11 B with two activated states, A1 and A2, and three closed states, C1, C2, and C3. The ratio of A1 to A2 is dependent on the ADP concentration. If [ADP] is low, the channels will close via the A2–C1 transition. At high [ADP], however, the A1:A2 ratio will be higher, allowing the channels at low [ATP] to close via the A1–C2 transition, which may have a similar or higher rate than the A2–C1 transition, resulting in the accelerated relaxation rate observed in our measurements.
Although attractive on the grounds that only one NBD has to be invoked (in accordance with our observation of a single-exponential accelerated decay), this explanation is in contrast to previously published models about the hydrolysis cycle of CFTR (Baukrowitz et al. 1994) or Pgp, another ATP-binding cassette transport protein (Senior et al. 1995; Hrycyna et al. 1998), all of which argue for the phosphate release to precede the ADP release. To explain the observed effect of ADP on the “closing” relaxation with a model where phosphate release precedes ADP release, we therefore had to consider ADP binding to a second site.
Can ADP Binding to NBD-B Accelerate the Activated-to-Closed Transition?
Previously, it was shown that binding of nucleotides (specifically AMP-PNP) to a second site, NBD-B, modulates channel closing (Hwang et al. 1994). Therefore, ADP binding to NBD-B could accelerate one of the steps in the hydrolysis cycle at NBD-A, and consequently lead to a higher channel closing rate as seen in our relaxation experiments. A model that explains the closing of CFTR channels as dependent on nucleotide binding to NBD-B was already proposed by Hwang et al. 1994. According to this model, ATP binding to NBD-B is only possible for highly phosphorylated CFTR, whereas no data were available for ADP binding to NBD-B.
As can be inferred from the only partial effect of AMP-PNP on channel closing, our data were obtained from partly dephosphorylated channels, but show ADP-induced acceleration of closing for all CFTR channels. Assuming binding of ADP to NBD-B, this could indicate that NBD-B is accessible to ADP regardless of the phosphorylation state.
Recently, Senior and Gadsby 1997 proposed for highly phosphorylated channels that NBD-B always has bound nucleotides (ATP or ADP) similar to a G-protein. Although this model was further modified by an additional pathway, closing without ATP binding at the second site (Gadsby and Nairn 1999), it cannot explain all of our data. Therefore, we have adapted it (see Fig. 12) by inserting an additional alternative pathway into the cycle and by eliminating the need for constantly bound nucleotide at NBD-B.
In the presence of ATP, if NBD-B is accessible, the gating cycle is driven by ATP hydrolysis at both NBDs. NBD-B becomes accessible to nucleotides only after ATP is bound and hydrolyzed at NBD-A, when the channel is activated. In addition to the complete cycle via S4 and S5, which requires ATP binding to NBD-B, two shortcuts in the cycle may occur. One of these bypasses nucleotide binding to NBD-B and allows the channel to close from the S3 state. This corresponds to the closing in the absence of any nucleotide as observed in the relaxation after ATP removal. Although this is the shortest cycle in the scheme (Fig. 12), it is not the cycle with the shortest open duration, see below.
In the model proposed by Gadsby and Nairn 1999, the corresponding states S1, S2, and S3 have bound ADP on NBD-B, which we did not include for simplicity and because we have no experimental evidence for it. NBD-B–bound ADP in states S1 and S2 is not in contrast to our experimental findings; however, NBD-B–bound ADP in S3 is in contrast as ADP led to the shortest open duration (i.e., fastest closing relaxation) in our experiments. Therefore, we postulate that a third pathway allows ADP binding to S3, thereby bypassing state S4. The observed acceleration of the closing relaxation by ADP could then be explained if S3 were long-lived compared with S5 so that the transition S3–S5–S1 becomes faster than S3–S1. This implies that ADP bound to NBD-B speeds the rate of release of hydrolysis products from NBD-A. If, as in our model, S1 has no bound ADP on NBD-B (which we cannot determine presently, see above), the release of ADP from NBD-B must also occur rapidly during the S5–S1 transition.
In the presence of ATP, ATP binding to NBD-B might occur in the state S3 leading to state S4, and the transition rate from S4 to S5, which may be slow, will determine the time the channel remains activated. If this explanation is correct, competition between ATP and ADP not only regulates the likelihood of channel opening, but the rate of channel closure as well.
Based on our relaxation experiments, we cannot yet discriminate between the two possible modes of ADP interaction with the activated channel. It is clear, however, that the inhibitory action of ADP is more complicated than previously thought, since a competition with ATP for binding at the activating site (NBD-A) alone cannot explain all our observations.
Conclusions
By observing the relaxations of large numbers of CFTR channels under pre–steady state conditions, we have shown that the time course of channel opening and closing is modulated by the presence of different nucleotides. The nonhydrolyzable ATP analogue AMP-PNP delays closing of CFTR channels, previously opened by ATP. This is in agreement with earlier findings and the suggestion that AMP-PNP (like ATP) prevents channel closing by binding to NBD-B. Our new finding of inhibitory binding of AMP-PNP to NBD-A is further strong support for the requirement of ATP hydrolysis at NBD-A in channel opening.
In addition to inhibitory competing with ATP, we found that ADP regulates the closing rate of the channel as well. This constitutes a new twist to the mechanism by which the energy charge of the cell (i.e., the [ADP]:[ATP] ratio) regulates CFTR activity, as proposed by Reddy and Quinton 1996. The findings lead to a modified model for the regulation of CFTR gating by nucleotides.
The results presented in this study were obtained from partly dephosphorylated channels with a lower than maximal open probability. We present evidence that at higher phosphorylation nucleotide-dependent gating is additionally modified, leading to slower relaxations. The characterization of channels with better defined phosphorylation status, as well as of CFTR with mutant NBDs, as discriminating between interactions with either or both NBDs awaits further study.
Acknowledgments
We thank Doris Ollig for expert technical assistance, Phillip Wood for help in the preparation of the cRNA, Klaus Fendler for discussion of kinetic models, and Ernst Bamberg for constant encouragement. We also thank Tzyh-Chang Hwang and David Gadsby for providing preprints before publication and David Gadsby for reading the manuscript and insightful comments.
This study was supported by the Deutsche Forschungsgemeinschaft (NA 207/4-1 to G. Nagel), Max-Planck-Gesellschaft, the Cystic Fibrosis Foundation, and the National Institutes of Health (DK51619 to J.R. Riordan).
Footnotes
1used in this paper: AMP-PNP, Adenylylimidodiphosphate; CFTR, cystic fibrosis transmembrane conductance regulator; NBD, nucleotide binding domain; NBF, nucleotide binding fold; NPE-ATP, ATP-P3-[1-(2-nitrophenyl)ethyl]ester (or caged ATP)
Dr. Weinreich's present address is Center for Molecular Neurobiology (ZMNH), Hamburg University, Martinistrasse 52, D-20246 Hamburg, Germany.
The term activated was also used by Gunderson and Kopito 1995, but with a different meaning. As described above, we use activated to mean that the channel is enabled to open once or several times.
References
- Aleksandrov A.A., Riordan J.R. Regulation of CFTR ion channel gating by MgATP. FEBS Lett. 1998;431:97–101. doi: 10.1016/s0014-5793(98)00713-3. [DOI] [PubMed] [Google Scholar]
- Ames G.F.-L., Mimura C.S., Shyamala V. Bacterial periplasmic permeases belong to a family of transport proteins operating from Escherichia coli to humantraffic ATPases. FEMS Microbiol. Rev. 1990;6:429–446. doi: 10.1111/j.1574-6968.1990.tb04110.x. [DOI] [PubMed] [Google Scholar]
- Anderson M.P., Berger H.A., Rich D.P., Gregory R.J., Smith A.E., Welsh M.J. Nucleoside triphosphates are required to open the CFTR chloride channel. Cell. 1991;67:775–784. doi: 10.1016/0092-8674(91)90072-7. [DOI] [PubMed] [Google Scholar]
- Anderson M.P., Welsh M.J. Regulation by ATP and ADP of CFTR chloride channels that contain mutant nucleotide-binding domains. Science. 1992;257:1701–1704. doi: 10.1126/science.1382316. [DOI] [PubMed] [Google Scholar]
- Baukrowitz T., Hwang T.-C., Nairn A.C., Gadsby D.C. Coupling of CFTR Cl− channel gating to an ATP hydrolysis cycle. Neuron. 1994;12:473–482. doi: 10.1016/0896-6273(94)90206-2. [DOI] [PubMed] [Google Scholar]
- Bear C.E., Duguay F., Naismith A.L., Kartner N., Hanrahan J.W., Riordan J.R. Cl− channel activity in Xenopus oocytes expressing the cystic fibrosis gene. J. Biol. Chem. 1991;266:19142–19145. [PubMed] [Google Scholar]
- Bear C.E., Li C.H., Kartner N., Bridges R.J., Jensen T.J., Ramjeesingh M., Riordan J.R. Purification and functional reconstitution of the cystic fibrosis transmembrane conductance regulator (CFTR) Cell. 1992;68:809–818. doi: 10.1016/0092-8674(92)90155-6. [DOI] [PubMed] [Google Scholar]
- Carson M.R., Travis S.M., Welsh M.J. The two nucleotide-binding domains of cystic fibrosis transmembrane conductance regulator (CFTR) have distinct functions in controlling channel activity. J. Biol. Chem. 1995;270:1711–1717. doi: 10.1074/jbc.270.4.1711. [DOI] [PubMed] [Google Scholar]
- Foskett J.K. ClC and CFTR chloride channel gating. Annu. Rev. Physiol. 1998;60:689–717. doi: 10.1146/annurev.physiol.60.1.689. [DOI] [PubMed] [Google Scholar]
- Friedrich T., Bamberg E., Nagel G. Na+,K+-ATPase pump currents in giant excised patches activated by an ATP concentration jump. Biophys. J. 1996;71:2486–2500. doi: 10.1016/S0006-3495(96)79442-0. [DOI] [PMC free article] [PubMed] [Google Scholar]
- Gadsby D.C., Rakowski R.F., De Weer P. Extracellular access to the Na,K pumppathway similar to ion channel. Science. 1993;260:100–103. doi: 10.1126/science.7682009. [DOI] [PubMed] [Google Scholar]
- Gadsby D.C., Nagel G., Hwang T.-C. The CFTR chloride channel of mammalian heart. Annu. Rev. Physiol. 1995;57:387–416. doi: 10.1146/annurev.ph.57.030195.002131. [DOI] [PubMed] [Google Scholar]
- Gadsby D.C., Nairn A.C. Control of CFTR channel gating by phosphorylation and nucleotide hydrolysis. Physiol. Rev. 1999;79:S77–S107. doi: 10.1152/physrev.1999.79.1.S77. [DOI] [PubMed] [Google Scholar]
- Gunderson K.L., Kopito R.R. Effects of pyrophosphate and nucleotide analogs suggest a role for ATP hydrolysis in cystic fibrosis transmembrane conductance regulator channel gating. J. Biol. Chem. 1994;269:19349–19353. [PubMed] [Google Scholar]
- Gunderson K.L., Kopito R.R. Conformational states of CFTR associated with channel gatingthe role of ATP binding and hydrolysis. Cell. 1995;82:231–239. doi: 10.1016/0092-8674(95)90310-0. [DOI] [PubMed] [Google Scholar]
- Hilgemann D.W. Giant excised cardiac sarcolemmal membrane patchessodium and sodium-calcium exchange currents. Pflügers Arch. 1989;415:247–249. doi: 10.1007/BF00370601. [DOI] [PubMed] [Google Scholar]
- Hilgemann D.W. The giant membrane patch. In: Sakmann B., Neher E., editors. Single Channel Recording. Plenum Publishing Corp; New York: 1995. pp. 307–327. [Google Scholar]
- Hrycyna C.A., Ramachandra M., Ambudkar S.V., Ko Y.H., Pedersen P.L., Pastan I., Gottesman M.M. Mechanism of action of human P-glycoprotein ATPase activity. Photochemical cleavage during a catalytic transition state using orthovanadate reveals cross-talk between the two ATP sites. J. Biol. Chem. 1998;273:16631–16634. doi: 10.1074/jbc.273.27.16631. [DOI] [PubMed] [Google Scholar]
- Hwang T.-C., Horie M., Gadsby D.C. Functionally distinct phospho-forms underlie incremental activation of protein kinase-regulated Cl− conductance in mammalian heart. J. Gen. Physiol. 1993;101:629–650. doi: 10.1085/jgp.101.5.629. [DOI] [PMC free article] [PubMed] [Google Scholar]
- Hwang T.-C., Nagel G., Nairn A.C., Gadsby D.C. Regulation of the gating of cystic fibrosis transmembrane conductance regulator Cl channels by phosphorylation and ATP hydrolysis. Proc. Natl. Acad. Sci. USA. 1994;91:4698–4702. doi: 10.1073/pnas.91.11.4698. [DOI] [PMC free article] [PubMed] [Google Scholar]
- Hyde S.C., Emsley P., Hartshorn M.J., Mimmack M.M., Gileadi U., Pearce S.R., Gallagher M.P., Gill D.R., Hubbard R.E., Higgins C.F. Structural model of ATP-binding proteins associated with cystic fibrosis, multidrug resistance and bacterial transport. Nature. 1990;346:362–365. doi: 10.1038/346362a0. [DOI] [PubMed] [Google Scholar]
- Kaplan J.H., Forbush B., III, Hoffmann J.F. Rapid photolytic release of adenosine-5′-triphosphate from a protected analogueutilization by the Na:K pump of human red blood cell ghosts. Biochemistry. 1978;17:1929–1935. doi: 10.1021/bi00603a020. [DOI] [PubMed] [Google Scholar]
- Mathews C.J., Tabcharani J.A., Hanrahan J.W. The CFTR chloride channelnucleotide interactions and temperature-dependent gating. J. Membr. Biol. 1998;163:55–66. doi: 10.1007/s002329900370. [DOI] [PubMed] [Google Scholar]
- McCray J.A., Herbette L., Kihara T., Trentham D.R. A new approach to time-resolved studies of ATP-requiring biological systemslaser flash photolysis of caged ATP. Proc. Natl. Acad. Sci. USA. 1980;12:7237–7241. doi: 10.1073/pnas.77.12.7237. [DOI] [PMC free article] [PubMed] [Google Scholar]
- Miledi R. A calcium-dependent transient outward current in Xenopus laevis oocytes. Proc. R. Soc. Lond. B Biol. Sci. 1982;215:492–497. doi: 10.1098/rspb.1982.0056. [DOI] [PubMed] [Google Scholar]
- Nagel G., Hwang T.-C., Nastiuk K.L., Nairn A.C., Gadsby D.C. The protein kinase A-regulated cardiac Cl− channel resembles the cystic fibrosis transmembrane conductance regulator. Nature. 1992;360:81–84. doi: 10.1038/360081a0. [DOI] [PubMed] [Google Scholar]
- Nagel G., Wellan-Ely A., Bamberg E., Jensen T., Riordan J.R. Fast activation of CFTR chloride channels, incorporated into a BLM, by an ATP concentration jump Biophys. J. 72 1997. A113(Abstr.) [Google Scholar]
- Quinton P.M. Chloride impermeability in cystic fibrosis. Nature. 1983;301:421–422. doi: 10.1038/301421a0. [DOI] [PubMed] [Google Scholar]
- Quinton P.M., Reddy M.M. Control of CFTR chloride conductance by ATP levels through non-hydrolytic binding. Nature. 1992;360:79–81. doi: 10.1038/360079a0. [DOI] [PubMed] [Google Scholar]
- Ramjeesingh M., Li C., Garami E., Huan L.J., Galley K., Wang Y., Bear C.E. Walker mutations reveal loose relationship between catalytic and channel-gating activities of purified CFTR (cystic fibrosis transmembrane conductance regulator) Biochemistry. 1999;38:1463–1468. doi: 10.1021/bi982243y. [DOI] [PubMed] [Google Scholar]
- Reddy M.M., Quinton P.M. Hydrolytic and nonhydrolytic interactions in the ATP regulation of CFTR Cl− conductance. Am. J. Physiol. 1996;271:C35–C42. doi: 10.1152/ajpcell.1996.271.1.C35. [DOI] [PubMed] [Google Scholar]
- Riordan J.R., Alon N., Grzelczak Z., Dubel S., Sun S.Z. The CF gene product as a member of a membrane transporter (TM6-NBF) super family. Adv. Exp. Med. Biol. 1991;290:19–29. doi: 10.1007/978-1-4684-5934-0_3. [DOI] [PubMed] [Google Scholar]
- Riordan J.R., Rommens J.M., Kerem B.-S., Alon N., Rozmahel R., Grzelczak Z., Zielenski J., Lok S., Plavsic N., Chou J.-L. Identification of the cystic fibrosis genecloning and characterization of complementary DNA. Science. 1989;245:1066–1073. doi: 10.1126/science.2475911. [DOI] [PubMed] [Google Scholar]
- Schultz B.D., Bridges R.J., Frizzell R.A. Lack of conventional ATPase properties in CFTR chloride channel gating. J. Membr. Biol. 1996;151:63–75. doi: 10.1007/s002329900058. [DOI] [PubMed] [Google Scholar]
- Schultz B.D., Venglarik C.J., Bridges R.J., Frizzell R.A. Regulation of CFTR Cl− channel gating by ADP and ATP analogues. J. Gen. Physiol. 1995;105:329–361. doi: 10.1085/jgp.105.3.329. [DOI] [PMC free article] [PubMed] [Google Scholar]
- Senior A.E., Gadsby D.C. ATP hydrolysis cycles and mechanism in P-glycoprotein and CFTR. Semin. Cancer Biol. 1997;8:143–150. doi: 10.1006/scbi.1997.0065. [DOI] [PubMed] [Google Scholar]
- Senior A.E., Al-Shawi M.K., Urbatsch I.L. The catalytic cycle of P-glycoprotein. FEBS Lett. 1995;377:285–289. doi: 10.1016/0014-5793(95)01345-8. [DOI] [PubMed] [Google Scholar]
- Tabcharani J.A., Chang X.-B., Riordan J.R., Hanrahan J.W. Phosphorylation-regulated Cl− channel in CHO cells stably expressing the cystic fibrosis gene. Nature. 1991;352:628–631. doi: 10.1038/352628a0. [DOI] [PubMed] [Google Scholar]
- Venglarik C.J., Schultz B.D., Frizzell R.A., Bridges R.J. ATP alters current fluctuations of cystic fibrosis transmembrane conductance regulatorevidence for a three-state activation mechanism. J. Gen. Physiol. 1994;104:123–146. doi: 10.1085/jgp.104.1.123. [DOI] [PMC free article] [PubMed] [Google Scholar]
- Walker J.E., Saraste M., Runswick M.J., Gay N.J. Distantly related sequences in the α- and β-subunits of ATP synthase, myosin, kinases and other ATP-requiring enzymes and a common nucleotide binding fold. EMBO (Eur. Mol. Biol. Organ.) J. 1982;1:945–951. doi: 10.1002/j.1460-2075.1982.tb01276.x. [DOI] [PMC free article] [PubMed] [Google Scholar]
- Walker J.W., Reid G.P., McCray J.A., Trentham D.R. Photolabile 1-(2-nitrophenyl)ethyl phosphate esters of adenine nucleotide analogues. Synthesis and mechanism of photolysis. J. Am. Chem. Soc. 1988;110:7170–7177. [Google Scholar]
- Weinreich F., Wood P.G., Riordan J.R., Nagel G. Direct action of genistein on CFTR. Pflügers Arch. 1997;434:484–491. doi: 10.1007/s004240050424. [DOI] [PubMed] [Google Scholar]
- Winter M.C., Sheppard D.N., Carson M.R., Welsh M.J. Effect of ATP concentration on CFTR Cl− channelsa kinetic analysis of channel regulation. Biophys. J. 1994;66:1398–1403. doi: 10.1016/S0006-3495(94)80930-0. [DOI] [PMC free article] [PubMed] [Google Scholar]
- Young G.P., Young J.D., Deshpande A.K., Goldstein M., Koide S.S., Cohn Z.A. A Ca2+-activated channel from Xenopus laevis oocyte membranes reconstituted into planar bilayers. Proc. Natl. Acad. Sci. USA. 1984;81:5155–5159. doi: 10.1073/pnas.81.16.5155. [DOI] [PMC free article] [PubMed] [Google Scholar]
- Zeltwanger S., Wang F., Wang G.-T., Gillis K.D., Hwang T.-C. Gating of CFTR chloride channels by ATP hydrolysisquantitative analysis of a cyclic gating scheme. J. Gen. Physiol. 1999;113:541–554. doi: 10.1085/jgp.113.4.541. [DOI] [PMC free article] [PubMed] [Google Scholar]