

Abstract
On activation of a receptor the G protein βγ complex translocates away from the receptor on the plasma membrane to the Golgi complex. The rate of translocation is influenced by the type of γ subunit associated with the G protein. Complementary approaches — imaging living cells expressing fluorescent protein tagged G proteins and assaying reconstituted receptors and G proteins in vitro — were used to identify mechanisms at the basis of the translocation process. Translocation of Gβγ containing mutant γ subunits with altered prenyl moieties showed that the differences in the prenyl moieties were not sufficient to explain the differential effects of geranylgeranylated γ5 and farnesylated γ11 on the translocation process. The translocation properties of Gβγ were altered dramatically by mutating the C terminal tail region of the γ subunit. The translocation characteristics of these mutants suggest that after receptor activation, Gβγ retains contact with a receptor through the γ subunit C terminal domain and that differential interaction of the activated receptor with this domain controls Gβγ translocation from the plasma membrane.
Keywords: Imaging, G protein coupled receptor, G protein subunit, Translocation
1. Introduction
The activation of a heterotrimeric G protein by a receptor is the primary step in the regulation of a variety of physiological processes. The molecular mechanisms that lie at the basis of this process are still not fully identified. Evidence has accumulated for all three subunits — α, β and γ — of the G protein playing a role in this process [1–9]. However, the specific roles that these subunits play in the activation process are not entirely clear. The classical view of this process of G protein activation by a receptor is that the activated α and βγ subunits function on the plasma membrane [10,11]. Recently, it has been shown that the G protein βγ complex translocates to the Golgi complex in response to receptor activation [12]. βγ complexes containing two different γ subunit types, γ5 and 11, translocate at different rates. In the context of extensive earlier evidence implicating the γ subunit in receptor interaction [4,7,9,13–16], this result raised the possibility that G protein γ subunit interaction with a receptor played a role in the translocation process. Here we examined the role of the γ subunit in the receptor mediated translocation of the βγ complex using complementary approaches. First, by examining the receptor mediated translocation of mutant γ subunits in living cells with imaging methods and second, by assaying the same mutants for their effect on receptor-G protein coupling in vitro in a reconstituted system containing purified recombinant receptor and G protein.
The differential translocation properties of βγ5 and βγ11 complexes were used to identify the role of the γ subunit in receptor mediated translocation of the βγ complex. First, we examined whether the prenyl moiety that is post-translationally added to the γ subunit is the main determinant of the differential translocation. γ5 is geranylgeranylated and γ11 is farnesylated [17,18]. A farnesylated γ5 subunit mutant translocated more rapidly compared to the wild type γ5 but slower than the γ11 subunit. In contrast, a γ11 mutant modified with geranylgeranyl mostly retained the translocation properties of γ11. These results indicated that the type of prenyl moiety attached to the γ subunit type affected the βγ translocation properties only in a limited fashion and the amino acid sequence of the γ subunit C terminal domain played a critical role in the translocation process.
Based on previous evidence suggesting that the C terminal domain of the γ subunit interacts with receptors we examined whether the receptor induced translocation of βγ was influenced by the C terminal domain of the γ subunit. Chimeric molecules of γ5 and γ11 were made in which the ten residues upstream of the CAAX box were swapped. The translocation properties of the chimeras corresponded with the origin of the C terminal tail region — βγ containing the γ11 subunit with the C terminal domain of γ5 translocated similar to γ5 while βγ containing a γ5 subunit with the C terminal domain of γ11 translocated similar to γ11. These results implied that the amino acid sequence at the γ subunit C terminal tail domain influenced the translocation process. Consistent with the above findings, three different γ5 mutants, a deletion without the ten residues upstream of the CAAX box, an insertion mutant containing six Gly residues upstream of the CAAX box and a F59A point mutant demonstrated translocation properties similar to γ11. These results suggest that the relative affinity of the γ subunit C terminal tail domain for an activated receptor controls the receptor mediated βγ translocation process. Viewed together with previous evidence that supports a direct role for the γ subunit in G protein activation by a receptor, these results suggest that depending on the type of γ subunit type, the G protein βγ complex is retained on the receptor after receptor activation.
2. Materials and methods
2.1. Chemicals and expression constructs
Unless otherwise indicated, chemicals used in the experiments were from Sigma (St. Louis, MO). CHO cells stably transfected with high copy numbers of M2 receptor encoding cDNA (M2-CHO) have been described [13,19]. The M2-CHO cells were grown in CHO IIIa medium (Invitrogen, CA) containing dialyzed fetal bovine serum (Atlanta Biologicals, GA), methotrexate, glutamine, penicillin, streptomycin, gentamicin and fungizone. We used site directed mutagenesis to synthesize the citrine mutant of YFP and mutant forms of CFP and YFP that are incapable of oligomerizing [12,20]. αo-CFP, β1, YFP-γ5 and YFP-γ11 constructs were engineered as described before [12]. The cDNA fusions were made such that in the encoded proteins CFP was introduced after Gly92 of αo and YFP fused to the N terminus of the wild type γ subunit type [21]. The β1 construct was engineered as described before [12]. YFP-γ5-Δ was cloned into pENTRY vector and then transferred to pDEST (Invitrogen, CA) designed for mammalian expression. All other γ subunit mutants, YFP-γ11, YFP-γ5 and αo-CFP were made in pcDNA3.1. The γ5-Far, γ11-Ger, γ5-11-Ger, γ11-5, γ5-6G and γ5-F59A mutants were created using γ5 and γ11 as templates with appropriate primers using PCR and cloned into the KpnI and EcoRI sites of pcDNA3.1 (Invitrogen, CA) as were the YFP-γ11 and YFP-γ5. All γ subunit fusions, wild type and mutant contained YFP at the N terminus such that prenylation of the γ subunit was unaffected. Protein sequences are shown in the figures. αo-CFP was cloned into the EcoRI and XbaI sites of pcDNA3.1. All constructs were checked by determining the nucleotide sequence.
2.2. Imaging
Cells were cultured on glass coverslips and transiently transfected with appropriate combinations of different G-protein subunits and analyzed as described before [12,21]. Briefly, the coverslips were washed using Hank’s balanced salt solution (HBSS) containing 10mM Hepes pH 7.4 and 1mg/ml glucose. Cells on the coverslips were observed using an imaging chamber of 25μl volume (Warner Instruments, CT). Buffer with or without agonist and antagonist was delivered to the chamber using a programmable electronically controlled fluid delivery system (Automate Scientific, CA) at a rate of 1ml/min with a pressure regulated flow controller. A Zeiss Axioscope fluorescent microscope (100W mercury lamp) with a 63× oil immersion objective (1.4 N.A.) and a Hamamatsu CCD Orca-ER camera were used for imaging the cells. The excitation wavelengths and the emission wavelengths were controlled using optical filters and beam splitters from Chroma Technology, VT. The filter characteristics were as follows: CFP (CC): D436/20 excitation (x), D480/40 emission (m); for YFP (YY): D500/20 (x), D535/30 (m); a polychroic beam splitter (Chroma #86002BS) and 3 or 10% neutral density filters. Sutter Lambda 10-2 Optical Filter Changer (Sutter Instrument Company, CA) regulated the shutter, emission and excitation filter wheels. Image acquisition and processing were controlled by Metamorph (Universal Imaging, PA) software. Exposure times in capturing images ranged between 0.6–1.4s and the intervals between images were 20s.
2.3. Quantitative measures of translocation
To quantitate the extent of translocation of the G protein βγ complex we computed two parameters: the percent decrease in YFP-γ on the plasma membrane and the change in the ratio of YFP-γ intensity in the Golgi complex to the intensity in the plasma membrane. The average grey scale intensities of the plasma membrane and the Golgi complex were determined using Metamorph by selecting these regions. To eliminate the background intensity seen in all cells due to light scattering from the cell outside the focal plane and due to the increased concentration of the protein in certain regions the minimum intensity per pixel inside the cell was determined. This value was subtracted from the average intensity per pixel from both the plasma membrane and Golgi regions.
2.4. Synthesis and purification of M2 receptor, G protein subunits and GTPase assay
Purification of M2, reconstitution of the receptor and receptor stimulated GTPase assays were performed as described previously [22]. Briefly, His-tagged M2 receptor was expressed in insect cells, purified and reconstituted into brain lipids. αo and βγ complexes were pre-incubated for 30min at 4°C to obtain the G protein heterotrimer. M2 reconstituted in lipid (1nM) was assayed with G protein (4nM) and RGS4 (100nM) for 30min at 4°C in 20mM Hepes buffer, pH 8, containing 2mM MgCl2, 100mM NaCl, 10 μM GDP, 0.1mM EDTA, 0.5mg/ml BSA and 5mM DTT. The final reaction mix was equilibrated at 23°C. The reaction was started with final concentrations of 0.2μM γ[32P]GTP, 1mM carbachol or vehicle and stopped with ice cold 5% charcoal in 50mM sodium phosphate pH 7.0. The samples were centrifuged, and the radioactivity in the supernatant was estimated using scintillation counting. His-tagged RGS4 was purified from bacteria coexpressing myristyl-transferase. The γ5 mutants, γ5-Δ? γ5-F59A, γ5-6G were created by using Quik-Change Mutagenesis Kit (Stratagene) on pFast-BAC vector (Gibco-BRL) and transferred to pDEST12.2 (Invitrogen, CA). γ5-F59A and γ5-6G were later subcloned into pcDNA3.1. All constructs were checked by determining the nucleotide sequence. The γ5 encoding cDNAwas modified to contain a 6-His-tag. Baculoviruses containing γ5 and β1 subunit types were created using the GATEWAY system (Gibco-BRL). Various βγ complexes were expressed in Sf9 cells using different combinations of the viruses. The expressed complexes were solubilized from the membrane fractions, and purified using Ni–NTA acid Superflow resin (Qiagen) as previously described with slight modifications [23–25]. AlF3 in the final washing step was used to remove endogenous α subunits bound to the βγ complex. The elution buffer contained 1% CHAPS, 250mM Imidazole, 20mM Na–Hepes (pH 8.0), 50mM NaCl, 1mM MgCl2 10mM β-mercaptoethanol, 50μM GDP. Purified fractions were stored at −80°C. Protein concentration was determined using gel electrophoresis, scanning and analysis with IMAGEJ software (http://rsb.info.nih.gov/ij/). The protein fractions were 95% pure. The protein yield was 0.5mg/L of Sf9 cell culture.
The αo subunit was purified from bacteria co-expressing N-methyl transferase as described previously [26]. The purity of the protein was determined as above. GTPγ35S binding was used to determine the concentration of functional protein.
2.5. HPLC and mass spectrometry (MS) to identify post-translational processing of wild type and mutant gamma subunits
The appropriate processing of the mutants and wild type γ5 subunit was confirmed with high performance liquid chromatography (HPLC-Beckman System GOLD). Purified βγ complexes were separated on a C18 300Å column (diameter 4.6×250mm, particle size 5μ, Jupiter, Phenomenex) with a 30% to 80% linear acetonitrile gradient (containing 0.1% TFA) for 50min. Absorbance at 218nM was recorded. The separated γ subunit was further analyzed by MALDI-MS. The retention time of the mutant and wild type γ subunit corresponded with their hydrophobicity [27].
2.6. Heterotrimerization assays
To assess the heterotrimerization efficiency of G protein subunits, pertussis toxin (PTX)-catalyzed ADP ribosylation of α subunit was used as described [28] with slight modifications. Heterotrimerization of purified αo (1.6pmol) and purified βγ subunits (0.4–0.025pmol) was performed in 5μl of buffer A (50mM Tris–Cl pH 8.0, 1mM EDTA, 1mM DTT, 0.025% polyoxyethylene 10 lauryl ether) on ice for 20min. At the same time, 15μl of PTX (100mg/mL) was activated at 30°C for 20min with the addition of 3μl ATP (15mM), 3μl of DTT (1M) and 3μl CHAPS (2.5%). Then, 3μl of [3H]NAD (2.0×10⁶ counts/min), 6μl NAD (100 uM), 6μl DTT (100mM), 6μl MgCl2 (100mM), 3 μl GDP (10mM), 6μl Dimyristoylphosphatidylcholine (30mM; sonicated 5min) and 66μl of water were added to the activated toxin mixture. Then, 3μl of the final PTX mixture was added to the 5μl αβγ heterotrimer mixture on ice and incubated at 30°C for 10min. The reaction was stopped with the addition of 100μl stop solution (50nM NAD and 2% SDS) and 100μl of 30% trichloroacetic acid solution (TCA). After 5min, 300μl of 6% TCA was added and the mixture was filtered through the nitrocellulose filter (Millipore, 0.45μm) and washed with 14ml of 6% TCA. The filters were homogenized in scintillation liquid overnight and counted with a scintillation counter.
3. Results and discussion
3.1. Differential translocation of βγ5 and βγ1
We first examined the translocation of two different γ subunit types, γ5 and γ11 (Fig. 1A) by coexpressing them as fusion proteins containing YFP at the N terminus in M2-CHO cells with αo-CFP and β1. The live cells expressing these proteins were imaged. Images of single cells were captured at 20s. intervals before the addition of an agonist, after the addition of an agonist and after the addition of an antagonist. The intracellular organelle to which the βγ complex translocates from the plasma membrane has been identified as the Golgi complex [12]. The relative YFP and CFP emission intensities on the plasma membrane and the Golgi complex region of the cell images were determined using Metamorph. The intensities were plotted over time from the images as shown in Fig. 1B and C. Both the γ5 and γ11 subunits translocated from the plasma membrane to the Golgi region when the receptor was activated although the plots indicated that they translocate at different rates (Fig. 1B and C). Two different parameters — the percent decrease in YFP-γ intensity on the plasma membrane and change in the Golgi/plasma membrane YFP emission intensity ratio, confirmed this differential rate of translocation of the two different subunit types away from the plasma membrane (Table 1). The γ5 subunit translocated slowly (Table 1, Fig. 1C) and a significant amount of the subunit was still present on the plasma membrane at steady state (Fig. 2). In contrast, live cell images showed that after receptor activation most of the YFP-γ11 had translocated away from the plasma membrane (Fig. 2). Thus the basal level of YFP-γ11 seen in the plasma membrane in the plot shown (Fig. 1B) is likely due to light scattering from the regions of YFP concentration and from regions outside the focal plane in the image. To obtain the results in Table 1 this background emission was determined by identifying the pixel with the lowest grey scale intensity within the cell. This value was subtracted from the mean intensity of a pixel in the selected plasma membrane and Golgi regions to reduce the effect of the background emission. Both subunits translocated back to the plasma membrane when the receptor was inactivated with an antagonist.
Fig. 1.

Translocation of two different γ subunit types. (A) Comparison of the primary structures of the γ5 and γ11 subunit types. The CAAX sequence is post-translationally processed such that the Cys is prenylated, the AAX sequence is proteolytically removed and the carboxyl end methylated [41]. γ5 is geranylgeranylated and γ11 is farnesylated [17]. The C terminal domain that was mutated or exchanged in experiments below is in a box. Conserved residues in grey box are in bold. Time course of the grey scale intensities from the plasma membrane and Golgi regions of M2-CHO cells expressing αo-CFP, β1 and YFP-γ11 (B) or YFP-γ5 (C). In (B) agonist was added after about 10min compared to all other experiments where it was after about 2min. CC is the CFP emission acquired on excitation of CFP. YY is YFP emission acquired on YFP excitation. Arrows indicate time points at which first, agonist and second, antagonist were added sequentially here and in all similar plots below. Plots are scaled to the same time intervals. Agonist: 100μM carbachol and antagonist: 100μM or 1mM atropine. Experiments were performed as described in the Experimental procedures section. Representative plots (n≥4).
Table 1.
Comparison of the translocation of βγ complexes containing different γ subunits
| Percent decrease in PMa,b |
Fold change in Golgi/PMa,c |
||
|---|---|---|---|
| 40s | 2 min | 2 min | |
| γ5 | 7±1 | 26±3 | <2 |
| γ11 | 61±4 | 75±6 | 13 |
| γ5-Far | 22±7 | 40±13 | 4 |
| γ11-Ger | 42±3 | 87±3 | 11 |
| γ11-5 | 10±2 | 34±4 | <2 |
| γ5-11-Ger | 37±3 | 74±6 | 6 |
| γ5-Δd | 66±8 | 79±4 | 7 |
| γ5-6G | 43±7 | 72±5 | 5 |
| γ5-F59A | 48±8 | 88±2 | 10 |
The extent of YFP emission intensity decrease in the plasma membrane and the change in the ratio of YFP emission intensity from the Golgi compared to the plasma membrane after agonist addition in M2-CHO cells expressing αo-CFP, β1 and wild type or mutant γ subunit tagged with YFP.
The internal background was subtracted from the images acquired immediately prior to the addition of agonist and after 40s and 2min after the addition of the agonist. Internal background was determined using Metamorph as the lowest grey scale intensity per pixel inside the cell. This value was subtracted from the mean grey scale intensity per pixel from the plasma membrane and Golgi regions. Values are means with SEM from 3 or 4 independent experiments and are rounded to the nearest whole number.
The mean grey scale intensity of the plasma membrane region after agonist addition was subtracted from the mean intensity before addition of agonist and expressed as a percentile of the mean grey scale intensity before agonist addition.
The ratio of the mean grey scale intensities from the selected Golgi complex and plasma membrane regions of images before and after agonist addition (2 min) were determined. The fold change in this ratio 2 min after addition of agonist was computed.
In the M2-CHO cells expressing YFP-γ5-Δ, β1 and untagged αo were co-expressed.
Fig. 2.

Images of agonist and antagonist treated live cells expressing YFP tagged wild type and mutant γ5 subunits. The γ subunit fusions were coexpressed with αo-CFP and β1. Arrows highlight YFP emission signals on the plasma membrane that show significant changes after agonist or antagonist addition. Details are in the Experimental procedures section. Images are representative. There is a reduction in YFP signal over time due to bleaching especially in the case of γ11 because of a lengthy delay in the acquisition of images after agonist and antagonist addition.
3.2. βγ translocation is coupled to receptor activation of the G protein
When αo-CFP was excited and the emission of CFP (CC) followed in the plasma membrane after agonist addition, it did not show any evidence of translocation (data not shown and [12]). However, the emission from CFP increased simultaneously with the translocation of YFP-γ11 away from the plasma membrane and decreased simultaneously with the translocation of YFP-γ11 back to the plasma membrane (Fig. 1B, plasma membrane panel). The increase in the CC emission results from a decrease in the fluorescence resonance energy transfer (FRET) from αo-CFP to YFP-γ11 when the G protein subunits dissociate on G protein activation [21]. Subsequent inactivation of the receptor results in the heterotrimer reassociating with an increase in the FRET and a corresponding decrease in the FRET donor (CFP) emission. This result indicated that G protein activation was closely coupled with the translocation of βγ.
3.3. The type of prenyl moiety only partially determines translocation properties
We made use of the differential translocation of the two γ subunits to identify the mechanistic basis of the translocation. γ5 is geranylgeranylated while γ11 is farnesylated [17]. Since geranylgeranylated γ5 translocates differentially compared to farnesylated γ11, we examined whether the type of prenyl modification controls the translocation properties. We mutated γ5 and γ11 such that their CAAX boxes were switched resulting in farnesylated γ5 (γ5-Far) and geranylgeranylated γ11 (γ11-Ger) (Fig. 3A). Mass spectrometry has been used to show that ~90% of a γ11 mutant containing the geranylgeranylation target CAAX sequence and a γ2 mutant containing the CAAX sequence for farnesylation were appropriately and fully processed even in insect cells although these proteins were of mammalian origin [29]. Since the cells used here are mammalian, the mutant proteins are expected to be processed appropriately here and in the experiments below. YFP was fused to the N terminus of the mutant γ subunits and the fusions were expressed independently with β1 and αo-CFP in M2-CHO cells. The transfected cells were imaged after receptor activation and inactivation as above. Plots of the emission intensities of YFP from the plasma membrane and Golgi regions of these cells are shown in Fig. 3B and C. The percent decrease in YFP intensity in the plasma membrane region and the rate of change in the Golgi/plasma membrane intensity ratio before and after the addition of agonist are shown in Table 1. These results showed that the farnesylated γ5 translocated significantly more rapidly compared to the geranylgeranylated wild type γ5 but not at a rate similar to γ11 (Fig. 3B). This result suggested that the type of prenyl modification on the γ subunit influences the translocation behavior only in a limited fashion and the amino acid sequence of the γ subunit played a critical role in the translocation. Consistent with this inference, the geranylgeranylated γ11 subunit translocated more similar to the farnesylated wild type γ11 subunit rather than the geranylgeranylated wild type γ5 subunit (Fig. 3C and Table 1).
Fig. 3.

Translocation of two different γ subunit mutants with altered prenyl modifications. (A) Diagrammatic representation of the γ5 and γ11 mutant subunits. Time course of the grey scale intensities from the plasma membrane and Golgi regions of M2-CHO cells expressing αo-CFP, β1 and YFP-γ5-farnesylated (γ5-Far) (B) or YFP-γ11-geranylgeranylated (γ11-Ger) (C). Arrows indicate time points at which agonist and antagonist were added sequentially. Agonist: 100μM carbachol and antagonist: 100μM or 1mM atropine. Experiments were performed as above. Representative plots (n≥4).
3.4. The C terminal domain of the γ subunit influences translocation properties
These experiments indicated that both the type of prenyl moiety and the amino acid sequence are essential but not sufficient individually for regulating translocation. This result was strikingly consistent with earlier findings implicating the γ subunit C terminal tail amino acid sequence as well as the prenyl moiety in receptor interaction of a G protein [7,9]. These results lead us to test whether the previously identified γ subunit C terminal tail domain regulates the translocation process (Fig. 1A, grey box). We made two chimeras containing the γ5 and γ11 C terminal domains. (i) γ11-5 in which the C terminal fourteen residues of γ11 including the CAAX box were substituted with the corresponding residues of γ5 (Fig. 4A). (ii) γ5-11-Ger in which the C terminal ten residues of γ11 upstream of the CAAX box were substituted with the corresponding residues of γ11 and the γ5 CAAX box was retained to ensure geranylgeranylation (Fig. 4A). We ensured that the γ5-11-Ger chimera was geranylgeranylated because the properties of theγ5-Far and γ11-Ger mutants suggested that the prenyl moiety did have an influence (although limited) on the translocation properties of βγ (Fig. 3 and Table 1). By geranylgeranylating theγ5-11-Ger chimera, we planned to isolate the effect of the C terminal amino acid sequence of the γ11 subunit from the effect of the prenyl moiety in this experiment. The chimeras were tagged with YFP at their N termini and coexpressed independently with αo-CFP and β1 in M2-CHO cells. Individual cells were imaged at defined time intervals before the addition of agonist and after the addition of agonist or antagonist. Plots showing the emission intensity of YFP from plasma membrane and Golgi over time are shown in Fig. 4B and C. Table 1 shows the percent decrease in YFP intensity in the plasma membrane and the rate of change in the Golgi/plasma membrane intensity ratio after the addition of the agonist. The γ11-5 chimera had translocation properties that were strikingly similar to γ5. In response to the agonist, it translocated significantly slower compared to the γ11-Ger mutant (Fig. 4B and Table 1) indicating that the close similarity in the properties of γ11-5 and γ5 was due to the amino acid sequence at the C terminal tail region rather than the prenyl moiety. Consistent with this result, the chimera γ5-11-Ger translocated rapidly unlike the γ5 subunit but more similar to the γ11 subunit (Fig. 4C and Table 1) although only the last eleven residues of the chimera are from γ11 and it retained the geranylgeranyl modification of γ5. Together these results showed that the C terminal tail amino acid sequence had a profound effect on the translocation properties of the γ subunit. Viewed together with previous findings that implicate the C terminal γ subunit domain in direct contact with a receptor, the properties of the wild type and chimeric forms of the γ5 and γ11 subunits seen in Figs. 1 and 3 can be explained by a model that predicts that the C terminal domain of the γ5 subunit has significantly higher affinity for the activated receptor compared to the γ11 subunit. The higher affinity of γ5 will prevent the βγ5 complex from translocating to the Golgi complex in the presence of the agonist. In contrast the βγ11 complex would translocate because it has low affinity for the activated receptor.
Fig. 4.

Translocation of two different γ subunit chimeras with switched C terminal domains. (A) Diagrammatic representations of the γ11-5 and γ5-11-Ger chimeric subunits. γ11-5 is a γ11 chimera containing the last fourteen residues of γ5 substituted for the last fourteen residues of γ11. γ5-11-Ger is a γ5 chimera containing the ten residues of γ11 upstream of the CAAX box substituted for the ten residues upstream of the CAAX box of γ5. It contains the CAAX box of γ5 so it is geranylgeranylated. Time courses of the grey scale intensities from the plasma membrane and Golgi regions of M2-CHO cells expressing αo-CFP, β1 and YFP-γ11-5 (γ11-5) (B) or YFP-γ5-11-Ger (γ5-11-Ger) (C). Arrows indicate time points at which agonist and antagonist were added sequentially. Agonist: 100μM carbachol and antagonist: 100μM or 1mM atropine. Experiments were performed as above. Representative plots (n≥4).
3.5. Mutations at the C terminus of the γ5 subunit induce βγ5 translocation
To test a model which predicts that the affinity of the C terminal tail domain of the γ subunit for the receptor affected the translocation process, we created two mutant forms of the γ5 subunit: (i) γ5-Δ in which the C terminal ten residues upstream of the CAAX box were deleted and (ii) γ5-6G in which six Gly residues were inserted upstream of the CAAX box (Fig. 5A). If the translocation properties of βγ5 were due to the affinity of the γ5 C terminal domain for the receptor, altering the primary structure of this domain or deleting this domain will be expected to alter the affinity of βγ5 for the receptor and result in the βγ5 complex translocating from the plasma membrane on activation of the receptor. Each mutant of the γ5 subunit was fused so that YFP was at the N terminus and coexpressed with αo or αo-CFP and β1 in M2-CHO cells. The cells were imaged as above before agonist addition and then sequential addition of agonist and antagonist. Emission intensities were plotted and the quantitative parameters to measure the translocation efficiency were derived (Fig. 5B, C and Table 1). The images are shown in Fig. 2. The translocation properties of γ5-Δ were similar to γ11 rather than γ5 (Fig. 5B and Table 1). The γ5-6G mutant was made to increase the distance between the geranylgeranyl modification on the Cys residue and the amino acid sequence at the C terminus previously identified as a contact site for the receptor [9]. Previous evidence from experiments with various receptors indicates that both the prenyl moiety and the C terminal amino acid sequence of the γ subunit are a requirement for receptor interaction of the G protein [13,14,30]. One possible reason for this requirement is that the receptor has contact sites for both the prenyl moiety and the C terminal residues. A second possibility is that the amino acids do not directly contact the receptor but the tertiary structure of this sequence determines contact of the prenyl moiety with the receptor. If one of these mechanisms is at the basis of receptor interaction, we anticipated that γ subunit interaction with a receptor would be weakened by extending the distance between the prenyl moiety and the amino acid sequence with a conformationally flexible region. As anticipated, the βγ5-6G mutant complex translocated similar to γ11 rather than γ5 (Fig. 5C, Table 1 and Fig. 2).
Fig. 5.

Translocation of mutant γ5 subunits with altered C terminal tail domains. (A) Diagrammatic representation of the γ5-Δ and γ5-6G mutants. (B) Time course of the grey scale intensities from the plasma membrane and Golgi regions of M2-CHO cells expressing αo, β1 and YFP-γ5-Δ (γ5-Δ). (C) Time course of the grey scale intensities from the plasma membrane and Golgi regions of M2-CHO cells expressing αo-CFP, β1 and YFP-γ5-6G (γ5-6G). Arrows indicate time points at which agonist and antagonist were added sequentially. Agonist: 100μM carbachol and antagonist: 100μM or 1mM atropine. Experiments were performed as above. Representative plots (n≥4).
In the C terminal domain upstream of the CAAX box of γ1, mutation of four residues 64–67 (FKEL) to A prevents the βγ1 complex from supporting Gt interaction with rhodopsin [14]. More recent evidence is consistent with a role for the γ1 F64 residue among these residues in receptor interaction. The three dimensional structure of a 12 residue peptide that encompasses this C terminal domain of γ1 has been determined using 2DnMR in the presence of inactive and light activated rhodopsin [15]. When the helical structure that the peptide takes up in the presence of activated rhodopsin is fused to the crystal structure of Gt, the F64 residue in this structure faces outward towards the potential rhodopsin binding site [15]. In contrast, in the crystal structure of the β1γ1 complex, the F64 residue faces the βγ subunit interacting with several β subunit residues [31] (Fig. 6A). This result suggests that the γ subunit C terminal domain undergoes a conformational change that allows the F64 residue to face the receptor during G protein interaction with the receptor [9,15]. The residue corresponding to F64 in γ5 is F59. This Phe residue is conserved in most γ subunit types. Since the mutational analysis of γ1 and the NMR structure of the γ1 peptide imply that F59 plays an important role in receptor interaction of the G protein, we mutated it to Ala (γ5-F59A) (Fig. 6B). Translocation of βγ5-F59A was examined as above. Fig. 6C and Table 1 show that the translocation of βγ-F59A is more similar to γ11 rather than γ5. This result supports a mechanism wherein the γ subunit tail interacts with a receptor after activation and retains the βγ complex. Mutational alteration of the critical F59 residue involved in receptor interaction likely leads to lowered affinity for the receptor and resultant translocation of the βγ complex away from the plasma membrane. These results provide support for a model in which the affinity of the G protein γ subunit C terminal domain for receptors determines whether the βγ complex is retained on the receptor or translocates. The γ5 C terminal domain likely has sufficient affinity for the agonist activated receptor to remain mostly bound to the receptor. The γ11 C terminal domain amino acid sequence is distinctly different from γ5 (Fig. 1A). Although the γ11 domain contains the conserved Phe residue in γ5, there are several changes in the sequence in comparison to γ5. The translocation behavior of the γ5-11-Ger chimera confirms the importance of these amino acid changes for receptor interaction (Fig. 4C). Thus it is likely that the C terminal domain of γ11 does not have sufficient affinity for the activated receptor for the βγ11 complex to be retained on the plasma membrane.
Fig. 6.

Translocation of the γ5-F59A mutant. (A) The crystal structure of the G protein β1γ1 complex [31] shows that the γ1 F64 residue which is homologous to F59 of γ5 is buried in a cavity in the β subunit. (B) A single point mutation in γ5 substitutes F59 with A. (C) Time course of the grey scale intensities from the plasma membrane and Golgi regions of M2-CHO cells expressing αo-CFP, β1 and YFP-γ5-F59A (γ5-F59A). Arrows indicate time points at which agonist and antagonist were added sequentially. Agonist: 100μM carbachol and antagonist: 100μM or 1mM atropine. Experiments were performed as above. Representative plots (n≥4).
3.6. Mutations in the C terminal domain of the γ5 subunit affect receptor stimulated G protein activation in a reconstituted system
To obtain evidence for the γ subunit C terminal domain playing a role in receptor activation of a G protein, we expressed the wild type and the three mutant γ subunits, γ5-Δ, γ5-6G and γ5-F59A as βγ complexes in insect cells. The mutants in these experiments were not fused to YFP. The βγ complexes were purified. γ subunit post-translational modification was confirmed by isolating the γ subunit using HPLC and then determining the mass of the subunit using mass spectrometry [27]. A chromatographic trace of the γ5 wild type and γ5-F59A mutant are shown to demonstrate purity (Fig. 7A). The γ5-F59A mutant is retained for a shorter period of time on the hydrophobic column because of the loss of a hydrophobic residue. The masses showed that the mutants were appropriately modified with the geranylgeranyl moiety consistent with previous evidence that the CAAX box amino acid sequence is the only determinant of the type of prenylation. Proteolytic cleavage of the last three residues was inefficient with the γ5-6G and γ5-Δ mutants resulting in a fraction that was geranylgeranylated but not proteolyzed [27]. Previous evidence indicates that the retention of the last three residues does not significantly alter the properties of the γ subunit [32]. In contrast, mass spectrometry showed that the entire fraction of γ5-F59A mutant was geranylgeranylated, proteolyzed and carboxy-methylated similar to the wild type (Fig 7A and Ref. [27]). Heterotrimers were formed with the αγ subunit and the wild type and mutant βγ complexes. M2 receptors purified and reconstituted in lipids were used to activate the recombinant G proteins in a GTPase assay that also contained purified RGS4. Go containing γ5-F59A showed significantly lower receptor stimulated GTPase activity compared to the wild type (Fig. 7B). Go containing γ5-F59A and γ5-Δ possessed almost no receptor stimulated GTPase activity (Fig. 7B). Strikingly, the alteration of a single residue F59 to A prevented the Go from being activated by the receptor. The properties of the three mutants are consistent with predictions from the live cell imaging experiments above performed with the same mutants. If the mutant γ subunits possess significantly lower affinity for the activated receptor in comparison to the wild type, the βγ complex will not be retained on the receptor and will diffuse away from the membrane. The results from the live cell imaging experiments of the various γ5 chimera and mutants show that despite the presence of the hydrophobic moiety these proteins translocate rapidly to the Golgi complex. The prenyl moiety is thus unable to retain the βγ complex on the plasma membrane after receptor activation in the live cells and is unlikely to do so in the in vitro assay. This will prevent further cycles of heterotrimerization and receptor activation.
Fig. 7.
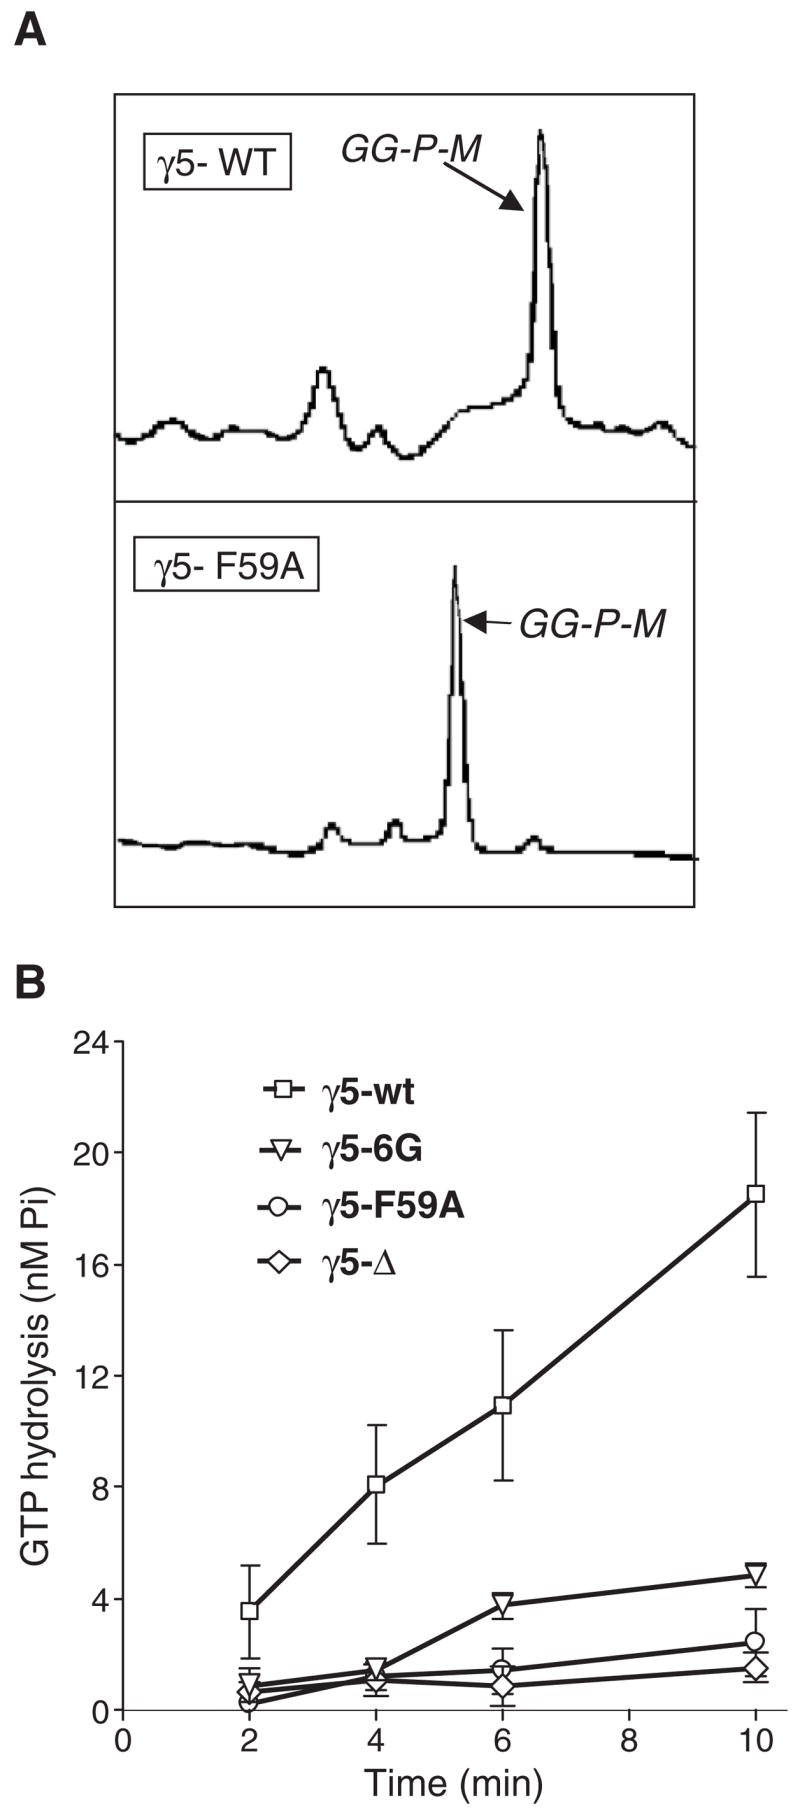
Receptor stimulated GTPase activity of Go containing various γ5 mutants. (A) Chromatographic traces of γ5 wild type and γ5-F59A mutant from a HPLC column showing that both proteins are highly purified. The peaks labeled GG-P-M were geranylgeranylated, proteolyzed and methylated as determined by mass spectrometry. (B) M2 stimulated GTPase activity in a reconstituted system containing the purified receptor, G protein subunits and RGS protein. Bars represent SEM (n=3–4). Details of the methods are in the text.
The receptor is unable to activate G proteins containing the mutant γ5 subunits in a reconstituted system made up of purified known components. This result shows that the translocation of the same γ5 mutants seen in the live cell imaging assays is not due to unidentified components present in the cell but results from the nature of receptor interaction with the γ subunit C terminal tail region.
3.7. The γ subunit C terminus is likely required for retention of the βγ complex on the receptor and not for initial receptor contact
When M2-CHO cells expressing αo-CFP, β1 and YFP-γ5-Δ were exposed to an agonist, the αo-CFP subunit on excitation showed an increase in the CFP emission (CC) and subsequent to antagonist addition the CFP emission decreased (data not shown). This change in CFP emission resulted from the decrease in FRET from αo-CFP to YFP-γ5-Δ consequent to subunit dissociation and was a direct indicator that the αoβγ5-Δ heterotrimer was activated by the receptor [21]. The ability of the receptor to activate the G protein containing the γ5-Δ mutant suggests that the C terminal amino acid sequence of the γ subunit is not required for initial binding of the G protein to the receptor and also its activation. However, this domain is likely required for the βγ complex to be retained on the receptor of the G protein because its deletion results in the translocation of the βγ complex (Fig. 5A and B). This inference is consistent with the translocation properties of the γ5-6G and γ5-F59A mutants in live cells (Fig. 5B and C). Both mutants translocate rapidly on receptor activation similar to γ11 suggesting that the wild type γ5 tail sequence is critical for retention on the activated receptor. Both mutants also translocate back to the plasma membrane rapidly on antagonist addition demonstrating that the receptor is continually activating a proportion of the G proteins despite the mutant γ subunit tail.
The model proposed here predicts that the translocation is due to the relative affinity of the C terminal domain of the γ subunit for an activated receptor. This model is consistent with several previous findings. Mutations in the homologous γ1 subunit C terminal domain prevented Gt, the G protein in rod photoreceptors, from binding to activated rhodopsin [14]. A peptide specific to the C terminal domain of γ1 stabilized the activated form of rhodopsin but when the amino acids in the peptide were scrambled it was inactive [33]. Evidence from other experiments also supports a role for this C terminal γ subunit domain with a receptor [7,34]. A peptide specific to the C terminal tail domain of the γ5 subunit blocked the M2 muscarinic receptor activation of Go but not the same peptide with its sequence scrambled [13]. When the γ5 specific C terminal peptide was introduced into whole cells, it blocked the M2 muscarinic receptor mediated action on an ion conducting channel [13]. One potential explanation for these results is that residues in the γ subunit C terminal domain interact with the activated form of the receptor and not the inactive receptor. Two dimensional NMR studies of the C terminal γ1 specific peptide in the presence of inactive and activated rhodopsin are consistent with this inference. The γ1 peptide is disordered in the presence of inactive rhodopsin and takes up a constrained conformation in the presence of activated rhodopsin [9,15]. However, the possibility that the C terminal residues of the γ subunit are necessary only for maintaining the appropriate tertiary structure so that the prenyl moiety can be oriented appropriately for contact with the receptor cannot be eliminated based on the results here.
Although modified with a hydrophobic prenyl moiety the βγ complex is capable of localizing to the plasma membrane only when bound to the palmitoylated α subunit [35]. This evidence is consistent with the finding here that the prenylated βγ complex translocates away from the plasma membrane on activation and dissociation from the α subunit.
An alternative model is that during receptor interaction the γ5 subunit prenyl moiety is available for βγ5 binding to the activated receptor but the γ11 subunit prenyl moiety is buried in the β subunit. There is evidence suggesting that the prenyl moiety is buried in a pocket in the β subunit when the βγ complex is bound to phosducin and the effectors — phospholipase Cβ and adenylyl cyclase [36–38]. Translocation of βγ11 will occur because the prenyl moiety necessary for retaining the βγ complex on the receptor will be inaccessible. In this model, the amino acid sequence in the C terminal domain of the γ subunit can hypothetically determine whether the prenyl moiety will be buried inside the β subunit or exposed. However, the support for this model is less compelling. If the C terminal domain of the γ subunit type determined the orientation of the prenyl moiety, γ11-Ger would be expected to have translocation properties identical to the wild type γ11 unlike the results in Fig. 3. Similarly, the γ5-F59A mutant would be expected to retain the translocation properties of the wild type γ5. It appears unlikely that mutating the F59 residue which is conserved in γ11 to A will lead to the prenyl moiety being buried in the β subunit.
Overall, the results here suggest that receptor induced translocation of the G protein βγ complex occurs as a result of the differential affinity of the G protein γ subunit C terminal tail domain for receptors. Imaging signaling activity in living mammalian cells is a powerful approach to understand the spatio temporal dynamics of signaling activity [39,40]. Results here show that this approach can also be useful to identify the molecular mechanisms at the basis of signaling. One advantage of this approach is that it can be more confidently inferred that the results are directly relevant to intact cells.
Acknowledgments
We thank Dr. I. Azpiazu for valuable discussions. Supported by National Institutes of Health grant GM69027. Supported in part by American Heart Association Post Doctoral Fellowship 0225378Z and by a fellowship from TUBITAK— the Scientific and Technological Research Council of Turkey.
References
- 1.Hou Y, Chang V, Capper AB, Taussig R, Gautam N. J Biol Chem. 2001;276(23):19982. doi: 10.1074/jbc.M010424200. [DOI] [PubMed] [Google Scholar]
- 2.Gibson SK, Gilman AG. Proc Natl Acad Sci U S A. 2005;103(1):212. doi: 10.1073/pnas.0509763102. [DOI] [PMC free article] [PubMed] [Google Scholar]
- 3.McIntire WE, MacCleery G, Garrison JC. J Biol Chem. 2001;276(19):15801. doi: 10.1074/jbc.M011233200. [DOI] [PubMed] [Google Scholar]
- 4.Lim WK, Myung CS, Garrison JC, Neubig RR. Biochemistry. 2001;40(35):10532. doi: 10.1021/bi010950c. [DOI] [PubMed] [Google Scholar]
- 5.Richardson M, Robishaw JD. J Biol Chem. 1999;274(19):13525. doi: 10.1074/jbc.274.19.13525. [DOI] [PubMed] [Google Scholar]
- 6.Hamm HE. J Biol Chem. 1998;273(2):669. doi: 10.1074/jbc.273.2.669. [DOI] [PubMed] [Google Scholar]
- 7.Herrmann R, Heck M, Henklein P, Kleuss C, Hofmann KP, Ernst OP. J Biol Chem. 2004;279(23):24283. doi: 10.1074/jbc.M311166200. [DOI] [PubMed] [Google Scholar]
- 8.Kisselev O, Gautam N. J Biol Chem. 1993;268(33):24519. [PubMed] [Google Scholar]
- 9.Gautam N. Structure (Camb) 2003;11(4):359. doi: 10.1016/s0969-2126(03)00054-6. [DOI] [PubMed] [Google Scholar]
- 10.Gilman AG. Annu Rev Biochem. 1987;56:615. doi: 10.1146/annurev.bi.56.070187.003151. [DOI] [PubMed] [Google Scholar]
- 11.Gudermann T, Schoneberg T, Schultz G. Annu Rev Neurosci. 1997;20:399. doi: 10.1146/annurev.neuro.20.1.399. [DOI] [PubMed] [Google Scholar]
- 12.Akgoz M, Kalyanaraman V, Gautam N. J Biol Chem. 2004;279(49):51541. doi: 10.1074/jbc.M410639200. [DOI] [PubMed] [Google Scholar]
- 13.Azpiazu I, Cruzblanca H, Li P, Linder M, Zhuo M, Gautam N. J Biol Chem. 1999;274(50):35305. doi: 10.1074/jbc.274.50.35305. [DOI] [PubMed] [Google Scholar]
- 14.Kisselev O, Pronin A, Ermolaeva M, Gautam N. Proc Natl Acad Sci U S A. 1995;92(20):9102. doi: 10.1073/pnas.92.20.9102. [DOI] [PMC free article] [PubMed] [Google Scholar]
- 15.Kisselev OG, Downs MA. Structure (Camb) 2003;11(4):367. doi: 10.1016/s0969-2126(03)00045-5. [DOI] [PubMed] [Google Scholar]
- 16.Ernst OP, Meyer CK, Marin EP, Henklein P, Fu WY, Sakmar TP, Hofmann KP. J Biol Chem. 2000;275(3):1937. doi: 10.1074/jbc.275.3.1937. [DOI] [PubMed] [Google Scholar]
- 17.Morishita R, Ueda H, Kato K, Asano T. FEBS Lett. 1998;428(1–2):85. doi: 10.1016/s0014-5793(98)00498-0. [DOI] [PubMed] [Google Scholar]
- 18.Yamane HK, Farnsworth CC, Xie HY, Howald W, Fung BK, Clarke S, Gelb MH, Glomset JA. Proc Natl Acad Sci U S A. 1990;87(15):5868. doi: 10.1073/pnas.87.15.5868. [DOI] [PMC free article] [PubMed] [Google Scholar]
- 19.Peralta EG, Winslow JW, Peterson GL, Smith DH, Ashkenazi A, Ramachandran J, Schimerlik MI, Capon DJ. Science. 1987;236(4801):600. doi: 10.1126/science.3107123. [DOI] [PubMed] [Google Scholar]
- 20.Zacharias DA, Violin JD, Newton AC, Tsien RY. Science. 2002;296(5569):913. doi: 10.1126/science.1068539. [DOI] [PubMed] [Google Scholar]
- 21.Azpiazu I, Gautam N. J Biol Chem. 2004;279(26):27709. doi: 10.1074/jbc.M403712200. [DOI] [PubMed] [Google Scholar]
- 22.Azpiazu I, Gautam N. Methods Enzymol. 2002;344:112. doi: 10.1016/s0076-6879(02)44709-x. [DOI] [PubMed] [Google Scholar]
- 23.Fogg VC, Azpiazu I, Linder ME, Smrcka A, Scarlata S, Gautam N. J Biol Chem. 2001;276(45):41797. doi: 10.1074/jbc.M107661200. [DOI] [PubMed] [Google Scholar]
- 24.Kozasa T, Gilman AG. J Biol Chem. 1995;270(4):1734. doi: 10.1074/jbc.270.4.1734. [DOI] [PubMed] [Google Scholar]
- 25.Romoser V, Ball R, A VS. J Biol Chem. 1996;271(41):25071. doi: 10.1074/jbc.271.41.25071. [DOI] [PubMed] [Google Scholar]
- 26.Linder ME, Kleuss C, Mumby SM. Methods Enzymol. 1995;250:314. doi: 10.1016/0076-6879(95)50081-2. [DOI] [PubMed] [Google Scholar]
- 27.Akgoz M, Azpiazu I, Kalyanaraman V, Gautam N. J Biol Chem. 2002;277(22):19573. doi: 10.1074/jbc.M201546200. [DOI] [PubMed] [Google Scholar]
- 28.Casey PJ, Pang IH, Gilman AG. Methods Enzymol. 1991;195:315. doi: 10.1016/0076-6879(91)95176-k. [DOI] [PubMed] [Google Scholar]
- 29.Myung CS, Yasuda H, Liu WW, Harden TK, Garrison JC. J Biol Chem. 1999;274(23):16595. doi: 10.1074/jbc.274.23.16595. [DOI] [PubMed] [Google Scholar]
- 30.Yasuda H, Lindorfer MA, Woodfork KA, Fletcher JE, Garrison JC. J Biol Chem. 1996;271(31):18588. doi: 10.1074/jbc.271.31.18588. [DOI] [PubMed] [Google Scholar]
- 31.Sondek J, Bohm A, Lambright DG, Hamm HE, Sigler PB. Nature. 1996;379(6563):369. doi: 10.1038/379369a0. [DOI] [PubMed] [Google Scholar]
- 32.Dietrich A, Brazil D, Jensen ON, Meister M, Schrader M, Moomaw JF, Mann M, Illenberger D, Gierschik P. Biochemistry. 1996;35(48):15174. doi: 10.1021/bi960305j. [DOI] [PubMed] [Google Scholar]
- 33.Kisselev OG, Ermolaeva MV, Gautam N. J Biol Chem. 1994;269(34):21399. [PubMed] [Google Scholar]
- 34.Kisselev OG, Meyer CK, Heck M, Ernst OP, Hofmann KP. Proc Natl Acad Sci U S A. 1999;96(9):4898. doi: 10.1073/pnas.96.9.4898. [DOI] [PMC free article] [PubMed] [Google Scholar]
- 35.Takida S, Wedegaertner PB. J Biol Chem. 2003;278(19):17284. doi: 10.1074/jbc.M213239200. [DOI] [PubMed] [Google Scholar]
- 36.Lukov GL, Myung CS, McIntire WE, Shao J, Zimmerman SS, Garrison JC, Willardson BM. Biochemistry. 2004;43(19):5651. doi: 10.1021/bi035903u. [DOI] [PubMed] [Google Scholar]
- 37.Myung CS, Garrison JC. Proc Natl Acad Sci U S A. 2000;97(16):9311. doi: 10.1073/pnas.97.16.9311. [DOI] [PMC free article] [PubMed] [Google Scholar]
- 38.Loew A, Ho YK, Blundell T, Bax B. Structure. 1998;6(8):1007. doi: 10.1016/s0969-2126(98)00102-6. [DOI] [PubMed] [Google Scholar]
- 39.Zhang J, Campbell RE, Ting AY, Tsien RY. Nat Rev Mol Cell Biol. 2002;3(12):906. doi: 10.1038/nrm976. [DOI] [PubMed] [Google Scholar]
- 40.Miyawaki A. Dev Cell. 2003;4(3):295. doi: 10.1016/s1534-5807(03)00060-1. [DOI] [PubMed] [Google Scholar]
- 41.Zhang FL, Casey PJ. Annu Rev Biochem. 1996;65:241. doi: 10.1146/annurev.bi.65.070196.001325. [DOI] [PubMed] [Google Scholar]