

Abstract
Diffusion MRI of hyperpolarized 3He shows that the apparent diffusion coefficient (ADC) of 3He gas is highly restricted in the normal lung and becomes nearly unrestricted in severe emphysema. The nature of this restricted diffusion provides information about lung structure; however, no direct comparison with histology in human lungs has been reported. The purpose of this study is to provide information about 3He gas diffusivity in explanted human lungs, and describe the relationship between3He diffusivity and the surface area to lung volume ratio (SA/V) and mean linear intercept (Lm) measurements—the gold standard for diagnosis of emphysema. Explanted lungs from patients who were undergoing lung transplantation for advanced COPD, and donor lungs that were not used for transplantation were imaged via 3He diffusion MRI. Histological measurements were made on the same specimens after they were frozen in the position of study. There is an inverse correlation between diffusivity and SA/V (and a positive correlation between diffusivity and Lm). An important result is that restricted 3He diffusivity separated normal from emphysematous lung tissue more clearly than the morphometric analyses. This effect may be due to the smaller histologic sampling size compared to the MRI voxel sizes.
Keywords: lung, helium, diffusion, histology, mean linear intercept
Chronic obstructive pulmonary disease (COPD) is predicted to move from 12th to fifth place in the conditions that contribute to the global burden of disease by the year 2020 (1). Its defining feature is irreversible airflow limitation (2,3), which is estimated by the volume of air that can be forcibly expired from the lung in 1 s (FEV1), and the ratio of this value to the forced vital capacity (FVC), the maximum volume that can forcibly expired with no time limit. These measurements reflect the increased time required to empty the lung due either to an increase in the resistance of the small conducting airways (4-6) and/or an increase in lung compliance and early airway closure due to emphysematous destruction of the lung’s elastic recoil (7).
Emphysema can be diagnosed using computed tomography (CT) scanning, and several studies have shown an association between CT measurements (8) and histology (9,10). However, the precise separation of fully expanded normal lung from mild emphysema using CT remains a subject of debate (25). In addition, the radiation dose required for the repeat measurements needed to monitor disease progression in clinical trials is excessive. In order to monitor regional emphysematous progression for longitudinal studies, and develop future pharmaceutical agents to slow or stop progression, a non-ionizing imaging standard of the severity of emphysema must be established. Since magnetic resonance imaging (MRI) of the restricted diffusion of hyperpolarized gases shows much promise for becoming such a standard, and since whole-lung sets of images can be acquired during a single 10-s breath-hold in vivo, we focused on this technique in the present study.
For 3He at or near the dilute limit in air or N2, the free (unrestricted) diffusivity is 0.88 cm2/s. At a typical value of diffusion time Δ of 2 ms, the root mean square (RMS) free displacement is 0.59 mm. A typical mean alveolar “diameter” is near 0.3 mm, and the average major and minor diameters of acinar ducts are around 0.7 mm and 0.3 mm, respectively (30). Normal acinar spaces restrict the apparent diffusion coefficient (D, or ADC) from its unrestricted value of 0.88 cm2/s to 0.2 cm2/s, so the diffusion is substantially restricted. Expansion of the alveoli and tissue destruction associated with emphysema result in fewer gas-atom collisions with alveolar walls during typical experimental diffusion times (around 2 ms). Thus, the expanded alveolar spaces increase the ADC by up to four times (21).
Emphysema is defined by a larger than normal expansion of lung tissue with associated alveolar destruction (13). Duguid et al. (14) were among the first to try to estimate the severity of this destruction by measuring the average distance between alveolar walls and calculating the total alveolar surface area of the lung. Thurlbeck (15,16) subsequently made an extensive study of the alveolar surface area of postmortem lungs and concluded that there was too much variance in the measurement of total alveolar surface area for it to be useful in comparing the amount of emphysema present in different subjects. Normalizing the surface area to lung volume ratio (SA/V) appears to be better suited for quantifying the severity of emphysema (17). Recent studies of an animal model (18) and human disease (17) showed that the SA/V decreases in mild forms of emphysema, whereas the total surface area itself only becomes measurably decreased when emphysema becomes more severe. Because 3He MRI is sensitive to changes in geometry within the acinus, it may offer a very sensitive means of separating normal from emphysematous lung in patients with COPD in vivo. The present study was designed to correlate the restricted 3He diffusivity with histologic measurements of SA/V and the mean linear intercept (Lm, the average distance between alveolar walls). Since histological sampling is only feasible with the ex vivo lung, we used lungs that had been removed from patients at lung transplantation and histologically-normal donor lungs that were not used for transplantation.
Most of the previously reported measurements of 3He diffusivity were obtained in vivo in humans and large animals (12,19-22). In this study we took advantage of the opportunity to study explanted human lungs from patients with advanced COPD to allow a direct comparison with histology of human disease. In addition, studying the ex vivo lung offered a few technical advantages. First, the absence of the chest wall removed most of the radiofrequency (RF) loss associated with saline and tissue, and permitted the use of a sensitive, high-performance coil for a high signal-to-noise ratio (SNR). Second, oxygen, which depolarizes 3He nuclear spins, was replaced with nitrogen in the explanted lung and the lung was maintained at a near-constant volume, which allowed multiple imaging experiments to be performed for hundreds of seconds. Crucially, the ability to inflate the entire lung and rapidly freeze it in the position of study allowed us to make a direct regional comparison of the diffusion measurements with histology. Although in this study we used the ex vivo lung for the above practical reasons, in vivo 3He diffusion MRI has been employed for several years in healthy subjects and patients with severe disease (11-12,19-21).
MATERIALS AND METHODS
We studied the left lungs from six patients who had undergone bilateral lung transplantation for advanced COPD. None of the patients had α1 antitrypsin deficiency. Three donor lungs from two donors served as controls. These donor lungs were rejected for transplantation for technical reasons related to the time between death and transplantation. To our knowledge, none of the donors had a history of smoking. The freshly explanted lungs were stored at 40° F under saline for 1-5 days while the gas was prepared and imaging facilities became available. Before imaging, a sleeve of Gore-Tex® was sutured to the bronchial stump, and the lungs were carefully sealed for leaks and ventilated with pure nitrogen gas to thoroughly deplete residual oxygen. The lungs were then stored in a leak-free plastic bag containing 100% N2, transported to the MR imager, and only removed from the bag when they were to be placed inside the imaging coils. The lungs were inflated with nitrogen to a volume just less than functional residual capacity (i.e., approximately 50% of maximum volume) and held in that position. To homogenize the gas, the lungs were inflated and deflated six to eight times from near-functional residual capacity using a 1-L gas syringe containing approximately 300 mL of hyperpolarized 3He of nominal polarization 40%, prepared with two locally constructed (J.C.W. and M.S.C.) and one commercial (General Electric/Amersham Health) polarizers. 3He diffusivity was thus measured at an inspiratory volume approximating functional residual lung capacity (FRC) plus a tidal volume. In two of the control lungs diffusivity was also measured again at a volume closer to total lung capacity (TLC). The transpulmonary pressure was monitored via a Bourdon-tube pressure gauge and limited to be always less than 15 cm H2O. Imaging began at the end of the final tidal inspiration on a Siemens Magnetom Vision whole-body scanner at 48.47 MHz (the 3He frequency in the 1.5-T field). An in-house-built, solenoid-like coil of four turns in parallel (Q = 200) took advantage of the low RF loss due to the absence of the chest wall. The resulting high receiving sensitivity allowed the use of small flip angles (≈1-5°) for multiple measurements on each lung.
A complete set of diffusion-weighted images was generated by taking the ratio of two images of each slice (one without and one with a diffusion sensitizing gradient (b = 1.38 s/cm2, diffusion time Δ = 1.8 ms). The value of b = 1.38 s/cm2 was chosen as a compromise to yield a measurable signal loss in the healthy, slowly-diffusing regions and a measurable (not completely attenuated) signal strength in the most emphysematous, rapidly diffusing zones. This value is similar to what we and others have used previously. The approximately sagittal contiguous slices (N = 10-15) were each 10 mm thick, with an inplane resolution of 5 mm × 5 mm.
After imaging was completed, the lungs were kept inflated at a transpulmonary pressure of 10 cm H2O from an external pressure source attached to an underwater seal while they were rapidly frozen by suspension in cold nitrogen vapor (77-90 K) for 15 min in a closed Styrofoam box. The cold vapor was maintained by partially filling the box with liquid nitrogen. The lungs were then removed and kept frozen in a second Styrofoam box lined with solid carbon dioxide. They were transported to a band saw equipped with a meat-cutting blade. The frozen lung was briefly removed from the box and cut into 2-cm-thick transverse slices that were immediately replaced into the box. Each slice was kept on a large slab of CO2 and photographed after the lung slice had been sampled with a cork borer with an internal diameter of 1.3 cm (Fig. 1). These cork-bore samples (14-19 per lung) were placed in vials containing alcohol-based fixative that had been pre-cooled to solid CO2 temperature (-78.5°C). The samples were kept at -80°C for several days, during which time they took up enough fixative by capillary action to sink below the surface of the fixative. The fixed samples were shipped to the iCAPTURE Center at St. Paul’s Hospital in Vancouver, Canada, where they were processed in paraffin. Sections (4-6 μm thick) were cut from the paraffin blocks and stained with hematoxylin and eosin.
FIG. 1.
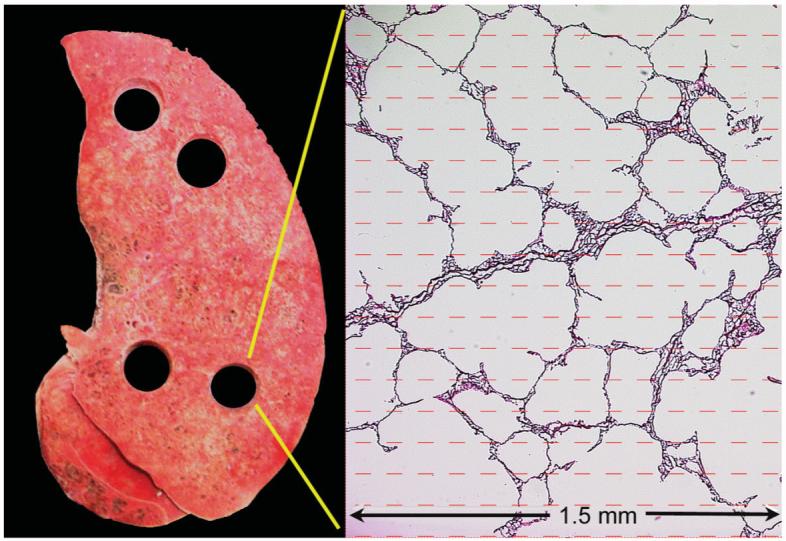
Photo of a typical transverse slice of one of the control lungs, showing four holes where samples were taken for processing, and measurements of the SA/V and Lm intercept. A photomicrograph is shown at right, overlaid by the sampling grid. [Color figure can be viewed in the online issue, which is available at www.interscience.wiley.com.]
The stained histological sections were coded and examined with a Nikon light microscope (Nikon Microphot, Tokyo, Japan) equipped with a JVC3-CCD KY F-70 digital camera (Diagnostic Instruments, Inc., USA) linked to a computer. At least five fields per section were randomly selected from areas that did not contain large airways or blood vessels using a 10× objective magnification, and the images were captured and stored in the computer. These images were analyzed using Image Pro Plus digital image analysis software (Media Cybernetics, MD, USA) with a program that allowed a matrix of test lines with end points to be projected onto the histology images.
Point and intercept counts were collected using the “multipurpose test system” proposed by Weibel (23). An excellent correlation was seen between the computer-assisted method described above and the standard method of manual counting for calculating Lm (R2 = 0.96) (24). Briefly, the output of our program provides estimates of the average distance between alveolar walls and the 2D representation of the SA/V (sometimes called the surface density) by projecting an arbitrarily-oriented matrix of user-defined line segments onto the images and measuring the number of intersections with lung tissue and the number of segment endpoints that lie inside lung tissue. Lm is calculated as the ratio of the effective total length of the line segments to the number of tissue intersections, corrected for tissue shrinkage during fixation. It is known that SA/V = 4/Lm for isotropic tissue (29). However, we used the above-described point-counting method to ensure unbiased data sampling, because our tissue-sampling method is usually oriented superior-inferior in the lung and can give rise to slight anisotropy of lung tissue (28). Figure 2 shows three photomicrographs that demonstrate various degrees of emphysema, and values for Lm and SA/V measured via the method above are noted.
FIG. 2.

Sample histological slides for various degrees of emphysema. a: For the sample from a nominally healthy lung, Lm = 0.027 cm, SA/V = 204 cm-1, and ADC = 0.23 cm2/s. b: For the moderately diseased lung sample, Lm = 0.041 cm, SA/V = 134 cm-1, and ADC = 0.42 cm2/s. c: For the severely diseased sample, Lm = 0.062 cm, SA/V = 89.5 cm-1, and ADC = 0.63 cm2/s.
The MR images of lung slices were approximately sagittal, whereas the frozen lung slices, cork-bore samples, tissue sections, and histological images were all obtained in the transverse plane. The direct comparison of each sample examined under the microscope with ADC data required care in spatial matching. Each sample’s location was carefully noted in relation to anatomic landmarks and matched to the corresponding image-region in 3He diffusion images before the histology results were viewed. The approximate error in sample matching to image-regions was ±1 cm, but disease severity did not vary much over this error distance in most cases. Diffusivity in the image-regions was then compared with both SA/V and Lm. Even though the transplant patients all had end-stage COPD, the amount of emphysema varied somewhat, so average values of the measurements across each lung were also compared. These values covered a range of disease severity.
RESULTS
The SNR of 3He MRI ranged from 10 to 200, but was most often around 50. The longitudinal relaxation time constant T1 in two lungs was measured to be 7-9 min, indicating that virtually all O2 had been successfully removed. All parts of the lung were reasonably ventilated at the end of the six to eight 300-mL tidal volumes of rebreathed 3He in N2, though some lobar differences persisted in the spin signal intensity. (Intensity variations do not affect the diffusivity measurements, which are taken from the ratio of intensities of the images with and without diffusion-sensitizing gradients.) The gas distribution obtained in these diseased lungs was more homogeneous than that achieved by a single breath maneuver in patients with COPD (19,21-22). A near-complete set of diffusion images was obtained in each lung. Figure 3 presents some typical images from control and emphysematous lungs. We note that the over-all shape of the explanted lungs is less featured than some in vivo images because of the absence of the chest cavity.
FIG. 3.

Diffusivity maps for two control lungs and four lungs with severe COPD. The differences between the two groups are apparent from the images and color scale. Orientation differs slightly from image to image, but the apex is to the left and the diaphragmatic surface is to the right in these approximately sagittal slices. While all of the emphysematous lungs studied had large areas of severe disease, there was a significant range of tissue destruction at different locations within each of the several diseased lungs.
The average 3He MR diffusivity values of the three control lungs studied (0.22 cm2/s) were consistent with previous studies of healthy lungs in vivo (12,19-22,26). The average SA/V (200 cm-1) and Lm (0.020 cm, or 200 μ) values from histology in these lungs were also consistent with previous reports (9,10). (For comparison, spheres of radius 0.15 mm (150 μ) have an SA/V of 3/R, or 200 cm-1.) Emphysematous lungs varied widely from case to case, with averages of 136 cm-1, 0.041 cm, and 0.56 cm2/s for SA/V, Lm, and 3He diffusivity, respectively. Table 1 presents the data obtained for each lung and compares the averages of the three control and six emphysematous lungs (27). These data show that on average SA/V decreased by -32% and Lm increased by +105% in emphysema; however, the change in ADC was larger, at +155% for full-lung averages and +170% when averaged over image samples that best corresponded to histological sections.
Table 1.
Averages of Histological Measurements and 3He Diffusivity (ADC) Measured at Approximately FRC + Tidal Volume in Three Control and Six Explanted Lungs with End-Stage COPD*
| Case # | SA/V (cm-1) | Lm (cm) | 〈ADC〉 (samples) (cm2/s) | 〈ADC〉 (entire lung) (cm2/s) | σ (ADC) (cm2/s) | FEV1/FVC (%/% predicted) | RV/TLC (L/L) | DLCO (% predicted) |
|---|---|---|---|---|---|---|---|---|
| Control 1 | 202 | 0.022 | 0.24 | 0.23 | 0.07 | — | — | — |
| Control 2 (L) | 198 | 0.018 | 0.24 | 0.23 (0.25-TLC) | 0.05 | — | — | — |
| Control 3 (R) | 199 | 0.019 | 0.22 | 0.20 (0.22-TLC) | 0.06 | — | — | — |
| COPD1 | 153 | 0.041 | 0.52 | 0.48 | 0.14 | 14/33 | 3.9/5.0 | — |
| COPD2 | 138 | 0.038 | 0.63 | 0.75 | 0.12 | 24/68 | 8.4/11.5 | 35 |
| COPD3 | 134 | 0.042 | 0.66 | 0.61 | 0.16 | 16/40 | 5.6/6.8 | 23 |
| COPD4 | 144 | 0.037 | 0.63 | 0.56 | 0.19 | 11/46 | 6.1/7.7 | — |
| COPD5 | 101 | 0.050 | 0.69 | 0.59 | 0.14 | 22/54 | 5.0/6.6 | 16 |
| COPD6 | 144 | 0.036 | 0.57 | 0.36 | 0.15 | 10/43 | 9.1/10.4 | 23 |
| Average Control | 200 | 0.020 | 0.23 | 0.22 | 0.06 | |||
| Average COPD | 136 | 0.041 | 0.62 | 0.56 | 0.15 | 16/47 | 6.4/8 | 24 |
Functional data are also included from pre-surgical evaluation for comparison, where available (and represent values for both patients’ lungs; such data are not available on individual lungs). There is a reduction in the surface area-to-volume ratio (SA/V) with emphysema and concomitant increases in the mean linear intercept (Lm) and in 3He diffusivity. Two columns of mean diffusivity are given: Column 4 represents the average over samples that best correspond to the histological sections, and Column 5 represents the average over the entire lung. In two control lungs diffusivity was also measured at TLC, with the ADC increasing by about 10%. Errors (not shown) are estimated from repeated measurements to be 5% or less of the average value of the ADC. FVC = forced vital capacity; RV = reduced volume; DLCO = diffusing capacity of CO.
Figure 4 shows a graph demonstrating a strong linear correlation (R = 0.96) between the lung-average values of SA/V vs. ADC from all nine lungs. The graphs of SA/V vs. ADC and Lm vs. ADC for matched individual samples (Fig. 5) show clear trends where lower SA/V corresponds to higher diffusivity (R = 0.61) and higher Lm corresponds to higher diffusivity (R = 0.62). The correlations were highly statistically significant in both comparisons (P < 0.0001), as were similar comparisons within the emphysematous group (P < 0.001). Errors in the ADC are estimated at 5% or less, based on repeated measurements in the same lungs. The large amount of scatter in the data of the graphs of individual samples likely reflects the fact that histology was performed on only a small portion (6 μm) of a 2-cm-long, 1.3-cm-diameter core of tissue. In addition, errors may have occurred in spatial matching between the histological samples and the MR images. The diffusivity measurements are by their nature volume-averaged over a larger region of lung corresponding to four to eight entire voxels containing the tissue core. The frequency distributions of the SA/V measurements made on histology show a substantial overlap in SA/V and Lm between the samples from the three putatively normal lungs and six emphysematous lungs. In contrast, there was little overlap in the measurements of 3He diffusivity for samples from normal and emphysematous lungs (Fig. 6). Thus, the ADC measurements provide a clearer separation of healthy and emphysematous lung than the gold-standard method of histology for comparisons between single histological samples and corresponding image voxels.
FIG. 4.
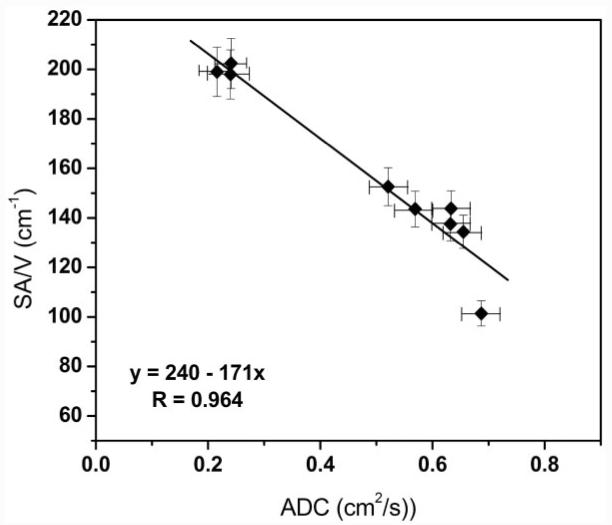
Comparison of average SA/V and ADC values (each point is an average over a single lung). Here the SA/V value is the average over all histological samples from the given lung, and the ADC value is the average over the data from the image voxels corresponding to the sampled regions. The correlation is strong (R = 0.96).
FIG. 5.

Graphs comparing both SA/V and Lm as functions of the diffusivity in all individual samples from control and emphysematous explanted lungs. Both histological measures show correlations with 3He diffusivity and ADC.
FIG. 6.

Histograms of SA/V (top) and 3He diffusivity (bottom) for the nine lungs studied. While there is significant overlap of the two groups for the histologic measure of emphysema (SA/V), restricted diffusion of 3He very clearly separates them. (The histograms of Lm and ADC are very similar.)
DISCUSSION
It is known that SA/V decreases (10) and D increases (12,19,21-22) with the severity of emphysema; however, the data presented here provide the first opportunity to directly compare 3He diffusion MRI with measurements of histology in the same lungs. Importantly, the MRI diffusivity measurements obtained from normal control lungs were more clearly separated from those acquired from lungs with emphysema than were the measurements of either Lm or SA/V obtained from the histology of the lung. Emphysematous lesions are scattered throughout the lung and vary from a few millimeters to several centimeters in diameter as the smaller lesions coalesce to form much larger holes. Our experience with the approximately 600 microscopic images captured during the course of these experiments is that both the images and 3He diffusivities presented in Fig. 2 are typical. To be precise, a significantly increased diffusivity (≥0.3 cm2/s) most often corresponds to small (1-3 mm) but visible emphysematous lesions in the images, and diffusivities greater than 0.55 cm2/s correspond to much greater destruction. Although in this study we used ex vivo lungs, the 3He diffusion MRI technique is easily applied in vivo to humans, even to patients with severe disease, since it only requires an approximately 10-s breath-hold for a full set of images (12,19,21-22).
The morphometric data are based on the histology observed on random 6-μm sections of 14-19 cores of tissue obtained at random from each lung. A standard test grid was then projected on the microscope image to obtain the point and intercept data required to calculate Lm and SA/V. Although these measurements separate the normal control lungs from the emphysematous lungs (P < 10-15), there is an overlap between the two groups of data because there is variance in the severity of lung destruction in the small number of 6-μm-thick histological sections cut from a single 2-cm-long tissue core. On the other hand, the MR images from which the 3He diffusivity was measured are volume-averaged over the entire region of lung sampled by the tissue core (4-8 voxels) and are therefore much more likely to be uniformly influenced by lesions present within it. While sample matching between histology and imaging was also a source of error, the severity of disease did not vary much over the estimated error of ±1 cm. We therefore attribute most of the scatter in the data comparing Lm and SA/V with diffusivity to the differences in how the techniques sample the structure of lung. We note that this scatter is reduced when the measurements are averaged over the entire lung, as shown in Fig. 4.
Histological measurements also quantify surface complexity in a way that is not reflected in the 3He diffusivity measurements, which are perhaps better measures of geometrical changes produced by tissue destruction. For example, one can envision an alveolar duct with a very complex, folded surface resulting in a high SA/V measured histologically. According to diffusivity measurements, this duct will be largely indistinguishable from a duct with similar geometrical parameters but with a smooth surface, yet the latter will have a greatly reduced SA/V. Some evidence of these differences can be seen via the 3He diffusivity measurements in two control lungs in this study at two different lung volumes (FRC and TLC). If the total surface area of the lung is fixed and simply “unfolds” as the lung is inflated, and if there is approximately twice the volume at TLC as at FRC, then SA/V at FRC will be roughly twice that measured at TLC. However, the diffusivity measurements only showed an average difference of roughly 10% from TLC to FRC plus a tidal volume. This likely reflects the minimal geometric change that occurs during volumetric expansion (S. Patz, personal communication).
Since emphysema changes the geometry of alveoli and alveolar ducts through tissue destruction, it is consistent that the 3He diffusivity can easily measure these changes. It is not our purpose here, however, to establish a relationship between 3He diffusivity and morphometry based on a firm theoretical model. Rather, we wanted to firmly validate the diffusivity as a measure of emphysema by comparison with the gold standard of computer-aided morphometry on histological specimens. Based on the average results presented in Fig. 4 and our error estimates, it is likely that the 3He ADC will be sensitive to changes in the SA/V in the range of 100-200 cm-1 in human emphysema, and may be sensitive to morphometric changes as small as 5%. Since the unrestricted (maximum) value of the ADC is around 0.88 cm2/s for 3He dilute in air, 3He is likely insensitive to SA/V lower than 100 cm-1, under the present measurement conditions and diffusion times. The approximately linear relationship between ADC and morphometry thus implies sensitivity to mild and moderate emphysematous tissue destruction, in some contrast to a recent report for long-distance restricted 3He diffusion, which appears to be more closely related to increases in collateral pathways (31).
CONCLUSIONS
The results reported here show that 3He diffusivity measurements can clearly and accurately separate normal from emphysematous human lung tissue. They also compare favorably to established histological measurements of emphysema by showing a negative linear correlation between 3He diffusivity and the SA/V, as well as a positive correlation between diffusivity and measurements of Lm, which reflects the average distance between alveolar walls. Both are highly statistically significant. The separation of healthy and emphysematous tissue was greater with 3He ADC than with the histological measurements. Since 3He diffusion MRI is particularly sensitive to the geometry of individual alveoli and alveolated units within the acinus, the ADC may be able to separate the small early lesions of emphysema from the larger ones that form when the smaller lesions coalesce, within the limitations of regional disease variations smaller than the voxel size. This noninvasive, nonionizing technique also has a distinct safety advantage over CT in longitudinal studies designed to measure the effect of therapeutic intervention on the natural history of emphysematous lung destruction.
ACKNOWLEDGMENTS
This study was supported in part by the Barnes-Jewish Foundation (grant 00355-0505 to J.C.W.), the National Institutes of Health (grants R01HL70037 to D.A.Y. and R01HL62194 to J.D.C.), and the Canadian Institutes of Health Research (CIHR) (grant 7246 to J.C.H.). We thank General Electric for the use of the 3He polarizer. In addition, we thank the transplant recipients and donors who made this research possible.
Grant sponsor: Barnes-Jewish Foundation; Grant number: 00355-0505; Grant sponsor: National Institutes of Health; Grant numbers: R01HL70037; R01HL62194; Grant sponsor: CIHR; Grant number: 7246; Grant sponsors: Jacqueline Maritz Lung Center; Washington University; Mallinckrodt Institute of Radiology.
REFERENCES
- 1.Murray CJL, Lopez AD. Evidence-based health policy lessons from the global burden of disease study. Science. 1996;274:740–743. doi: 10.1126/science.274.5288.740. [DOI] [PubMed] [Google Scholar]
- 2.Pauwels RA, Buist AS, Calverley PM, Jenkins CR, Hurd SS, The GOLD Scientific Committee NHLBI/WHO Global Initiative for Chronic Obstructive Lung Disease (GOLD) Workshop summary. Am J Resp Crit Care Med. 2001;163:1256–1276. doi: 10.1164/ajrccm.163.5.2101039. [DOI] [PubMed] [Google Scholar]
- 3.Pauwels RA, Buist AS, Calverley PM, Jenkins CR, Hurd SS, GOLD Scientific Committee Global strategy for the diagnosis, management and prevention of chronic obstructive pulmonary disease. NHLBI/WHO Global Initiative for Chronic Obstructive Lung Disease (GOLD) Workshop Summary. Am J Respir Crit Care Med. 2001;163:1256–1276. doi: 10.1164/ajrccm.163.5.2101039. [DOI] [PubMed] [Google Scholar]
- 4.Hogg JC, Macklem PT, Thurlbeck WM. Site and nature of airways obstruction in chronic obstructive lung disease. N Engl J Med. 1968;278:1355–1360. doi: 10.1056/NEJM196806202782501. [DOI] [PubMed] [Google Scholar]
- 5.Van Brabandt H, Cauberghs M, Verbeken E, Moerman P, Lauweryns JM, Van de Woestijne KP. Partitioning of pulmonary impedance in excised human and canine lungs. J Appl Physiol. 1983;55:1733–1742. doi: 10.1152/jappl.1983.55.6.1733. [DOI] [PubMed] [Google Scholar]
- 6.Yanai M, Sekizawa K, Ohrui T, Sasaki H, Takishima T. Site of airway obstruction in pulmonary disease: direct measurement of intrabronchial pressure. J Appl Physiol. 1992;72:1016–1023. doi: 10.1152/jappl.1992.72.3.1016. [DOI] [PubMed] [Google Scholar]
- 7.Mead J, Turner JM, Macklem PT, Little J. Significance of the relationship between lung recoil and maximum expiratory flow. J Appl Physiol. 1967;22:95108. doi: 10.1152/jappl.1967.22.1.95. [DOI] [PubMed] [Google Scholar]
- 8.Muller NL, Staples CA, Miller RR, Alboud RT. Density mask: an objective method to quantitate emphysema using computed tomography. Chest. 1988;94:782–787. doi: 10.1378/chest.94.4.782. [DOI] [PubMed] [Google Scholar]
- 9.Gevenois PA, de Maertelaer V, De Vuyst P, Zanen J, Yernault JC. Comparison of computed density and macroscopic morphometry in pulmonary emphysema. Am J Respir Crit Care Med. 1995;152:653–657. doi: 10.1164/ajrccm.152.2.7633722. [DOI] [PubMed] [Google Scholar]
- 10.Coxson HO, Rogers RM, Whittall KP, D’Yachkova Y, Pare PD, Sciurba FC, Hogg JC. A quantification of the lung surface area in emphysema using computed tomography. J Respir Crit Care Med. 1999;159:851–856. doi: 10.1164/ajrccm.159.3.9805067. Erratum: Am J Respir Crit Care Med 1961;163:1500-1501. [DOI] [PubMed] [Google Scholar]
- 11.Leawoods JC, Yablonskiy DA, Saam BT, Gierada DS, Conradi MS. Hyperpolarized 3He gas production and MR imaging of the lung. Concepts Magn Reson. 2001;13:277–293. [Google Scholar]
- 12.Salerno M, de Lange EE, Altes TA, Truwit JD, Brookeman JR, Mugler JP. Emphysema: hyperpolarized helium 3 diffusion MR imaging of the lungs compared with spirometric indexes—initial experience. Radiology. 2002;222:252–260. doi: 10.1148/radiol.2221001834. [DOI] [PubMed] [Google Scholar]
- 13.Snider GL, Kleinerman JL, Thurlbeck WM, Bengally ZH. Definition of emphysema. Report of the National Heart, Lung and Blood Institute, Division of Lung Diseases. Am Rev Respir Dis. 1985;132:182–185. doi: 10.1164/arrd.1985.132.1.182. [DOI] [PubMed] [Google Scholar]
- 14.Duguid JR, Young A, Cauna D, Lambert MU. The internal surface area of the lung in emphysema. J Clin Pathol. 1964;88:405–421. doi: 10.1002/path.1700880204. [DOI] [PubMed] [Google Scholar]
- 15.Thurlbeck WM. The internal surface area of non-emphysematous lung. Am Rev Respir Dis. 1967;95:765–773. doi: 10.1164/arrd.1967.95.5.765. [DOI] [PubMed] [Google Scholar]
- 16.Thurlbeck WM. Internal surface area and other measurements in emphysema. Thorax. 1967;22:483–496. doi: 10.1136/thx.22.6.483. [DOI] [PMC free article] [PubMed] [Google Scholar]
- 17.Retamales I, Elliott M, Meshi B, Coxson HO, Pare P, Sciurba F, Rogers R, Hayashi S, Hogg J. Amplification of inflammation in emphysema and its association with latent adenoviral infection. Am J Respir Crit Care Med. 2001;164:469–473. doi: 10.1164/ajrccm.164.3.2007149. [DOI] [PubMed] [Google Scholar]
- 18.Meshi B, Vitalis T, Ionescu D, Elliott WM, Chun L, Wang X, Hayashi S, Hogg JC. Emphysematous lung destruction by cigarette smoke. Am J Respir Cell Mol Biol. 2002;26:52–57. doi: 10.1165/ajrcmb.26.1.4253. [DOI] [PubMed] [Google Scholar]
- 19.Möller HE, Chen XJ, Saam B, Hagspiel KD, Johnson GA, Altes TA, de Lange EE, Kauczor H-U. MRI of the lungs using hyperpolarized noble gases. Magn Reson Med. 2002;47:1029–1051. doi: 10.1002/mrm.10173. [DOI] [PubMed] [Google Scholar]
- 20.Saam BT, Yablonskiy DA, Gierada DS, Conradi MS. Rapid imaging of hyperpolarized gas using EPI. Magn Reson Med. 1999;42:507–514. doi: 10.1002/(sici)1522-2594(199909)42:3<507::aid-mrm13>3.0.co;2-u. [DOI] [PubMed] [Google Scholar]
- 21.Saam BT, Yablonskiy DA, Kodibagkar VD, Leawoods JC, Gierada DS, Cooper JD, Lefrak SS, Conradi MS. MR imaging of diffusion of 3He gas in healthy and diseased lungs. Magn Reson Med. 2000;44:174–179. doi: 10.1002/1522-2594(200008)44:2<174::aid-mrm2>3.0.co;2-4. [DOI] [PubMed] [Google Scholar]
- 22.Yablonskiy DA, Sukstanskii AL, Leawoods JC, Gierada DS, Bret-thorst GL, Lefrak SS, Cooper JD, Conradi MS. Quantitative in vivo assessment of lung microstructure at the alveolar level with hyperpolarized 3He diffusion MRI. Proc Natl Acad Sci USA. 2002;99:3111–3116. doi: 10.1073/pnas.052594699. [DOI] [PMC free article] [PubMed] [Google Scholar]
- 23.Weibel ER. Stereologic methods. Academic Press; London: 1980. pp. 9–196. [Google Scholar]
- 24.Fox JC, Tudhope SR, Meshi B, Hogg JC, Stockley RA. Development of a computer based image analysis technique for the detection of emphysema. Am J Resp Crit Care Med. 2003;167:A744. [Google Scholar]
- 25.Newell JD, Jr, Hogg JC, Snider GL. Report of a workshop: quantitative computed tomography scanning in longitudinal studies of emphysema. Eur Respir J. 2004;23:769–75. doi: 10.1183/09031936.04.00026504. [DOI] [PubMed] [Google Scholar]
- 26.Fichele S, Paley MN, Woodhouse N, Griffiths PD, Van Beek EJ, Wild JM. Finite-difference simulations of 3He diffusion in 3D alveolar ducts: comparison with the “cylinder model.”. Magn Reson Med. 2004;52:917–920. doi: 10.1002/mrm.20213. [DOI] [PubMed] [Google Scholar]
- 27.Leawoods JC, Choong CK, Yablonskiy DA, Chino K, Pierce JA, Cooper JD, Conradi MS, Hogg JC. Characterization of the extent of emphysema in human lungs via 3He MRI. FASEB J. 2004;624:12. [Google Scholar]
- 28.Howard CV, Reed MG. Unbiased stereology. 2nd ed. BIOS Scientific Publishers; Oxon: 2005. pp. 104–111. [Google Scholar]
- 29.Cambell H, Tomkeieff SI. Calculation of internal surface area. Nature. 1952;170:117. [PubMed] [Google Scholar]
- 30.Haefeli-Bleuer B, Weibel ER. Morphometry of the human pulmonary acinus. Anat Rec. 1988;220:401–414. doi: 10.1002/ar.1092200410. [DOI] [PubMed] [Google Scholar]
- 31.Woods JC, Yablonskiy DA, Choong CK, Chino K, Pierce JA, Hogg JC, Bentley J, Cooper JD, Conradi MS, Macklem PT. Long-range diffusion of hyperpolarized 3He in explanted normal and emphysematous human lungs via magnetization tagging. J Appl Physiol. 2005;99:1992–1997. doi: 10.1152/japplphysiol.00185.2005. [DOI] [PMC free article] [PubMed] [Google Scholar]