A previous bibliometric analysis has been reported in [1] and dealt with the all IEEE publications, available through the INSPEC database. Our objective was to see how the scientific contents were evolving over time, what relations might exist between journals and conferences, how the engineering disciplines were identified, etc. It was emphasized that the same study could be applied to specific journals, areas or societies and divisions. In this “A Look at…” column, the Biomedical Engineering production is examined. Only papers in journals, those linked to the IEEE Engineering in Medicine and Biology Society, have been included. Conference papers have been excluded due to a lack of completeness. The textual analysis relied on the same method known as Factorial Correspondence Analysis (FCA) [2,3]. The frequency of words permits the selection of the most salient terms without using the keywords indicated by the authors or database indexers (which might bring some biases). These words are filtered in such a way that verbs and articles are eliminated. From there, the association of groups of words provides a link to the similarity between documents or groups of documents (journals, sub-fields, etc.) and allows us to cross-analyse them (refer to [1] for more details).
Materials and method
The IEEE BME set constitutes 5 journals and a magazine. Each elementary document includes title, authors, addresses, record-types, abstract, and source (i.e journal) with the year of publication. The total number of documents (i.e papers) is 7,901. It consists of the following Transactions:
- IEEE Transactions in Biomedical Engineering (TBME): established in 1963, it is the founding journal in BME or the first resource for BME expression in science. It could be analysed alone due to the fact that the flow of published papers is high. However, in order to match its contents with the others, we decided to only include the 1982–2005 period. The number of published papers varies from year to year (a minimum of 107 in 1982, a maximum of 267 in 2004). The total number of documents that has been used for TBME is equal to 3,917
- IEEE Transactions on Medical Imaging (TMI): its birth in 1982 marked a time of two major breakthroughs, Computed Tomography (CT) and Magnetic Resonance Imaging (MRI). Less than 100 papers per volume have been published up to 1997. Its present situation (with around 140 papers a year) points out that medical imaging (MI) remains a very active research field (evidenced as well by major conferences such as SPIE Medical Imaging and the International Symposium on Biomedical Imaging (ISBI) and Medical Image Computing and Computer Assisted Intervention (MICCAI). The data set for TMI consists in 1,929 documents.
- IEEE Transactions on Information Technology in Biomedicine (TITB): this journal was launched in 1997. Its objective, as sketched in the first editorial by S Laxminarayan et al [4], was to create a space for new paradigms provided by Information Technology (network, mobile telecommunication, distributed computing, etc…) and healthcare concerns (home monitoring, pervasive systems, patient records, etc.). In the present study 342 papers have been included.
- IEEE Transactions on Nanobioscience (TNS) and IEEE Transactions on Neural Systems and Rehabilitation Engineering (TNSR): these are the most recent journals (TNS was created in 2002, TNSR having its scope changed in 2001). TNS is focused on nanotechnology in biomedical research, while TNSR is addresses the areas of sensing and stimulation for neuromuscular and central nervous diseases. These journals are publishing a limited number of papers a year. Thus, some cautions must be taken in the interpretation of our results due to the limited number of documents (184 for TNS and 262 for TNSR) submitted to our analysis.
- IEEE Engineering in Medicine and Biology Magazine (EMB): launched in 1982, it covers all areas of BME, mainly through special issues. Its place is, therefore, different from the Transactions, whose target is the publication of original research contributions. The amount of documents used here for EMB is 1,317.
To summarize the basic ideas behind lexicon analysis, let us recall that it relies on the observation that documents that use the same words with similar association frequencies have close contents. FCA is used to highlight these relations. The first step consists of estimating the frequencies of word occurrences within the whole set of documents. Then, the frequencies of word co-occurrences per document are estimated and analysed. This analysis allows the construction of a space of words and a space of documents such that the words will be closer as they are more often associated (a notion of “neighborhood” based on cooccurrence) and that the documents will be less distant as far as they contain the same word co-occurrences (“neighborhood” of documents due to characteristic co-occurring “constellations” of close words).
The Correspondence Analysis is particularly suited for textual data with its underlying barycenter interpretation, the duality of spaces (which leads to an interpretation, within the same space, of words and documents). The possible adjunction of supplementary elements (journal reference, year of publication, for instance) is also another advantage.
Results
Simple statistics can be extracted first regarding the origins of the authors. Keeping in mind that only the first author’s address is provided by INSPEC, it appears that 54% of the papers are from the United States; more than half come from 8 states, with the largest being (in decreasing order) California, Massachusetts, and Pennsylvania; Canada is in the second position with 6%; 66% originate from English-speaking countries; Europe (25 countries) represents 22% of the total production (with 5 countries, the United Kingdom, Italy, Germany, The Netherlands, and France, accounting for 73%); South East Asia provides 8.4% of the papers (among which 48% are from Japan).
From the data sets described above (restricted to 1982–2005 as previously mentioned), a full dictionary of words was built based on titles and abstracts. The most frequent words (3,000 ranked by decreasing order) were then selected and a table was constructed with words in rows and years in columns, each cell reporting the number of words per year. Additional columns have been used to refer to the journals: these columns represent the average over 3 years (2 years for the most recent journals, TNS and TNSR). The FCA has been applied to this matrix.
A first glance through the frequencies of words
By eliminating terms like “results” which are hopefully shared by all scientific papers, it is not surprising to see that some of the most frequent words (ranked along decreasing frequencies) are common to the journals. The top one is “system” which is shared by TBME, TITB, TNSR and EMB (with a rank between 1–3). The second one is “data” especially for TBME, TITB, TMI and EMB but which ranked very low for TNSR and TNS. “Model” appears as the most frequent term for TBME and is used very often also in TNSR and TMI. The word “time”, shared by TBME and EMB, appears also for TITB, TNSR and TMI in ranks 13 – 14. These words may have, of course, different interpretations due to the generalities they cover: their combination with other close words will clarify their meaning.
However, in addition to the previous ones, words indicating of each journal are also highlighted. TBME is for instance well identified by “signal”, “analysis”, and “frequency” while TMI is clearly signaled by “image”, “reconstruction”, “dimensional”, “tomography”. Along the same vein, TNS’s most frequent words are “cell”, “structure”, “surface”, “channels”, “protein” and TNSR’s are “control”, “stimulation”, “muscle”, and “force”. EMB has its own significant, and even more general, words with “”engineering”, “information”, and “research”.
There are however more intriguing situations. Major issues addressed in imaging for a while, like “segmentation”, and “registration”, are ranked rather high (positions 19 and 20 respectively) in TMI. For almost all journals, references to organs have low frequencies: “brain” appears in rank 11 in TNSR and rank 23 in TMI; “blood”, and “heart” are the first displayed in TBME (ranked in 26th position and higher).
TNSR is well identified with “muscle”, “brain”, “neural”, “BCI” (i.e brain computer interface), “joint”, and “gait”. The words that appear as significant for TITB are “information”, “patient”, “clinical”, and “care”, a situation that is not so dissimilar from EMB.
The availability of TBME since 1963 allowed us to match the words used before and after 1982. Most of the top ten are identical such as “model”, “system”, “data”, and “time” (the first four in different order) and “frequency”, “analysis”, and “signal”, when “blood”, and “computer” were present before 1982. However we will show that this does not mean that TBME is not evolving at all but that its core topics remains very stable.
Do the journals have their own profile?
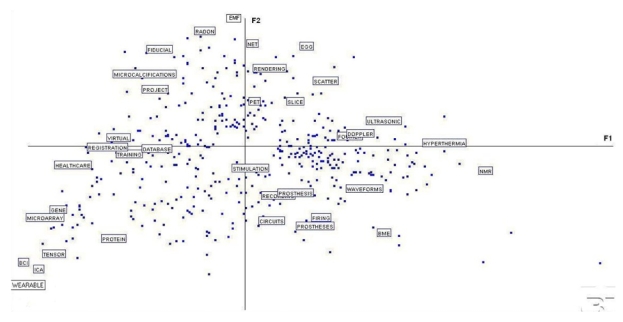
The above comments are not easy to interpret as a whole, and graphical descriptions may help in better envisioning the relationship the journals may have. The next issues will be addressed by means of factorial representations of journals and the most representative words as well as their evolution over time. It is worth noting that the first factorial plane of the correspondence analysis, F1–F2 (figure 1), represents about 24% of the total inertia (the other factors have a slowly decreasing inertia), in other words, this plane concentrates enough relevant information and will be used as reference in the following sections.
Figure 1.

First Factorial plane F1–F2 with the most significant words (they have been sampled in order to make the graph readable). The other points, not explicitly defined, also representing words contributing to the formation of the two first axes.
This figure displays a subset of the most significant words determining the first factorial axes. It can be seen that the words “hyperthermia”, “NMR”, “Doppler”, “Fourier”, and “ultrasonic” are highly correlated with the positive side of Fl (right). They are opposed to “healthcare”, “training”, “registration”, “virtual”, and “database” on the left. The second factor is defined by “net”, “rendering, “PET”, “Radon”, and “EMF” (up) and “recording”, “stimulation”, and “circuits” (down). When we look at the most significant words projected onto the 4 quadrants, we see: “scatter”, “ECG”, “slice” (first quadrant), “fiducial”, “microcalcifications”, “project” (second), “gene”, “tensor”, “protein”, “BCI”, “wearable”, and “ICA” (third) and “”waveforms”, “firing”, “prostheses” and “BME” (fourth). These words can be easily matched with the journals. Perhaps the most impressive result is in the third quadrant where all terms of high up-to-day significance are located.
The projection (not displayed here) of the journals onto this plane (represented by their barycentres, i.e the whole set of documents belonging to a given journal) shows that TBME occupyies the right-down quadrant, TMI the upper part of the plane, TITB stays on the left side and close to Fl, TNS and TNRS, are in the left-down side. EMB is in some way at the middle of these different locations: this confirms its role in addressing all the topics within biomedical engineering. As such, these results should lead to the conclusion that these journals have distinct contents and, therefore, their own overall profiles, with their overlaps remaining relatively coherent.
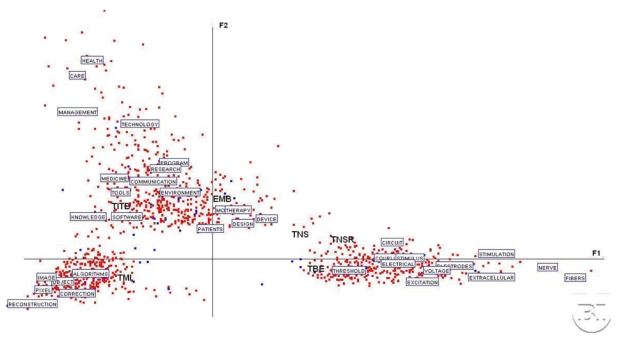
In order to refine this last point, a second study has been conducted. The initial table was built with the 7,901 documents in rows and the 903 most frequent and most occurring words in columns. The occurrence of words means that we neglect the fact that the same word appears several times in a given document: we look for the presence of this word in the maximum number of documents. Supplementary rows are included that segment the journals into periods of 2 or 3 years. The first factorial plane picture resulting from the application of FCA is depicted figure 2. Three clusters of words are clearly distinguishable, and the reader can easily see what words determine the factorial axes, what they separate or oppose, etc. The major point highlighted by this figure is that the three clusters on the left side correspond to TMI and TITB, and the one on the right side corresponds to the group of TBME, TNS and TNSR, while EMB is located along the second axis. Therefore, this picture underlines the distinct profiles of TITB and TMI with respect to TBME, while the most recent journals remain close to this historical journal. As said before, TNS and TNSR will very likely evolve on their own, but the set of documents is still too small to anticipate on that.
Figure 2.

A second study with most frequent and occurring words. The three clusters clearly identify the different journals TBME, TMI, and TITB (the former remaining very close to the two most recent journals, TNS and TNSR)
How BME and the journals evolve with time?
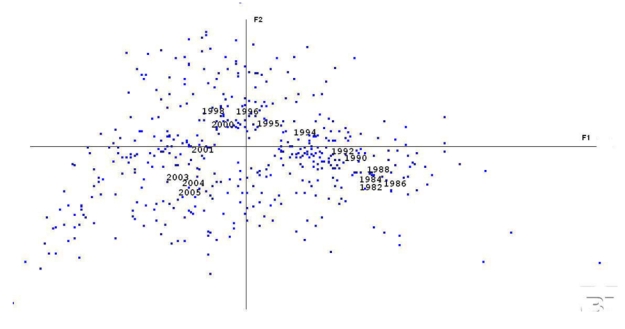
Coming back to the first data set that has been used, figure 3 depicts the global evolution of all the BME papers (keeping in mind that abstracts, not full papers, are used). The parabola-like shape from 1982 to 2005 shows a coherent path over time: from the right side of Fl (the 1980’s) to the left side (the most recent period of time). There are however several ruptures (or types of jumps) that can be observed: this is the case between 1992 – 1994, 2000 – 2001, and 2001 – 2004. In contrast, the 1980’s remain concentrated in the same area as well as the years 1995–2000 and 2003–2005. We do not have explanations for these observations; that require more in-depth analysis.
Figure 3.

A representation of the evolution over time of all BME document contents within the same factorial plane used for figure 1.
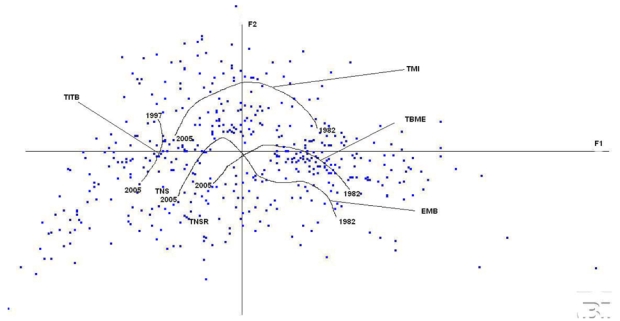
When looking more closely at the journal evolution (figure 4), this general picture for the oldest journals, TBME and TMI, is observed again: the trajectories over F1–F2 have the same shapes with an evolution from right to left, going up and then down. The evolution of TBME and TMI have a relatively similar amplitude over Fl. TBME stays basically in the bottom-left quadrant, close to words such as “signal”, “system”, “device”, and “potential”. If it is too early to interpret the trend for TITB, TNS and TSNR, we see that they are clearly separated, TITB being closer to TMI than to TBME. The path described by EMB is more complex. Here, it has been smoothed over blocks of 3 years to facilitate viewing. Although close to TBME at the beginning of the 1990’s, it moves toward TMI (1996–2002) and then to TNS and TNSR. This complex-shaped behavior may be linked to the fact that only 6 issues are published a year and that they are topic oriented, making it more sensitive than the other journals which include both more subtopics and similar subtopics in each issue.
Figure 4.

The evolution over time of the contents of the set of IEEE BME journals: TBME, TMI, EMB, TITB, TNS, TSNR. This evolution is captured here by smoothing over the years.
In all cases, this picture shows that the journals evolve significantly over time. It does not say if they evolve enough in order to be able to capture the emerging areas, of course. Most of the early non-BME IEEE journals published depict this parabola-like shape [1], illustrating the influence of electronics or devices at the beginning and of microprocessors and computers later. Research topics are evolving very fast, and the trajectories observed here provide no more than a picture of this global evolution.
Conclusion
This study has provided several highlights regarding biomedical engineering viewed through the scientific production of IEEE. The first point is that the BME journals, TBME, TMI, TITB, TNS, TNSR and EMB, have, overall, quite distinct contents. The second conclusion is that they evolve significantly over time, with a trend toward software engineering for TBME, TMI and TITB. This behavior can be compared to the entirety of IEEE publications as reported in [1].
However, some limitations must be emphasized in order to avoid inappropriate extrapolations. The newest journals (TNS and TNSR) examined in this column still have a low number of published papers (about 130 and 260 respectively) and, thus, it is too early to track their evolution. Even if most BME papers are published in the journals that we have examined here, other IEEE Transactions are also of concern, either those that are very focused on, for instance ultrasound (IEEE Transactions on Ultrasonics, Ferroelectrics and Frequency Control) or those that have larger scopes with an interest in BME, like IEEE Transactions on Pattern Analysis and Machine Intelligence, IEEE Computer Graphics and Applications, etc.
The decision to only deal with IEEE journals is another issue. The advantage is that it allows setting a well delimited reference corpus of documents but the drawback is that it reflects a reduced set of the worldwide BME literature. The corpus of abstracts we have used can be extended to full papers: the same methodology can be applied but the access is much more difficult to obtain. Such analysis may bring additional cues as to what is going on. However, we think that with these cautions in mind, the results reported are of significance.
Bibliometric studies like this one could also be of interest for other purposes. For example, the current European project Symbiomatics [5], aimed at examining the links between Medical Informatics and Bioinformatics, is based, at least partially, on the same methodological approach. In other words, targeted questions may be answered instead of analysing disciplines and specific journals as we did here.
References
- 1.Kerbaol M, Bansard JY, Coatrieux JL. An analysis of IEEE publications. IEEE Engineering in Medicine and Biology Magazine. 2006;25(2):p 6–9. doi: 10.1109/memb.2006.1705735. [DOI] [PMC free article] [PubMed] [Google Scholar]
- 2.Benzecri JP. Description des textes et analyse documentaire. Cahier de l’Analyse des Données. 1984;IX(2):205–211. [Google Scholar]
- 3.Greenacre MJ. Theory and Applications of Correspondence Analysis. Academic Press; London: 1984. [Google Scholar]
- 4.Laxminarayan S, Coatrieux JL, Roux C, Finkelstein SM, Sahakian AV, Blanchard SM. Biomedical Information Technology: Medicine and health Care in the Digital Future. IEEE Transactions on Information Technology in Biomedicine. 1997;1(1):p 1–7. doi: 10.1109/4233.594016. [DOI] [PubMed] [Google Scholar]
- 5.Synergies in medical informatics and bioinformatics. [on line] available: http:\\www.symbiomatics.org.


