

Abstract
The cystic fibrosis transmembrane conductance regulator (CFTR) Cl channel exhibits lyotropic anion selectivity. Anions that are more readily dehydrated than Cl exhibit permeability ratios (P S/P Cl) greater than unity and also bind more tightly in the channel. We compared the selectivity of CFTR to that of a synthetic anion-selective membrane [poly(vinyl chloride)–tridodecylmethylammonium chloride; PVC-TDMAC] for which the nature of the physical process that governs the anion-selective response is more readily apparent. The permeability and binding selectivity patterns of CFTR differed only by a multiplicative constant from that of the PVC-TDMAC membrane; and a continuum electrostatic model suggested that both patterns could be understood in terms of the differences in the relative stabilization of anions by water and the polarizable interior of the channel or synthetic membrane. The calculated energies of anion–channel interaction, derived from measurements of either permeability or binding, varied as a linear function of inverse ionic radius (1/r), as expected from a Born-type model of ion charging in a medium characterized by an effective dielectric constant of 19. The model predicts that large anions, like SCN, although they experience weaker interactions (relative to Cl) with water and also with the channel, are more permeant than Cl because anion–water energy is a steeper function of 1/r than is the anion–channel energy. These large anions also bind more tightly for the same reason: the reduced energy of hydration allows the net transfer energy (the well depth) to be more negative. This simple selectivity mechanism that governs permeability and binding acts to optimize the function of CFTR as a Cl filter. Anions that are smaller (more difficult to dehydrate) than Cl are energetically retarded from entering the channel, while the larger (more readily dehydrated) anions are retarded in their passage by “sticking” within the channel.
Keywords: hydration energy, anion binding, pseudohalides, ion-selective electrodes, anion channels
INTRODUCTION
The cystic fibrosis transmembrane conductance regulator (CFTR) channel functions as a PKA-activated ion channel that is predominantly expressed in epithelial cells. The channel selects for anions over cations (P Na/P Cl ≈ 0.03) (Tabcharani et al. 1997) and exhibits modest discrimination among anions as judged either from reversal potential measurements or the block of Cl conduction by other permeant ions (Anderson et al. 1991; Sheppard et al. 1993; Linsdell et al. 1997b; Tabcharani et al. 1997; Mansoura et al. 1998). Within the framework of a two-barrier, one-site permeation scheme, permeability selectivity may be thought of as a reflection of the relative ease with which anions enter the channel (barrier height) while blockade of conduction measures the tightness of anion binding (well depth) within the channel (Bezanilla and Armstrong 1972; Hille 1975b; Dawson, and Smith 1997; Mansoura, and Dawson 1998; Dawson et al. 1999). The selectivity patterns for both anion permeability and anion binding fall in the so called “lyotropic” sequence. Anions that are more readily dehydrated than Cl experience a reduced barrier to entry into the pore and also stick more tightly inside the pore than Cl (i.e., they see a deeper well). These parallel changes in peak height and well depth are evident for an anion like SCN, which is three times more permeant than Cl (P SCN/P Cl < 3.4), but also blocks Cl flow (Tabcharani et al. 1993; Mansoura et al. 1998). Anion binding differs from anion entry, however, in that it is highly sensitive to changes in pore structure, whereas permeability ratios are much less so (Mansoura et al. 1998).
To gain insight into the nature of the physical interactions that are reflected in the peak and well energies that characterize anion permeation, we compared the selectivity of CFTR to that of a well-characterized, synthetic anion-selective membrane composed of plasticized poly(vinyl chloride) (PVC) doped with tridodecylmethylammonium chloride (TDMAC) for which the physical basis for the response to anion substitution is more readily apparent (Morf 1981). The selectivity patterns for CFTR and the synthetic membrane differed by a multiplicative constant and both could be predicted by a continuum electrostatic model, based on the Born charging energy, that modeled anion–channel interactions as the energy of a charged sphere in a polarizable medium.
The continuum electrostatic approach provides a unified, quantitative interpretation of the observed energetics of permeation and block and offers a plausible explanation for the differential effects of mutations on these two processes that may be useful in understanding the physical nature of the conduction path, and in evaluating proposed structural models for the pore domain.
MATERIALS AND METHODS
Molecular Models
To estimate anion dimensions and surface area, each of the ions used was modeled using the PC Spartan molecular modeling program from Wavefunction, Inc. The equilibrium geometry of each of the polyatomic species was optimized using ab initio molecular orbital calculations. For those ions with a regular geometry, all additive and trigonometric calculations were done using nucleus-to-nucleus measurements from the model, and then the overall dimensions were approximated by adding the appropriate van der Waal radii to the terminal atoms. For those ions with an irregular geometry, the solid dimensions were estimated from the smallest “box” into which the ion would fit. The equivalent radius was determined by taking the surface area of the model and determining the radius of a regular sphere with the same surface area (where surface area = 4πr2). PC Spartan lacks basis values for gold so we could not perform the full set of calculations for Au(CN)2; however, we were able to model Ag(CN)2, which should have approximately the same dimensions. One of the advantages of the molecular orbital calculation method is that it permits an assessment of the charge distribution within the molecule. A hallmark of the halides and pseudohalides is that the negative charge is uniformly distributed (Douglas et al. 1994), whereas for some other polyatomic anions the charge is concentrated on a particular group. For example, 98% of the charge on gluconate is associated with the carboxyl group (-COO, −0.984e), while the other end of the molecule has a slight cationic character (-CH2OH, +0.032e). The physical properties of the halides, pseudohalides, and polyatomic anions used in this study are summarized in Table .
Table 1.
Physical Properties of Monovalent Halides, Pseudohalides, and Polyatomic Anions
| Ion | Dimensions | Equivalent radius | |||||||||
|---|---|---|---|---|---|---|---|---|---|---|---|
| Name | Formula | Shape | Height | Length | Width | Surface | logK pot Cl-X | ΔG hyd | ΔG hyd | ΔG Born ‡ | |
| Å | Å | Å | Å2 | Å | kJ/mol | kJ/mol | kJ/mol | ||||
| Fluoride | F− | Spherical | 2.66§ | — | — | 22.23 | 1.33∥ | −1.50 | −472 | −404 | −478 |
| Chloride | Cl− | Spherical | 3.62§ | — | — | 41.17 | 1.81∥ | 0.00 | −347 | −363 | −358 |
| Bromide | Br− | Spherical | 3.92§ | — | — | 48.27 | 1.96∥ | 1.29 | −321 | −328 | −332 |
| Iodide | I− | Spherical | 4.40§ | — | — | 60.82 | 2.20∥ | 3.14 | −283 | −278 | −297 |
| Cyanate | OCN− | Cylindrical | 3.40§ | 5.48 | — | 58.40 | 2.16 | 0.82 | −373 | −341 | −302 |
| Azide | N3 − | Cylindrical | 3.10§ | 5.45 | — | 59.76 | 2.18 | 1.18 | −287 | −331 | −300 |
| Thiocyanate | SCN− | Cylindrical | 3.60§ | 6.19 | — | 78.14 | 2.49 | 3.23 | −287 | −275 | −264 |
| Dicyanamide | N(CN)2 − | Bent cylinder | 4.17 | 7.54 | 3.40 | 87.26 | 2.64 | 3.36 | — | −272 | −249 |
| Selenocyanate | SeCN− | Cylindrical | 3.80§ | 6.45 | — | 82.42 | 2.56 | 4.08 | — | −252 | −257 |
| Dicyanoargentate | Ag(CN)2 − | Cylindrical | 3.40§ | 9.81 | — | 108.60 | 2.94 | 4.48 | — | −241 | −225 |
| Dicyanoaurate | Au(CN)2 − | Cylindrical | 3.40§ | 9.82 | — | — | 3.0¶ | 5.72 | — | −208 | −220 |
| Tricyanomethanide | C(CN)3 − | Pyramidal | 5.12 | 6.83 | 7.41 | 116.35 | 3.04 | 5.97 | — | −201 | −214 |
| Aspartate | HO2CCH(NH2)CH2COO− | Irregular | 5.76 | 8.15 | 6.65 | 130.04 | 3.22 | −1.22 | — | −396 | −206 |
| Gluconate | HOCH2[CH(OH)]4COO− | Irregular | 6.10 | 10.54 | 6.88 | 177.36 | 3.76 | −1.17 | — | −395 | −177 |
| Propionate | CH3CH2COO− | Irregular | 5.10 | 6.65 | 4.81 | 96.08 | 2.77 | −0.78 | −376 | −384 | −238 |
| Acetate | CH3COO− | Irregular | 4.72 | 5.24 | 4.34 | 74.52 | 2.44 | −0.96 | −373 | −389 | −269 |
| Formate | HCOO− | Planar triangle | 3.40 | 4.44 | 5.31 | 51.13 | 2.02 | −0.72 | −403 | −382 | −322 |
| Methanesulfonate | CH3C3 − | Irregular | 4.90 | 5.31 | 5.02 | 86.73 | 2.63 | −0.15 | — | −367 | −250 |
| Isethionate | HOCH2CH2SO3 − | Irregular | 5.10 | 7.80 | 5.58 | 113.84 | 3.01 | −0.09 | — | −365 | −220 |
| MTSES | CH3SO2SCH2CH2SO3 − | Irregular | 5.31 | 10.02 | 6.49 | 175.60 | 3.74 | 1.20 | — | −330 | −178 |
| Nitrate | NO3 − | Planar triangle | 3.10 | 5.18 | 4.89 | 49.74 | 1.99 | 1.90 | −306 | −311 | −327 |
| Perchlorate | ClO4 − | Tetrahedral | 5.64 | 5.93 | 5.93 | 73.42 | 2.42 | 4.97 | −214 | −228 | −271 |
Born Calculation of the Free Energy of Hydration (See )
In the Born model, the free energy of ion-solvent interaction is equated with the work required to move a charged sphere of radius, r, from a vacuum into a structureless continuum characterized by a dielectric constant, ∈ (Bockris and Reddy 1970). For each ion listed in Table , we obtained the equivalent radius from the molecular model (applying the correction of Latimer et al. 1939 (0.1 Å for anions and 0.85 Å for cations) and calculated the work of transfer from a vacuum to water (∈ = 80). There is reasonable agreement between the hydration energy calculated this way and the measured values for the halides and pseudohalides (Marcus 1997), but very poor correspondence for a number of the polyatomic anions. Gluconate, for example, is much more difficult to dehydrate than predicted by the Born analysis based on its equivalent radius, presumably due to the increased local charge density resulting from nonuniform charge distribution (Marcus 1997). This point is demonstrated in Fig. 1, which shows values of |ΔG hyd| plotted versus reciprocal ionic radius. It is apparent that the polyatomic anions (often used for sizing anion-selective pores; Bormann et al. 1987; Halm and Frizzell 1992; Linsdell et al. 1998) exhibit thermodynamic behavior consistent with an equivalent “Born thermochemical radius” that is much smaller than any actual dimension of the molecule (Table ).
Figure 1.

The absolute value of the hydration energy (|ΔG hyd|) plotted as a function of reciprocal anion radius (or equivalent sphere radius). The filled circles represent the halides and pseudohalides (Table ), and the open circles represent the polyatomic anions, which are noted on the figure for clarity. The solid line is the best fit to the data for the halides and pseudohalides; it has a slope of 674.5, y intercept of 8.8, and a correlation coefficient of 0.94. The dotted lines are the 95% prediction intervals (confidence intervals of the population).
PVC-TDMAC Membrane Measurements
The plasticized PVC-TDMAC membrane studied here is employed in an ion-selective electrode designed to detect small anions via a dissociated ion-exchange mechanism (Morf 1981; Yim et al. 1993). The ionophore, positively charge TDMA+, renders the membrane selective for anions over cations by a Donnan mechanism (see ). Because there is little or no ion pairing in the membrane phase, the relative anion selectivity of the TDMAC electrode is determined solely by the relative anion partition coefficients between water and the PVC membrane. Hence the membrane exhibits the so called “Hofmeister” or “lyotropic” selectivity sequence [i.e., C(CN)3 > SCN > I > Br > Cl > F] (Hofmeister 1888).
The electrode polymer membrane was composed of 1 wt% TDMAC, 33 wt% PVC, and 66 wt% ortho-nitrophenyloctyether (o-NPOE), a plasticizer. The ions were tested at a 10-mM concentration (as a Na or K salt) in distilled/deionized water, as well as in a 10-mM HEPES solution buffered at pH 7.4. The values were calculated from the average of six electrodes. The selectivity coefficient was calculated using the separate solution method (Morf 1981; Ammann 1986) as follows ():
 |
1 |
where logK A,B potis the potentiometric selectivity coefficient, E A and E B are the experimentally determined potentials of the cells, R is the gas constant, T is temperature in degrees Kelvin, F is the Faraday constant, and z is the valence of the ion. The physical significance of K pot and its relation to the free energy change associated with the transfer of an anion from water to the PVC membrane is presented in the and discussion sections. Dielectric constants of a number of electrode membranes were determined using an electrochemical impedance analyzer (6310; EG&G) as described by Buck 1982. The applied sinusoidal voltage amplitude was 20 mV.
The measured potentiometric selectivity coefficients (logK pot) for the ions used in this study are presented in Table . For ions like dicyanamide and tricyanomethanide, for which values for the free energy of hydration (ΔG hyd) were not available, we used the measured logK pot to estimate ΔG hyd values by fitting a line through the data for ClO4, SCN, I, NO3, Br, and Cl using reported values of ΔG hyd (Marcus 1997) and measured K pot values. The extrapolated values are given in Table .
RNA Synthesis and Xenopus Oocyte Expression
Human wild-type CFTR (wtCFTR) in a pBluescript vector (Stratagene Inc.) (Drumm et al. 1991) was linearized with XhoI and used as template for the generation of cRNA using the mMessage Machine protocol (Ambion, Inc.). The cRNA was resuspended in DEPC-treated water and maintained at −70°C before injection into oocytes. Female Xenopus (Xenopus-1) were anesthetized by immersion in ice water containing 3-aminobenzoic acid ethyl ester (Tricaine, 3 mg/ml; Sigma Chemical Co.) and oocytes were removed through an abdominal incision. The follicular membrane was removed by mechanical agitation (2–3 h) in a nominally Ca2+-free collagenase solution containing (mM): 82.5 NaCl, 2 KCl, 1 MgCl, 10 HEPES, pH 7.5, and 2.5 mg/ml collagenase (GIBCO BRL). Defolliculated oocytes were maintained in a modified Barth's solution (MBSH) containing (mM): 88 NaCl, 1 KCl, 2.4 NaHCO3, 0.82 MgSO4, 0.33 Ca(NO3)2, 0.41 CaCl2, 10 HEPES, pH 7.5, and 150 mg/liter gentamicin sulfate. Oocytes were maintained at 18°C in a humidified incubator. 1 d after isolation, oocytes were injected with cRNA (diluted to give 50–250 μS of stimulated conductance: ∼0.15 ng/oocyte in a 50-nl volume) using a microinjector (Drummond Scientific Co.) and beveled injection needles (∼10-μm tip diameter). Injected oocytes were maintained in MBSH and used for electrophysiological analysis 2–6 d after injection.
Electrophysiology
Individual oocytes were perfused with an amphibian Ringer's solution containing (mM): 100.5 NaCl, 2 KCl, 1.8 CaCl, 1 MgCl, and 5 HEPES, pH 7.5. The oocyte was impaled with two microelectrodes with tips pulled (P-97; Sutter Instruments Co.) to give 0.5–1.5 MΩ of resistance when filled with 3 M KCl. The open circuit membrane potential was continuously monitored on a strip chart recorder (Kipp & Zonen), and periodically the membrane was clamped (TEV-200; Dagan Corp.) and using a computer-driven protocol (Clampex; Axon Instruments), ramped from −120 to +60 mV at a rate of 100 mV/s for most analyses, although a step protocol (from −120 to +40 mV in 10-mV steps, 200 ms/step) was also used to check for time-dependent currents. The membrane conductance was calculated using the slope conductance over a 20-mV range centered on the reversal potential, and using chord conductances at various voltages. For ramp data, a correction for the capacitive transient was estimated by comparing the current measured at the holding potential to that determined at the same potential within the ramp, and the difference was subtracted from the entire event. The data was analyzed using an Excel (Microsoft Co.) spreadsheet, and secondary analyses were performed using Sigmaplot (SPSS Inc.).
After the oocyte recovered from impalement, CFTR was stimulated by adding a cocktail containing 10 mM forskolin and 1 mM 3-isobutyl-methylxanthine (IBMX) (Research Biochemicals, Inc.) to the perfusate. For ion substitution protocols, the basic amphibian Ringer's was modified to reduce interference from the endogenous Ca2+-activated Cl channel (Ackerman et al. 1994; Kowdley et al. 1994; Machaca and Hartzell 1998) and contained (mM): 98 Na-anion, 2 K-aspartate, 1 Mg-aspartate, 1.8 Ba-acetate, and 10 HEPES, pH 7.5. Some of the anions used are only available as K salts, in which case the solution was modified to contain 98 K-anion and 2 Na-aspartate; otherwise identical (all salts were from Aldrich Chemical Co., Sigma Chemical Co., or Strem Chemicals, Inc.). Typically, an uninjected, mock-injected, or CFTR-expressing, but unstimulated, oocyte exhibited a background conductance of 0.5–1.5 μS, with a slightly higher conductance at depolarized potentials due to the endogenous Ca2+-activated Cl channel in parallel with an endogenous voltage-gated Ca2+ channel. Three of the substitute anions [Au(CN)2, C(CN)3, and N(CN)2] produced a current in uninjected, mock-injected or CFTR-expressing, but unstimulated, oocytes. If the background current was >2% of the current in the stimulated condition, then the background currents were subtracted. The CFTR-independent currents seen in the presence of Au(CN)2, C(CN)3, and N(CN)2 were completely reversible and the magnitude could be faithfully reproduced with repeated exposure. The CFTR-independent current for Au(CN)2, C(CN)3, and N(CN)2 were moderately sensitive to flufenamic acid (∼50% inhibition with 250 μM flufenamic acid), suggesting that at least a portion of the conductance is through an endogenous, anion-selective pathway. A portion of the residual current may be due to partitioning into the bilayer, as suggested by the lipophilicity of these compounds (Finkelstein and Cass 1968). There were no apparent “toxic” effects as judged by the ability of the CFTR conductance to completely recover after exposure to Au(CN)2. Ag(CN)2 appeared to be somewhat toxic to the oocytes and, therefore, its permeation was not characterized.
Calculation of Permeability Ratios, Relative Barrier Height, Relative Binding, and Relative Well Depth
Permeability ratios were calculated using the Goldman-Hodgkin-Katz equation () as follows:
 |
2 |
where ΔE rev is the measured shift in zero current potential after Clo is replaced with the substitute ion, subo, [Cl]′o is the bath concentration of Cl, [Cl]o is the residual Cl in the substituted solution, [sub]o is the concentration of the substitute ion, and R, T, z, and F have their usual meaning. The central goal of the analysis presented here was to use measurements of relative anion permeability and relative anion blockade to estimate the energies associated with transferring an anion from water into the channel. This required that we adopt a model (or models) for the anion translocation process that would permit us to estimate the energetic significance of differences in anion permeability or binding. It is important to note that the primary aim was not to arrive at absolute values for these energies, but rather to determine the trend in the change in the energies from one anion to another so that this trend could be compared with the change in anion size.
The relation used to interpret permeability ratios in terms of energy differences can be obtained using either of two complimentary approaches. Rate theory models for permeation predict that permeability ratios are determined by the difference in peak height for the two ions. For example, for Cl and a substitute anion the permeability ratio is given by :
 |
3 |
where Δ(ΔG)peak is the difference in free energy between Cl and the substitute ion. This calculation applies to any number of barriers as long as the difference in barrier height, Δ(ΔG)peak, is the same for all barriers (peak energy offset condition; Hille 1975a). A recognized limitation of the rate theory approach is ambiguity in the value of the “prefactor” in the rate equations (Andersen 1999; Levitt 1999; Nonner et al. 1999), but in the present calculation we are concerned exclusively with the ratios of permeabilities so that, as long as the permeation process is similar for all anions, ambiguities in the absolute value of the prefactor should have a small effect.
A second route to the relation described by is to use a lumped Nernst-Planck model in which the permeability is expressed ():
 |
4 |
where βi is the water-channel equilibrium partition coefficient, D i is the diffusion coefficient within the channel, A is the cross-sectional area, and Δx is the length of the channel. If it is assumed that the long-range, anion–channel interaction is reflected in the apparent value of β; and that D is approximately equal for different anions, then ():
 |
5 |
where −Δ(ΔG)eq is the difference in the equilibrium transfer free energy between Cl and the substitute ion. In the discussion, a simple model is used to show how these two approaches, one focusing on peak energy and the other on an equilibrium transfer energy, can yield the same result; i.e., Δ(ΔG)peak = Δ(ΔG)eq.
Blocking efficacy was determined by exposing the oocyte to a 5-mM concentration of the substitute anion (some of the salts are only available as K salts and, for those experiments, a 5-mM KCl control was added to the protocol). Percent block was determined by measuring the decrease in the slope conductance (+/− 10 mV) at the reversal potential. Each anion was characterized by a half-maximal inhibition constant, K i 1/2, calculated by assuming blockade to be a unimolecular binding event that can described by Michaelis-Menten kinetics (Mansoura et al. 1998) ():
 |
6 |
where [x] is the concentration of added blocker, g b is the conductance measured in the presence of the blocker, and g o is the conductance measured in the absence of the blocker. To convert the relative values of K i 1/2 to differences in well depths, we assumed that all blocking anions bound at the same site and that blockade was the result of competition between the blocking anion and Cl for that site (Mansoura et al. 1998). The values of K i 1/2 were, therefore, assumed to be related to the actual binding constants of the blocking anion and those of Cl by a relation of the form expected for simple, competitive inhibition (Segel 1993), where
 |
and [Cl] is the concentration of Cl at the site, K Cl is the binding constant for Cl at the site and K A is the binding constant for the blocking anion at the site. If it is further assumed that the value of [Cl] and K Cl are independent of the nature of the blocking anion, then the ratio of any two values of K i 1/2 is given by :
 |
7 |
where Δ(ΔG)well is the difference in well depth between the two ions, ΔG A well − ΔG B well.
We note two qualifications as regards this approach to determining relative well depth. First, the blocking anions used were all permeant to varying extents and were expected, therefore, to contribute to the measured current. Errors due to permeation of the blocking anion were minimized by using a blocker concentration (5 mM) that was ∼5% that of Cl (105 mM). Second, multiple anion occupancy of CFTR (Tabcharani et al. 1993) could in principle affect the estimation of relative peak heights and well depths, but under the conditions used in the present experiments (external substitution), only monotonically decreasing conductance was seen with increasing concentration of the blocking anion (see also Mansoura et al. 1998), so we assumed that channels were singly occupied at all times.
RESULTS
Selectivity Patterns for CFTR and the PVC-TDMAC Membrane
The experimentally derived parameters that comprise the selectivity patterns for CFTR and the PVC-TDMAC membrane are presented in Table . Permeability ratios are tabulated in two ways; using either the least permeant anion, Cl, or the most permeant anion, C(CN)3, as a reference. The latter were used to calculate Δ(ΔG)peak so that each number this column reflects the increase in peak height seen by each anion over that seen by C(CN)3. The table also contains the K 1/2 for blockade of Cl currents for each anion and the ratio of each K 1/2 to that measured for C(CN)3. The latter values were used to calculate Δ(ΔG)well, which represents the change in well depth for each anion relative to C(CN)3, so that positive values indicate a shallower well and negative values a deeper well. Also tabulated in Table are values for logK pot, obtained as described in materials and methods from anion substitution protocols using the PVC-TDMAC membrane and expressed relative to Cl and to C(CN)3. As with permeability ratios and inhibitory constants, the values for logK pot were used to calculate Δ(ΔG)trans (see ), which represents the increase in transfer free energy from water to the synthetic membrane for each of the anions with respect to C(CN)3.
Table 2.
Permeability Ratios, Inhibitory Constants, and Potentiometric Selectivity Coefficients
| Ion | Psub/PCl ratio | Psub/PC(CN)2 ratio | Δ(ΔG)peak | K i 1/2 | Ki,x 1/2/Ki,C(CN)3 1/2 | Δ(ΔG)well | logK pot Cl-X | logK pot C(CN)3-X | Δ(ΔG)trans |
|---|---|---|---|---|---|---|---|---|---|
| kJ/mol | mM | kJ/mol | kJ/mol | ||||||
| Cl− | 1.00 | 0.13 | 5.09 | — | — | — | 0.00 | −5.97 | 34.05 |
| Br− | 1.22 | 0.16 | 4.60 | — | — | — | 1.29 | −4.68 | 26.69 |
| OCN− | 1.20 | 0.15 | 4.64 | — | — | — | 0.82 | −5.15 | 29.38 |
| N3 − | 1.40 | 0.18 | 4.26 | 13.63 | 6.46 | 4.63 | 1.18 | −4.79 | 27.32 |
| NO3 − | 1.42 | 0.18 | 4.22 | — | — | — | 1.90 | −4.07 | 23.22 |
| SCN− | 3.41 | 0.44 | 2.05 | 5.26 | 2.49 | 2.26 | 3.23 | −2.74 | 15.63 |
| N(CN)2 − | 4.49 | 0.58 | 1.37 | 3.88 | 1.84 | 1.51 | 3.35 | −2.62 | 14.94 |
| SeCN− | — | — | — | 8.82 | 4.18 | 3.55 | 4.08 | −1.89 | 10.78 |
| Au(CN)2 − | 6.67 | 0.86 | 0.39 | 1.06 | 0.50 | −1.72 | 5.72 | −0.25 | 1.43 |
| C(CN)3 − | 7.80 | 1.00 | 0.00 | 2.11 | 1.00 | 0.00 | 5.97 | 0.00 | 0.00 |
The values for permeability ratios and relative values of K i 1/2 span a range from 1 to 8 for the former and 1 to 14 mM for the latter, and the energies associated with these indices of anion permeation and binding range from ∼0.4–5 kJ/mol. As expected (Eisenman and Horn 1983; Lewis and Stevens 1983), the differences in peak heights and well depths associated with ion translocation through the CFTR channel, as well as the energies associated with anion partitioning into the synthetic membrane, are small with regard to an absolute reference such as the hydration energies for the anions shown in Table . It is also apparent, however, that the energies associated with the responses of CFTR and the synthetic membrane to anion substitution are highly correlated.
In Fig. 2, the energy differences associated with anion permeation (A) and block (B) are plotted versus the corresponding energies derived from the response of the PVC-TDMAC membrane. The high correlation of these values (with the exception of iodide, see below) indicates that the selectivity pattern exhibited by CFTR, as judged by either relative permeability or relative binding, is qualitatively identical to that of the synthetic membrane, differing in each case only by a multiplicative constant. Anions that see a barrier height that is increased relative to that of C(CN)3 also experience a more positive (less favorable) transfer free energy between water and the synthetic membrane. Similarly, anions that bind less tightly than C(CN)3 are those for which the water-synthetic membrane transfer free energy is less favorable. It is apparent from Fig. 2 that the peak and well energies change in a parallel fashion. SCN, for example, sees an energy barrier to entering the CFTR channel that is lower than that of Cl, and also sees an equilibrium free energy associated with partitioning into the synthetic membrane that is more favorable than that of Cl. Similarly, the tighter binding of SCN (relative to Cl) is correlated with ease of partitioning into the synthetic membrane. These results are, perhaps, not surprising in that the selectivity patterns for both CFTR and the PVC-TDMAC membrane have both been previously identified as being consistent with the “lyotropic” or Hofmeister series, which is ordered according to relative free energy of hydration (Anderson et al. 1991; Linsdell et al. 1997a,Linsdell et al. 1997b; Tabcharani et al., 1997b). Anions that are more readily dehydrated than Cl exhibit higher permeability ratios and bind more tightly within the CFTR pore, and also partition more readily into the PVC-TDMAC membrane.
Figure 2.
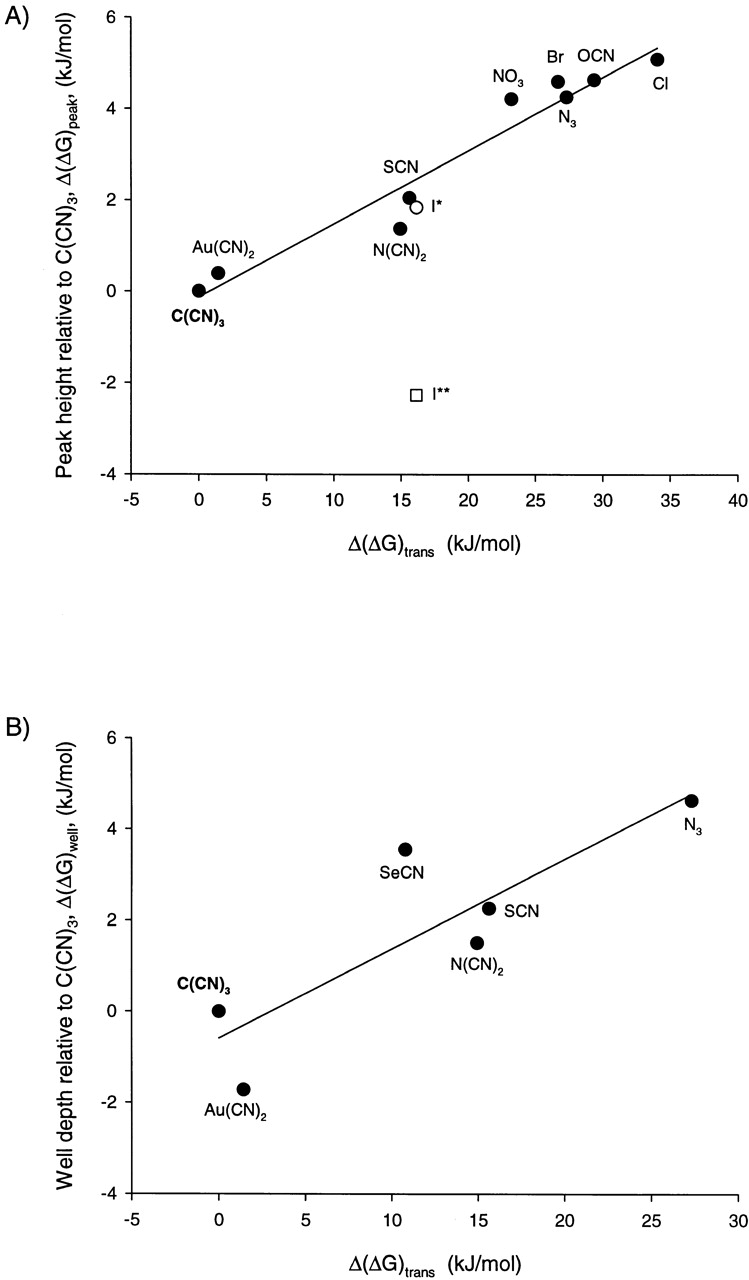
(A) CFTR permeability selectivity and PVC-TDMAC membrane selectivity. CFTR permeability ratios (Table ) expressed as differences in the peak heights (kJ/mol) plotted as a function of Δ(ΔG)trans for the PVC-TDMAC membrane, which has the units of kilojoules per mole (see ). Both variables are defined with respect to tricyanomethanide, so that the y and x axes reflect, respectively, the magnitude of the increase in the apparent peak barrier height and the increase in the water-electrode transfer free energy. The line shown is a linear regression with a slope of 0.16 and correlation coefficient (r2) of 0.93. The iodide point (○) flagged with an asterisk reflects a P I/P Cl of 2.1, as determined by Tabcharani et al. 1997, whereas the lower value (□), P I/P Cl of 0.4, flagged with a double asterisk, is more often seen with CFTR (Anderson et al. 1991; Sheppard et al. 1993; Mansoura et al. 1998). (B) CFTR binding selectivity and PVC-TDMAC membrane selectivity. The ratio of the apparent half-maximal inhibition constants expressed as relative differences in well depth (kJ/mol) are plotted as a function of Δ(ΔG)trans for the PVC-TDMAC (kJ/mol). Both variables are defined with respect to tricyanomethanide. The line shown is a linear regression with a slope of 0.196 and a correlation coefficient of 0.73.
Analysis of Selectivity Patterns
To understand the physical basis of the selectivity patterns common to CFTR and the PVC-TDMAC membrane, it was necessary to relate the energy differences associated with anion permeability ratios, relative anion binding affinities, and anion partitioning into the synthetic membrane to some physical property of the anions. As exemplified by the seminal work of Eisenman 1962 and the analysis of the acetylcholine receptor by Lewis and Stevens 1983, the natural choice for this parameter is ion size, expressed as the reciprocal of ionic radius, 1/r. This is so because the dominant contribution to the electrostatic free energy of a spherical ion varies with 1/r (Buckingham 1957; Bockris, and Reddy 1970). Fig. 3A and Fig. B, shows the results of such analysis for the PVC-TDMAC membrane and CFTR, respectively. In Fig. 3 A, the energy differences associated with anion partitioning into the PVC-TDMAC membrane obtained from Δ(ΔG)trans (see ) are plotted versus the reciprocal of ionic radius (Table ). In Fig. 3 B, the relative heights of the energy barriers associated with entering the CFTR channel obtained from permeability ratios (Table ) are plotted versus the reciprocal of the anionic radius. Because C(CN)3, the largest and most permeant ion, was chosen as the reference anion for both plots, for each anion, either the increase in equilibrium transfer energy (synthetic membrane) or the increase in barrier height (CFTR) relative to that seen by C(CN)3 is plotted versus 1/r. In both cases, the energy difference increases linearly with 1/r. Lewis and Stevens 1983 pointed out that the slope of this type of plot provides a quantitative measure of selectivity, and by that standard it is apparent that the synthetic membrane is approximately five times more selective than CFTR.
Figure 3.

(A) Energetic analysis of PVC-TDMAC membrane selectivity. The filled circles represent the equilibrium transfer energy [Δ(ΔG)trans] for each anion relative to the value of C(CN)3 plotted as function of reciprocal anion radius, 1/r (Table ), and the dashed line is the best fit to the points. The solid line is the relative hydration energy [|Δ(ΔG)hyd|, C(CN)3 reference] calculated using and plotted versus 1/r. The dotted line is the relative solvation energy [|Δ(ΔG)solv|, C(CN)3 reference] calculated as Δ(ΔG)hyd − Δ(ΔG)trans. (A, inset) The free energy of transfer for a spherical test charge of 1-Å radius, plotted as a function of the dielectric constant of the medium to which the ion is being transferred from a vacuum according to . (B) Energetic analysis of CFTR permeability selectivity. The solid circles represent the relative peak height [Δ(ΔG)peak, C(CN)3 reference] calculated from the permeability ratios (Table ) plotted as function of reciprocal anion radius, 1/r (Table ). The dashed line is the best fit to the data points. The solid line is the relative hydration energy [|Δ(ΔG)hyd|, C(CN)3 reference] calculated using vs. 1/r. The dotted line is the apparent relative solvation energy [|Δ(ΔG)solv|] calculated by subtracting the best fit to the data points from |Δ(ΔG)hyd|.
The physical significance of the plots of energy difference versus reciprocal radius can be appreciated by expressing the total free energy of transfer as the sum of two components; one due to the difference in hydration energy and the other the difference in the energy of solvation of the anion within the synthetic membrane or CFTR. The former measures the energy of interaction of the anion with water, while the latter is a measure of the energy of interaction of the anion with the channel and its contents. The relative free energy of transfer, Δ(ΔG trans), associated with either differential anion partitioning into the synthetic membrane (see ) or the barrier to entry into the channel, can be written as in :
 |
8 |
where Δ(ΔG hyd) is the relative hydration energy and Δ(ΔG solv) the relative solvation energy in the membrane, both calculated using C(CN)3 as a reference (i.e., and ):
 |
9 |
and
 |
10 |
where ΔG hyd A,ΔG hyd CCN3,ΔG solv A, andΔG solv CCN3are the energies of hydration and solvation, respectively for anion, A, and C(CN)3 expressed with respect to a vacuum phase.
The solid lines in Fig. 3A and Fig. B, represent the values of |Δ(ΔG hyd)| relative to C(CN)3 calculated as the Born charging energy (see ) using corrected radii as described in materials and methods (Table ). Note that, although the values of Δ(ΔG hyd) are negative, they are plotted here as absolute values for convenience of comparison with Δ(ΔG trans). The hydration component of the energy difference will be identical for any channel or membrane, as the necessity to remove an ion from bulk water is a universal constant for any permeation process (Krasne and Eisenman 1973; Eisenman and Horn 1983).
The linear, monotonic behavior of Δ(ΔGt rans) and Δ(ΔG hyd) suggested a straightforward calculation of Δ(ΔG solv) as the difference between these two functions, and the predicted behavior of the solvation energy is indicated by the dotted lines in Fig. 2A and Fig. B. The selectivity patterns exhibited by the PVC-TDMAC membrane and CFTR can be readily understood in terms of the differences in the relative interaction energy of the anions with water, Δ(ΔG hyd), and with the membrane, Δ(ΔG solv). In the synthetic membrane, the work required to transfer an anion from water to the plasticized PVC decreases with increasing anion radius because Δ(ΔG hyd) is a steeper function of 1/r than is Δ(ΔG solv). In other words, anions larger than Cl experience weaker interactions with water and with the synthetic membrane, but they partition into the membrane more readily because they see the smallest difference between these two energies.
The linear relation between the apparent solvation energy for the PVC-TDMAC membrane and reciprocal anionic radius (Fig. 3 A) suggests that ΔG solv, the anion-membrane interaction energy for the PVC-TDMAC membrane, behaves precisely as predicted by the Born energy (see ) for a spherical anion contained within a polarizable medium having a dielectric constant somewhat less than that of water. The slope of the plot predicts an effective dielectric constant, ∈eff, for the synthetic membrane of 4.1. The measured dielectric constant of the PVC-TDMAC membrane was ∈ = 11.5 ± 0.6, as compared with a published value of ∈ = 14 for o-NPOE plasticized PVC membranes constructed without TDMAC (Armstrong and Horvai 1990). In other words, the synthetic membrane is somewhat more selective than would be predicted by the bulk dielectric constant determined from the apparent capacitance. Fig. 3 A (inset) provides some appreciation of the impact on ΔG solv of changes in the dielectric constant. ΔG solv for a 1-Å sphere increases rapidly as ∈ increases from 1 to ∼20, but changes are minimal for ∈ > 20. From the perspective of the continuum analysis of solvation energy, a medium having a dielectric constant >20 is effectively as polarizable as water (∈ = 80).
Fig. 3 B shows the behavior of Δ(ΔG peak), Δ(ΔG hyd), and Δ(ΔG solv) for CFTR. It is immediately apparent from Fig. 3 B that the modest permeability selectivity of CFTR can be attributed to the fact that the energies of hydration and solvation differ very little over the range of anion sizes examined. In other words, a visiting anion is solvated within the CFTR pore nearly as well as it is in bulk water. Accordingly, the solvation energy predicts an effective dielectric constant within the pore of ∼19. The near identity of the value of ΔG hyd and ΔG solv justifies treating the energies associated with anion entry as a near equilibrium process. The point is made more explicitly in Fig. 4, in which are shown the predicted values expressed with respect to a vacuum reference phase for ΔG peak, ΔG hyd, and ΔG solv, calculated using a value of 19 for the effective dielectric constant within the channel. This plot predicts a peak energy for Cl of 14.5 kJ/mol (5.86 RT), which agrees well with the values derived by Linsdell et al. 1997a for a multi-site model, and is about half the value of 27.8 kJ/mol (11.2 RT) predicted from a symmetric two-barrier, one-site model using a well depth of 8.2 kJ/mol (3.3 RT) (based on the dissociation constant of 38 mM for chloride as determined by Tabcharani et al. 1997) and constraining the single channel conductance to 10 pS (Dawson et al. 1999). Although these values are likely to be significantly affected by the ambiguity as to the appropriate value for the prefactor in the Eyring rate equations (Andersen 1999; Levitt 1999; Nonner et al. 1999), it is apparent that the absolute barrier heights predicted from continuum analysis fall in a range consistent with observed transport rates. The error in the prefactor incurred by using kT/h has been estimated, using a discrete approximation to a continuum model, to be of the order of 102, which would translate into an error in the calculated value of ΔG of ∼4.6 RT (Andersen and Koeppe 1992).
Figure 4.

Energetics of CFTR permeability selectivity expressed with respect to a vacuum reference phase. The filled circles represent the relative peak heights (ΔG peak, vacuum reference) calculated from the permeability ratios (Table ) and plotted as a function of reciprocal anion radius, 1/r (Table ). The solid line is the hydration energy, |ΔG hyd|, calculated using , and plotted versus 1/r. The dotted line is the solvation energy, |ΔG solv|, calculated for a homogenous medium with a dielectric constant of 19 using vs. 1/r. The dashed line is the predicted peak barrier height, ΔG peak, calculated from the difference between the hydration energy and the solvation energy (ΔG solv − ΔG hyd).
Fig. 5 A contains data taken from the analysis of Bormann et al. 1987 of relative anion permeability in the GABA receptor (GABAR). The pattern of permeability selectivity for the ligand-gated channel also conforms to the predictions of a continuum electrostatic model, where the anion–pore interaction is modeled as the stabilization of an anion by a polarizable medium. The effective dielectric constant is predicted to be somewhat lower than that of CFTR, ∼12.4, because the selectivity is somewhat higher. The absolute barrier for Cl is predicted to be 19.6 kJ/mol (7.9 RT), which agrees fairly well with the estimates of Bormann et al. 1987 of a barrier height of 24 kJ/mol (9.7 RT) for a three-barrier, two-site model. A similar analysis of the glycine receptor (GlyR; Bormann et al. 1987) and the outwardly rectifying chloride channel (ORCC) from T-84 cells (Halm and Frizzell 1992) is shown in Fig. 5B and Fig. C, respectively.
Figure 5.
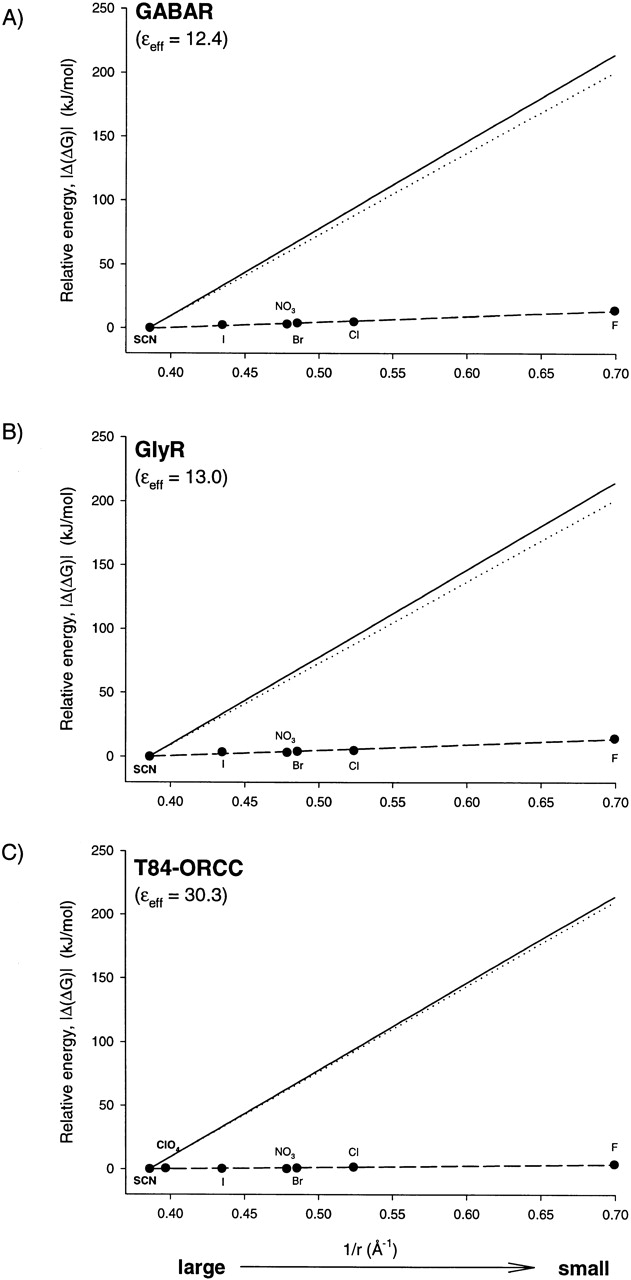
Energetics of permeability selectivity for GABAR (A), GlyR (B), and the T84-ORCC (C). The filled circles represent the relative peak heights [Δ(ΔG)peak, SCN reference] calculated from the reported permeability ratios (Bormann et al. 1987; Halm and Frizzell 1992) plotted as function of reciprocal anion radius, 1/r (Table ). The dashed line is the best fit to the data points. The solid line is the relative hydration energy [|Δ(ΔG)hyd|, SCN reference] calculated using vs. 1/r. The dotted line is the apparent relative solvation energy [|Δ(ΔG)solv|] calculated by subtracting the best fit to the data points from |Δ(ΔG)hyd|.
Anion Binding to CFTR
Fig. 6A and Fig. B, shows values for the binding energies derived from the comparative analysis of blockade of CFTR by halides and pseudohalides, which we presume to reflect the presence in the permeation path of at least one energy well. Fig. 6 A shows that the relative energies of binding, like the barriers to permeation, decrease with increasing values of 1/r. The implications of the variation in well depth depicted in Fig. 6 A are more readily apparent from a plot of estimated values for the anion–channel interaction energies calculated at the binding site with respect to a vacuum reference (Fig. 6 B). The values plotted in Fig. 6 B were calculated by fixing the well depth for SCN at 12.5 kJ/mol (5.1 RT) on the basis of the dissociation constant of 6.4 mM reported by Tabcharani et al. 1993, and adding the calculated hydration energy. The points for C(CN)3, Au(CN)2, N(CN)2, and N3 were determined by taking their values relative to SCN, and then adding the calculated hydration energy. The dashed line is the best fit to the data points. The predicted well depth for Cl is ∼6.5 kJ/mol, which agrees well with the value of 8.2 kJ/mol calculated from the dissociation constant of 38 mM reported by Tabcharani et al. 1997, which is shown as an open circle on the plot.
Figure 6.

(A) Energetics of CFTR relative binding selectivity. The filled circles are the relative well depth [|Δ(ΔG)well|, C(CN)3 reference] calculated using the ratio of the apparent inhibition constants (Table ) plotted as function of reciprocal anion radius, 1/r (Table ). The dashed line is the best fit to the data points. The solid line is the relative hydration energy [|Δ(ΔG)hyd|, C(CN)3 reference] calculated using plotted vs. 1/r for reference. Due to the fact that the measurements were made with respect to Cl (see materials and methods), it is not possible to calculate a value for Cl; however, the plot permits an extrapolation for Cl based on the size of the anion (highlighted with an arrow). (B) Anion-channel stabilization energies at the binding site plotted with respect to a vacuum reference phase. The filled circles are the well depths set by fixing the well depth for SCN at 12.5 kJ/mol (5.1 RT, based on the dissociation constant of 6.4 mM reported by Tabcharani et al. 1993) and adding the hydration energy plotted as function of reciprocal anion radius, 1/r. The dashed line is the best fit to the data points. The Cl point (○) shown is the well depth of 8.2 kJ/mol, based on the reported dissociation constant for Cl of 38 mM reported by Tabcharani et al. 1997, shown for comparison. The solid line is the hydration energy, |ΔG hyd|, calculated using plotted vs. 1/r. The dotted line is the solvation energy, |ΔG solv|, calculated for a homogenous medium with a dielectric constant of 19 using plotted vs. 1/r, as in Fig. 4. Note that values of transfer energy greater than the hydration energy reflect energetic wells, whereas values less than the hydration energy reflect energetic barriers.
The anion–channel interaction energy derived from an analysis of anion binding behaves as if it consists of two components: a constant, negative energy that is similar for all anions and a radius-dependent portion that increases with decreasing anion size. Well depth, the difference between the anion–channel interaction energy (dashed line) and the hydration energy (solid line), increases with increasing anion size because, as with the barrier height, the change in hydration energy is a steeper function of 1/r than is the apparent anion–channel interaction energy at the binding site. As anionic size increases, the hydration energy decreases more rapidly than does the anion–pore energy so that the net effect is to deepen the well. This result appears to be counter intuitive, because the anion that is most tightly bound experiences the smallest anion–channel interaction energy. However, relative well depth always reflects changes in both anion–channel and anion–water interactions.
The dotted line in Fig. 6 B represents the anion–channel interaction energy derived from relative permeability measurements taken from Fig. 4, plotted for comparison and to emphasize an important point, namely that the radius-dependent portion of the anion-channel interaction energy is similar, regardless of whether it is defined by relative permeability (peak height) or relative blocking affinity (well depth). This plot shows why larger anions experience not only a reduced barrier to entering the channel, but also a deeper energy well within the channel.
Iodide Permeation and Block
In terms of permeability selectivity, iodide stands out as an anomaly. In Fig. 2 A, it can be seen that the value of P I/P Cl determined for human wtCFTR expressed in Xenopus oocytes is well below that predicted for an ion that is easier to dehydrate than Cl. Tabcharani et al. 1997 provided evidence that CFTR can exhibit a higher value of P I/P Cl (2.1; Fig. 2 A, asterisk), but that the ion causes a rapid modification of CFTR that leads to the lower value of 0.2–0.4 that is most often reported (Anderson et al. 1991; Sheppard et al. 1993; Mansoura et al. 1998). The higher value of P I/P Cl would place iodide in its predicted position on the 1/r plot (Fig. 2 A). Using human wtCFTR expressed in Xenopus oocytes, we have not detected any evidence of this higher P I/P Cl using a panel of various mole fractions of I:Cl, as well as various voltage clamping protocols (data not shown). It may be, however, that the conversion is simply too fast to resolve in this experimental setting. In accord with the hypothesis of Tabcharani et al. 1997 that I is inducing a modification of CFTR, we have observed a block of CFTR by I that is qualitatively distinct from the block seen with the other permeant ions (see Mansoura et al. 1998). Block by a small amount of I in the external bath is weakly voltage dependent in the negative quadrant, as shown in Fig. 7, whereas the block seen with most permeant ions is largely voltage independent (Mansoura et al. 1998). The efficacy of block is enhanced if the external concentration of Cl is lowered (by substitution with aspartate), as shown in Fig. 7 B, suggesting that Cl and I ions are competing for the same site(s). Iodide has a tendency to form interhalogens, particularly triiodide, a reactive species known to attack cysteine, tyrosine, and histidine residues within proteins, but the addition of sodium thiosulfate, which reduces I3, did not alter the observed effects. Furthermore, increasing concentrations of I3 (made by adding I2 to NaI solution) appeared to be quite toxic above 500 μM I3, leading to uncontrollable increases in oocyte conductance. While in solutions near or below 100 μM, the I3 appeared to be unstable in our standard amphibian Ringer's (as judged colorimetrically by clarification of the yellowish-red color of the I3), it was possible to make a fresh I3 solution and feel relatively confident that the oocyte was seeing 10–100 μM I3, in which case the effect on CFTR was an irreversible, voltage-independent block. However, we cannot rule out the possibility that I3 may be forming within the lumen, leading to a mild chemical modification of CFTR. Data from mutagenesis experiments support the view that iodide permeation is most properly thought of as a special case in that mutations that affect P I/P Cl do not appear to dramatically alter the permeability ratios for other permeant ions (Anderson et al. 1991; Tabcharani et al. 1997; Mansoura et al. 1998).
Figure 7.

Iodide block of CFTR current. (A) The solid line is the cAMP-activated current (10 μM forskolin + 1 mM IBMX) in standard frog ringer (materials and methods) for an oocyte expressing wtCFTR. The dashed line is the current 2 min after the addition of 5 mM NaI to the perfusate. (B) The solid line is the cAMP-activated current (10 μM forskolin + 1 mM IBMX) in a reduced Cl frog ringer (30 mM Cl; 70 mM aspartate) for an oocyte expressing wtCFTR. The dashed line is the current 2 min after the addition of 5 mM NaI to the perfusate. The data was collected using a ramp protocol as noted in materials and methods.
DISCUSSION
The Physical Significance of Lyotropic Selectivity Patterns
The measurements and analysis presented here provide a plausible explanation for the anion selectivity pattern often referred to as the lyotropic or “Hofmeister” sequence that is seen in a variety of Cl channels and in synthetic, anion-selective membranes. In both cases, the selectivity pattern can be predicted by assuming that the energy of interaction of the anion with the channel or synthetic membrane is dominated by the electrostatic energy associated with the stabilization of a charged sphere in a dielectric medium. The analysis of selectivity by Eisenman and co-workers (reviewed in Eisenman and Horn 1983) laid the foundation upon which most analysis of ion selectivity is based, namely that the relative tendency of an ion to enter or associate with a channel is dependent on the balance of two energies, one resulting from the ion–water interactions and the other reflecting the ion–channel interactions. In its original form, Eisenman's formulation of the selectivity problem relied on the assignment of a variable “field strength” to presumed sites of interaction in the channel that could be occupied by visiting ions. By varying the field strength, and hence the predicted energy of the ion–channel interaction, it was possible to generate different selectivity patterns. The limiting patterns were those associated with very high or very low field strength, respectively, in which either ion–channel or ion–water energies would dominate the ion transfer process.
The analysis presented here provides a physical basis for “weak field strength” selectivity. In the continuum electrostatic model, the field strength is that due to the polarization of dipolar entities that are subject to the field of the visiting anion. The magnitude of the ion–channel interaction energy depends on the size of the anion and the effective dielectric constant experienced by the anion when it resides within the channel. It is important to point out that the value of the effective dielectric constant would not be expected to be governed solely by the properties of amino acid side chains that might line the pore. Although the polarizability of such entities would contribute to ∈eff, other contributions would be expected from the remainder of the protein, including side chains and the peptide backbone, water molecules that may reside within the channel, the surrounding lipid, and even water bathing the membrane. The term “effective dielectric constant” embraces this notion (Sham et al. 1998). It is clear from this analysis that the implication of the term “weak field strength” is not that the anion–channel energies are small. They are, in fact, predicted to be approximately equal to the anion–water energies, but to increase slightly less steeply with decreasing anion size.
The Effective Dielectric Constant and the Solvation of Permeant Ions
The Born-type model employed here is, from both a conceptual and computational perspective, the simplest approach to accounting for the apparent solvation energies of anions that traverse the pore. The model represents the heterogeneous ensemble of components that comprise the environment of an anion as an equivalent continuum of infinite extent characterized by an effective dielectric constant, ∈eff. The most important result of the analysis is not the value of ∈eff, however. Rather, it is the fact that the lyotropic selectivity pattern can be predicted by presuming that anions interact with the channel much as they do with water, such that the stabilization energy is linearly related to reciprocal anion radius.
Attempts to measure or predict the value of the apparent dielectric constant seen by an anion inside a channel have produced widely varying results. In a large bore (minimum diameter ∼10 Å), anion-selective porin (phoE, for example), Gutman et al. 1992 used time-resolved fluorometry to determine a value of ∈eff for the pore of 24, whereas Karshikoff et al. 1994 predicted a value for the same channel of 30 using a macroscopic, multidielectric model. The analysis conducted by Sham et al. 1998 and Sansom et al. 1997, however, suggests that the definition of a unique ∈eff may be elusive because the value is likely to depend on the type of electrostatic interaction used to define it. As indicated in materials and methods, the value of ∈eff could also depend on the approach taken to define the radius of the ion (Grunwald 1997). It is probably most prudent to consider ∈eff, determined here, as an empirical parameter that provides a measure of the relative ability of the channel to solvate a permeating ion that offers a useful first approach to conceptualizing the electrostatic origins of the selectivity pattern.
The behavior of ions in physical or biological systems has been analyzed previously using an approach similar to the one adopted here. An analysis of the swelling and shrinking of gels by Büchner et al. 1932 led to a relationship between the action of salts on colloidal systems and reciprocal ion radius not unlike that used here. In addition, Lewis and Stevens 1983 presented essentially similar findings for cation permeation in the acetylcholine receptor. The Born analysis, based on their permeability ratios, would predict ∈eff = 55. More recently, Aqvist and Warshel 1989 used two methods, free energy perturbation and protein dipoles Langevin dipoles simulations, to analyze the polarizable interior of the gramicidin channel to predict the energy barrier to permeation for Na, deriving values of 9.6 (3.9 RT) and 16.7 (6.7 RT) kJ/mol, respectively. Using the data of Urban et al. 1980, the analysis used here would predict an ∈eff of 21.5–27 for gramicidin A, and an absolute barrier for Na entry of 10–14 kJ/mol. Partenskii et al. 1994 reported that, within the framework of a three-dielectric, continuum model in which the dielectric constant of the pore region was restricted to between 2 and 5, it was difficult to account for the apparent energy barrier that characterizes cation flow through the gramicidin channel.
Structural Implications for Cl-selective Channels
As regards the structure of the CFTR pore domain, the most important implication of the analysis presented here is the prediction that the permeability selectivity pattern characteristic of CFTR, as well as several other nonhomologous anion channels, does not depend on the interaction of the permeating anion with some specific component of the channel. The basic selectivity pattern, common to anion permeability and anion binding, can be viewed as the result of the interaction of the anion with a volume that exhibits the generalized property of dielectric polarizability. This type of environment could presumably be provided by a configuration of the membrane spanning segments of CFTR which, along with the resident water molecules, forms a polarizable “tunnel” through which the anions can pass (Sansom et al. 1996, Sansom et al. 1997). The present results do not speak to the location of any “selectivity filter” and, in fact, suggest that the very idea that the anion permeability selectivity of CFTR is associated with any specific structure, as in the K channel visualized by Doyle et al. 1998, may be moot. The barrier to anion entry (or the energy associated with equilibrium partitioning) is predicted to be a generalized feature of this dielectric tunnel that is not highly dependent on the details of the structure of the transmembrane segments. This prediction has, in fact, been borne out by the results of mutational analysis, which have shown that permeability ratios are largely insensitive to mutations (Anderson et al. 1991; Mansoura et al. 1998). In addition, the observation that the same analysis predicts the relative pattern for anion channels that are likely to be divergent in their structure lends further support to the notion that the anion–channel interaction energy is the result of a generalized interaction of the anion with the pore.
The selectivity of anion binding by CFTR differs from relative permeability in at least two ways. First, in contrast to permeability, binding is highly sensitive to point mutations, particularly in transmembrane segments 5 and 6 (Anderson et al. 1991; Tabcharani et al. 1993; Linsdell et al. 1997b; Smith et al. 1997; Mansoura et al. 1998). Second, the analysis of energetics presented here suggests that, in order to predict the selectivity pattern associated with anion binding, the underlying anion–channel interaction energy must be envisioned as comprising two components: one due to the same radius-dependent, dielectric stabilization that appears to determine barrier height, and a second that is similar for all anions, roughly independent of size. These two attributes, sensitivity to structural perturbations and two-component energetics, are easily reconciled by assuming that anion binding, represented by the energy well in the rate theory description, is dependent on the existence within the conduction path of a narrow region in which the residues that line the channel are able to come into a more intimate, inner sphere and contact the visiting ion. If this region were relatively rigid so that it could not change conformation in the presence of different permeant ions, then the energy associated with residing there could be roughly independent of anion size. In contrast, the contribution to the anion–channel energy due to the region of the protein surrounding the cavity would exhibit the dependence on anion size predicted for a polarizable medium. Mutations could alter the nature of this cavity by changing its size or, equally likely, by changing the charge or orientation of amino acid side chains that are required for a favorable anion–channel interaction. Reduction or elimination of the anion–channel contact would leave the underlying, radius-dependent anion–channel energy intact so that permeability ratios would not be greatly affected even though anion binding was nearly lost.
A Working Model for Anion Permeation and Binding
The analysis of permeation and binding energetics undertaken here provides the basis for a working model of the anion conduction process in CFTR and perhaps the GABAR, GlyR, and T84-ORCC as well. In the case of CFTR, it is possible to envision two sorts of CFTR pores: those that bind anions, exemplified by the wild-type channel, and those that do not, exemplified by mutant CFTRs like G314E or Q (Mansoura et al. 1998) and R347D (Tabcharani et al. 1993). This structural dichotomy suggests that it is reasonable to treat these two facets of the conduction process as representing two distinct types of physical interaction of the anion with the channel.
Consider first a channel that does not bind anions (Fig. 8 A). It is useful to envision permeant anions in the bulk solution as coordinated by an inner sphere of water molecules and surrounded by an outer sphere or shell that is the remainder of the bulk solution (Sharp and Honig 1990; Andersen and Koeppe 1992; Marcus 1994). Upon colliding with the mouth of the channel, the anion and channel form a transition state complex that leads to the anion, along with most of its inner shell water, residing within the channel. In this state, the channel, to a first approximation, has replaced the outer shell waters (i.e., the bulk solution), but the inner sphere waters remain associated with the anion. The energy profile expected for the process is depicted as the trapezoidal line in Fig. 8 D and represents an equilibrium transfer free energy (reflected in the partition coefficient, β) that, for Cl, would be unfavorable by ∼6 RT (see results) due to the fact that the effective dielectric constant of the channel protein, the lipid membrane, and surrounding water is somewhat less than that of the outer sphere of water molecules in bulk solution. This represents the energy barrier seen by an anion entering the channel.
Figure 8.

Model for permeation in Cl channels that exhibit lyotropic selectivity. (A) A channel that does not bind ions. An anion is indicated in three locations along with its inner sphere water molecules. (B) The inner “lining” of the wtCFTR pore, with its anion binding site, suspended in water, with an anion in the proposed narrow region in which elements of the pore wall make inner sphere contact with the anion. (C) The wtCFTR channel with its anion binding site in a lipid bilayer. (D) The energetics of transfer. The solid trapezoidal line represents the energetic expense associated with partitioning into a “polarizable” tunnel embedded in a bilayer, envisioned in A. The dashed line represents the energetic well seen by an anion in the narrow region of the pore wall in free solution, as envisioned in B. The dotted line represents the profile of the total free energy (A + B) associated with traversing the wtCFTR channel embedded in a bilayer. The well depth and peak height are predicted to change in a parallel fashion due to the anion size-dependent changes in the free energy, which is shown in E for Cl (solid line) and a larger anion (dashed line), such as SCN. Anions that enter the channel more readily also bind more tightly.
To arrive at a model for anion binding, we begin by envisioning the lining of the wild-type pore as a “thin-walled” tube immersed in bulk water (Fig. 8 B). When the anion encounters the channel in this (albeit hypothetical) condition, it enters with little or no energy cost as it retains its inner sphere water, and the outer sphere energy within the thin-walled tube is virtually identical to that experienced by the anion in bulk water. As the anion moves along the lining of the wild-type channel, however, it encounters a narrowing where some portion of the inner sphere water molecules are replaced by interactions with the polar or charged groups that line this region of the pore. These inner-sphere anion–channel interactions with the wall of the pore are somewhat more favorable than those with water so that an energy well is created. The profile for this hypothetical thin-walled anion-binding channel residing in water is depicted as the dashed line in Fig. 8 D. This binding might be imagined as being analogous to that seen with anion inclusion compounds, like the katapinates, that form inner sphere interactions with Cl and Br in aqueous solution (Dietrich and Hosseini 1997). One of these, a diprotonated diazabicyclic [9,9,9] (Bell et al. 1975) encloses a Cl that is stabilized by two ionic hydrogen bonds with amino nitrogens. The stability constant for this compound predicts a “well depth” of ∼11.4 kJ/mol (4.6 RT) that is of the same order as that seen in the weakly selective channels considered here.
If these two profiles are summed (Fig. 8 C), they give rise to the familiar two-barrier, one-well profile that is depicted as the dotted line in D. Although the shape of the profile as depicted in Fig. 8 D is largely arbitrary, the diagram makes the point that it is possible, in principle, to account for the energetics of anion permeation through CFTR in a relatively straightforward way and illustrates how the summing of an equilibrium transfer energy with a single, localized energy well could give rise to the familiar two-barrier, one-site channel model.
Fig. 8 E illustrates how radius-dependent variation in the outer sphere anion energy could vary the peak heights and well depths in a parallel fashion if the inner-sphere contribution in the binding region of the channel was roughly size independent. Large anions that experience a reduced barrier height, and enter the channel more readily, also see a deeper energy well and bind more tightly because of the reduced, radius-dependent equilibrium transfer energy.
The Significance of Ion Selectivity Patterns: from Bias to Recognition
The permeability selectivity exhibited by CFTR, and shared by GABAR, GlyR, and T84-ORCC, represents the most primitive type of ion discrimination, characteristic of a permeation path that functions as a polarizable tunnel that can stabilize a partially dehydrated ion as it passes through. This situation is a striking contrast to that envisioned for the bacterial K channel that selects for K by means of a clearly identifiable structure, the selectivity filter, consisting of a tetrahedral array of oxygen ligands (Armstrong 1975, Armstrong 1989; Doyle et al. 1998). In a recent review of the physical factors that govern anion separations, Moyer and Bonnesen 1997 suggested the utility of viewing selectivity within the framework of two limiting types. In one, exemplified in biology by the K channel, the host (channel) is structurally specialized to recognize the guest (ion). In the other, here exemplified by CFTR, selectivity is based simply on a physical bias that is imposed by the physics of hydration and a primitive form of solvation of the guest by the host molecule. This approach to categorizing selectivity types provides a useful framework for interpreting selectivity patterns characteristic of different channel families (Halm 1998). The physical forces that produce a bias-type selectivity must impinge on any ion–channel interaction, but channels may be expected to vary in the extent to which this bias is overshadowed by a specific recognition component. The muscle Cl channel, ClC-1, may be a case in point. It has been reported to exhibit a distinctly nonlyotropic pattern of permeability selectivity (Cl > SCN > Br > NO3 > I) (Fahlke et al. 1997) that may be an indication of some structural specialization that has evolved to recognize the Cl anion. It is of interest in this regard that mutation of several residues in ClC-1 resulted in a reversion of the selectivity sequence to the more primitive, lyotropic order (Fahlke et al. 1997). What is striking in the case of CFTR (and, likely, GlyR, GABAR, and T84-ORCC) is that the compound effects of bias-based permeability selectivity and anion binding result in channels that are “optimized” Cl filters.
Permeability and Anion Size
The analysis employed here emphasizes one aspect of the relation of anion size to permeation, namely that halides and pseudohalides having an equivalent sphere radius larger than that of Cl enter the pore more readily due to lower anion-water interaction energies. There is clearly a limit, however, to any “larger is better” theory of permeation. As anion size increases, the physical dimension of the pore, its effective diameter, must become limiting. Several of the “larger” molecules that were the focus of this study are roughly cylindrical in shape and the actual physical diameter of the cylinder is less than that of the diameter of the equivalent sphere (dicyanoaurate, for example, has a cylindrical diameter of ∼3.4 Å at its widest point, while the equivalent sphere diameter of the molecule is ∼6 Å; Table ). On the other hand, the trimmest right cylinder into which tricyanomethanide, which has flattened pyramidal geometry, could fit would be ∼7.4 Å in diameter, its widest dimension, due to the fact that there is no way to “twist” the pyramid to fit it into a smaller cylinder. This may seem to be inconsistent with the effective pore diameter of ∼5.5 Å determined by Linsdell et al. 1997b, Linsdell et al. 1998; however, if one imagines that the shape of the pore is elliptical, such that the widest part of the pore is on the order of 7.5 Å, then the narrow portion of the pore could be on the order of 5.5 Å, and thereby accommodate tricyanomethanide.
It may be necessary, however, to exercise some caution in imputing effective pore size from the behavior of poorly permeant ions. As indicated in Fig. 1, polyatomic molecules like gluconate are characterized by a hydration energy that is much larger than their physical size would predict, an effect that is presumably due in part to a nonuniform charge distribution (Gilson and Honig 1988; Marcus 1997). On the basis of Fig. 1, it is possible to assign to gluconate an apparent “thermochemical radius” of ∼1.65 Å. Using the value of ∈eff = 19 for the CFTR pore predicts a peak barrier height of 15.9 kJ/mol (6.4 RT), and the difference in this value and that for Cl [14.5 kJ/mol (5.86 RT), see results] predicts a permeability ratio (P gluconate/P Cl) of ∼0.58. This may be compared with the experimentally determined values of 0.071 and 0.013 reported by Linsdell and Hanrahan 1998, determined by substitution of the solution on the cytoplasmic and extracellular side of the patch, respectively. The larger of these two values (0.071) predicts a peak energy of 21.1 kJ/mol, 5.2 kJ/mol greater than the simple electrostatic model. This increased barrier height could point to a size exclusion effect. Marcus 1997, however, points out that asymmetric charge distribution could have other consequences that are not directly related to size, because the polar and nonpolar portion of the molecule can experience very different interactions with the immediate environment.
Acknowledgments
We thank Fong Sun for her essential assistance with the molecular biology and all aspects of oocyte maintenance and care, James Schaefer and Colin Cooke for their assistance with the initial experiments, Marc Post for the Excel Macros that were used in routine data analysis, Vincent Pecoraro for his assistance in our initial modeling of ions and helpful discussion regarding the chemistry of pseudohalides, and Wayne Huang of Wavefunction Inc. for his assistance with PC-Spartan.
This work was supported by grants from the National Institutes of Health (DK45880 to D.C. Dawson and GM-28882 to M.E. Meyerhoff), the University of Michigan G.I. Peptide Center, and The Center for Membrane Toxicity Studies at the Mount Desert Island Biological Laboratory.
An Electrostatic Analysis of the Selectivity of the Plasticized PVC-TDMAC Membrane
Anion-selective membranes were constructed of a mixture of 66% (by weight) o-NPOE, 33% PVC, and 1% TDMAC. Within the ∼100-μm-thick membrane, TDMAC functions as a completely dissociated anion exchanger that favors the extraction of mobile anions and excludes cations by a Donnan mechanism (Teorell 1953; Overbeek 1956; Morf 1981). When used in an anion-sensitive electrode, the membrane is bathed on one side by a reference solution containing Cl as the anion (Yim et al. 1993), and test solutions containing an equimolar concentration of a test anion are applied to the other side. The change in membrane potential resulting from the equimolar anion substitution is a reflection of the selectivity of the membrane for the test anion relative to that of the reference ion, Cl.
We treat the potential across this “thick” membrane as comprised of three components, two phase boundary potentials, ϕ1 and ϕ2, that represent the electrical potentials associated with the solution–membrane interfaces, and an intramembrane diffusion potential, ϕd, due to the mixing of Cl and the test anion within the membrane (Teorell 1953; Finkelstein and Mauro 1977). We assume that the similarity of anionic mobilities within the membrane makes this latter component negligible and focus, therefore, on the change in ϕ1, the phase boundary potential at the membrane surface in contact with the test solution. We further assume that the kinetics of transfer across this boundary are rapid with respect to those of the intramembrane mixing process so that the solution–membrane interface may be approximated as an equilibrium anionic distribution.
Anion equilibrium between the aqueous and membrane phases is defined by the equality of the anion chemical potential in the two phases ():
 |
A1 |
where μ*w and μ*m are the standard chemical potentials for the anion in the aqueous and membrane phases, respectively; [A−]w and [A−]m are the concentrations of the anion in the two phases and Vw and Vm the respective electrical potentials. The values of concentration and electrical potentials are taken to be defined at distances sufficiently far from the membrane–solution interface to exclude the space-charge region (Bockris and Reddy 1970; Finkelstein and Mauro 1977; Morf 1981). The phase boundary potential, ϕ1, is given by :
 |
A2 |
The first term on the right hand side represents the contribution to ϕ1 due to the unequal distribution of the anion, caused by the presence of the completely dissociated ionophore, TDMAC, this is the familiar Donnan potential (Teorell 1953; Overbeek 1956).
The second term in represents the contribution to ϕ1 due to the differential solubility of the anion in water and in the plasticized PVC, as reflected in the membrane–water partition coefficient, β, defined at ϕ1 = 0, given by :
 |
A3 |
Outside of the space charge region, electroneutrality dictates that the concentration of the mobile anions be equal to that of the dissociated ionophore, as shown in :
 |
A4 |
where [X+]m is the concentration of the ionophore in the bulk membrane phase. Inserting and into yields :
 |
A5 |
in which the total phase boundary potential, ϕ 1, is expressed as the sum of two components: one the Donnan potential and the other due to the differential partitioning of the anion between the aqueous and membrane phases. Now, we consider the change in ϕ1, Δϕ 1, that occurs when a test anion, A, is substituted for the reference anion, Cl. For a complete equimolar replacement of Cl by S, the first term in will be identical for both anions because ():
 |
A6 |
so that, Δϕ1 is given by ():
 |
A7 |
In the analytical chemistry literature (Morf 1981), the value of zFΔϕ1/RT is defined as lnK pot, where ()
 |
A8 |
Recalling , we can write K pot as a function of the standard chemical potentials for the two anions ():
 |
A9 |
where Δμ*A and Δμ*Cl represent the difference in standard chemical potential between the aqueous and membrane phases for the test anion, A and Cl, respectively.
Each of these differences in standard chemical potential can be expressed as the difference in the free energy associated with bringing the anion from a reference phase (defined as a vacuum) to the aqueous phase or to the membrane phase, respectively, so that for the substitute ion and Cl, and apply:
 |
A10 |
and
 |
A11 |
For any anion, the difference in standard chemical potential, and hence the partition coefficient, may be regarded as a reflection of the difference between the energy of interaction of the anion with water, ΔG hyd, and with the membrane, ΔG solv, respectively. We denote this difference for each anion, ΔG trans, the work required to move one mole of the anion from water to the membrane phase. The value of K pot is a reflection of the value of ΔG trans relative to that of the test ion and Cl, and we denote this as Δ(ΔG trans).
An Electrostatic Model for Δ(ΔGtrans)
Following the approach of Born 1920, we now calculate values for ΔG hyd and ΔG solv by assuming that the dominant contribution to these energies will be the electrostatic energy associated with the net charge on the anion. This energy is calculated by letting each anion be represented by a sphere of radius, r, and calculating the work required to move the ion from a vacuum reference phase to water or to the membrane. This is given by the difference in the work required to discharge the anion in vacuo (∈ = 1) and that required to recharge it in water or the plasticized PVC membrane.
Each of these phases is represented as being an infinite, structureless continuum, characterized by a dielectric constant, ∈, a reflection of its polarizability. The values of ΔG hyd and ΔG solv will both be negative because the dielectric constants of the two phases are both greater than unity (∈water = 80, ∈m ∼ 14). The values for ΔG hyd and ΔG solv are thus given by and :
 |
A12 |
and
 |
A13 |
where r is the anionic radius, ∈ is the dielectric constant, and K is a constant given by :
 |
A14 |
where N is Avogadro's number, e is the electronic charge, and ∈0 is the permittivity of free space.
Footnotes
It has been pointed out that the magnitude of the correction to the Born radius is expected to be solvent dependent (Grunwald 1997) so that, whereas the Latimer correction is appropriate for calculating the anion–water interaction energies, it is not necessarily appropriate for calculating anion–channel interaction energies. In the present work, we used the Latimer correction, which, although small for anions, introduces a degree of ambiguity in the calculation of the effective dielectric constant seen by the anion inside the channel (see text).
Dr. Smith's and Dr. Dawson's present address is Department of Physiology & Pharmacology, Oregon Health Sciences University, Portland, OR 97201
Abbreviations used in this paper: CFTR, cystic fibrosis transmembrane conductance regulator; GABAR, gamma amino butyric acid receptor; GlyR, glycine receptor; o-NPOE, ortho-nitrophenyloctyether; ORCC, outwardly rectifying chloride channel; PVC, poly(vinyl chloride); TDMAC, tridodecylmethylammonium chloride; wtCFTR, wild-type CFTR.
Here we assume that we may treat anion entry into CFTR as a quasi equilibrium process, as implied in the Nernst-Planck interpretation of the permeability ratio (see materials and methods and discussion).
References
- Ackerman M.J., Wickman K.D., Clapham D.E. Hypotonicity activates a native chloride current in Xenopus oocytes. J. Gen. Physiol. 1994;103:153–179. doi: 10.1085/jgp.103.2.153. [DOI] [PMC free article] [PubMed] [Google Scholar]
- Ammann D. Ion-selective microelectrodesprinciples, design and application 1986. Springer-Verlag; New York: 70–73. pp. NY [Google Scholar]
- Andersen O.S. Perspectives on ion permeation. J. Gen. Physiol. 1999;113:763–764. doi: 10.1085/jgp.113.6.763. [DOI] [PMC free article] [PubMed] [Google Scholar]
- Andersen O.S., Koeppe R.E.D. Molecular determinants of channel function. Physiol. Rev. 1992;72:S89–S158. doi: 10.1152/physrev.1992.72.suppl_4.S89. [DOI] [PubMed] [Google Scholar]
- Anderson M.P., Gregory R.J., Thompson S., Souza D.W., Paul S., Mulligan R.C., Smith A.E., Welsh M.J. Demonstration that CFTR is a chloride channel by alteration of its anion selectivity. Science. 1991;253:202–205. doi: 10.1126/science.1712984. [DOI] [PubMed] [Google Scholar]
- Aqvist J., Warshel A. Energetics of ion permeation through membrane channels. Solvation of Na+ by gramicidin A. Biophys. J. 1989;56:171–182. doi: 10.1016/S0006-3495(89)82662-1. [DOI] [PMC free article] [PubMed] [Google Scholar]
- Armstrong C.M. Potassium pores of nerve and muscle membranes. In: Eisenman G., editor. MembranesLipid Bilayers and Antibiotics. Marcel Dekker; New York, NY: 1975. pp. 325–358. [PubMed] [Google Scholar]
- Armstrong, C.M. 1989. Reflections on selectivity. In Membrane Transport: People and Ideas. D.C. Tosteson, editor. American Physiological Association, Washington, DC. 261–273.
- Armstrong R.D., Horvai G. Properties of PVC based membranes used in ion-selective electrodes. Electrochimica Acta. 1990;35:1–7. [Google Scholar]
- Bell R.A., Christoph G.C., Fronczek F.R., Marsh R.E. The cation H1306+a short, symmetric hydrogen bond. Science. 1975;190:151–152. [Google Scholar]
- Bezanilla F., Armstrong C.M. Negative conductance caused by entry of sodium and cesium ions into the potassium channels of squid axons. J. Gen. Physiol. 1972;60:588–608. doi: 10.1085/jgp.60.5.588. [DOI] [PMC free article] [PubMed] [Google Scholar]
- Bockris J.O.M., Reddy A.K.N. Modern Electrochemistry. Vol. 1 1970. Plenum Publishing Corp; New York, NY: pp. 45–171 [Google Scholar]
- Bormann J., Hamill O.P., Sakmann B. Mechanism of anion permeation through channels gated by glycine and gamma-aminobutyric acid in mouse cultured spinal neurones. J. Physiol. 1987;385:243–286. doi: 10.1113/jphysiol.1987.sp016493. [DOI] [PMC free article] [PubMed] [Google Scholar]
- Born M. Volumen un hydrationwärme der ionen. Z. Phys. 1920;1:45–48. [Google Scholar]
- Büchner E.H., Voet A., Bruins E.M. Lyotrope zahlen und ioneneigenschaften. Proc. R. Acad. Amst. 1932;35:563–569. [Google Scholar]
- Buck R.P. The impedance method applied to the investigation of ion-selective electrodes. Ion-Selective Electrode Reviews. 1982;4:3–74. [Google Scholar]
- Buckingham A.D. A theory of ion-solvent interaction. Faraday Discuss. Chem. Soc. 1957;24:151–157. [Google Scholar]
- Dawson D.C., Smith S.S. Cystic fibrosis transmembrane conductance regulator. Permeant ions find the pore. J. Gen. Physiol. 1997;110:337–339. doi: 10.1085/jgp.110.4.337. [DOI] [PMC free article] [PubMed] [Google Scholar]
- Dawson D.C., Smith S.S., Mansoura M.K. CFTRmechanism of anion conduction. Physiol. Rev. 1999;79:S47–S75. doi: 10.1152/physrev.1999.79.1.S47. [DOI] [PubMed] [Google Scholar]
- Dietrich B., Hosseini M.W. Historical view on the development of anion coordination chemistry. In: Bianchi A., Bowman-James K., Garcia-Espana E., editors. Supramolecular Chemistry of Anions. John Wiley & Sons, Inc; New York, NY: 1997. pp. 45–62. [Google Scholar]
- Douglas B.E., McDaniel D.H., Alexander J.J. Concepts and models of inorganic chemistry 1994. John Wiley & Sons, Inc; New York, NY: pp. 798–799 [Google Scholar]
- Doyle D.A., Cabral J.M., Pfuetzner R.A., Kuo A., Gulbis J.M., Cohen S.L., Chait B.T., MacKinnon R. The structure of the potassium channelmolecular basis of K+ conduction and selectivity. Science. 1998;280:69–77. doi: 10.1126/science.280.5360.69. [DOI] [PubMed] [Google Scholar]
- Drumm M.L., Wilkinson D.J., Smit L.S., Worrell R.T., Strong T.V., Frizzell R.A., Dawson D.C., Collins F.S. Chloride conductance expressed by delta F508 and other mutant CFTRs in Xenopus oocytes. Science. 1991;254:1797–1799. doi: 10.1126/science.1722350. [DOI] [PubMed] [Google Scholar]
- Eisenman G. Cation selective glass electrodes and their mode of operation. Biophys. J. 1962;2:259–323. doi: 10.1016/s0006-3495(62)86959-8. [DOI] [PMC free article] [PubMed] [Google Scholar]
- Eisenman G., Horn R. Ionic selectivity revisitedthe role of kinetic and equilibrium processes in ion permeation through channels. J. Membr. Biol. 1983;76:197–225. doi: 10.1007/BF01870364. [DOI] [PubMed] [Google Scholar]
- Fahlke C., Yu H.T., Beck C.L., Rhodes T.H., George A.L., Jr. Pore-forming segments in voltage-gated chloride channels. Nature. 1997;390:529–532. doi: 10.1038/37391. [DOI] [PubMed] [Google Scholar]
- Finkelstein A., Cass A. Permeability and electrical properties of thin lipid membranes. J. Gen. Physiol. 1968;52:145–173. [PMC free article] [PubMed] [Google Scholar]
- Finkelstein, A., and A. Mauro. 1977. Physical principles and formalisms of electrical excitability. In Handbook of Physiology. The Nervous System. Cellular Biology of Neurons, American Physiological Society, Bethesda, MD. 161–213.
- Gilson M.K., Honig B. Calculation of the total electrostatic energy of a macromolecular systemsolvation energies, binding energies, and conformational analysis. Proteins. 1988;4:7–18. doi: 10.1002/prot.340040104. [DOI] [PubMed] [Google Scholar]
- Grunwald E. Thermodynamics of molecular species 1997. John Wiley & Sons, Inc; New York, NY: pp. 283–294 [Google Scholar]
- Gutman M., Tsfadia Y., Masad A., Nachliel E. Quantitation of physical-chemical properties of the aqueous phase inside the phoE ionic channel. Biochim. Biophys. Acta. 1992;1109:141–148. doi: 10.1016/0005-2736(92)90077-y. [DOI] [PubMed] [Google Scholar]
- Halm D.R. Identifying swelling-activated channels from ion selectivity patterns. J. Gen. Physiol. 1998;112:369–371. doi: 10.1085/jgp.112.3.369. [DOI] [PMC free article] [PubMed] [Google Scholar]
- Halm D.R., Frizzell R.A. Anion permeation in an apical membrane chloride channel of a secretory epithelial cell. J. Gen. Physiol. 1992;99:339–366. doi: 10.1085/jgp.99.3.339. [DOI] [PMC free article] [PubMed] [Google Scholar]
- Hille B. Ionic selectivity of Na and K channels of nerve membranes Eisenman G. MembranesLipid Bilayers and Biological Membranes—Dynamic Properties 1975. 255 323 Marcel Dekker, Inc; New York, NY: a [PubMed] [Google Scholar]
- Hille B. Ionic selectivity, saturation, and block in sodium channels. A four-barrier model J. Gen. Physiol. 66 1975. 535 560b [DOI] [PMC free article] [PubMed] [Google Scholar]
- Hofmeister F. Lehre von der wirkung der salze. Arch. Exp. Pathol. Pharmakol. 1888;24:247–260. [Google Scholar]
- Karshikoff A., Spassov V., Cowan S.W., Ladenstein R., Schirmer T. Electrostatic properties of two porin channels from Escherichia coli . J. Mol. Biol. 1994;240:372–384. doi: 10.1006/jmbi.1994.1451. [DOI] [PubMed] [Google Scholar]
- Kowdley G.C., Ackerman S.J., John J.E., III, Jones L.R., Moorman J.R. Hyperpolarization-activated chloride currents in Xenopus oocytes. J. Gen. Physiol. 1994;103:217–230. doi: 10.1085/jgp.103.2.217. [DOI] [PMC free article] [PubMed] [Google Scholar]
- Krasne S., Eisenman G. The molecular basis of ion selectivity. In: Eisenman G., editor. MembranesLipid Bilayers and Antibiotics. Marcel Dekker; New York, NY: 1973. pp. 277–328. [Google Scholar]
- Latimer W.M., Pitzer K.S., Slansky C.M. The free energy of hydration of gaseous ions, and the absolute potential of the normal calomel electrode. J. Chem. Phys. 1939;7:108–111. [Google Scholar]
- Levitt D.G. Modeling of ion channels. J. Gen. Physiol. 1999;113:789–794. doi: 10.1085/jgp.113.6.789. [DOI] [PMC free article] [PubMed] [Google Scholar]
- Lewis C.A., Stevens C.F. Acetylcholine receptor channel ionic selectivityions experience an aqueous environment. Proc. Natl. Acad. Sci. USA. 1983;80:6110–6113. doi: 10.1073/pnas.80.19.6110. [DOI] [PMC free article] [PubMed] [Google Scholar]
- Linsdell P., Hanrahan J.W. Adenosine triphosphate–dependent asymmetry of anion permeation in the cystic fibrosis transmembrane conductance regulator chloride channel. J. Gen. Physiol. 1998;111:601–614. doi: 10.1085/jgp.111.4.601. [DOI] [PMC free article] [PubMed] [Google Scholar]
- Linsdell P., Tabcharani J.A., Hanrahan J.W. Multi-ion mechanism for ion permeation and block in the cystic fibrosis transmembrane conductance regulator chloride channel J. Gen. Physiol. 110 1997. 365 377a [DOI] [PMC free article] [PubMed] [Google Scholar]
- Linsdell P., Tabcharani J.A., Rommens J.M., Hou Y.-X., Chang X.-B., Tsui L.-C., Riordan J.R., Hanrahan J.W. Permeability of wild-type and mutant cystic fibrosis transmembrane conductance regulator chloride channels to polyatomic anions J. Gen. Physiol. 110 1997. 355 364b [DOI] [PMC free article] [PubMed] [Google Scholar]
- Linsdell P., Zheng S.X., Hanrahan J.W. Non-pore lining amino acid side chains influence anion selectivity of the human CFTR Cl− channel expressed in mammalian cell lines. J. Physiol. 1998;512:1–16. doi: 10.1111/j.1469-7793.1998.001bf.x. [DOI] [PMC free article] [PubMed] [Google Scholar]
- Machaca K., Hartzell H.C. Asymmetrical distribution of Ca-activated Cl channels in Xenopus oocytes [published erratum appears in Biophys. J. 1998. 74:3313] Biophys. J. 1998;74:1286–1295. doi: 10.1016/S0006-3495(98)77842-7. [DOI] [PMC free article] [PubMed] [Google Scholar]
- Mansoura M.K., Dawson D.C. 2 barrier-1 site porean interactive spreadsheet model for two permeating ions. Comput. Biol. Med. 1998;28:255–273. doi: 10.1016/s0010-4825(98)00006-7. [DOI] [PubMed] [Google Scholar]
- Mansoura M.K., Smith S.S., Choi A.D., Richards N.W., Strong T.V., Drumm M.L., Collins F.S., Dawson D.C. CFTRanion binding as a probe of the pore. Biophys. J. 1998;74:1320–1332. doi: 10.1016/S0006-3495(98)77845-2. [DOI] [PMC free article] [PubMed] [Google Scholar]
- Marcus Y. A simple empirical model describing the thermodynamics of hydration of ions of widely varying charges, sizes, and shapes. Biophys. Chem. 1994;51:111–127. [Google Scholar]
- Marcus Y. Ion properties 1997. Marcel Dekker; New York, NY: pp. 56 [Google Scholar]
- Morf W.E. The principles of ion-selective electrodes and of membrane transport 1981. Elsevier Science Publishing Co. Inc; New York, NY: pp. 211–263 [Google Scholar]
- Moyer B.A., Bonnesen P.V. Physical factors in anion separations. In: Bianchi A., Bowman-James K., Garcia-Espana E., editors. Supramolecular Chemistry of Anions. John Wiley & Sons, Inc; New York, NY: 1997. pp. 1–44. [Google Scholar]
- Nonner W., Chen D.P., Eisenberg B. Progress and prospects in permeation. J. Gen. Physiol. 1999;113:773–782. doi: 10.1085/jgp.113.6.773. [DOI] [PMC free article] [PubMed] [Google Scholar]
- Overbeek J.T.G. The Donnan equilibrium. Prog. Biophys. 1956;6:58–83. [PubMed] [Google Scholar]
- Partenskii M.B., Dorman V., Jordan P.C. Influence of a channel-forming peptide on energy barriers to ion permeation, viewed from a continuum dielectric perspective. Biophys. J. 1994;67:1429–1438. doi: 10.1016/S0006-3495(94)80616-2. [DOI] [PMC free article] [PubMed] [Google Scholar]
- Sansom M.S., Breed J., Sankararamakrishnan R., Kerr I.D. Water dynamics in model transbilayer pores. Biochem. Soc. Trans. 1996;24:139S. doi: 10.1042/bst024139s. [DOI] [PubMed] [Google Scholar]
- Sansom M.S., Smith G.R., Adcock C., Biggin P.C. The dielectric properties of water within model transbilayer pores. Biophys. J. 1997;73:2404–2415. doi: 10.1016/S0006-3495(97)78269-9. [DOI] [PMC free article] [PubMed] [Google Scholar]
- Segel I.H. Enzyme kineticsbehavior and analysis of rapid-equilibrium and steady-state systems 1993. John Wiley & Sons, Inc; New York, NY: pp. 100–113 [Google Scholar]
- Sham Y.Y., Muegge I., Warshel A. The effect of protein relaxation on charge–charge interactions and dielectric constants of proteins. Biophys. J. 1998;74:1744–1753. doi: 10.1016/S0006-3495(98)77885-3. [DOI] [PMC free article] [PubMed] [Google Scholar]
- Sharp K.A., Honig B. Electrostatic interactions in macromoleculestheory and applications. Annu. Rev. Biophys. Biophys. Chem. 1990;19:301–332. doi: 10.1146/annurev.bb.19.060190.001505. [DOI] [PubMed] [Google Scholar]
- Sheppard D.N., Rich D.P., Ostedgaard L.S., Gregory R.J., Smith A.E., Welsh M.J. Mutations in CFTR associated with mild-disease-form Cl− channels with altered pore properties. Nature. 1993;362:160–164. doi: 10.1038/362160a0. [DOI] [PubMed] [Google Scholar]
- Smith S.S., Mansoura M.K., Schaefer J.A., Cooke C.R., Shariat-Madar Z., Sun F., Dawson D.C. The fifth putative transmembrane helix of CFTR contributes to the pore architecture Biophys. J. 72 1997. A365(Abstr.) [Google Scholar]
- Tabcharani J.A., Linsdell P., Hanrahan J.W. Halide permeation in wild-type and mutant cystic fibrosis transmembrane conductance regulator chloride channels. J. Gen. Physiol. 1997;110:341–354. doi: 10.1085/jgp.110.4.341. [DOI] [PMC free article] [PubMed] [Google Scholar]
- Tabcharani J.A., Rommens J.M., Hou Y.X., Chang X.B., Tsui L.C., Riordan J.R., Hanrahan J.W. Multi-ion pore behaviour in the CFTR chloride channel. Nature. 1993;366:79–82. doi: 10.1038/366079a0. [DOI] [PubMed] [Google Scholar]
- Teorell T. Transport processes and electrical phenomena in ionic membranes. Prog. Biophys. 1953;3:305–369. [Google Scholar]
- Urban B.W., Hladky S.B., Haydon D.A. Ion movements in gramicidin pores. An example of single-file transport. Biochim. Biophys. Acta. 1980;602:331–354. doi: 10.1016/0005-2736(80)90316-8. [DOI] [PubMed] [Google Scholar]
- Yim H.S., Kibbey C.E., Ma S.C., Kliza D.M., Liu D., Park S.B., Espadas Torre C., Meyerhoff M.E. Polymer membrane-based ion-, gas- and bio-selective potentiometric sensors. Biosens. Bioelectron. 1993;8:1–38. doi: 10.1016/0956-5663(93)80041-m. [DOI] [PubMed] [Google Scholar]