

Abstract
Expression of gp91-phox in Chinese hamster ovary (CHO91) cells is correlated with the presence of a voltage-gated H+ conductance. As one component of NADPH oxidase in neutrophils, gp91-phox is responsible for catalyzing the production of superoxide (O2·2). Suspensions of CHO91 cells exhibit arachidonate-activatable H+ fluxes (Henderson, L.M., G. Banting, and J.B. Chappell. 1995. J. Biol. Chem. 270:5909–5916) and we now characterize the electrical properties of the pathway. Voltage-gated currents were recorded from CHO91 cells using the whole-cell configuration of the patch-clamp technique under conditions designed to exclude a contribution from ions other than H+. As in other voltage-gated proton currents (Byerly, L., R. Meech, and W. Moody. 1984. J. Physiol. 351:199–216; DeCoursey, T.E., and V.V. Cherny. 1993. Biophys. J. 65:1590–1598), a lowered external pH (pHo) shifted activation to more positive voltages and caused the tail current reversal potential to shift in the manner predicted by the Nernst equation. The outward currents were also reversibly inhibited by 200 μM zinc. Voltage-gated currents were not present immediately upon perforating the cell membrane, but showed a progressive increase over the first 10–20 min of the recording period. This time course was consistent with a gradual shift in activation to more negative potentials as the pipette solution, pH 6.5, equilibrated with the cell contents (reported by Lucifer yellow included in the patch pipette). Use of the pH-sensitive dye 2′7′ bis-(2-carboxyethyl)-5(and 6) carboxyfluorescein (BCECF) suggested that the final intracellular pH (pHi) was ∼6.9, as though pHi was largely determined by endogenous cellular regulation. Arachidonate (20 μM) increased the amplitude of the currents by shifting activation to more negative voltages and by increasing the maximally available conductance. Changes in external Cl− concentration had no effect on either the time scale or the appearance of the currents. Examination of whole cell currents from cells expressing mutated versions of gp91-phox suggest that: (a) voltage as well as arachidonate sensitivity was retained by cells with only the NH2-terminal 230 amino acids, (b) histidine residues at positions 111, 115, and 119 on a putative membrane-spanning helical region of the protein contribute to H+ permeation, (c) histidine residues at positions 111 and 119 may contribute to voltage gating, (d) the histidine residue at position 115 is functionally important for H+ selectivity. Mechanisms of H+ permeation through gp91-phox include the possible protonation/deprotonation of His-115 as it is exposed alternatively to the interior and exterior faces of the cell membrane (see Starace, D.M., E. Stefani, and F. Bezanilla. 1997. Neuron. 19:1319–1327) and the transfer of protons across an “H-X-X-X-H-X-X-X-H” motif lining a conducting pore.
Keywords: voltage-gated H+ pathway, proton current, gp91-phox, NADPH oxidase, Zn2+
INTRODUCTION
Neutrophils generate superoxide (O2·2) during phagocytosis of opsonized bacteria, immune complexes, and other bodies (Edwards 1994; Henderson and Chappell 1996). Oxygen is reduced to O2·2 at the exterior of the cell, while H+ is liberated from NADPH at the cytoplasmic surface. It has been proposed (Henderson et al. 1987, Henderson et al. 1988a,Henderson et al. 1988b) that, to maintain the activity of the membrane-bound oxidase, there is an efflux of H+ through what are assumed to be H+-selective ion channels. This would not only prevent a substantial fall in intracellular pH (pHi), but also compensate for the separation of charge, which would otherwise generate a large positive membrane potential.
Analysis of genetic lesions in patients with chronic granulomatous disease (CGD)1 has facilitated the identification of the components of the phagocytic NADPH oxidase (phox). There is considerable evidence that one component, gp91-phox, a product of the X-linked CGD gene (Roos 1994; Royer-Pokora et al. 1986), acts as an H+-selective pathway. Not only do CGD cell lines in which gp91-phox is absent have a deficient H+ permeability, but suspensions of a Chinese hamster ovary (CHO) cell line expressing gp91-phox (CHO91 cells) show a marked H+ membrane flux in the presence of sodium arachidonate (Henderson et al. 1995).
A likely candidate for the H+-selective pathway is the voltage-gated H+ conductance first described in giant molluscan neurons (Thomas and Meech 1982) and subsequently reported in human neutrophils and other phagocytes including microglial cells and osteoclasts (DeCoursey and Cherny 1993; Demaurex et al., 1993; Kapus et al., 1993; Eder et al., 1995; Schrenzel et al. 1996). Its expression in microglial cells, osteoclasts, and HL60 cells is associated with the differentiation and expression of NADPH oxidase. This correlation between NADPH oxidase expression and the presence of voltage-gated H+ currents suggests that gp91-phox may form a voltage-gated H+ pathway in phagocytic cells. Here we report a positive correlation between the expression of human gp91-phox and the presence of a voltage-gated H+ current in a CHO cell line studied using the whole cell configuration of the patch clamp technique. Studies of cells containing mutated versions of gp91-phox suggest that its voltage sensitivity resides in the NH2-terminal 230 amino acids and that histidine residues at positions 111, 115, and 119 on a putative membrane-spanning helical region of the protein contribute to H+ permeation.
MATERIALS AND METHODS
Construction and Maintenance of CHO Cell Lines
The stable CHO cell line expressing the full-length gp91-phox (CHO91) was constructed and cultured as described previously (Henderson et al. 1995). In brief, it was constructed by transfecting CHO-K12 cells with the full-length cDNA for gp91-phox, placed behind the inducible human metalothionein IIa promoter (Reaves and Banting 1994; Henderson et al. 1995). In the studies presented here, expression was induced by incubating cells in 10 μM CdCl2 for 24 h before assay.
Whole Cell Recordings in CHO Cell Lines
Cells were studied in the whole cell configuration under conditions designed to maximize the amplitude of H+ currents present (see Byerly et al. 1984). The main aims were to exclude currents carried by ions other than H+ and to acidify the cell contents to shift activation of the H+ conductance towards experimentally accessible membrane potentials. The patch pipette filling solution contained 119 mM tetramethylammonium (TMA) hydroxide, to block potassium currents, a small quantity of calcium buffer (3.7 mM EGTA, 0.74 mM CaCl2) and was adjusted to pH 6.5 with Mes so that its final concentration was ∼120 mM. Pipettes had a resistance of 2.5–4 MΩ and the seal resistance was in the order of 1–3 GΩ at the outset. Cells were bathed in a saline that contained 110 mM TMA methane-sulphonate, 2 mM Ca(OH)2, 2 mM Mg(OH)2, 5 mM glucose, and 100 mM pH buffer. The pH was adjusted to 8.0 or 7.5 with N-[2-hydroxyethyl]-piperazine-N′-[3-propane-sulphonic acid] (EPPS) or 7.0 with HEPES. Other recordings were made from cells bathed in 120 mM NaCl, 10 mM KCl, 1 mM MgCl2, 1 mM CaCl2, 50 mM HEPES, 1 mM NaH2PO4, 5 mM glucose, pH 8.0. Cells were superfused with up to seven different solutions using an in-house superfusion system (Langton 1993). Except where indicated, low amplitude prepulses in the linear current–voltage range (−60 to −100 mV) were scaled by PCLAMP 6 software (Axon Instruments) and used for online subtraction of linear capacitive and leakage currents (Armstrong and Bezanilla 1974).
Equilibration of Pipette Filling Solution with Cell Cytoplasm
To produce a transient 1-U change in the pH of cell cytoplasm, it is necessary to inject at least 10 mmol H+/liter (Thomas 1976; Meech and Thomas 1980); to hold pHi at a steady level, it is necessary to overcome membrane-bound regulatory mechanisms as well as a complex system of endogenous fixed and mobile pH buffers. Here, CHO cells were studied in the whole cell configuration under conditions designed to exclude currents carried by ions other than H+. The bathing solution was Na+ free and contained no added HCO3 − so that known mechanisms of proton exchange in the plasma membrane should be inactive. Nevertheless, we were uncertain as to the effect on the cell cytoplasm of its coming into contact with a patch pipette filled with pH buffer. In experiments on squid axons, the intra-axonal pH was controlled by a perfusion solution containing 45 mM buffer (Wanke et al. 1979), but much of the axoplasm had been removed by enzymatic digestion. In intact molluscan neurons dialyzed against the contents of a macropipette, buffer concentrations as high as 120 mM were inadequate to control pHi if the pipette diameter was less than one third of the cell diameter (Byerly and Moody 1986). In the work reported here, 25-μm-diameter CHO cells were dialyzed against 2-μm-diameter patch pipettes and it was necessary to establish the time course of the exchange between pipette and cell and the effect on pHi.
The time taken for the pipette filling solution to equilibrate with the cell cytoplasm was assessed using a confocal optical scanning microscope (MRC 600; Bio-Rad Laboratories). Because the microscope collects emitted fluorescent light only from within the plane of focus of the objective lens, it performs noninvasive optical sectioning (Shotton and White 1989). Patch pipettes were filled with the inert fluorescent dye, Lucifer yellow (500 μM; Molecular Probes, Inc.), and seals formed to CHO91 cells mounted on the microscope stage. Images focused midway through the cell (excitation at 488 nm; Kalman average of three scans), were collected before perforation of the cell membrane and at 60-s intervals in the whole cell configuration. Images showing the fluorescence of the pipette contents were taken at the end of the experiment by adjusting the focal plane of the microscope. Average fluorescence intensities of regions of interest were obtained using COMOS software (Bio-Rad Laboratories).
Calibration of pHi
Confocal images were collected as above with the pH sensitive fluorescent probe, 2′,7′-bis(2-carboxyethyl)-5(6)-carboxyfluorescein (BCECF; 50 μM) in place of Lucifer yellow. Images of patch pipettes filled with 50 μM BCECF dissolved in pH 6.1, 6.5, and 7.0 pipette solutions were used to calibrate the BCECF fluorescence intensity.
Expression and Cellular Localization of Mutated gp91-phox
NH2-terminal mutants of gp91-phox were constructed with three tandem copies of the hemagglutinin (HA) epitope on the COOH terminal of the protein (Henderson et al. 1997; Henderson 1998). CHO cell lines were cultured on glass coverslips and treated with 10 μM Cd2+ 24 h before immunostaining to induce expression of the protein. The cells were fixed (4% formaldehyde, 10 min) and permeabilized (0.2% Triton X-100) before staining with anti–HA epitope monoclonal antibody (1 h). Cells were incubated with FITC-labeled anti–mouse (1 h) and imaged on a confocal microscope.
RESULTS
In the work reported here, 25-μm-diameter CHO cells were dialyzed against 2-μm-diameter patch pipettes. In view of the difficulty in controlling pHi (see materials and methods) preliminary experiments were designed to (a) establish the time course of the exchange between pipette and cell, and (b) determine the final level of pHi.
Control of Intracellular pH
The time course of the exchange between the contents of a small cell and the contents of a patch pipette in the whole cell configuration has been studied both experimentally (Pusch and Neher 1988) and theoretically (Oliva et al. 1988; Mathias et al. 1990). If the contents of both pipette and cell remain homogenous, exchange at the pipette tip is rate limiting. Other influential factors are the cell volume and the size of the diffusing molecule (see materials and methods). In Fig. 1, a patch pipette filled with Lucifer yellow was used to record from a 25-μm-diameter CHO91 cell in the whole cell configuration. Although the intensity of the cytoplasm was undetectable 60 s after perforation of the cell membrane, fluorescence increased rapidly over the first 10 min (Fig. 1 A). Measurement of the average fluorescence within the boundary of the cell membrane showed an increase that followed an approximately exponential time course with a time constant of 150 s (Fig. 1 B). This is consistent with the findings of Pusch and Neher 1988, who found that molecules the size of Lucifer yellow (∼600 D) should transfer though a 5-MΩ patch pipette to the cytoplasm of a 25-μm-diameter cell with a time constant of between 85 and 169 s. A comparison between the maximum intensity of the cell (mean 136, n = 3) and the fluorescence of the pipette (mean 133, n = 3) showed that the dye was evenly distributed between cell and pipette (Fig. 1 C). There was no change in cytoplasmic fluorescence intensity if the cell membrane remained intact (not shown).
Figure 1.
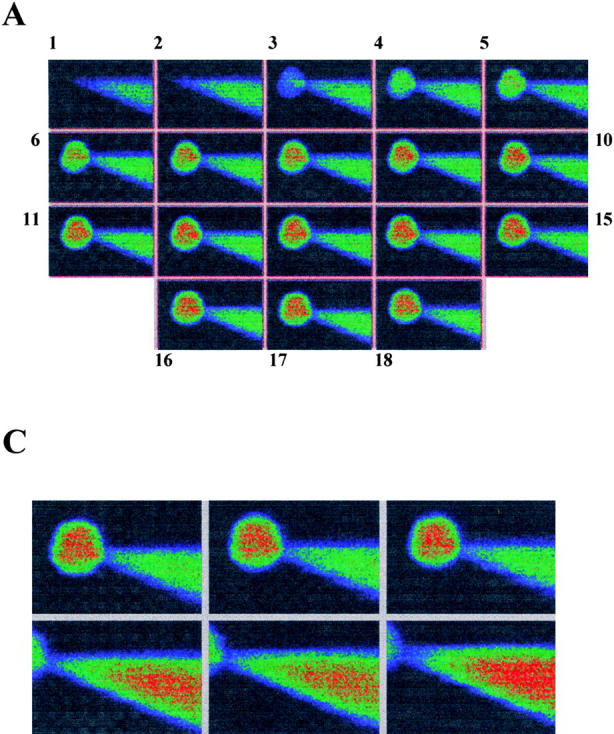

Equilibration of a pipette containing Lucifer yellow with cell cytoplasm. (A) Confocal images (Kalman average, n = 3) of CHO91-expressing cell collected before (image 1) and at 60-s (images 2–10), 2-min (images 11–15), and 5-min (images 16–18) intervals after onset of whole cell recording. Pipette solution: 500 μM Lucifer yellow, 119 mM TMA hydroxide, 3.7 mM EGTA, 0.74 mM CaCl2 adjusted to pH 6.5 with Mes so that its final concentration was ∼120 mM. External solution: 110 mM TMA methane-sulphonate, 2 mM Ca(OH)2, 2 mM Mg(OH)2, 5 mM glucose, 100 mM EPPS, pH 8. Holding potential, −60 mV; bath temperature, 21–23°C; cell diameter, 25 μm. (B) Average florescence intensity of cell contents at different time intervals after perforation of the cell membrane. (C). Confocal images within the focal plane of the cell (top) and pipette (bottom). Average fluorescence intensity of cell, 136 U; average fluorescence intensity of pipette, 133 U. Images shown are at three different positions for both cell and pipette. A pseudo-color scale in which high intensity is denoted by red through orange, yellow, and green to blue, which corresponds to low fluorescence, is used to represent the fluorescence intensity in the images.
To examine the time course of the change in pHi, we used patch pipettes filled with the pH indicator BCECF buffered with 120 mM pH buffer (Mes). The molecular weight of BCECF (520) is similar to Lucifer yellow, while Mes (213 D) is somewhat smaller and should equilibrate with the cell more rapidly than the dye. The emitted fluorescence intensity of BCECF decreases with decreasing pH and so the cytoplasm should register only a small overall increase in fluorescence if its pH followed that of the pipette solution (pH 6.2). Fig. 2A and Fig. B, shows that the time course of the fluorescence increase was similar to that for Lucifer yellow, fluorescence reaching a maximum in 15–20 min. However, unlike Lucifer yellow, the fluorescence intensity of the cell and the pipette were not equal once the system had reached a steady state (Fig. 2 C) and remained different even after 60 min in the whole-cell configuration. The average fluorescence intensity of six cells (after 20 min in the whole cell configuration) was 163 U compared with 91 U for the pipette contents. Assuming that BCECF, like Lucifer yellow, was equally distributed between cell and pipette, and also that there was no interaction between BCECF and the cytoplasm, the inequality of fluorescence must arise from a difference in pH between the pipette solution and the cell contents. From the calibration curve (Fig. 2 D), the average value for pHi was near 6.9. As this was significantly different to the pipette solution (buffered to pH 6.2), it seemed that pHi was largely determined by endogenous cellular regulation. Nevertheless, the level of acidification achieved by using pipettes filled with 120 mM pH buffer was sufficient for the purposes of the present experiments. In control cells loaded with BCECF, pHi at rest is estimated to be 7.2 (Henderson et al., 1995).
Figure 2.

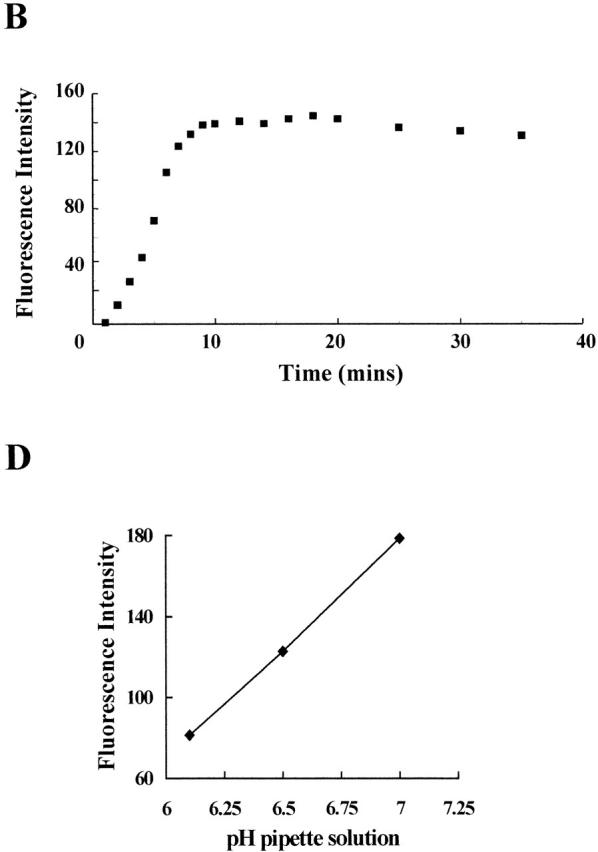
Effect of 120 mM pH buffer on intracellular pH. (A) Confocal images (Kalman average, n = 3) of CHO91 cell collected before (image 1) and at 60-second (images 2–10), 2-min (images 11–15), and 5-min (images 16–18) intervals after onset of whole cell recording. Pipette solution: 50 μM BCECF, 119 mM TMA hydroxide, 3.7 mM EGTA, 0.74 mM CaCl2 adjusted to pH 6.2 with Mes so that its final concentration was ∼120 mM. External solution: 110 mM TMA methane-sulphonate, 2 mM Ca(OH)2, 2 mM Mg(OH)2, 5 mM glucose, 100 mM EPPS, pH 8. Holding potential, −60 mV; bath temperature, 21–23°C; cell diameter, 25 μm. (B) Average florescence intensity of the cell contents at different time intervals after perforation of the cell membrane. (C) Confocal images (Kalman average, n = 3) within the focal plane of the cell (left) and pipette (right), obtained 50 min after achieving whole cell configuration. Average fluorescence intensity of six cells, 162; average fluorescence intensity of six pipettes, pH 6.2, 91. (D). Fluorescence intensity of BCECF calibrated by acquiring images of patch pipettes filled with 50 μM BCECF buffered to pH 6.1, 6.5, and 7.0. Abscissa, pH of pipette solution; ordinate, average pipette fluorescence intensity. A pseudo-color scale in which high intensity is denoted by red through orange, yellow, and green to blue, which corresponds to low fluorescence, is used to represent the fluorescence intensity in the images.
Whole Cell Currents in CHO and CHO91 Cells
In previous experiments, suspensions of CHO91 cells have been used to demonstrate that gp91-phox functions as an H+ pathway when activated by sodium arachidonate (Henderson et al. 1995). To determine whether the gp91-phox pathway was voltage gated, we recorded membrane currents from CHO91 cells using the whole cell configuration of the patch-clamp technique. There are low levels of arachidonate-activated H+ conduction in both untransfected CHO cells and transfected but uninduced (i.e., nonexpressing) CHO91 cells (Henderson et al. 1995) but, in keeping with the report by Cherny et al. 1996, any voltage-gated H+ currents present were within the noise level of our recordings. Fig. 3 A shows data from a typical untransfected CHO cell bathed in pH 8.0 saline, under conditions designed to exclude currents other than those carried by H+. The cell was depolarized by a series of voltage commands, as shown in the protocol at top. In this and the four other untransfected cells tested, the whole-cell currents were all within the noise levels shown. Similar records were obtained for nonexpressing CHO91 cells under the same conditions (n = 6). Fig. 3 B shows a typical example.
Figure 3.
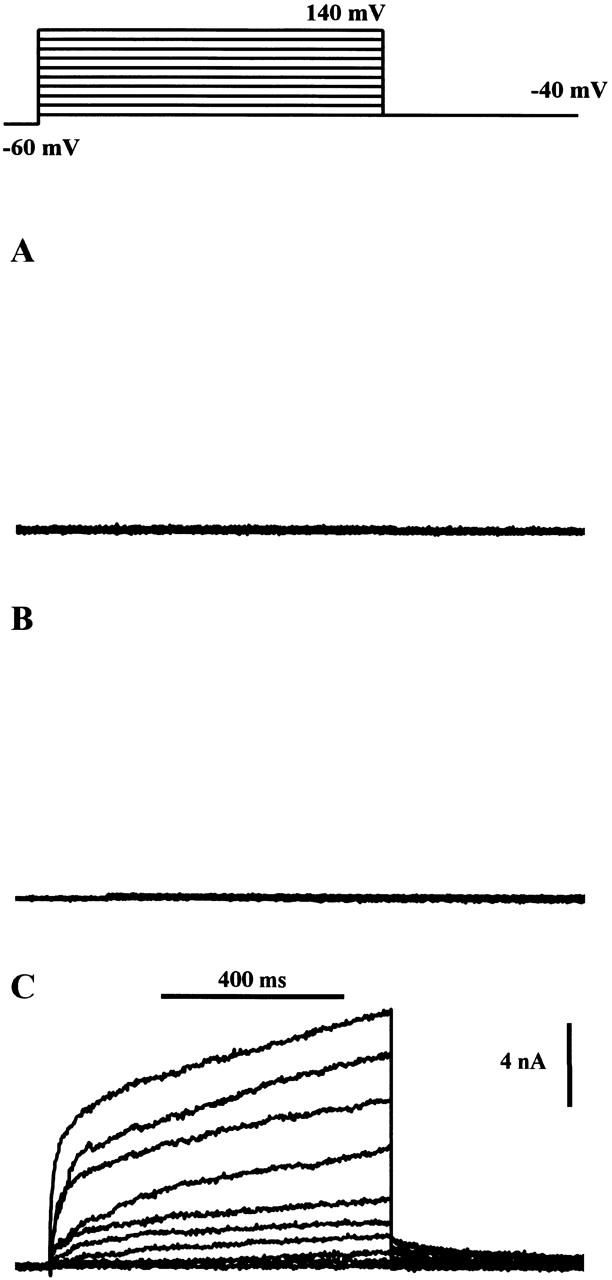
Ion currents recorded from CHO cells under whole cell voltage clamp. Superimposed currents recorded in response to a standard stepped-voltage protocol as indicated at the top of the figure; commands in the range −40 to 140 mV in 20-mV intervals. Pipette solution: 119 mM TMA hydroxide, 3.7 mM EGTA, 0.74 mM CaCl2 adjusted to pH 6.5 with Mes so that its final concentration was ∼120 mM. External solution: 110 mM TMA methane-sulphonate, 2 mM Ca(OH)2, 2 mM Mg(OH)2, 5 mM glucose, 100 mM EPPS, pH 8. Holding potential, −60 mV; bath temperature, 21°C. (A) Untransfected CHO cell, (B) uninduced (i.e., nonexpressing) CHO91 cell, (C) gp91-phox–expressing CHO91 cell.
Under identical conditions, CHO91 cells expressing full-length gp91-phox generated large time- and voltage-dependent currents. The outward currents were not recorded immediately upon going whole cell, but increased with time, reaching a maximum after 10–25 min. This is in good agreement with the time course of exchange between the cell and the patch pipette shown in Fig. 1 and Fig. 2 and suggests that the amplitude of the current was not just a property of the transfected cells, but depended on the degree of acidification of the cell cytoplasm. This was confirmed by experiments in which the pipette contents were buffered to pH 7.5 with EPPS buffer (not shown). In this case, there was no change in the whole cell current during a prolonged period of recording.
Small differences in the expression of gp91-phox may explain the observed variation in current amplitude, but there were also differences in time course. Fig. 3 C shows a cell in which the current steadily increases throughout each 800 ms command step, while in Fig. 6 A the currents rapidly achieve a steady level. In a population of cells with a steadily rising outward current, the mean amplitude after 800 ms at +80 mV was 3.4 nA (n = 9; SD 1.1 nA; range 1.7–4.6 nA); in a population of cells with steady outward currents the mean amplitude at +80 mV was 4.2 nA (n = 9; SD 2.1 nA; range 1.5–7.0 nA). Voltage-gated proton currents in other cell types show similar steadily increasing currents, but at present only a tentative explanation can be put forward to account for them; it is possible that during prolonged depolarizing commands negatively charged buffer molecules contribute to the pipette current by leaving the cytoplasm. The resulting acidification at the membrane near the pipette tip will produce a progressive, local shift in activation towards more negative membrane potentials. The currents were sustained during command pulses of 2 s and showed no inactivation (not shown), which is another characteristic of voltage-gated proton currents.
Figure 6.

Effect of external pH on tail current amplitude and reversal potential. Depolarizing commands having elicited an outward current, the membrane was repolarized, and time-dependent tail currents were recorded. Current records from three different cells are shown in A–C. Capacitive transients (which lasted 1–2 ms) were blanked from each record. Pipette solutions as for Fig. 3. (A) External bathing solution was set at pH 8.0. Depolarizing command, 0 mV. During successive trials, the repolarizing command was in the range −40 to −100 mV. Currents are shown superimposed; average of four trials; holding potential −60 mV. (B) External bathing solution was set at pH 7.5. Depolarizing command, 80 mV; membrane repolarized in the range −40 to −100 mV. Superimposed traces from single trial; holding potential −60 mV. (C) External bathing solution was set at pH 7.0. Depolarizing command, 120 mV; membrane repolarized in the range 0 to −60 mV. Superimposed traces are an average of three trials; holding potential −60 mV. (D) Abscissa, membrane potential during repolarizing command; ordinate, tail current amplitude measured between the end of the capacitive transient (1–2 ms) and a steady level 200 ms later; bath solutions, pH 8.0 (□), 7.5 (○) and 7.0 (▵). Lines through data were drawn according to a constant field equation (Goldman 1943; Hodgkin and Katz 1949) with pHi taken as 6.9. H+ permeability chosen to fit pHo 8 data; pHo 7.5 and 7 data scaled up by factors of 3.5 and 7.5. Filled symbols represent data from other cells in the same external solutions: pH 8.0 (▪), scaling factor, 1; pH 7.5 (•), scaling factor, 3.5; pH 7.0 (▴), scaling factor, 11. Bath temperature 21–23°C.
Activation by Sodium Arachidonate
The H+ pathway associated with NADPH oxidase (Henderson and Chappell 1992), like that of gp91-phox (Henderson et al. 1995) and the voltage-gated H+ pathway in human neutrophils (DeCoursey and Cherny 1993), is activated by low levels of sodium arachidonate. Fig. 4 shows a similar effect on the voltage-gated currents observed in CHO91 cells. Currents elicited by control commands to 20, 40, and 100 mV are shown as solid lines (Fig. 4 A), whereas those recorded during the application of 20 μM sodium arachidonate are shown as data points. The scale on the right refers to the test data; the control currents having been increased to match. The scaling factors were 2 (20 mV), 1.24 (60 mV), and 1.4 (100 mV). Thus, although sodium arachidonate produced a significant increase in the amplitude of the voltage-gated currents, the time course of activation remained quite unaffected. The effect on current amplitude was rapidly reversible (not shown).
Figure 4.
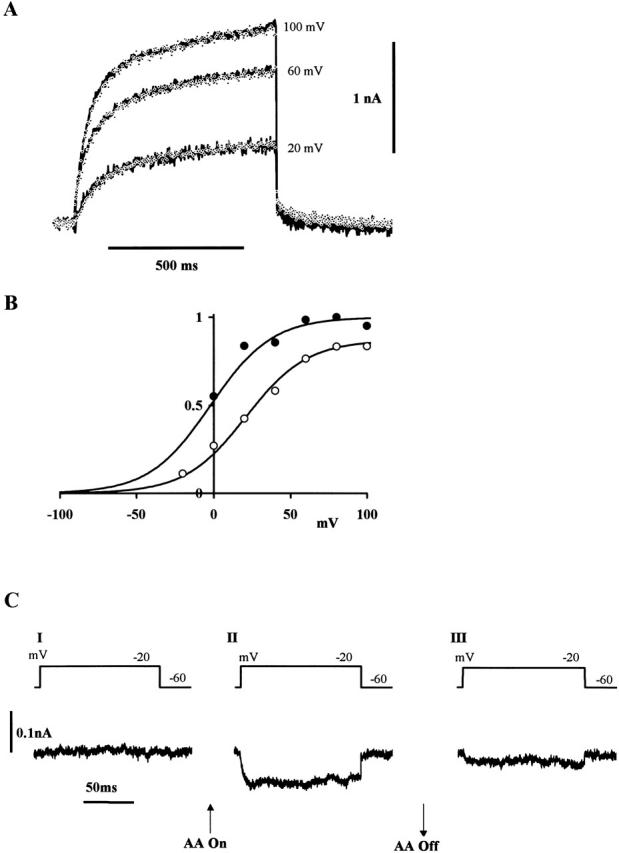
Effect of 20 μM sodium arachidonate. (A) Superimposed outward currents elicited by command pulses to +20, +60, +100 mV before (solid lines) and in the presence of (data points) 20 μM sodium arachidonate; other solution constituents as for Fig. 3. Scale bar refers to the test data; the control currents having been scaled up. The scaling factors were 2 (20 mV), 1.24 (60 mV), and 1.4 (100 mV). Command pulses in 20-s intervals. Holding potential, −60 mV; potential during tail current, −40 mV. (B) Voltage dependence of activation of the outward current. Abscissa, command potential; ordinate, normalized membrane conductance at end of 750-ms command pulse before (○) and in presence of (•) sodium arachidonate. Tail current reversal potential taken as −55 mV. The lines fitted to the experimental results were calculated from the equation: G H = G H,max/{1 + exp[(V1/2 − Vm)/20 mV]}, where G H,max is the maximum chord conductance and V1/2 is the potential at which G H is 0.5 G H,max. For sodium arachidonate, V1/2, −2 mV; G H,max, normalized to 1. For control, V1/2, 21 mV; G H,max, 0.83. (C) Inward current elicited from CHO91 cells by a series of command pulses to −20 mV in a bath solution of 110 mM TMA methane-sulphonate, 2 mM Ca(OH)2, 2 mM Mg(OH)2, 5 mM glucose, 100 mM HEPES, pH 6.8, recorded before (I), in the presence of 20 μM arachidonate (II), and after arachidonate (III). Currents were recorded immediately upon obtaining whole cell configuration, before equilibration of cytosol and pipette solution so that pHi was higher than pHo. Holding potential, −60 mV; command pulses in 5-s intervals; bath temperature, 21–23°C.
As shown in Fig. 4 B, sodium arachidonate appeared to shift the voltage dependence of activation towards more negative membrane potentials. The membrane conductance at the end of each command pulse was calculated assuming −55 mV for the equilibrium potential (see later for tail current reversal potential) and the maximum value normalized to 1. The Boltzmann curve (solid line) fitted to the data obtained in 20 μM sodium arachidonate (Fig. 4 B, •) has a slope factor of 20 mV with half-activation (V1/2) at −2 mV. The control data (Fig. 4 B, ○) when normalized to the same maximum value were described by a second Boltzmann curve with the same slope factor and a V1/2 of 21 mV. The maximum conductance in the control was 0.87× that found in the presence of sodium arachidonate. It appears that the effect of arachidonate is both to increase the maximum conductance available and shift the activation curve to more negative values.
The shift of the activation curve to more negative voltages in the presence of arachidonate as shown in Fig. 4 B (see also DeCoursey and Cherny 1993) should permit activation of proton currents at membrane voltages more negative than the H+ equilibrium potential (EH) and make it possible to observe them flowing inward across the activated pathway. To test this, membrane currents were recorded in pHo 6.8 bathing solution before the equilibration of cytosol and pipette solution. Under these conditions, pHi would be higher than pHo. Currents in response to a series of depolarizing command pulses to −20 mV are shown in Fig. 4 C. A sustained inward current was recorded from the cell perfused with 20 μM arachidonate that was not observed in its absence and was reversible upon its removal (n = 3). As in suspensions of CHO91 cells (see Henderson and Chappell 1992), the direction of H+ flux through the NADPH oxidase-associated H+ pathway in the presence of arachidonate is either inward, if the pHo is less than the pHi, or outward, if the pHo is greater than the pHi.
Inhibition by Zn2+
As originally described in snail neurons, voltage-dependent H+ currents are inhibited in a readily reversible manner by 1 mM Cd2+, Zn2+, Ni2+, and other divalent ions (Thomas and Meech 1982; Byerly and Suen 1989; Mahaut-Smith 1989). In human neutrophils, low concentrations of Zn2+ reversibly inhibit both the arachidonate-activated (Henderson et al. 1987, 1988) and voltage-gated (100 μM Zn2+; DeCoursey and Cherny 1993) H+ pathways. Zn2+ also reversibly inhibited the gp91-phox–mediated pathway in CHO91 cells. Fig. 5 A shows the amplitude and time course of membrane currents before and after addition of 200 μM Zn2+ to the bathing solution. The outward current was significantly reduced in the presence of Zn2+ and showed partial recovery when examined after washing. Fig. 5 B shows the time course of the effect. A series of depolarizing command pulses was used to monitor the outward current. At the point shown, the normal bathing solution was replaced by one containing 200 μM Zn2+. The pronounced inhibition of the large time- and voltage-dependent outward current recovered rapidly once the perfusion solution was returned to the Zn2+-free control solution.
Figure 5.

Effect of 200 μM Zn2+. Superimposed outward currents (bottom) elicited by a series of command pulses to +100 mV (top) in the presence of 200 μM Zn2+ at pH 8; other solution constituents as for Fig. 3. Command pulses in 5-s intervals. Record shown is an average of five trials. Controls before Zn2+ exposure (average of three trials) and after (average of seven trials) are also shown. (B) Time course of the Zn2+ effect. Abscissa, time of trial; ordinate, peak outward current; holding potential, −60 mV.
Outward Current at Different External pH
Studies on preparations as different as snail neurons and human neutrophils have shown that the voltage dependence of the H+ conductance is shifted to more negative potentials by low pHi and high pHo (Byerly et al. 1984; DeCoursey and Cherny 1996). The amplitude of the time- and voltage-dependent currents recorded from CHO91 cells also depended on the pH of both the bathing and pipette solutions. At pHo 8.0, there was a significant outward current with depolarizing commands to values as negative as −20 mV (see Fig. 3 and Fig. 4), while at pHo 7.0 time-dependent currents were generally absent at commands below 0 mV.
Reversal Potential of the Tail Currents
In Fig. 3 and Fig. 4, the time-dependent outward currents were rapidly deactivated after each command step, and this was seen as an outward “tail” when the cell was repolarized to −40 mV. To establish whether H+ was the charge-carrying species, tail currents were measured in different external solutions and their reversal potential was determined. For this series of experiments, the pipette solution was buffered to pH 6.5. For Fig. 6 A, pHo was set to 8.0 and the cell was depolarized to 0 mV to activate the outward conductance. Repolarization to −100 and −80 mV resulted in a marked inward tail current, but with the potential at −60 mV the current was clearly outward. When repolarized to –40 mV, some deactivation was evident, but there was also a small maintained outward current (as predicted by the activation curve, Fig. 4 B). Note that measurements at potentials more positive than approximately −40 mV were precluded because of the voltage activation range of the pathway. The decline in tail current measured over 200 ms was plotted against potential in Fig. 6 D (□).
When trials were repeated with cells bathed in pH 7.5 saline, inward tail currents were observed not only at −100 and −80 mV, but also at −60 and −40 mV, and so it was clear that the reversal potential had moved in the positive direction (see Fig. 6 B). As before, the decline in tail current was measured over 200 ms and plotted against potential in Fig. 6 D (○). CHO91 cells in pH 7.0 buffered saline generally had a high leakage conductance after 30 min recording and their time-dependent currents were small so that it was necessary to depolarize the cell to 120 mV for significant outward current. Activation was markedly slower in this solution. The decline in tail current amplitude was measured as before and plotted as in Fig. 6 D (▵). In both pH 7.5 and 7 solutions, it was not possible to generate outward tail currents because of the voltage-activation range of the pathway. A large decrease in the rate of activation with acidification of the external medium has been reported previously (see Figure 5 B3 in Byerly et al., 1984).
In Fig. 6 D, the lines through the data were drawn according to a constant field equation (Goldman 1943; Hodgkin and Katz 1949) with pHi taken as 6.9. The H+ permeability was chosen to fit the pHo 8 data; with the pHo 7.5 and 7 data scaled up by factors of 3.5 and 7.5. Filled symbols represent data from other cells in the same external solutions: pH 8.0 (▪), scaling factor, 1; pH 7.5 (•), scaling factor, 3.5; pH 7.0 (▴), scaling factor, 11. The reversal potential in each solution was estimated by simple extrapolation and in pHo8 solution its mean ± SD was −55 ± 6 mV (n = 18). In pHo 7.5 solution, the average reversal potential was −20 ± 3 mV (n = 9) and, in pHo 7 solution, it was 1 ± 5 mV (n = 6). The good correspondence between this data and the 58 mV change/pH unit predicted by the Nernst equation confirms that H+ (or an H+ equivalent) is the probable conducting species. Chloride ions are unlikely to make a contribution because neither the amplitude of the outward current nor the tail current reversal potential was affected by bathing solutions containing different concentrations of chloride (0, 1, 2, 4, and 120 mM; not shown). However the Goldman-Hodgkin-Katz equation predicts larger inward currents as the pH of the bathing solution is made progressively more acid. In practice, because of the shift in the activation curve, the currents were significantly smaller in acid bathing solution and increasing degrees of scaling were necessary to fit the data.
Whole Cell Currents in Mutated gp91-phox
A number of CHO cell lines have been constructed that express mutated forms of gp91-phox (Henderson et al. 1997; Henderson 1998). Suspensions of the cell line CHO-N, which expresses only the NH2-terminal 230 amino acids, exhibit a fully functioning arachidonate-activated H+ flux, but this flux is absent in CHO-N3Leu, a cell line that express the same NH2-terminal region with leucine in place of the three histidine residues in positions 111, 115, and 119. The flux is also greatly reduced in cells with a single histidine residue, 115, mutated to leucine (cell line CHO-NLeu; Henderson 1998). Examination of whole-cell currents from cells containing the mutated versions of gp91-phox suggests that voltage as well as arachidonate sensitivity is retained by cells with only the NH2-terminal amino acids. Furthermore, the three histidine residues, 111, 115, and 119, are functionally important for H+ permeation.
The whole-cell current traces in Fig. 7 A show that in transfected but not induced CHO-N cells, as in CHO91 cells under similar conditions, any voltage-gated current present is concealed within the noise level of the recording. Fig. 7 A shows data (typical of six observations) from a single cell bathed in pH 8.0 saline and depolarized by a series of voltage commands (see inset at top of figure). CHO-N cells induced to express the NH2 terminus, generated large time- and voltage-dependent currents (Fig. 7 B) in response to depolarizing voltage commands in the range 0 to +120 mV. Just as for CHO91 cells, the outward currents were not recorded immediately upon going whole cell, but increased progressively over a 10–25-min period (n = 10). The mean current amplitude at the end of a 400-ms command to +80 mV was 2.3 nA (±0.53 nA; n = 9).
Figure 7.

Ion currents recorded from CHO cell lines expressing mutated gp91-phox. Superimposed currents recorded in response to a standard stepped-voltage protocol (shown in inset); commands in the range −40 to 140 mV in 20-mV intervals. Pipette solution: 119 mM TMA, 3.7 mM EGTA, 0.74 mM CaCl2, adjusted to pH 6.5 with Mes so that its final concentration was ∼120 mM. External solution: 110 mM TMA methane-sulphonate, 2 mM Ca(OH)2, 2 mM Mg(OH)2, 5 mM glucose, 100 mM EPPS, pH 8. Holding potential, −60 mV; bath temperature, 21°C. (A) Uninduced (i.e., nonexpressing) CHO-N cell, (B) CHO-N–expressing NH2-terminal gp91-phox, (C) NH2-terminal gp91-phox with histidine 115 mutated to leucine, (D) NH2-terminal gp91-phox with histidines 111, 115, and 119 all mutated to leucine. Time scale in B refers also to A; time scale in D refers also to C.
Outward currents from CHO-NLeu–expressing cells, like those from CHO-N cells, became activated by depolarizing commands to potentials in the range 0 to +120 mV, but they were of a reduced amplitude and slower rise time (Fig. 7 C). In these cells, the mean current amplitude at the end of a 400-ms command to +80 mV was 0.61 nA (±0.4 nA; n = 6).
In CHO-N3Leu–expressing cells, the outward currents had an even lower amplitude (see Fig. 7 D, which shows a cell with the largest outward currents) in part because activation was shifted to more positive voltages; in most cases, little or no current was observed at potentials more negative than +80 mV. At this voltage, the mean current amplitude at the end of a 400-ms command was <0.01 nA (n = 6); at +140 mV, the mean current was ∼0.3 nA.
The tail currents recorded at −40 mV from both CHO-NLeu and CHO-N3Leu cells, in pH 8.0 bathing solution, were inwardly directed, unlike those recorded from CHO- (Fig. 6) and CHO-N–expressing (Fig. 7 B) cells, which were outward. In CHO-N3 cells, the mean reversal potential was 23 mV (±9 mV; n = 3). This apparent shift in tail reversal potential suggests an alteration in the selectivity of the conducting pathway when histidine 115 was replaced by leucine.
From the fluorescence intensity of immunostained cells, we were able to compare levels of expression in different mutated forms of gp91-phox. The cDNA constructs have three tandem repeats of the hemagglutinin epitope attached to their COOH-terminal ends. In Fig. 8, confocal images of Cd2+ induced CHO-N (A and B) and CHO-N3Leu (D and E) cells immunostained with antihemaglutinin antibody gave an annular pattern of fluorescence that was not observed in uninduced cells (C and F). This pattern of staining implies that the antigen is not only expressed, but that it is located at or in the plasma membrane and it is similar to that already observed in CHO cells expressing full-length gp91-phox (Henderson et al. 1995). The levels of staining do not differ greatly; expression in CHO-N3Leu being slightly greater than that in CHO-N.
Figure 8.

Expression of mutated gp91-phox in CHO-N and CHO-N3Leu cells. Confocal images of Cd2+-induced CHO-N cells (A and B) and CHO-N3Leu cells (D and E), immunostained with anti-hemagglutinin antibody. The levels of staining are similar in each case. The annular pattern of fluorescence was not observed in uninduced cells used as a control (C and F). Cell diameter, 20–25 μm. The fluorescence intensity is represented by a grey scale, with white being high and black low.
DISCUSSION
Voltage-gated H+ Conductance
In this paper, we conclude that gp91-phox, the product of the X-linked CGD gene and component of the phagocytic NADPH oxidase, functions as a voltage-dependent H+ conductance. Transfected CHO cells expressing gp91-phox exhibit large time- and voltage-dependent outward currents not present in untransfected or nonexpressing cells (see Fig. 3). The currents were observed under conditions that minimized a contribution from the smaller ions normally present in physiological saline. The main cation present both internally and externally was tetramethylammonium ion, while the main anion was methane-sulphonate. The tail current that followed a depolarizing command had a reversal potential that depended on the pH gradient across the cell membrane, changing by ∼58 mV for a unit change in pHo. Consequently, the charge carrier for these outward currents is likely to be either H+ or an H+ equivalent.
Voltage-gated H+ conductances have been studied in a wide range of different tissues and animal species that include molluscan neurons, amphibian eggs, human neutrophils, and other phagocytic cells (for reviews, see Lukas et al. 1993; DeCoursey and Cherny 1994). Their properties have been found to be remarkably consistent: the voltage dependence is shifted by both pHi and pHo (Byerly et al. 1984), they are inhibited by low levels of divalent ions (Thomas and Meech 1982) with a special sensitivity to Zn2+ (Byerly and Suen 1989; Mahaut-Smith 1989), and in some cases they are amplified by arachidonate. The inhibition of the gp91-phox–associated voltage-gated current by Zn2+ and its augmentation by arachidonate suggests that it flows through the NADPH oxidase–associated H+ pathway previously studied in cell suspensions by Henderson et al. 1995.
Comparison with Human Neutrophils
The voltage-gated H+ conductance described by DeCoursey and Cherny 1993 in human neutrophils closely resembles that found in other cells: its voltage dependence is shifted to more positive potentials by external H+ and it is inhibited by external Cd2+ or Zn2+; however, its activation kinetics are significantly slower than those described in molluscan neurons (Byerly et al. 1984) or in Ambystoma oocytes (Barish and Baud 1984). In neutrophils (and macrophages, see Kapus et al., 1994), the currents are amplified by arachidonic acid, but it is not known whether this property is characteristic of the class of voltage-gated proton conductances.
Although we would expect the gp91-phox–associated H+ conductance to have properties broadly similar to those found in vivo in neutrophils, the CGD gene product that we are using is one subunit of the oxidase complex, which normally has four or five protein components. Consequently, even if these other subunits do not directly contribute to the proton pathway, we would expect the environment of the expressed product in CHO cells to be significantly different from that in the natural state. This may account for their activation kinetics, which is the most marked difference between the gp91-phox–associated currents and the proton currents recorded from neutrophils (DeCoursey and Cherny 1993). In neutrophils at room temperature, the outward current continued to rise even with commands that lasted 3–4 s, and there was no initial rapid phase as found here. However, the neutrophil pathway has a higher temperature sensitivity than most ion channels (DeCoursey and Cherny 1998), and this may also be reflected in a sensitivity to its membrane environment.
Arachidonic Acid Sensitivity
Fig. 4 shows that the voltage dependence of the gp91-phox–associated H+ conductance could be described by a Boltzmann distribution with a slope factor of 20 mV. The effect of 20 μM sodium arachidonate was to shift the voltage dependence of the conductance by 19 mV to more negative potentials and also to increase (1.2×) the maximum H+ conductance available. Both effects took place without appreciably changing the slope of the voltage relationship. In neutrophils, 50 μM sodium arachidonate has a comparable effect, although here a change in the slope factor from 14.7 to 7.5 mV was reported. The activation curve shifts by 14–23 mV and there is an approximately threefold increase in the maximum conductance (DeCoursey and Cherny 1993).
Under normal experimental conditions, the relative positions of the activation curve and the position of the tail current reversal potential (equivalent to the H+ equilibrium potential, EH) means that a maintained inward proton current is impossible to record. The large shift in the voltage dependence of activation produced by arachidonate, which is seen in both neutrophils and transfected CHO cells, means that the pathway may be activated even when the membrane is more negative than the EH (see Fig. 4 C).
The effect of arachidonate on the gp91-phox current differs somewhat from its effect in peritoneal macrophages, however. In macrophages, arachidonate not only shifts the activation curve to more negative membrane potentials and increases the maximum conductance, but also accelerates the rate of rise of the outward current (Kapus et al. 1994). This effect would not be evident at the most positive membrane potentials shown in Fig. 4 A because activation is close to maximum in this range, but even at +20 mV there appears to be little or no effect. It is possible that any change in kinetics is concealed by whatever process is responsible for the progressive increase in outward current that is seen in some cells.
Zn2+ Sensitivity
The inhibition by Zn2+ of the H+ conductance in neutrophils occurs in the same concentration range as we report here for the gp91-phox–associated conductance (see Fig. 5). In electrophysiological experiments on single cells, almost full inhibition is reported at ∼100 μM (DeCoursey and Cherny 1993), although in experiments on cell suspensions slightly higher concentrations (1 mM) were required (Henderson et al. 1988a,Henderson et al. 1988b). Fig. 5 is consistent with the higher figure; 200 μM Zn2+ produced ∼60% inhibition.
Voltage Dependence of Activation
In Fig. 3, the data are fitted by a Boltzmann function with a 20-mV slope factor and half-activation voltage under control conditions (pHo 8, pHi 6.9) of ∼21 mV. In human neutrophils, DeCoursey and Cherny 1993 used slope factors of ∼15 mV to fit their control data and half-activation values of ∼60 mV (pHo 7, pHi 6). The more positive value found in the neutrophil may be attributed to the effect of the more acid pHo because, in a similar pHo 7 solution, the gp91-phox–associated conductance showed little activation at 0 mV. It was difficult to obtain a full activation curve under such conditions because the maximum appeared to occur at potentials greater than ∼120 mV, at which level the seal between patch pipette and cell membrane often became unstable.
Voltage-dependent Conductance of Mutated gp91-phox
The 230 NH2-terminal amino acids of gp91-phox when expressed in CHO cells exhibit an arachidonate-activated H+ flux that is significantly reduced when leucine is used to replace the histidine residue in position 115 (cell line CHO-NLeu; Henderson 1998). The flux is abolished when the three histidine residues in positions 111, 115, and 119 are changed to leucine (cell line CHO-N3Leu; Henderson 1998). All three residues are in a putative membrane-spanning region of the molecule. The outward current recorded from the CHO-NLeu expressing cells at pHo 8.0, (Fig. 7 C) demonstrates a reduced current amplitude, slower activation time, and a shifted tail current reversal potential when compared with currents from expressing CHO91 or CHO-N cells. The precise role that histidine-115 plays in H+ conduction is not clear, but the change in tail current reversal potential suggests that the mutated pathway is less selective for H+, as if the presence of this protonated site within the pathway is essential to maintain its selectivity for protons.
The alteration in properties of the outward currents observed in CHO-N3Leu–expressing cells suggest that the histidine residues on either side of histidine-115 also contribute to H+ permeation. If, as the shift in the voltage dependence of activation suggests, one or the other histidine contributes to the voltage sensitivity of the proton conductance, the large shifts in the activation curve with changes in either pHo or pHi become understandable. An alkaline shift in the pH of the intracellular fluid would have the effect of reducing the charge on any histidine residue to which there is access. The observed positive shift in the activation curve corresponds to the effect of substituting the uncharged leucine for the charged histidine. Yet to be explained is the effect of changes in external pH, which is in the opposite direction.
Function of gp91-phox
Neutrophils provide the first cellular immune response of the body to invading micro-organisms. They are attracted to a site of infection where they engulf antibody-coated bacteria, killing and digesting them. That the generation of superoxide by the NADPH oxidase is a major contributor to the process is evident from the susceptibility to infection demonstrated by CGD patients. In vivo, gp91-phox probably functions as a charge compensator for the electron efflux generated upon production of superoxide. It also prevents a large and rapid fall in pHi caused by the coincident release of H+ internally.
NADPH oxidase activity is stimulated by a number of physiological and nonphysiological stimuli such as phorbol esters, unsaturated fatty acids (such as arachidonic acid), and formyl-Met-Leu-Phe. Thus, the large pH gradients and positive voltages used experimentally here were necessary to activate a significant H+ current only in the absence of arachidonate. After the oxidase is activated in vivo, an outwardly directed electron flux, measured by Schrenzel et al. 1998 will produce a rapid depolarization of the membrane. Estimates, based on dye partition, which may be inaccurate, suggest that the membrane potential of activated neutrophils is approximately −10 mV (Henderson et al. 1987). This, together with the appearance of H+ at the internal surface of the membrane and the interaction with arachidonate combine to activate the H+ pathway so that H+ becomes passively distributed across the cell membrane with pHi close to its resting value.
Structure of gp91-phox
This is the first voltage-gated H+ conductance to be described at the protein level. The amino acid sequence for gp91-phox is unlike any other protein (Henderson 1998), but its hydropathy plot suggests that there may be multiple (four or six) transmembrane domains at the NH2 terminus of the protein. There is also a large hydrophilic domain that, as it contains the predicted FAD and NADPH binding sites, is assumed to be on the cytosolic side of the plasma membrane. Within one putative transmembrane domain there is a sequence of three histidine residues (positions 111, 115, and 119) in an “H-X-X-X-H-X-X-X-H” motif that appear to play an essential role in H+ conduction.
Stationary noise analysis of the voltage-gated H+ current in cultured human muscle suggests that the elementary conductance is <0.1 pS (Bernheim et al. 1993). An even lower value has been reported for human neutrophils (DeCoursey and Cherny 1993). In molluscan neurons, the estimated unitary proton current at +10 mV is <0.004 pA (Byerly and Suen 1989). We can derive an estimate of the number of NADPH oxidase molecules (and therefore the number of gp91-phox) in each neutrophil cell from the concentration of cytochrome b558 present in cell suspensions. As there are ∼5 pmol heam/105 cells and each molecule probably has two heam moieties, there must be ∼106 molecules/cell. Of these, ∼20% are in the cell membrane. Assuming that the single channel H+ current for a 100-mV driving force is <1 fA at pH 6 (see DeCoursey and Cherny 1994), whole cell currents of less than ∼0.2 nA are to be expected for neutrophils, which is of the order observed experimentally. Unfortunately, CHO cells do not exhibit the characteristic cytochrome b558 spectrum, and so we were unable to carry out the same analysis on them.
Such low conductances follow naturally from the low H+ concentrations on either side of the cell membrane and are consistent with the pathway being either a continuous channel across the cell membrane or a carrier site becoming exposed to first one and then the other membrane surface. In the latter case, it is possible that the mechanism of H+ flux through gp91-phox may involve a cycle of protonation/deprotonation with histidine-115 being exposed alternately to the interior and exterior faces of the cell membrane, as described by Starace et al. 1997 for the S4 segment of a histidine-containing mutant of the Shaker K+ channel. Among other alternatives, the H-X-X-X-H-X-X-X-H motif may line a continuous channel pore so that protons “hop” along the membrane-spanning helix. The role of Zn2+ in inhibiting the H+ conductance is under investigation because, in proteins that bind zinc, the Zn2+ is held by residues in an H-X-X-X-H-X-X-X-H motif. The extent to which this motif occurs in the structure of other proton pathways has yet to be established.
Acknowledgments
We thank Mr. A. Laude and Mr. L. Brown for their help with some of the experiments; Mr. Michael Rickard provided computing support.
L.M. Henderson is an Arthritis Research Campaign (ARC) Postdoctoral Research Fellow and the patch-clamp amplifier and equipment was funded by an ARC equipment grant.
Footnotes
BCECF, 2′,7′-bis(2-carboxyethyl)-5(6)-carboxyfluoresceinCGD, chronic granulomatous diseaseCHO, Chinese hamster ovaryEPPS, N-[2-hydroxyethyl]-piperazine-N′-[3-propane-sulphonic acid]TMA, tetraethylammonium
References
- Armstrong C.M., Bezanilla F. Charge movement associated with the opening and closing of the activation gates of the Na channels. J. Gen. Physiol. 1974;63:533–552. doi: 10.1085/jgp.63.5.533. [DOI] [PMC free article] [PubMed] [Google Scholar]
- Barish M.E., Baud C. A voltage gated hydrogen ion current in the oocytes membrane of the axolotol, Ambystoma . J. Physiol. 1984;352:243–263. doi: 10.1113/jphysiol.1984.sp015289. [DOI] [PMC free article] [PubMed] [Google Scholar]
- Bernheim L., Krause R.M., Baroffio A., Hamann M., Kaelin A., Bader C-R. A voltage-dependent proton current in cultured human skeletal muscle myotubes. J. Physiol. 1993;470:313–333. doi: 10.1113/jphysiol.1993.sp019860. [DOI] [PMC free article] [PubMed] [Google Scholar]
- Byerly L., Meech R., Moody W. Rapidly activating hydrogen ion currents in perfused neurones of the snail, Lymnaea stagnalis . J. Physiol. 1984;351:199–216. doi: 10.1113/jphysiol.1984.sp015241. [DOI] [PMC free article] [PubMed] [Google Scholar]
- Byerly L., Moody W.J. Membrane currents of internally perfused neurons of the snail, Lymnaea stagnalis, at low intracellular pH. J. Physiol. 1986;376:477–491. doi: 10.1113/jphysiol.1986.sp016165. [DOI] [PMC free article] [PubMed] [Google Scholar]
- Byerly L., Suen Y. Characterization of proton currents in neurones of the snail, Lymnaea stagnalis . J. Physiol. 1989;413:75–89. doi: 10.1113/jphysiol.1989.sp017642. [DOI] [PMC free article] [PubMed] [Google Scholar]
- Cherny V.V., Henderson L.M., DeCoursey T.E. Proton and chloride currents in Chinese hamster ovary cells. Biophys. J. 1996;70:A77. [PubMed] [Google Scholar]
- DeCoursey T.E., Cherny V.V. Temperature dependence of voltage-gated H+ currents in human neutrophils, rat aveolar epithelial cells, and mammalian phagocytes. J. Gen. Physiol. 1998;112:503–522. doi: 10.1085/jgp.112.4.503. [DOI] [PMC free article] [PubMed] [Google Scholar]
- DeCoursey T.E., Cherny V.V. Effects of buffer concentration on voltage-gated H+ currentsdoes diffusion limit the conductance? Biophys. J. 1996;71:182–193. doi: 10.1016/S0006-3495(96)79215-9. [DOI] [PMC free article] [PubMed] [Google Scholar]
- DeCoursey T.E., Cherny V.V. Potential, pH and arachidonate gate hydrogen ion currents in human neutrophils. Biophys. J. 1993;65:1590–1598. doi: 10.1016/S0006-3495(93)81198-6. [DOI] [PMC free article] [PubMed] [Google Scholar]
- DeCoursey T.E., Cherny V.V. Voltage-activated hydrogen ion currents. J. Membr. Biol. 1994;141:203–223. doi: 10.1007/BF00235130. [DOI] [PubMed] [Google Scholar]
- Demaurex N., Grinstein S., Jaconi M., Schlegel W., Lew D.L., Krause K.-H. Proton currents in human granulocytesregulation by membrane potential and intracellular pH. J. Physiol. 1993;466:323–344. [PMC free article] [PubMed] [Google Scholar]
- Eder C., H-G. Fischer U., Hadding, Heinemann U. Properties of voltage-gated currents of microglia developed using macrophage colony-stimulating factor. Pflügers Arch. 1995;430:526–533. doi: 10.1007/BF00373889. [DOI] [PubMed] [Google Scholar]
- Edwards S.W. Biochemistry and Physiology of the Neutrophil. Cambridge University Press; London, UK: 1994. [Google Scholar]
- Goldman D.E. Potential, impedance and rectification in membranes. J. Gen. Physiol. 1943;27:37–60. doi: 10.1085/jgp.27.1.37. [DOI] [PMC free article] [PubMed] [Google Scholar]
- Henderson L.M. Role of histidine identified by mutagenesis in the NADPH oxidase-associated H+ channel. J. Biol. Chem. 1998;273:33216–33223. doi: 10.1074/jbc.273.50.33216. [DOI] [PubMed] [Google Scholar]
- Henderson L.M., Banting G., Chappell J.B. The arachidonate-activable, NADPH oxidase-associated H+ channel. Evidence that gp91-phox functions as an essential part of the channel. J. Biol. Chem. 1995;270:5909–5916. [PubMed] [Google Scholar]
- Henderson L.M., Chappell J.B. NADPH oxidase of neutrophils Biochim . Biophys. Acta. 1996;1273:87–107. doi: 10.1016/0005-2728(95)00140-9. [DOI] [PubMed] [Google Scholar]
- Henderson L.M., Chappell J.B. The NADPH-oxidase-associated H+ channel is opened by arachidonate. Biochem. J. 1992;283:171–175. doi: 10.1042/bj2830171. [DOI] [PMC free article] [PubMed] [Google Scholar]
- Henderson L.M., Chappell J.B., Jones O.T.G. The superoxide-generating NADPH oxidase of human neutrophils is electrogenic and associated with an H+ channel. Biochem. J. 1987;246:325–329. doi: 10.1042/bj2460325. [DOI] [PMC free article] [PubMed] [Google Scholar]
- Henderson L.M., Chappell J.B., Jones O.T.G. Superoxide generation by the electrogenic NADPH oxidase of human neutrophils is limited by the movement of a compensating charge Biochem. J. 255 1988. 285 290a [PMC free article] [PubMed] [Google Scholar]
- Henderson L.M., Chappell J.B., Jones O.T.G. Internal pH changes associated with the activity of NADPH oxidase of human neutrophils. Further evidence for the presence of an H+ conducting channel Biochem. J. 251 1988. 563 567b [DOI] [PMC free article] [PubMed] [Google Scholar]
- Henderson L.M., Thomas S., Banting G., Chappell J.B. The arachidonate-activatable, NADPH oxidase-associated H+ channel is contained within the multi-membrane-spanning N-terminal region of gp91-phox . Biochem. J. 1997;325:701–705. doi: 10.1042/bj3250701. [DOI] [PMC free article] [PubMed] [Google Scholar]
- Hodgkin A.L., Katz B. The effect of sodium ions on the electrical activity of the giant axon of the squid. J. Physiol. 1949;108:37–77. doi: 10.1113/jphysiol.1949.sp004310. [DOI] [PMC free article] [PubMed] [Google Scholar]
- Kapus A., Romanek R., Qu A.Y., Rotstein O.D., Grinstein S. A pH-sensitive and voltage-dependent proton conductance in the plasma membrane of macrophages. J. Gen. Physiol. 1993;102:729–760. doi: 10.1085/jgp.102.4.729. [DOI] [PMC free article] [PubMed] [Google Scholar]
- Kapus A., Romanek R., Grinstein S. Arachidonate acid stimulates the plasma membrane H+ conductance of macrophages. J. Biol. Chem. 1994;269:4736–4745. [PubMed] [Google Scholar]
- Langton P.D. A versatile superfusion system suitable for whole-cell and exercised patch clamp experiments. J. Physiol. 1993;467:244P. [Google Scholar]
- Lukas G.L., Kapus A., Nanda A., Romanek R., Grinstein S. Proton conductance of the plasma membraneproperties, regulation, and functional role. Am. J. Physiol. 1993;265:C3–C14. doi: 10.1152/ajpcell.1993.265.1.C3. [DOI] [PubMed] [Google Scholar]
- Mahaut-Smith M.P. The effect of zinc on calcium and hydrogen ion currents in intact snail neurones. J. Exp. Biol. 1989;145:455–464. doi: 10.1242/jeb.145.1.455. [DOI] [PubMed] [Google Scholar]
- Mathias R.T., Cohen I.S., Oliva C. Limitations of the whole cell patch clamp technique in the control of intracellular concentrations. Biophys. J. 1990;58:759–770. doi: 10.1016/S0006-3495(90)82418-8. [DOI] [PMC free article] [PubMed] [Google Scholar]
- Meech R.W., Thomas R.C. Effect of measured calcium chloride injection on the membrane potential and internal pH of snail neurons. J. Physiol. 1980;298:111–129. doi: 10.1113/jphysiol.1980.sp013070. [DOI] [PMC free article] [PubMed] [Google Scholar]
- Oliva C., Cohen I.S., Mathias R.T. Calculations of time constants for intracellular diffusion in whole cell patch clamp configuration. Biophys. J. 1988;54:791–799. doi: 10.1016/S0006-3495(88)83017-0. [DOI] [PMC free article] [PubMed] [Google Scholar]
- Pusch M., Neher E. Rates of diffusional exchange between small cells and a measuring patch pipette. Pflügers Arch. 1988;411:204–211. doi: 10.1007/BF00582316. [DOI] [PubMed] [Google Scholar]
- Reaves B., Banting G. Overexpression of TGN38/41 leads to mislocalisation of 7- adaptin. FEBS Lett. 1994;351:448–456. doi: 10.1016/0014-5793(94)00813-2. [DOI] [PMC free article] [PubMed] [Google Scholar]
- Roos D. The genetic basis of chronic granulomatous disease. Immunol. Rev. 1994;138:121–157. doi: 10.1111/j.1600-065x.1994.tb00850.x. [DOI] [PubMed] [Google Scholar]
- Royer-Pokora B., Kunkel L.M., Monaco A.P., Goff S.C., Newburger P.E., Baehner R.L., Cole S., Curnutte J.T., Orkin S.H. Cloning the gene for an inherited human disorder—chronic granulomatous disease—on the basis of its chromosomal location. Nature. 1986;322:32–38. doi: 10.1038/322032a0. [DOI] [PubMed] [Google Scholar]
- Schrenzel J., Serrander L., Banfi B., Nusse O., Fouyouzi R., Lew D.P., Demaurex N., Krause K.-H. Electron currents generated by the human phagocyte NADPH oxidase. Nature. 1998;392:734–737. doi: 10.1038/33725. [DOI] [PubMed] [Google Scholar]
- Schrenzel J., Lew D.P., Krause K.-H. Proton currents in human eosinophils. Am. J. Physiol. 1996;271:C1861–C1871. doi: 10.1152/ajpcell.1996.271.6.C1861. [DOI] [PubMed] [Google Scholar]
- Shotton D., White N. Confocal scanning microscope3D biological imaging. TIBS (Trends Biochem. Sci.). 1989;14:435–439. doi: 10.1016/0968-0004(89)90096-0. [DOI] [PubMed] [Google Scholar]
- Starace D.M., Stefani E., Bezanilla F. Voltage-dependent proton transport by the voltage sensor of the Shaker K+ channel. Neuron. 1997;19:1319–1327. doi: 10.1016/s0896-6273(00)80422-5. [DOI] [PubMed] [Google Scholar]
- Thomas R.C. The effect of carbon dioxide on the intracellular pH and buffering power of snail neurones. J. Physiol. 1976;255:715–735. doi: 10.1113/jphysiol.1976.sp011305. [DOI] [PMC free article] [PubMed] [Google Scholar]
- Thomas R.C., Meech R.W. Hydrogen ion currents and intracellular pH in depolarized voltage-clamped snail neurones. Nature. 1982;299:826–828. doi: 10.1038/299826a0. [DOI] [PubMed] [Google Scholar]
- Wanke E, Carbone E., Testa P.L. K+ conductance modified by a titratable group accessible to protons from the intracellular side of the squid axon membrane. Biophys. J. 1979;26:319–324. doi: 10.1016/S0006-3495(79)85251-0. [DOI] [PMC free article] [PubMed] [Google Scholar]