Abstract
The kinetics of activation and inactivation of K+/Cl− cotransport (KCC) have been measured in rabbit red blood cells for the purpose of determining the individual rate constants for the rate-limiting activation and inactivation events. Four different interventions (cell swelling, N-ethylmaleimide [NEM], low intracellular pH, and low intracellular Mg2+) all activate KCC with a single exponential time course; the kinetics are consistent with the idea that there is a single rate-limiting event in the activation of transport by all four interventions. In contrast to LK sheep red cells, the KCC flux in Mg2+-depleted rabbit red cells is not affected by cell volume. KCC activation kinetics were examined in cells pretreated with NEM at 0°C, washed, and then incubated at higher temperatures. The forward rate constant for activation has a very high temperature dependence (Ea ∼ 32 kCal/mol), but is not affected measurably by cell volume. Inactivation kinetics were examined by swelling cells at 37°C to activate KCC, and then resuspending at various osmolalities and temperatures to inactivate most of the transporters. The rate of transport inactivation increases steeply as cell volume decreases, even in a range of volumes where nearly all the transporters are inactive in the steady state. This finding indicates that the rate-limiting inactivation event is strongly affected by cell volume over the entire range of cell volumes studied, including normal cell volume. The rate-limiting inactivation event may be mediated by a protein kinase that is inhibited, either directly or indirectly, by cell swelling, low Mg2+, acid pH, and NEM.
Keywords: osmoregulation, red blood cell, phosphatase, kinase, kinetics
INTRODUCTION
A fundamental property of cells is the capacity to regulate cell volume. The water permeability of most cell membranes is sufficiently high that cell volume is determined by the total amount of intracellular solute. Regulation of intracellular solute takes place by way of negative feedback mechanisms in which the synthesis, degradation, influx, or efflux of various solutes is increased or decreased to correct perturbations in cell volume. Mechanisms for increasing total cell solute include regulated osmolyte synthesis (Bagnasco et al. 1988) and shrinkage-activated Na+–H+ exchange (Parker et al. 1991; Demaurex and Grinstein 1994) or Na+–K+–2Cl− cotransport (Haas 1989). Mechanisms for decreasing cell solute include swelling-activated Cl− channels (Strange et al. 1996; Okada 1997), K+–Cl− cotransport (Lauf 1985), K+–H+ exchange (Cala 1983), and organic osmolyte transporters or channels (Goldstein and Davis 1994). Although the identities of many volume-sensitive transporters are known (Demaurex and Grinstein 1994; Lytle et al. 1995; Gillen et al. 1996), the mechanisms by which cell volume causes an increase or decrease in transport activity are not well understood.
The vertebrate red blood cell is a simple system in which to investigate mechanisms of cell volume regulation. The mechanisms of volume regulation in red cells are limited to post-translational events, and some aspects of osmoregulation (e.g., gene regulation; see Ferraris et al. 1996), cannot be studied in red cells. Nonetheless, red cell volume regulation is a physiologically important phenomenon in its own right, and a large body of information is available about volume regulatory mechanisms in red cells of various species (Cossins and Gibson 1997). In addition, an understanding of red cell volume regulation could lead to new approaches to the treatment of sickle cell disease (Brugnara et al. 1986, Brugnara et al. 1989). In red cells of many species, cell swelling activates K+–Cl− cotransport (KCC)1 (Dunham and Ellory 1981; Haas and McManus 1985; Lauf 1985; Brugnara et al. 1986; Kaji 1986; Parker et al. 1991; Cossins and Gibson 1997). In addition to cell swelling, many other interventions are known to activate red-cell KCC, including N-ethylmaleimide (NEM; Lauf 1985), low intracellular pH (Brugnara et al. 1985, Brugnara et al. 1986; Lauf et al. 1994), inhibitors of protein kinases (Jennings and Schulz 1991; Bize and Dunham 1994), urea (Dunham 1995), high hydrostatic pressure (Godart and Ellory 1996), high temperature (Willis and Anderson 1998), oxidizing agents (Bize and Dunham 1995; Adragna and Lauf 1997), and low Mg2+ (Delpire and Lauf 1991a; Dunham et al. 1993).
To understand the mechanisms by which cell volume affects transport, it will be important to identify, in kinetic and biochemical terms, the sequence of events associated with activation and inactivation of transport. An early attempt to analyze the kinetics of activation and inactivation of KCC was based on a simple two-state model (Jennings and Al-Rohil 1990) in which KCC exists in either a resting or an activated state. In rabbit red cells, the rate of activation in swollen cells is much slower than the rate of inactivation in cells of normal volume (Jennings and Al-Rohil 1990). According to the two-state model, these data indicate that cell swelling activates transport by causing a decrease in the inactivation rate constant k 21 rather than an increase in the activation rate constant k 12. Parker and co-workers (Parker et al. 1991; Parker 1992) have found similar kinetics of KCC regulation in dog red cells. In LK sheep red cells, the lag times for volume-sensitive activation and inactivation are similar, indicating that cell volume can affect both the forward and the reverse rate constants in these cells (Dunham et al. 1993). In human SS and AA red cells the rates of KCC activation and inactivation are similar to those in rabbit red cells, but in CC red cells the rate of inactivation is very slow (Canessa et al. 1994).
The two-state model for KCC regulation is undoubtedly an oversimplification. Even if the transporter does exist in only two main functional states, the rate constants for activation and/or inactivation themselves are very likely regulated by forward and reverse rate processes (e.g., Bize and Dunham 1995). An additional complexity is the presence of more than two functional states of the transporter under some conditions (Dunham et al. 1993). One of the difficulties in obtaining mechanistic information about transport activation and inactivation is that the measured rate in general depends on more than one elementary rate constant. In the simplest two-state model, the measured relaxation rate is the sum of the forward and reverse rate constants. In a three-state model the observed rates of activation and inactivation are affected not only by the rate constants for the rate-limiting events, but also by the equilibrium constants for rapid events.
The purpose of the present work is to obtain quantitative estimates of the rate constants for the rate-limiting activation and inactivation events that regulate KCC. Rabbit red cells were chosen as an experimental system because they exhibit a relatively large, volume-dependent KCC flux (Al-Rohil and Jennings 1989; Stewart and Blackstock 1989); the resultant regulatory volume decrease is sufficiently slow that the volume does not change significantly in the time needed to measure the KCC flux (Jennings and Al-Rohil 1990). Therefore, rabbit red cells are well suited for detailed kinetic studies of KCC regulation. We show that, for stimulation of transport by low intracellular pH, low Mg2+, cell swelling, or NEM, the kinetics of activation of transport are consistent with the presence of a single rate-limiting event. The rate-limiting step for transport activation was examined in cells pretreated with NEM at 0°C and was found to be highly dependent on temperature (Ea ∼ 32 kCal/mol), but independent of cell volume. The kinetics of inactivation of transport by cell shrinkage indicate that the main volume-dependent event is the rate-limiting inactivation process, which is stimulated by cell shrinkage in the physiological range of volumes.
MATERIALS AND METHODS
Materials
Blood was obtained from healthy New Zealand white rabbits by either venipuncture or cardiac puncture, the latter in animals that were being killed for the purposes of obtaining other tissues for study in other laboratories. All animal procedures were in compliance with American Physiological Society guidelines. Some of the experiments were carried out using rabbit blood purchased from Pel-Freez; results obtained with blood from Pel-Freez were indistinguishable from those with blood from laboratory animals. Most experiments were performed using blood that had been stored <3 d at 4°C. Okadaic acid and ionophore A23187 were purchased from Calbiochem Corp. 86Rb+ was purchased as RbCl from DuPont NEN. All salts and buffers were purchased from Sigma Chemical Co. or Fisher Chemicals.
Cell Preparation
For experiments involving transport activation by swelling, low pH, or Mg2+ depletion, cells were separated on Percoll-Renograffin as previously described (Al-Rohil and Jennings 1989) to select the least dense one third of cells. The lower-density fractions are enriched in younger cells, which have a higher volume-dependent KCC activity (Brugnara and Tosteson 1987; Canessa et al. 1987; Al-Rohil and Jennings 1989). The NEM activation experiments in Fig. 6 Fig. 7 Fig. 8 Fig. 9 used unseparated red cells; comparable experiments with density-separated cells gave indistinguishable results. If blood had been stored more than a few hours, cells were washed three times and incubated 60–90 min at 37°C in HEPES-buffered physiological saline (HPS: 150 mM NaCl, 5 mM KCl, 1 mM CaCl2, 1 mM MgCl2, 1 mM Na-phosphate, 10 mM HEPES, pH 7.4) plus 10 mM glucose to try to establish a reproducible steady state.
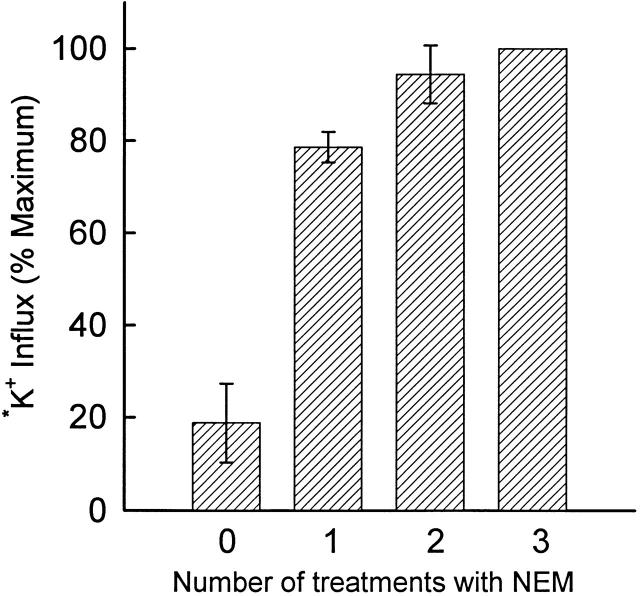
Figure 6.
Effect of successive exposures of rabbit red cells (not density separated) to 2 mM NEM at 0°C. Cells were washed in and suspended at 5% hematocrit in HEPES-buffered physiological saline. Suspensions were chilled to <2°C and NEM was added from a freshly prepared 1 M stock solution in dimethylformamide to a final concentration of 2 mM. After 15 min on ice, cells were washed in cold HPS, and the treatment with NEM was repeated once or twice as indicated. Cells were finally washed twice with HPS, suspended in isosmotic flux medium, and incubated 20 min at 37°C before adding 86Rb+; influx was measured for 20 min at 37°C. Data from two different cell preparations are shown (mean ± range).
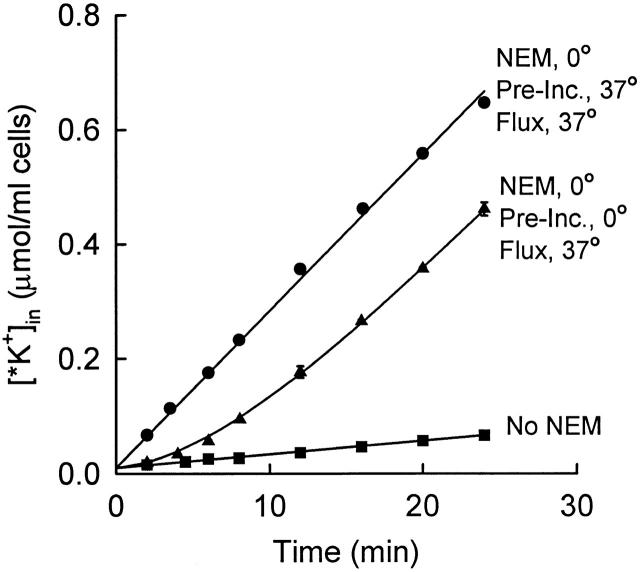
Figure 7.
Time course of activation of KCC at 37°C after NEM pretreatment at 0°C. Rabbit red cells (not density separated) were treated twice with 2 mM NEM at 0°C as in Fig. 6, then washed in cold medium. One aliquot of cells was suspended in isosmotic flux medium and incubated at 37°C for 20 min before adding 86Rb+ at t = 0 (•). The remaining cells were kept on ice for 20 min, and then suspended in 37°C flux medium containing 86Rb+ at t = 0 (▴; mean ± range of two suspensions). The curve through the points represents with a lag time of 8.9 min. Control cells were not exposed to NEM (▪).
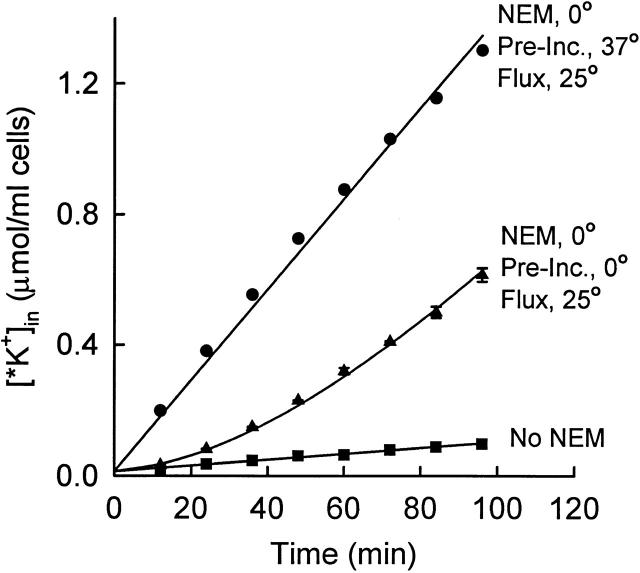
Figure 8.
Time course of activation of KCC at 25°C after NEM pretreatment at 0°C. Rabbit red cells (not density separated) were pretreated twice with NEM as in Fig. 6 and Fig. 7. Cells were then suspended at 2% hematocrit in flux medium at either 37°C (•) or on ice (▴; mean ± range of two suspensions). After 20 min, the suspensions were moved to a 25°C bath, and, after allowing 3 min for the temperature to equilibrate, 86Rb+ was added at t = 0. Control cells were not exposed to NEM (▪). The curve through the ▴ data represents with a lag time of 79 min.
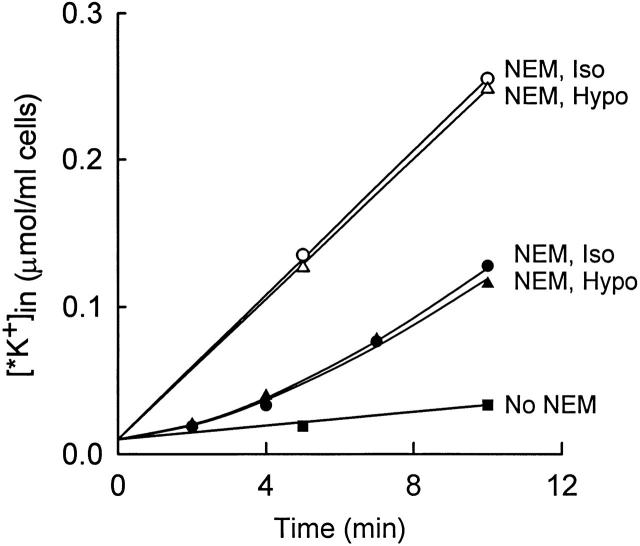
Figure 9.
Lack of effect of cell volume on the rate of activation of KCC in NEM-pretreated cells. Cells were pretreated twice with NEM at 0°C as in Fig. 6 Fig. 7 Fig. 8, and then suspended at 37°C in isosmotic flux medium (155 mM NaCl, 5 mM KCl, 10 mM HEPES, pH 7.45; •, ○, ▪) or hyposmotic flux medium (105 mM NaCl, 5 mM KCl, 6.7 mM HEPES, pH 7.45; ▴, ▵). The influx of 86Rb+ was measured without any preincubation (•, ▴, ▪) or after 20 min preincubation at 37°C (○, ▵).
NEM Treatment
Cells were washed in HPS, suspended at 5% hematocrit in HPS, and chilled until the temperature of the suspension was <2°C. NEM was then added from a freshly prepared 1-M stock solution in dimethylformamide to a final concentration of 2 mM. Control suspension received dimethylformamide at the same final concentration (0.2%). The suspensions were incubated 15 min on ice, washed once, and resuspended in HPS on ice. For some aliquots of cells, the NEM treatment was repeated once or twice more. After all NEM treatments were complete, the cells were washed twice in ice-cold HPS before further incubations. In some experiments, 0.1% β-mercaptoethanol was included to remove all traces of remaining NEM; results were identical whether or not β-mercaptoethanol was included in the wash medium.
Influx Measurements
Cells were suspended at 2% hematocrit in “standard flux medium” (155 mM NaCl, 5 mM KCl, 10 mM HEPES hemisodium, pH 7.5 at 25°C, 10−4 M ouabain). Depending on the design of the experiment, 86Rb+ (0.5–1 μCi/ml) was present at the outset or was added after incubating the cells in flux medium for various intervals (see figure legends). At timed intervals after exposure of cells to 86Rb+, the intracellular radioactivity was determined as described previously (Jennings and Al-Rohil 1990). The influx of 86Rb+ (assumed to be an ideal tracer for K+) is expressed as micromoles *K+ per milliliter cells and was calculated from the cpm in each sample, the volume of original cells (milliliters) in the sample, and the extracellular specific activity (cpm 86Rb+ per micromole K+).
Activation by Low pH
The time course of activation of KCC by low pH was determined by adding MOPS from a 1-M stock solution to a final concentration of 15–18 mM. Within a short time after extracellular acidification, the intracellular pH reaches Donnan equilibrium with the extracellular pH (e.g., Funder and Wieth 1966). We estimated intracellular pH in lysed pellets (in 10 vol water, with ionic strength then returned to 100 mM with KCl). This method does not accurately determine the absolute value of intracellular pH, but it is adequate for estimating the time course of changes in pH. We found that the half time for pH equilibration under the conditions of the flux experiment in Fig. 3 (25°C, ambient CO2) is ∼0.8 min in rabbit red cells. At higher temperature (Fig. 1 and Fig. 2), the time course of pH equilibration was not measured, but is believed to be considerably faster, not only because of the high temperature dependence of pH equilibration (Jennings 1978), but because 4–5 mM NaHCO3 was added to facilitate pH equilibration by the Jacobs–Stewart cycle (Jacobs and Stewart 1942).
Figure 3.
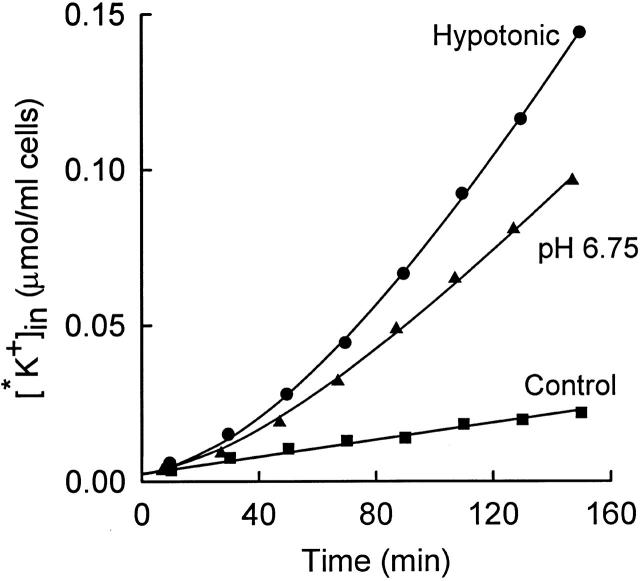
Time course of influx of 86Rb+ (*K+) into rabbit red cells at 25°C. Influx was carried out in the following media (all containing 10−4 M ouabain; mM): 155 NaCl, 5 KCl, 10 HEPES, pH 7.5 (▪); 155 NaCl, 5 KCl, 10 HEPES, 18 MOPS, pH 6.75 (▴); or 103 NaCl, 5 KCl, 7 HEPES, pH 7.5 (•). The solid curves represent , with lag times of 61 (▴) and 84 (•) min.
Figure 1.
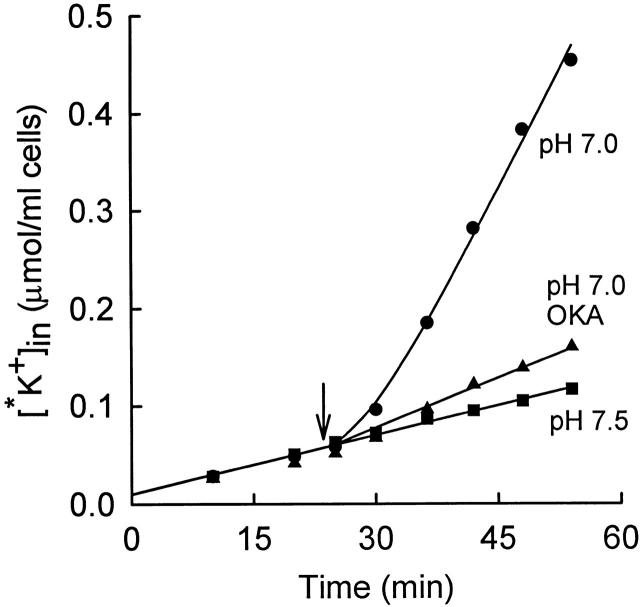
Time course of 86Rb+ (*K+) influx into rabbit red cells at 37°C from a medium consisting of (mM): 155 NaCl, 5 KCl, 10 HEPES, 10−4 M ouabain. The three suspensions of cells were initially in a medium of pH 7.5. At the arrow, the pH of two of the suspensions (•, ▴) was lowered to 7.0 by adding 16 mM MOPS (and 4 mM NaHCO3 to facilitate pH equilibration). Okadaic acid (OKA) was added at t = 0 to one of the suspensions (▴), final concentration 100 nM. The curve through the pH 7.0 data (•) represents a single exponential increase in flux (), with a lag time of 6.5 min. Control suspension was at pH 7.5 throughout (▪).
Figure 2.
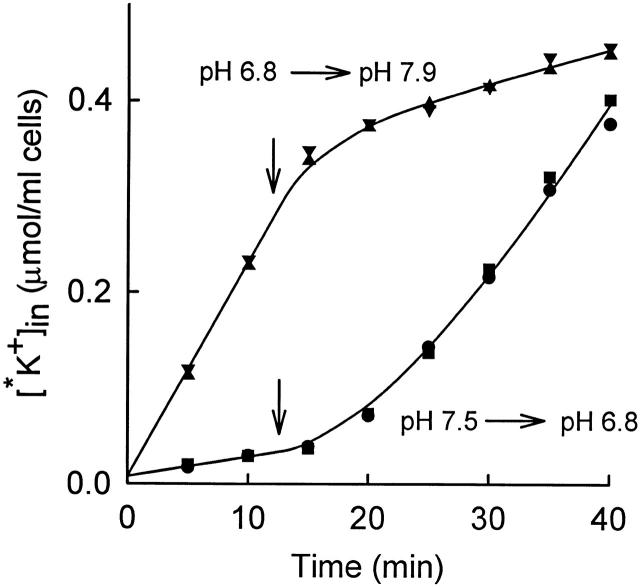
Time course of 86Rb+ (*K+) influx into rabbit red cells at 37°C from a medium consisting of (mM): 155 NaCl, 5 KCl, 10 HEPES, 10−4 M ouabain. In two of the suspensions (•, ▪), the pH was initially 7.5 and was lowered to 6.8 at t = 12.5 min by addition of 18 mM MOPS and 5 mM NaHCO3. The solid curve through the data corresponds to a single exponential increase in flux, with a lag time of 14 min. In the other two suspensions (▴, ▾), the pH was lowered to 6.8 by adding 18 mM MOPS and 5 mM NaHCO3 15 min before adding 86Rb+; the pH of these suspensions was raised to 7.9 at t = 12.5 min by addition of NaOH. The curve through these data is , with a lag time of 3.6 min.
Determination of Intracellular Mg2+
Intracellular Mg2+ was estimated colorimetrically in cells that were prepared as in the flux experiments. Cells were incubated at 2% hematocrit at 25°C in 160 mM NaCl, 10 mM HEPES, pH 7.45, 1 mM EDTA. Two aliquots (1 ml) were removed before addition of ionophore A23187 and mixed with 10 ml of cold 160 mM KCl/10 mM HEPES, centrifuged 2 min at 4,000 rpm, and the supernatants were removed. A23187 (10–20 μM final) was then added, and further aliquots were removed, centrifuged, and supernatants removed. The cell pellets were lysed in 0.5 ml water, heated for 2 min in boiling water, and allowed to cool. The tubes were then centrifuged, and 0.1 ml of the supernatant was mixed with 0.9 ml of Mg2+ color reagent containing calmagite (1-[1-hydroxy-4-methyl-2-phenylazo]-2-naphthol-4-sulfonic acid; Sigma Diagnostics). Absorbances were compared with those of standards, and the results were expressed as micromoles Mg2+ per milliliter cells.
Calculation of Activation and Inactivation Delay Times
In all these experiments, the main measured parameter is the lag time for the transition from one steady state to another. The rate of this transition (inverse lag time) was calculated as follows. The time course of accumulation of intracellular 86Rb+ [*K+] after a step change in conditions at t = 0 is given by the following expression (Jennings and Al-Rohil 1990):
 |
1 |
where J 0 is the initial flux (micromoles per milliliter cells minute−1), J 1 is the flux in the new steady state, τ is the lag time for establishing the new steady state, and [*K+]in t = 0 is the amount of intracellular tracer at the time of the step change in conditions. In most experiments, the change in conditions is at the time of first exposure of cells to 86Rb+; in these cases, [*K+]in t = 0 represents the small amount of tracer that is not removed by the washing procedure. For the activation experiments in this paper, J 0 and [*K+]in t = 0 were determined directly in a parallel suspension in isosmotic medium at physiological pH.
The influx data were fit (Sigma Plot; Jandel Scientific) to , with two adjustable parameters, τ and J 1, for most experiments. In the NEM activation experiments, the steady state flux J 1 was determined independently in a parallel suspension that had been incubated 15–20 min at 37°C to allow KCC to activate. In these experiments, the only adjustable parameter in the curve fits was the lag time τ, which can be estimated accurately when all the other parameters are determined independently. In the inactivation experiments (Fig. 10 Fig. 11 Fig. 12), the initial flux was estimated in swollen cells, and the lag time was determined in a two-parameter fit (τ and J 1). The estimate of τ is reasonably accurate in an inactivation experiment (despite the two-parameter fit) because the final steady state flux is small.
Figure 10.
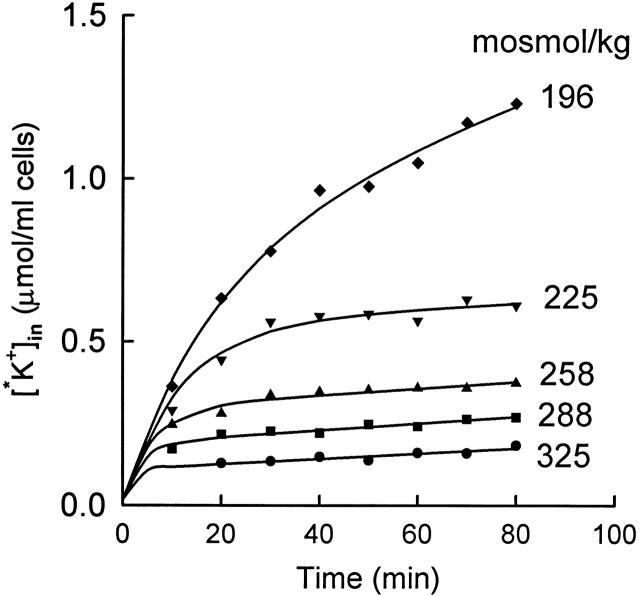
Effect of cell volume on the rate of inactivation of KCC at 25°C. Cells were preincubated in hyposmotic (200 mosmol/kg) medium for 15 min at 37°C to activate KCC and were pelleted and maintained at 37°C before resuspending at 25°C in 86Rb-containing media of the indicated osmolality. All flux mediate contained 5 mM KCl and 10−4 M ouabain. The solid curves through the data represent single exponential decreases in the flux (), with initial flux equal to the initial slope of the curve in 196 mosmol/kg medium. The lag times for the individual curves (from the top) are 17.5, 11.3, 6.0, 3.7, and 1.8 min.
Figure 11.
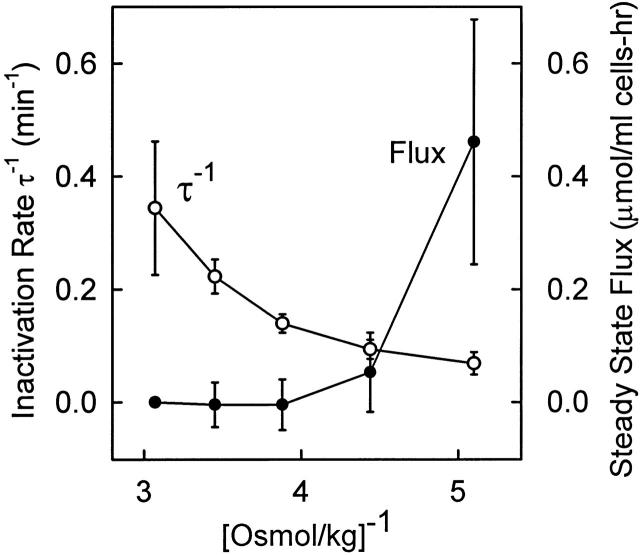
Steady state KCC flux (•) and inverse lag time for inactivation (○) at 25°C after preactivation in 196 mosmol/kg medium at 37°C as in Fig. 10. Data are the mean ± SD for three experiments, including that in Fig. 10. The flux in 325 mosmol/kg media was subtracted from the steady state flux at all other osmolalities for each preparation of cells to correct for variations in the basal flux.
Figure 12.
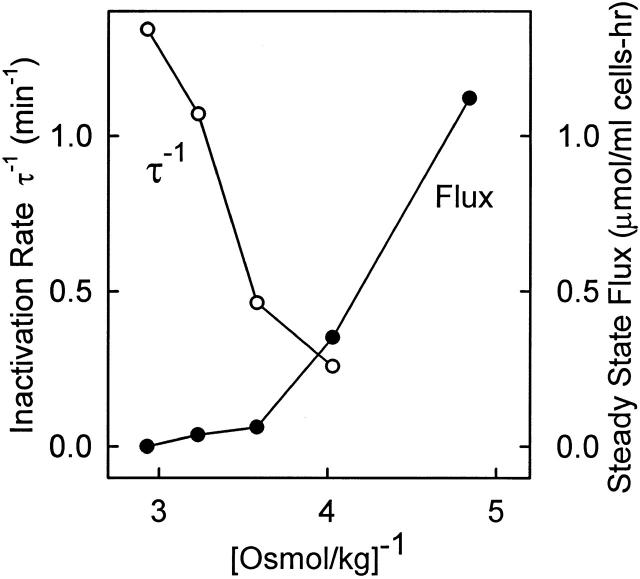
Steady state KCC flux (•) and inverse lag time for inactivation (○) at 37°C after preactivation of KCC in 207 mosmol/kg medium for 15 min at 37°C. After preactivation, cells were centrifuged and maintained at 37°C before resuspending at 37°C in 86Rb-containing media (5 mM K+) of osmolality 207, 248, 279, 309, or 341 mosmol/kg. In all but the 207 mosmol/kg medium, the flux inactivated soon after the cells were suspended in the new medium, and the lag time for inactivation was calculated from the influx data. A separate inactivation experiment at 37°C gave indistinguishable results.
RESULTS
Single Exponential Time Course for Approach to the Steady State
The purpose of these experiments is to obtain quantitative estimates of the rate constants for the rate-limiting activation and inactivation events in the regulation of rabbit red cell KCC. Experimentally, under a wide variety of conditions, the time course of activation by cell swelling or NEM is not distinguishable from a single exponential in red cells from rabbit (Jennings and Al-Rohil 1990; Jennings and Schulz 1991), dog (Parker et al. 1991), LK sheep (Dunham et al. 1993), mouse (Armsby et al. 1995), and human (Canessa et al. 1994), suggesting that one of the activation steps is much slower than any other step. To test further the idea that there is a single rate-limiting step in the activation of KCC, the kinetics of activation by step decreases in intracellular pH or Mg2+ were compared with activation by hypotonic swelling.
Activation by Low pH
It is known that low intracellular pH (e.g., pH 6.9) activates KCC in human and LK sheep red cells (Brugnara et al. 1985, Brugnara et al. 1986, Brugnara et al. 1989; Lauf et al. 1994). Extracellular pH in the range 6.8–7.5 does not have major effects on KCC (Brugnara et al. 1985). The time course of activation of KCC by low intracellular pH in rabbit red cells is shown in Fig. 1. Cells were initially in an isosmotic medium at pH 7.5, and the influx of 86Rb+ was measured for about 20 min. At t = 23.5 min (arrow), 16 mM MOPS and 4 mM NaHCO3 were added. The HCO3 − facilitates rapid equilibration of intracellular and extracellular pH by the Jacobs–Stewart cycle (Jacobs and Stewart 1942). Based on data at lower temperatures and lower HCO3 − concentration (see materials and methods), Donnan equilibrium should be reached in roughly 1 min at 37°C. After acid addition, the 86Rb+ influx rises over the next 10 min with a single exponential time course. The increased flux is inhibited by the presence of the protein phosphatase inhibitor okadaic acid, as is true for activation of KCC by cell swelling or NEM (Jennings and Schulz 1991; Kaji and Tsukitani 1991). Fig. 2 represents another acid activation experiment and also shows the time course of decrease in K+ influx when the pH is suddenly returned to an alkaline value. As in Fig. 1, sudden acidification causes activation of transport, with a lag time of 14 min, which is somewhat longer than in Fig. 1. However, we do not have sufficient data to determine whether the lag time at pH 6.8 is actually different from that at pH 7.0. Fig. 2 (top) shows cells that were preincubated at pH 6.8 to allow KCC activation before addition of 86Rb+. The initial flux is large in these cells, and addition of NaOH to return the pH to alkalinity causes a rapid decrease in the flux. The time course of inactivation was not studied in detail because the rate may depend in part on the rate of intracellular alkalinization, but it is clear that inactivation of the flux by alkaline pH is more rapid than activation by acidic pH, just as inactivation by shrinkage is more rapid than activation by swelling (Jennings and Al-Rohil 1990).
Fig. 3 shows the time course of acid activation at 25°C. For comparison, the flux was also activated by hypotonic cell swelling in the same preparation of cells. The flux activates much more slowly at 25° than at 37°C for both modes of activation. The lag time at 25°C is 60–80 min for activation by swelling and low pH. This lag time is in the same range as that measured previously (average 55 min) for swelling-activated KCC at 25°C (Jennings and Al-Rohil 1990), but there is considerable uncertainty in the lag times for activation experiments because the final steady state flux is not known precisely.
Activation by Low Mg2+
In human and LK sheep red cells, depletion of Mg2+ at normal cell volume activates KCC (Brugnara and Tosteson 1987; Bergh et al. 1990; Delpire and Lauf 1991a; Dunham et al. 1993). The time course of activation after a step decrease in Mg2+ has not been reported. We found that Mg2+-depleted rabbit red cells do not tolerate incubation at 37°C for more than ∼30 min; accordingly, Mg2+ depletion experiments were performed at lower temperature, either 25° or 30°C. Fig. 4 (top) shows that it is possible to deplete rabbit red cells of Mg2+ in <5 min by addition of ionophore A23187 and EDTA, in agreement with the work of Flatman and Lew 1980 on human red cells. Sudden Mg2+ depletion causes activation of KCC with a time course (Fig. 4, bottom) similar to that observed after stimulation by cell swelling or low pH. The 86Rb+ flux stimulated by low Mg2+ is inhibited by replacement of Cl− with NO3 − and is also inhibited by preincubation with okadaic acid (data not shown).
Figure 4.
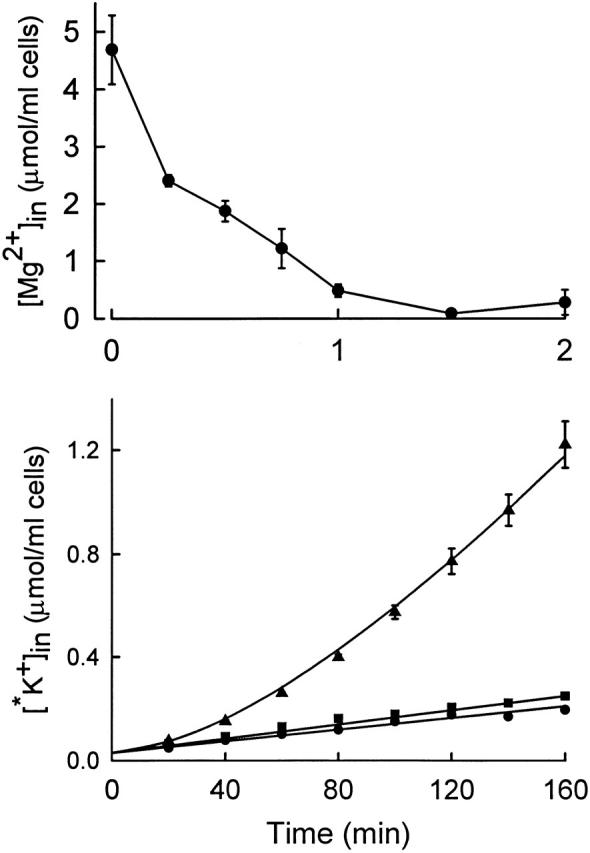
(Top) Time course of total cellular Mg2+ in rabbit red cells incubated at 2% hematocrit in 155 mM NaCl, 5 mM KCl, 1 mM EDTA, 10 mM HEPES, pH 7.5, 25°C. At t = 0, ionophore A23187 was added to a final concentration of 10 μM, 0.2% ethanol. (Bottom) Time course of influx of 86Rb+ at 25°C in the following media (all containing 10−4 M ouabain, 10 mM HEPES, pH 7.5, 1 mM EDTA, 0.2% ethanol; mM): 155 NaCl, 5 KCl (•); 155 NaCl, 5 KCl, 10 μM A23187 (▴); 155 NaNO3, 5 KNO3, 10 μM A23187 (▪). The solid curve corresponds to , with a lag time of 81 min.
Volume Dependence of Transport in Low Mg2+ Cells
Fig. 5 shows that, in cells that have been depleted of Mg2+, there is only a very minor effect of cell volume on the KCC flux. A slight volume dependence of the flux in Mg2+-depleted cells is observed even in NO3 − medium. Varying the osmolality from 410 to 185 mosmol/kg (2.4–5.4 [osmol/kg]−1) caused the Cl−-dependent flux to change by <20%. The same results were observed in two other experiments. In one earlier experiment, there appeared to be a decrease in the flux in very hypertonic solutions (>400 mosmol/kg), but in the range between 200 and 400 mosmol/kg there is essentially no effect of volume on KCC in Mg2+-depleted rabbit red cells. In contrast, KCC is still volume sensitive in LK sheep red cells, though less so than in cells with normal Mg2+ (Dunham et al. 1993; Dunham 1995). It is impossible to determine whether there is a lag time in the response of KCC to cell swelling in low Mg2+ rabbit red cells, because the flux is not volume dependent.
Figure 5.
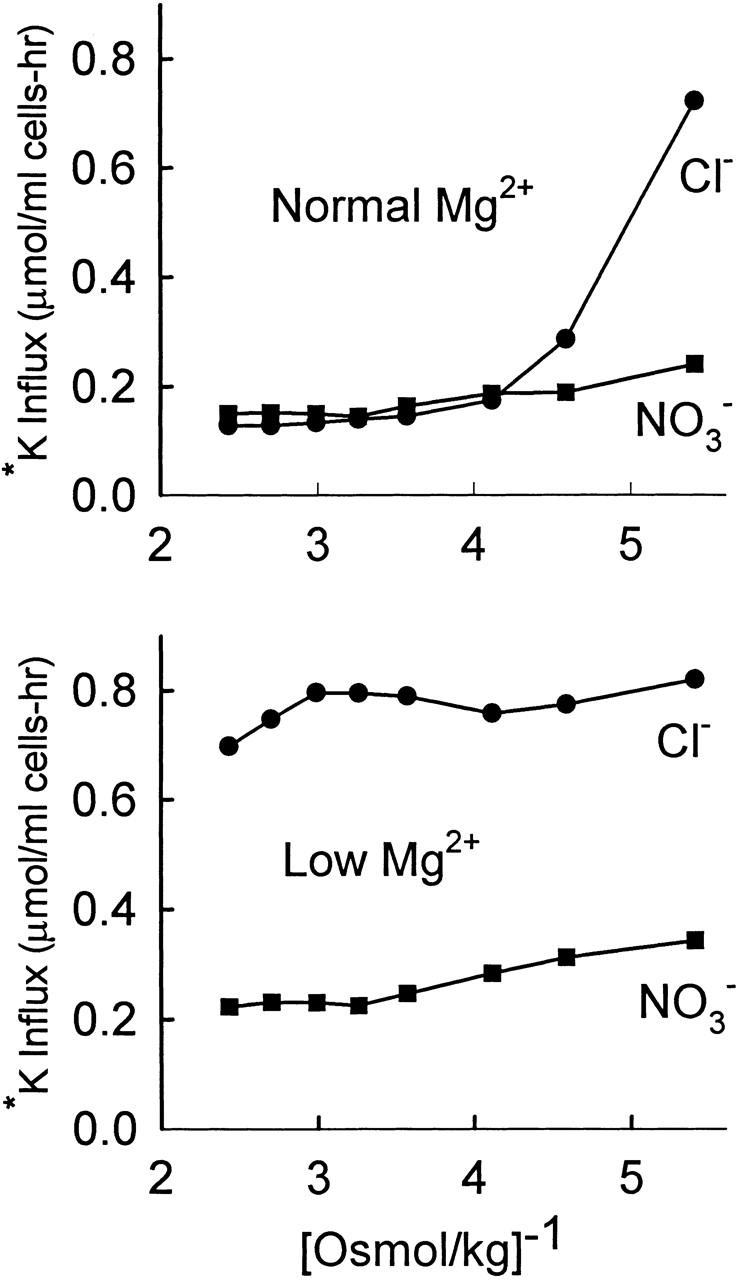
Lack of effect of cell volume on KCC in Mg2+-depleted cells. Cells (not density separated) were suspended in 160 mM NaCl, 10 mM HEPES, 1 mM EDTA, pH 7.5, 0.2% ethanol ± 10 μM A23187, and incubated 10 min at 30°C to deplete Mg2+. Each suspension was then washed once in the above medium (without ethanol and A23187), split in half, and washed once in either the same medium or in medium with 160 mM NaNO3 instead of 160 mM NaCl. Cells were then resuspended in HEPES-buffered NaCl or NaNO3 media with osmolality varied from 185 to 410 mosmol/kg H2O by adding either water or 1 M NaCl (or NaNO3). Suspensions were incubated 20 min at 30°C before adding 1 μCi 86Rb+. Influx was measured for 30 min at 30°C. All flux solutions contained 10−4 M ouabain and 5 mM K+ (added as KCl or KNO3). (Top) No A23187. (Bottom) Mg2+ depletion with A23187. Flux in Cl− media (•). Flux in NO3 − media (▪).
Measurement of One-Way Activation after NEM Pretreatment
The above experiments (Fig. 1 Fig. 2 Fig. 3 Fig. 4) indicate that the time course of activation of KCC is similar after step changes in cell volume, pH, or Mg2+, suggesting that the same event is rate limiting for all three modes of activation, and it is of interest to try to measure the rate constant for this event. The measured lag time for transport activation in general depends not only on the rate-limiting activation event, but also on the rate constant for inactivation. The most direct way to estimate the rate constant for activation is to devise conditions in which the rate of inactivation is negligible. Under these conditions, the measured rate of activation is very nearly equal to the rate constant for the rate-limiting step in the activation process.
One approach to measuring activation kinetics under conditions of maximal activation would be to measure transport at very high cell volume. However, extreme cell swelling may cause prelytic leaks or other abnormalities. Instead of trying to activate transport maximally by cell swelling, we used NEM, which has long been known to activate KCC (see Lauf 1985). Activation of KCC by NEM exhibits a lag time similar to that observed after cell swelling (Jennings and Schulz 1991; Armsby et al. 1995). In our previous studies (Jennings and Schulz 1991), NEM was added at 37°C and allowed to react for 2 min before residual NEM was removed by adding cysteine. This protocol made it possible to observe a lag time for transport activation after NEM, but precise rate measurements were difficult because transport activation and NEM reaction with its target protein (identity unknown, but possibly a protein kinase) were taking place simultaneously.
To characterize the kinetics of activation by NEM more precisely, cells were incubated with 2 mM NEM for 15 min at 0°C, and residual NEM was removed by washing at 0°C. Transport was then activated by incubating for 15–20 min at 37°C. Fig. 6 shows that activation by NEM is nearly maximal after two NEM treatments (2 mM; 15 min) at 0°C. Further treatments with NEM at low temperature do not cause significant further activation or inhibition. Therefore, as originally shown by Lauf and Adragna 1995, treatment with NEM at low temperature produces only activation of KCC; the inhibitory effects of high concentrations of NEM are only observed when NEM treatment is at higher temperature. The data in Fig. 6 indicate that two exposures to 2 mM NEM at 0°C are sufficient to activate KCC to at least 80% and probably >90% of maximal activity.
The fluxes shown in Fig. 6 were measured by adding 86Rb+ after incubating NEM-pretreated cells for 15–20 min at 37°C. If pretreated cells were exposed to 86Rb+ without preincubation at 37°C, the influx was initially small but increased with a single exponential time course to the same steady state level as preincubated cells (Fig. 7). The lag time for KCC activation at 37°C was estimated in five separate preparations of cells that had been treated twice with 2 mM NEM on ice. The lag time was 9.2 ± 1.4 (SD) min. The lag time was also measured in five preparations of cells that had been treated once with 2 mM NEM. The lag time in this case was slightly shorter (7.6 ± 0.6 min), as expected if the flux is not quite maximally activated and the reverse rate constant is not completely inhibited. From these experiments, we conclude that the rate constant for the rate-limiting forward step in transport activation in NEM-treated cells is ∼0.11/min at 37°C.
Activation Rate Constant Is Very Dependent on Temperature
The temperature dependence of the activation rate was measured by treating with NEM at 0°C, and then measuring the time course of 86Rb+ influx at 25°C. The flux in the fully activated state at 25°C was measured by pretreating cells with NEM at 0°C, incubating 15–20 min at 37°C to activate >90% of the transporters (Fig. 6), and then shifting the temperature back to 25°C for the flux measurement. Fig. 8 shows that the lag time for activation at 25°C is much longer than at 37°C. In four experiments (with either one or two pretreatments with NEM), the activation lag time was 75 ± 13 (SD) min, which is a factor of about eight longer than at 37°C. The apparent activation energy of the rate-limiting activation process is ∼32 kCal/mol in this temperature range.
Lack of Effect of Cell Volume on the Activation Rate Constant
Fig. 9 shows that the activation rate constant is not detectably dependent on cell volume in NEM-pretreated cells. Cells were preincubated with NEM at 0°C, and the activation rate was measured as in Fig. 7 in isotonic and hypotonic media. The activation rate in swollen cells is indistinguishable from that in cells of normal volume. In agreement with earlier data obtained under different conditions of NEM treatment (Al-Rohil and Jennings 1989), the steady state KCC flux in NEM-treated cells is not dependent on cell volume.
Kinetics of KCC Inactivation
The above experiments indicate that the rate-limiting kinetic step in transport activation is not dependent on cell volume, in agreement with our previous proposal that the main volume-dependent process is the inactivation step (Jennings and Al-Rohil 1990). To examine the effect of cell volume on KCC inactivation more directly, the rate of transport inactivation was examined under conditions in which, in the final steady state, nearly all the transporters are inactivated. Cells were preincubated 15–20 min in 200 mosmol/kg medium at 37°C to activate a substantial fraction of the transporters. The preincubation is long enough to activate KCC, but not long enough to allow a significant regulatory volume decrease (Jennings and Al-Rohil 1990). Cells were then resuspended at 25°C in 86Rb+-containing media of varying osmolalities. At all osmolalities, the temperature shift causes a decrease in the steady state number of activated transporters because of the very high temperature dependence of the activation rate constant (see above). Although the flux inactivates rapidly, it is possible to get a reliable estimate of the inactivation rate because the initial flux is known (from that in the most swollen cells), and the final flux can be measured reasonably accurately. Fig. 10 shows that the rate of inactivation of the flux increases as cell volume decreases, even in the range of cell volumes in which the vast majority of the transporters are inactivated in the steady state.
The results of the experiment in Fig. 10 plus two additional experiments are summarized in Fig. 11. A single experiment with fluxes at 37° instead of 25°C is shown in Fig. 12. Again, the rate of inactivation continues to increase as cell volume decreases, in a volume range where the steady state KCC flux is very small. Therefore, the rate of inactivation does not reach a limiting value as cell volume decreases. This finding is evidence that the major volume-dependent step in transport regulation is the rate-limiting inactivation event (see below).
DISCUSSION
The experiments described above have provided the most quantitative information to date on the rate-limiting events in activation and inactivation of a volume-regulatory transporter. The rates were measured under conditions where, in the final steady state, KCC is either fully activated by NEM (Fig. 6 Fig. 7 Fig. 8 Fig. 9) or nearly fully inactivated by shrinkage (Fig. 10 Fig. 11 Fig. 12). Kinetic analysis is much simpler under these conditions than it is when an intermediate (and unknown) percentage of transporters are in the activated state. The data will be discussed below in terms of specific current models for activation and inactivation of KCC. However, it is useful first to summarize the main experimental findings without reference to particular models. (a) Activation of KCC by sudden acidification, depletion of Mg2+, cell swelling, or NEM takes place with a time course that is consistent with a single rate-limiting activation event. (b) In contrast to LK sheep red cells (Dunham et al. 1993), there is very little effect of cell volume on KCC in Mg2+-depleted rabbit red cells. (c) In cells pretreated with NEM at low temperature, KCC does not activate until the temperature is raised; using NEM-pretreated cells, it is possible to measure the rate of KCC activation under conditions of maximum steady state activation. (d) The activation rate constant in NEM-treated cells is very dependent on temperature (Ea ∼ 32 kCal/mol), but is not detectably dependent on cell volume. (e) The inactivation rate can be measured by shifting the osmolality to produce a final steady state in which nearly all transporters are inactivated. Under these conditions, the rate of inactivation increases as cell volume decreases over the entire range of cell volumes studied, including physiological cell volume.
Interdependence of Volume and pH Signals
The acidification experiments in Fig. 1 Fig. 2 Fig. 3 show that activation of KCC by acidification has a similar time course to activation by hypotonic swelling. It should be pointed out that, in these experiments, there was slight cell swelling in addition to the acidification. Acidification of red cells is accompanied by a net influx of Cl− (e.g., Funder and Wieth 1966), which causes cell swelling in an isosmotic medium (see Lauf et al. 1994; Lauf and Adragna 1996). In our experiments, MOPS and NaHCO3 were added from 1-M stock solutions, which increased the osmolality of the medium and minimized cell swelling during acidification. Nonetheless, there is slight swelling under these conditions. Rabbit red cell water at pH 7.4 (in 310 mosmol/kg medium) is 1.76 ± .025 g H2O/g solids (mean ± SD, four preparations). In cells acidified as in Fig. 2, cell water increases to 1.89 ± 0.03 g H2O/g solids (three preparations). This cell water is the same as in cells at pH 7.4 in 290 mosmol/kg H2O medium. At this cell water content, there is detectable activation of KCC in young rabbit red cells (Jennings and Schulz 1990), but the activation is much less than that observed after acidification.
A complete study of the relationship between acid activation and swelling activation in rabbit red cells was not performed because it is already clear from the work of Brugnara et al. 1985 and Lauf et al. 1994 that pH affects the volume dependence of red cell KCC (and vice versa). The important point for present purposes is that, after acidification, under conditions of only slight cell swelling, the time course of activation is similar to that after hypotonic (200 mosmol/kg) swelling, suggesting that the volume and pH signaling pathways converge on a single rate-limiting event.
Three-State Models of Transport Regulation
Earlier data on activation and inactivation rates (Jennings and Al-Rohil 1990) were analyzed in terms of a simple two-state mechanism, which is almost certainly an oversimplification, and it is important to consider the implications of the current data in the context of more complex models. Dunham et al. 1993 proposed a three-state model, based in part on the finding that Mg2+ depletion of LK sheep red cells causes partial activation of KCC and that subsequent cell swelling causes further activation without a time lag. Moreover, Mg2+ depletion increases the Vmax for KCC without changing the apparent K+ affinity, whereas cell swelling increases the K+ affinity (Bergh et al. 1990). Swelling of inside-out vesicles also increases apparent K+ affinity for KCC (Kelley and Dunham 1996). Dunham et al. 1993 proposed that there is an intermediate state (not fully activated because affinity is still low) that is observed in Mg2+-depleted LK sheep red cells. Cell swelling converts this intermediate into the fully activated state.
In rabbit red cells there is very little effect of cell volume on KCC in Mg2+-depleted cells (Fig. 5). Instead, the cells behave similarly to NEM-treated cells; KCC is activated and is not strongly affected by volume. The influx was measured at an extracellular K+ concentration of 5 mM, which is well below the apparent Michaelis constant for extracellular K+ (Bergh et al. 1990; Delpire and Lauf 1991b); therefore, an increase in substrate affinity would have been detected as an increased flux. Cell swelling, therefore, does not appear to raise the substrate affinity of KCC in Mg2+-depleted rabbit red cells. Irrespective of the differences between rabbit and LK sheep, we feel that it is worthwhile to discuss the present results in reference to a three-state model, because it is quite possible that rapid events take place in series with the rate-limiting activation/inactivation events, and it is important to know whether the volume dependence of KCC is a consequence of effects of volume on rapid events or on the rate-limiting events.
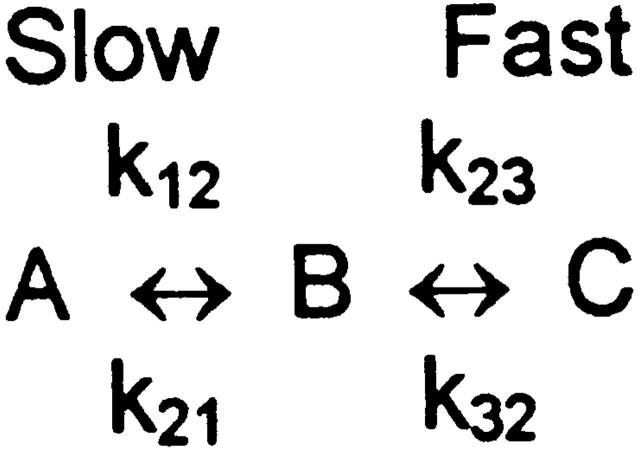
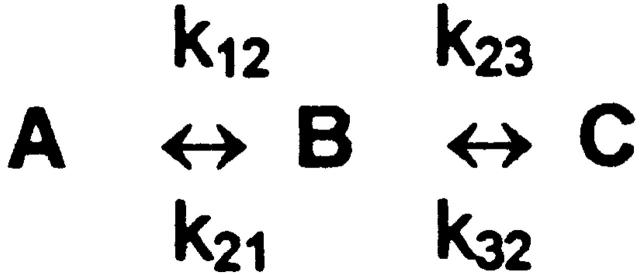
The three-state model of Dunham et al. 1993 proposes that the activation process involves a rate-limiting step (A to B) followed by a fast step (B to C) (Fig. 1). To discuss relaxation rates, no assumptions are necessary about the detailed kinetic properties of the three states, other than that the flux is much higher in the C than in the A state. In this model, the relaxation rate for approach to any new steady state is (see ):
 |
2 |
where K BC is the equilibrium constant k 23/k 32 for the rapid second step.
Scheme S1.
In rabbit red cells, τ−1 is smaller in swollen cells than in cells of normal size (Jennings and Al-Rohil 1990), suggesting that the rate-limiting inactivation event k 21 is very dependent on cell volume. However, it is possible in principle that the actual volume dependence is entirely in the fast step; that is, K BC could be strongly increased by cell swelling. If so, the measured relaxation rate would be small in swollen cells, as observed. Therefore, published data do not rule out the possibility that a rapid second step rather than the slow step is the main volume-dependent event.
The inactivation experiments in Fig. 10 Fig. 11 Fig. 12 provide a way to address the question of whether the slow or the rapid step is the major volume-dependent step. Suppose, for example, that the rapid (B to C) step were the only volume-dependent step. If so, then K BC must decrease as cell volume decreases. As K BC becomes small, the steady state number of C states ([C]ss) decreases in proportion to K BC, but the relaxation rate τ−1 should reach a limiting value ( and ):
 |
3 |
and
 |
4 |
In other words, if the major volume-dependent process is the rapid B to C transition, then the rate of inactivation should become independent of cell volume in the limit of low cell volume. The data in Fig. 10 Fig. 11 Fig. 12 show that, experimentally, the rate of inactivation continues to increase as cell volume decreases in a range of cell volumes where nearly all the transporters are inactivated in the steady state. This indicates that the rate constant k 21 for the rate-limiting inactivation event is strongly dependent on cell volume. These data are the best evidence to date that the rate-limiting inactivation event is also the main volume-dependent event. It is significant that the KCC inactivation rate is strongly dependent on cell volume at physiological cell volumes. This indicates that, even though most of the transporters are inactivated under physiological conditions, modulation of KCC by small changes in cell volume is a real physiological mechanism for maintaining normal cell volume over the long life of the cell.
Lack of Effect of Cell Volume on the Rate-limiting Forward Activation Step
In the context of the three-state model, NEM could activate transport by increasing k 12, decreasing k 21, or increasing K BC. NEM probably does not have a large stimulatory effect on k 12, because the rate of activation in NEM-pretreated cells is relatively slow. Accordingly, NEM must cause a large decrease in k 21 and/or increase in K BC. In either case, the measured rate of activation τ−1 is approximately equal to the forward activation rate constant k 12 under conditions of maximum NEM activation, because the second term in is very small when activation is maximal. Experimentally, cell swelling has no detectable effect on the activation step k 12 (Fig. 9). This is consistent with our earlier data (Jennings and Al-Rohil 1990), but the current method for estimating k 12 is more accurate. It is of course possible that NEM removes a volume effect on k 12 that is normally present, but we have no evidence for an effect of volume on k 12 in rabbit red cells.
Large Temperature Dependence of the Rate-limiting Activation Event
Although volume has very little effect on the activation rate constant, temperature has a very large effect. Earlier data on the effect of temperature on rabbit red cell KCC (Jennings and Al-Rohil 1990) indicated that the rate constant for activation is more temperature dependent than that for inactivation. The present data, with improved methods for measuring the forward rate constant, show that the temperature dependence of the rate-limiting activation event is extraordinarily high. The rate increases by a factor of ∼8 between 25° and 37°C, which corresponds to an activation energy of ∼32 kCal/mol. The transport process itself is much less dependent on temperature; the flux varies by a factor of <2 in the same temperature range (Jennings and Al-Rohil 1990), corresponding to an activation energy of <10 kCal/mol. However, it should be noted that the flux was measured at low extracellular K+ concentrations, and it is possible that the Vmax for KCC actually has a higher activation energy than 10 kCal/mol.
The high temperature dependence of k 12 is in agreement with the recent work of Willis and Anderson 1998, who showed that guinea pig red cell KCC is activated by warming. Willis and Anderson 1998 also showed that the large effect of temperature is on a regulatory process rather than on the cotransport process itself. Our results are in complete agreement with this idea. The most probable reason for the activation by high temperature is that, at all cell volumes, the forward rate constant for activation is far more temperature dependent than the reverse rate constant. We have been able to estimate the temperature dependence of k 12 reasonably accurately, but it is much more difficult to do the same for k 21 (inactivation), because k 21 depends strongly on cell volume, and the volume dependence of k 21 may be affected by temperature. We therefore do not know the temperature dependence of k 21, but we are confident that the inactivation process is much less temperature dependent than the activation process. The fact that elevated temperatures activate KCC (Willis and Anderson 1998), without NEM treatment, indicates that the high temperature dependence of k 12 applies not only to NEM-treated cells but also to normal cells.
Biochemical Nature of the Rate-limiting Activation Process
Inhibitors of serine-threonine protein phosphatases prevent activation of KCC (Jennings and Schulz 1991; Kaji and Tsukitani 1991; Parker et al. 1991; Starke and Jennings 1993), indicating that a dephosphorylation event is necessary for KCC activation. It is not known whether the dephosphorylation event is on KCC itself or on a modulatory protein. The effects of okadaic acid and calyculin A are consistent with the involvement of protein phosphatase 1 (PP1), although the okadaic acid dose response is complicated by its slow permeation and adsorption to cellular constituents (Namboodiripad and Jennings 1996; Jennings 1997).
It is of interest to compare the temperature dependence of the activation rate constant k 12 with those for known protein phosphatases. Mitsui et al. 1994 have shown that the activities of smooth muscle phosphatase IV (SMP-IV) and myosin-associated phosphatase (MAP) have much higher temperature dependence (Q10 of 5.2–5.3) than several other phosphatases, including the catalytic subunits of PP1 and PP2A, which have Q10 of ∼2 (Mitsui et al. 1994). The temperature dependence of SMP-IV and of MAP is nearly as high as that measured for the KCC activation rate constant k 12 (Q10 ∼ 6 between 27° and 37°C), and it is possible that a similar phosphatase mediates the rate-limiting activation step for KCC. However, not enough is known about the properties of red cell protein phosphatases to draw firm conclusions on this point. In fact, it is not really established that a protein phosphatase mediates the rate-limiting activation event. The effects of phosphatase inhibitors on the activation rate (Jennings and Schulz 1991; Kaji and Tsukitani 1991) suggest that k 12 represents a phosphatase activity, but it is nonetheless possible that protein dephosphorylation is not the rate-limiting activation event, but rather plays a permissive role before the activation event. In resealed human red cell ghosts, protein serine/threonine phosphorylation and dephosphorylation do not appear to be in the signal transduction pathway for regulation of volume sensitive KCC (Sachs and Martin 1993); the relationship between regulation of KCC in intact cells and in resealed ghosts remains unclear, however.
If k 12 does represent a protein dephosphorylation event, then k 21 most likely represents phosphorylation mediated by a serine-threonine protein kinase, as suggested previously (Jennings and Al-Rohil 1990). If so, the kinase activity is inhibited by cell swelling, possibly by a mechanism involving the relief of cytoplasmic crowding (Minton et al. 1992). The identity of the swelling-inhibited protein kinase, if such a kinase exists, is unknown. However, the data presented here should perhaps stimulate the search for such a kinase, because there is now better evidence for a volume-sensitive, rate-limiting inactivation event that could be kinase mediated. The relatively low temperature dependence of k 21 is also consistent with the idea that k 21 represents a protein kinase activity (see Mitsui et al. 1994).
Predicting Steady State Fluxes from Activation and Inactivation Rate Constants
It is of interest to ask whether the measured rate constants for activation and inactivation are consistent with the observed effects of volume on the steady state fluxes. In the two-state model, the steady-state flux is related to the inverse lag time as shown in (Jennings and Al-Rohil 1990):
 |
5 |
Therefore, if the only volume-dependent parameter is k 21, then the flux should be directly proportional to the lag time. In Fig. 11 and Fig. 12, both the flux and the lag time are strongly dependent on cell volume, but the flux varies somewhat more rapidly than does the lag time. Therefore, the volume dependence of the inactivation rate constant k 21, by itself, does not appear to be sufficient to account for the entire volume dependence of the flux. As discussed above, we have no direct evidence for volume dependence of the activation rate constant k 12, although the estimates of k 12 were necessarily made in NEM-treated cells, and it is possible that, without NEM treatment, k 12 is volume dependent. Another possibility is that a rapid step in the activation is volume dependent, as found in LK sheep red cells by Dunham et al. 1993. In rabbit red cells depleted of Mg2+, the flux is not very dependent on cell volume (Fig. 5), but in normal cells there could be a rapid, volume-dependent activation event that takes place before or after the rate-limiting event. Our data indicate that the volume dependence of k 21 can account for much, but not all, of the volume dependence of the steady state flux. We currently have no information on what other KCC regulatory events depend on cell volume in rabbit red cells.
Comparison of Rabbit and LK Sheep Red Cells
Although there are differences between the current results and those obtained in LK sheep red cells (Dunham et al. 1993), there are also points of agreement. For example, the rate constant k 12 for the rate-limiting activation event estimated here (0.11/min) is quite similar to that (0.09/min) derived by Dunham et al. 1993. The estimates of the inactivation rate constant k 21 (∼1/min in cells of normal volume) are also quite similar in rabbit and LK sheep cells. Our determinations of the effect of volume on k 21 indicate a lower volume dependence than that proposed by Dunham et al. 1993, but both laboratories agree that k 21 is strongly volume dependent. The main difference in the two species is the much higher volume dependence of the flux in Mg2+-depleted cells in LK sheep than in rabbit. The basic mechanism of volume dependence is very likely quite similar in the two species, but clearly there are differences in some aspects of the regulation.
Variations on the Three-State Model
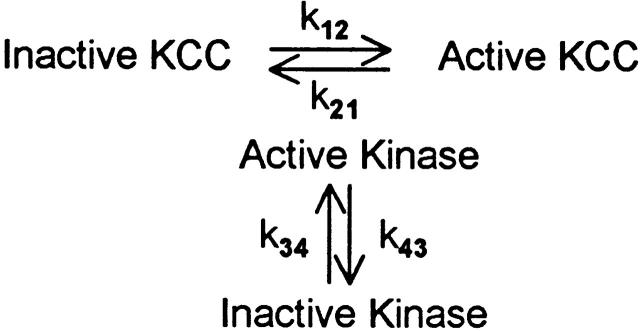
The three-state model of Dunham et al. 1993 is among the simplest mechanisms containing more than one event in the activation–inactivation process. However, many other relatively simple mechanisms involving multiple steps are possible. For example, a cascade mechanism of the kind described recently by Lytle 1998 for duck red cell Na-K-2Cl cotransport could, in principle, describe the data shown here. In this kind of mechanism, the rates of forward and reverse transitions between active and inactive states are not directly affected by cell volume, but rather are modulated by an enzyme (e.g., kinase) whose activity is sensitive to cell volume. For example, the reverse rate constant k 21 could represent a kinase activity that is, in turn, controlled by a separate phosphorylation/dephosphorylation cycle (shown in Fig. 2). This kind of modulation of rate constants by a separate phosphorylation/dephosphorylation cycle could of course be applied to either a two- or three-state mechanism, but, for simplicity, we consider only the two-state case. In this model, cell volume could in principle affect k 34 and/or k 43, and thereby affect k 21. That is, k 21 could be inhibited by cell swelling, but the parameter directly affected by cell volume could actually be k 34 or k 43. Our data cannot rule out a model of this type. However, it should be pointed out that the inactivation rate constant k 21 increases without a detectable lag time when cells are suspended in media of increasing osmolality (Fig. 10). The measurements do not have the time resolution to make quantitative estimates of the rate of change of k 21, but the data can be fit very easily by assuming that, when the cells first shrink to the new volume, k 21 changes much more rapidly than the rate of change of transport. The rapid change in k 21 implies that, if the inactivation rate constant is regulated by a volume-dependent phosphorylation/dephosphorylation cycle, then that cycle must be able to reach a new steady state in much less than 1 min.
Scheme S2.
Many variations on simple cascade-type models are possible, including those in which a tyrosine kinase modulates the activity of a serine/threonine phosphatase (Bize and Dunham 1995). This kind of model can explain the interesting finding of de Franceschi et al. 1997 that deficiencies in Src family kinases Fgr and Hck cause activation of KCC in mouse red cells. Tyrosine phosphorylation is known to inhibit the activities of PP1 and PP2A (see de Franceschi et al. 1997). Bize et al. 1998 recently showed that H2O2 and staurosporine stimulate protein phosphatase (probably PP1) in LK sheep red cell membranes. The stimulation (∼25%) is smaller than the severalfold activation of KCC, but it is possible that there are multiple phosphatase activities in the membrane and that only the one associated with KCC is activated by staurosporine. In the context of the present work, the high temperature dependence of the activation rate constant k 12 could be a consequence of the fact that the activating phosphatase is itself regulated by a temperature-dependent process. If so, the high apparent Ea of k 12 could reflect the Ea of the catalysis of dephosphorylation, augmented by the temperature dependence of events that regulate the phosphatase. Although a regulated phosphatase activity may mediate the rate-limiting activation event, much more needs to be learned about the actual enzyme activities associated with regulation of KCC and the interdependencies among these activities before the biochemical correlates of the rate-limiting rate constants for activation and inactivation of KCC are understood.
Acknowledgments
The authors are grateful to Mark Adame, Anjali Shinde, and Daniel Brown for assistance with some of the flux experiments described here. Anil Namboodiripad assisted with the Mg2+ determinations.
This work was supported by National Institutes of Health research grant R01 GM 26861-20.
Relaxation Rate for Three-State Models
A general three-state model for regulation of KCC is shown in 3 (Dunham et al. 1993), where A, B, and C represent distinct functional states of the transporter. Let [A], [B], and [C] be defined as the fractions of transporters in each state. In the steady state, the following conditions apply:
 |
A1 |
and
 |
A2 |
where [A]ss, [B]ss, and [C]ss are the steady state fractions of the three forms of the transporter. It is assumed that there are only three states; therefore,
 |
A3 |
and
 |
A4 |
Scheme S3.
The above equations can be solved for [C]ss:
 |
A5 |
It is assumed that the B to C transition is much faster than the A to B transition (Dunham et al. 1993). Therefore, after a step change in conditions, the B to C transition should, to a first approximation, be at equilibrium at all times:
 |
A6 |
The relaxation rate for the whole system is then derived as follows. Define Y as the difference between the concentration of A at time t and the concentration of A in the final steady state:
 |
A7 |
From conservation of mass, it must be true that:
 |
A8 |
and can be combined to produce:
 |
A9 |
The first order differential equation for the rate of change of Y is:
 |
A10 |
Substituting for [A] () and [B] () into gives:
 |
A11 |
The terms containing [A]ss and [B]ss sum to zero (), leaving
 |
A12 |
Therefore, the relaxation rate (inverse lag time), τ−1, is the following:
 |
A13 |
and can be rewritten in terms of K BC (⊸k23/k32), the equilibrium constant for the rapid (B to C) step:
 |
A14 |
and
 |
A15 |
The relaxation rate τ−1 for a three-state model (with a rapid second step), then, is similar to that for a two-state model, except that the term in k 21 is divided by (1 + K BC).
Footnotes
HPS, HEPES-buffered physiological salineKCC, K+/Cl− cotransportNEM, N-ethylmaleimidePP1, protein phosphatase 1
References
- Adragna N.C., Lauf P.K. Oxidative activation of K-Cl cotransport by diamide in erythrocytes from human with red cell disorders, and from several other mammalian species. J. Membr. Biol. 1997;155:1–11. doi: 10.1007/s002329900173. [DOI] [PubMed] [Google Scholar]
- Al-Rohil N., Jennings M.L. Volume-dependent K+ transport in rabbit red blood cellscomparison with oxygenated human SS cells. Am. J. Physiol. 1989;257:C114–C121. doi: 10.1152/ajpcell.1989.257.1.C114. [DOI] [PubMed] [Google Scholar]
- Armsby C.C., Brugnara C., Alper S.L. Cation transport in mouse erythrocytesrole of K+-Cl− cotransport in regulatory volume decrease. Am. J. Physiol. 1995;268:C894–C902. doi: 10.1152/ajpcell.1995.268.4.C894. [DOI] [PubMed] [Google Scholar]
- Bagnasco S.M., Murphy H.R., Bedford J.J., Burg M.B. Osmoregulation by slow changes in aldose reductase and rapid changes in sorbitol flux. Am. J. Physiol. 1988;254:C788–C792. doi: 10.1152/ajpcell.1988.254.6.C788. [DOI] [PubMed] [Google Scholar]
- Bergh C., Kelley S.J., Dunham P.B. K-Cl cotransport in LK sheep erythrocyteskinetics of stimulation by cell swelling. J. Membr. Biol. 1990;117:177–188. doi: 10.1007/BF01868684. [DOI] [PubMed] [Google Scholar]
- Bize I., Dunham P.B. Staurosporine, a protein kinase inhibitor, activates K-Cl cotransport in LK sheep erythrocytes. Am. J. Physiol. 1994;266:C759–C770. doi: 10.1152/ajpcell.1994.266.3.C759. [DOI] [PubMed] [Google Scholar]
- Bize I., Dunham P.B. H2O2 activates red blood cell K-Cl cotransport via stimulation of a phosphatase. Am. J. Physiol. 1995;269:C849–C855. doi: 10.1152/ajpcell.1995.269.4.C849. [DOI] [PubMed] [Google Scholar]
- Bize I., Munro S., Canessa M., Dunham P.B. Stimulation of membrane serine-threonine phosphatase in erythrocytes by hydrogen peroxide and staurosporine. Am. J. Physiol. 1998;274:C440–C446. doi: 10.1152/ajpcell.1998.274.2.C440. [DOI] [PubMed] [Google Scholar]
- Brugnara C., Bunn H.F., Tosteson D.C. Regulation of erythrocyte cation and water content in sickle cell anemia. Science. 1986;232:388–390. doi: 10.1126/science.3961486. [DOI] [PubMed] [Google Scholar]
- Brugnara C., Kopin A.S., Bunn H.F., Tosteson D.C. Regulation of cation content and cell volume in hemoglobin erythrocytes from patients with homozygous hemoglobin C disease. J. Clin. Invest. 1985;75:1608–1617. doi: 10.1172/JCI111867. [DOI] [PMC free article] [PubMed] [Google Scholar]
- Brugnara C., Tosteson D.C. Cell volume, K transport, and cell density in human erythrocytes. Am. J. Physiol. 1987;252:C269–C276. doi: 10.1152/ajpcell.1987.252.3.C269. [DOI] [PubMed] [Google Scholar]
- Brugnara C., Van Ha T., Tosteson D.C. Acid pH induces formation of dense cells in sickle erythrocytes. Blood. 1989;74:487–495. [PubMed] [Google Scholar]
- Cala P.M. Volume regulation by red blood cellsmechanisms of ion transport between cells and mechanisms. Mol. Physiol. 1983;4:33–52. [Google Scholar]
- Canessa M., Fabry M.E., Blumenfield N., Nagel R.L. Volume stimulated, Cl−dependent K+ efflux highly expressed in young human red cells containing normal hemoglobin or HbS. J. Membr. Biol. 1987;97:97–105. doi: 10.1007/BF01869416. [DOI] [PubMed] [Google Scholar]
- Canessa M., Romero J.R., Lawrence C., Nagel R.L., Fabry M.E. Rate of activation and deactivation of K:Cl cotransport by changes in cell volume in hemoglobin SS, CC, and AA red cells. J. Membr. Biol. 1994;142:349–362. doi: 10.1007/BF00233441. [DOI] [PubMed] [Google Scholar]
- Cossins A.R., Gibson J.S. Volume-sensitive transport systems and volume homeostasis in vertebrate red blood cells. J. Exp. Biol. 1997;200:343–352. doi: 10.1242/jeb.200.2.343. [DOI] [PubMed] [Google Scholar]
- de Franceschi L., Fumagalli L., Olivieri O., Corrocher R., Lowell C.A., Berton G. Deficiency of Src family kinases Fgr and Hck results in activation of erythrocyte K/Cl cotransport. J. Clin. Invest. 1997;99:220–227. doi: 10.1172/JCI119150. [DOI] [PMC free article] [PubMed] [Google Scholar]
- Delpire E., Lauf P.K. Magnesium and ATP dependence of K-Cl Co-transport in low K+ sheep red blood cells J. Physiol. 441 1991. 219 231a [DOI] [PMC free article] [PubMed] [Google Scholar]
- Delpire E., Lauf P.K. Kinetics of Cl−dependent K fluxes in hyposmotically swollen low K sheep erythrocytes J. Gen. Physiol. 97 1991. 173 193b [DOI] [PMC free article] [PubMed] [Google Scholar]
- Demaurex N., Grinstein S. Na+/H+ antiportmodulation by ATP and role in cell volume regulation. J. Exp. Biol. 1994;196:389–404. doi: 10.1242/jeb.196.1.389. [DOI] [PubMed] [Google Scholar]
- Dunham P.B. Effects of urea on K-Cl cotransport in sheep red blood cellsevidence for two signals of swelling. Am. J. Physiol. 1995;268:C1026–C1032. doi: 10.1152/ajpcell.1995.268.4.C1026. [DOI] [PubMed] [Google Scholar]
- Dunham P.B., Ellory J.C. Passive potassium transport in low potassium sheep red cellsdependence upon cell volume and chloride. J. Physiol. 1981;318:511–530. doi: 10.1113/jphysiol.1981.sp013881. [DOI] [PMC free article] [PubMed] [Google Scholar]
- Dunham P.B., Klimczak J., Logue P.J. Swelling activation of K-Cl cotransport in LK sheep erythrocytesa three-state process. J. Gen. Physiol. 1993;101:733–766. doi: 10.1085/jgp.101.5.733. [DOI] [PMC free article] [PubMed] [Google Scholar]
- Ferraris J.D., Williams C.K., Jung K., Bedford J.J., Burg M.B., Garcia-Perez A. ORE, a eukaryotic minimal essential osmotic response element. J. Biol. Chem. 1996;271:18318–18321. doi: 10.1074/jbc.271.31.18318. [DOI] [PubMed] [Google Scholar]
- Flatman P.W., Lew V.L. Magnesium buffering in intact human red blood cells measured using the ionophore A23187. J. Physiol. 1980;305:13–30. doi: 10.1113/jphysiol.1980.sp013346. [DOI] [PMC free article] [PubMed] [Google Scholar]
- Funder J., Wieth J.O. Chloride and hydrogen ion distribution between human red cells and plasma. Acta Physiol. Scand. 1966;68:234–245. [Google Scholar]
- Gillen C.M., Brill S., Payne J.A., Forbush B., III. Molecular cloning and functional expression of the K-Cl cotransporter from rabbit, rat, and human. J. Biol. Chem. 1996;271:16237–16244. doi: 10.1074/jbc.271.27.16237. [DOI] [PubMed] [Google Scholar]
- Godart H., Ellory J.C. KCL cotransport activation in human erythrocytes by high hydrostatic pressure. J. Physiol. 1996;491:423–434. doi: 10.1113/jphysiol.1996.sp021226. [DOI] [PMC free article] [PubMed] [Google Scholar]
- Goldstein L., Davis E.M. Taurine, betaine, and inositol share a volume sensitive transporter in skate erythrocyte cell membrane. Am. J. Physiol. 1994;267:R173–R179. doi: 10.1152/ajpregu.1994.267.2.R426. [DOI] [PubMed] [Google Scholar]
- Haas M. Properties and diversity of (Na-K-Cl) cotransporters. Annu. Rev. Physiol. 1989;51:443–457. doi: 10.1146/annurev.ph.51.030189.002303. [DOI] [PubMed] [Google Scholar]
- Haas M., McManus T.J. Effect of norepinephrine on swelling-induced potassium transport in duck red cells. Evidence against a volume-regulatory decrease under physiological conditions. J. Gen. Physiol. 1985;85:649–667. doi: 10.1085/jgp.85.5.649. [DOI] [PMC free article] [PubMed] [Google Scholar]
- Jacobs M.H., Stewart D.R. The role of carbonic anhydrase in certain ionic exchanges involving the erythrocyte. J. Gen. Physiol. 1942;25:539–552. doi: 10.1085/jgp.25.4.539. [DOI] [PMC free article] [PubMed] [Google Scholar]
- Jennings M.L. Characteristics of CO2-independent pH equilibration in human red blood cells. J. Membr. Biol. 1978;40:365–391. doi: 10.1007/BF01874164. [DOI] [PubMed] [Google Scholar]
- Jennings M.L., Al-Rohil N. Kinetics of activation and inactivation of swelling-stimulated K+/Cl− cotransport. Volume-sensitive parameter is the rate constant for inactivation. J. Gen. Physiol. 1990;95:1021–1040. doi: 10.1085/jgp.95.6.1021. [DOI] [PMC free article] [PubMed] [Google Scholar]
- Jennings M.L., Schulz R.K. Swelling-activated KCl cotransport in rabbit red cellsflux is determined mainly by cell volume rather than shape. Am. J. Physiol. 1990;159:C960–C967. doi: 10.1152/ajpcell.1990.259.6.C960. [DOI] [PubMed] [Google Scholar]
- Jennings M.L., Schulz R.K. Okadaic acid inhibition of KCl cotransport. Evidence that protein dephosphorylation is necessary for activation of transport by either cell swelling or N-ethylmaleimide. J. Gen. Physiol. 1991;97:799–817. doi: 10.1085/jgp.97.4.799. [DOI] [PMC free article] [PubMed] [Google Scholar]
- Jennings M.L. Regulation of erythrocyte potassium transport by cell volume and protein phosphorylation. In: Hamasaki N., Mihara K., editors. Membrane Proteins. Structure, Function and Expression Control. Kyushu University Press; Fukuoka, Japan: 1997. pp. 223–234. [Google Scholar]
- Kaji D. Volume-sensitive K transport in human erythrocytes. J. Gen. Physiol. 1986;88:719–738. doi: 10.1085/jgp.88.6.719. [DOI] [PMC free article] [PubMed] [Google Scholar]
- Kaji D., Tsukitani Y. Role of protein phosphatase in activation of KCl cotransport in human erythrocytes. Am. J. Physiol. 1991;260:C178–C182. doi: 10.1152/ajpcell.1991.260.1.C176. [DOI] [PubMed] [Google Scholar]
- Kelley S.J., Dunham P.B. Mechanism of swelling activation of K-Cl cotransport in inside-out vesicles of LK sheep erythrocyte membranes. Am. J. Physiol. 1996;270:C1122–C1130. doi: 10.1152/ajpcell.1996.270.4.C1122. [DOI] [PubMed] [Google Scholar]
- Lauf P.K. K:Cl cotransportsulfhydryls, divalent cations, and the mechanism of volume activation in a red cell. J. Membr. Biol. 1985;88:1–13. doi: 10.1007/BF01871208. [DOI] [PubMed] [Google Scholar]
- Lauf P.K., Adragna N.C. Temperature-induced functional deocclusion of thiols inhibitory for sheep erythrocyte K-Cl cotransport. Am. J. Physiol. 1995;269:C1167–C1175. doi: 10.1152/ajpcell.1995.269.5.C1167. [DOI] [PubMed] [Google Scholar]
- Lauf P.K., Adragna N.C. A thermodynamic study of electroneutral K-Cl cotransport in pH- and volume-clamped low K sheep erythrocytes with normal and low internal magnesium. J. Gen. Physiol. 1996;108:341–350. doi: 10.1085/jgp.108.4.341. [DOI] [PMC free article] [PubMed] [Google Scholar]
- Lauf P.K., Erdmann A., Adragna N.C. K-Cl cotransport, pH, and role of Mg in volume-clamped low-K sheep erythrocytesthree equilibrium states. Am. J. Physiol. 1994;266:C95–C103. doi: 10.1152/ajpcell.1994.266.1.C95. [DOI] [PubMed] [Google Scholar]
- Lytle C. A volume-sensitive protein kinase regulates the Na-K-2Cl cotransporter in duck red blood cells. Am. J. Physiol. 1998;274:C1002–C1010. doi: 10.1152/ajpcell.1998.274.4.C1002. [DOI] [PubMed] [Google Scholar]
- Lytle C., Xu J.-C., Biemesderfer D., Forbush B., III. Distribution and diversity of Na-K-Cl cotransport proteinsa study with monoclonal antibodies. Am. J. Physiol. 1995;269:C1496–C1505. doi: 10.1152/ajpcell.1995.269.6.C1496. [DOI] [PubMed] [Google Scholar]
- Minton A.P., Colclasure G.C., Parker J.C. Model for the role of macromolecular crowding in regulation of cellular volume. Proc. Natl. Acad. Sci. USA. 1992;89:10504–10506. doi: 10.1073/pnas.89.21.10504. [DOI] [PMC free article] [PubMed] [Google Scholar]
- Mitsui T., Kitazawa T., Ikebe M. Correlation between high temperature dependence of smooth muscle myosin light chain phosphatase activity and muscle relaxation rate. J. Biol. Chem. 1994;269:5842–5848. [PubMed] [Google Scholar]
- Namboodiripad A.N., Jennings M.L. Permeability characteristics of erythrocyte membrane to okadaic acid and calyculin A. Am. J. Physiol. 1996;270:C449–C456. doi: 10.1152/ajpcell.1996.270.2.C449. [DOI] [PubMed] [Google Scholar]
- Okada Y. Volume expansion-sensing outward-rectifier Cl− channelfresh start to the molecular identity and volume sensor. Am. J. Physiol. 1997;273:C775–C789. doi: 10.1152/ajpcell.1997.273.3.C755. [DOI] [PubMed] [Google Scholar]
- Parker J.C. Volume-activated cation transport in dog red cellsdetection and transduction of the volume stimulus. Comp. Biochem. Physiol. 1992;102A:615–618. doi: 10.1016/0300-9629(92)90713-z. [DOI] [PubMed] [Google Scholar]
- Parker J.C., Colclasure C., McManus T.J. Coordinated regulation of shrinkage-induced Na/H exchange and swelling-induced [K-Cl] cotransport in dog red cells. Further evidence from activation kinetics and phosphatase inhibition. J. Gen. Physiol. 1991;98:869–892. doi: 10.1085/jgp.98.5.869. [DOI] [PMC free article] [PubMed] [Google Scholar]
- Sachs J.R., Martin D.W. The role of ATP in swelling-stimulated K-Cl cotransport in human red cell ghostsphosphorylation–dephosphorylation events are not in the signal transduction pathway. J. Gen. Physiol. 1993;102:551–573. doi: 10.1085/jgp.102.3.551. [DOI] [PMC free article] [PubMed] [Google Scholar]
- Starke L.C., Jennings M.L. K-Cl cotransport in rabbit red cellsfurther evidence for regulation by protein phosphatase type 1. Am. J. Physiol. 1993;264:C118–C124. doi: 10.1152/ajpcell.1993.264.1.C118. [DOI] [PubMed] [Google Scholar]
- Stewart G.W., Blackstock E.J. Potassium transport in rabbit erythrocytes. Exp. Biol. 1989;48:161–165. [PubMed] [Google Scholar]
- Strange K., Emma F., Jackson P.S. Cellular and molecular physiology of volume-sensitive anion channels. Am. J. Physiol. 1996;270:C711–C730. doi: 10.1152/ajpcell.1996.270.3.C711. [DOI] [PubMed] [Google Scholar]
- Willis J.S., Anderson J.A. Activation of K-Cl cotransport by mild warming in guinea pig red cells. J. Membr. Biol. 1998;163:193–203. doi: 10.1007/s002329900383. [DOI] [PubMed] [Google Scholar]


