

Abstract
Patch-clamp experiments were used to compare membrane properties of mouse chromaffin cells in thin tissue slices and of isolated cells in primary culture. The mean membrane input resistance (Rin) and membrane capacitance were 3.1 ± 0.5 GΩ and 9.1 ± 0.5 pF in situ and 9.9 ± 1.8 GΩ and 8.2 ± 0.2 pF in isolated cells.
Spike-like currents were observed on top of the calcium currents during depolarizations in thirty out of forty-nine cells in situ. They were not seen in isolated cells nor after addition of Cd2+ (100 μm) and TTX (10 μm) to the perfusate of the slices. The mean Rin of cells which displayed current spikes (2.3 ± 0.18 GΩ) was significantly smaller than that of cells lacking spikes (3.9 ± 0.25 GΩ). It is suggested that the current spikes represent intercellular currents which result from action potential firing in neighbouring cells during the depolarization of the patch-clamped cell.
Investigation of capacitative currents induced by square voltage pulses showed a slow component in twenty-four out of twenty-seven cells in situ.
It is concluded that a large fraction of mouse chromaffin cells in situ are electrically coupled. From the slow capacitative currents and the amplitude of the intercellular current spikes a junctional conductance between chromaffin cells of below 1 nS was deduced.
This junctional conductance appears to be too low to support spreading of electrical activity in cases where a single cell is stimulated by an action potential. However, the junctional conductance could allow longer depolarizations of one cell or simultaneous firing of several cells to trigger electrical activity in neighbouring cells.
Detailed knowledge of membrane ionic currents in chromaffin cells of the adrenal medulla has been accumulated (see Artalejo, 1995 for review). While most of the work in situ has been done using sharp microelectrodes, patch-clamp studies have concentrated on isolated chromaffin cells in primary culture. The physiological relevance of findings in isolated cells depends on how the passive membrane electrical parameters of isolated cells compare with those of cells in situ.
Intracellular electrode recordings (Nassar-Gentina, Pollard & Rojas, 1988; Holman, Coleman, Tonta & Parkington, 1994) and patch-clamp measurements (Fenwick, Marty & Neher, 1982) reported comparable values for the resting membrane potentials of isolated and in situ cells. However, the estimates of other electrical parameters, such as membrane input resistance (Rin), differed substantially between the two preparations. Thus, in the isolated cells Rin was at least 5 GΩ, allowing for significant membrane potential changes to be measured upon openings of single channels (patch clamp; Fenwick et al. 1982). On the other hand, Rin values of 32-200 MΩ were reported from intracellular microelectrode measurements in situ (Ishikawa & Kanno, 1978; Nassar-Gentina et al. 1988; Holman et al. 1994). Possible reasons for the differences in the Rin estimates include electrical coupling between the chromaffin cells in situ and/or a larger leak conductance in experiments with sharp microelectrodes. There is morphological evidence for the presence of gap junctions in the mouse adrenal medulla (Grynszpan-Winograd & Nicolas, 1980). However, the extent of intercellular coupling between mouse chromaffin cells in situ has not yet been investigated.
In the present study patch-clamp measurements revealed gigaohm membrane input resistances in mouse chromaffin cells in both thin tissue slices and in primary culture. Therefore, as in isolated chromaffin cells, small membrane currents in chromaffin cells in situ can cause significant changes in membrane potential. The study provides evidence for low-conductance electrical coupling in a large fraction of cells in situ. The gap junctional conductance between mouse chromaffin cells is suggested to be below 1 nS.
METHODS
Adrenal slice preparation and preparation of isolated chromaffin cells
Adrenal glands of adult female NMRI mice were used for both slice preparation and cell isolation. Mice were anaesthetized with ether and killed by decapitation.
Slices (170-250 μm thick) were prepared as described before (Moser & Neher, 1997). Details of the cell isolation and primary culture have also been given before (Moser & Neher, 1997). In brief, collagenase A (Boehringer Mannheim, Germany) was used at a concentration of approximately 3 U mg−1 (in Locke's buffer) for digestion of the minced tissue. Cells were plated in M199 culture medium (including penicillin-streptomycin, 10 % fetal calf serum and 1 mg ml−1 albumin; Biochrom KG, Berlin, Germany) on poly-L-lysine-coated coverslips.
Horseradish peroxidase staining of neurobiotin-loaded cells
The slices with cells previously filled with neurobiotin were fixed in 4 % paraformaldehyde and 0.15 M phosphate buffer (PB) at pH 7.4 overnight. After treatment with 0.15 M PB containing 0.4 % Triton-X for 20 min, they were incubated in avidin-horseradish peroxidase complex for 2 h at room temperature (22-26°C). After a 30 min rinse in 0.15 M PB, slices were reacted in a solution of 0.05 % diaminobenzidine-0.003 % H2O2 in 0.15 M PB for 10-15 min. Staining was monitored under a microscope. Slices were then washed in 0.15 M PB and embedded in 0.15 M PB (+10 % glycerol) on glass slides.
Electrophysiology
All experiments were carried out in the tight-seal, whole-cell configuration of the patch-clamp technique (Hamill, Marty, Neher, Sakmann & Sigworth, 1981) using an EPC-9 patch-clamp amplifier run by ‘Pulse’ software (Heka, Lambrecht, FRG) on Macintosh computers. Pipettes (3-4 MΩ for slices, 2-3 MΩ for isolated cells) were pulled from borosilicate glass and thoroughly coated with Sylgard® (Dow Corning). The holding potential was usually -80 mV. All experiments were carried out at room temperature (22-26°C). Slices were used starting shortly after cutting for 6-10 h. They were fixed in the recording chamber (by a grid of nylon threads) and superfused with bubbled (95 % O2-5 % CO2) bicarbonate-buffered saline (BBS) at a flow rate of 1-2 ml min−1. Usually a cleaning pipette was used to remove loose material from the cell surface. Mouse chromaffin cells in situ are clustered and of ovoid or polygonal shape. Only cells displaying this type of organization were used for measurements. The initial seal resistance ranged from 5 to 15 GΩ. The access resistance was usually between 5 and 12 MΩ. Chromaffin cells in primary culture could easily be discriminated from cortical cells and fibroblasts by their round and smooth appearance. The initial seal resistance was usually above 10 GΩ and the access resistance ranged from 4 to 10 MΩ.
Data were filtered at 2 kHz and sampled at 12 kHz. For measuring the capacitative current, hyperpolarizing square pulses (50 mV) were applied from a holding potential of -60 mV and data were sampled at 40 kHz. Most of the capacitance of the pipette-pipette holder assembly could be neutralized in the cell-attached configuration using the ‘Cfast‘capacitance neutralization network of the EPC-9 (Sigworth, Affolter & Neher, 1995). After establishing the whole-cell configuration the ‘Cslow’ capacitance neutralization network of the EPC-9 (Sigworth et al. 1995) was used to determine cell membrane capacitance and access resistance.
Rin was estimated by two approaches. (1) For a number of cells it was calculated from the slope of the I-V relation in the voltage range between -80 and -50 mV. (2) In cells where a full I-V curve was not aquired, a linear I-V relationship at negative potentials was assumed and Rin was calculated as follows:
| (1) |
where Vhold is the holding potential, I is the current flowing at Vhold, and Vrev is the reversal potential of the membrane current flowing through the linear membrane conductance. Vrev was assumed to be the same as in the experiments where a complete I-V relationship was acquired (Vrev was -38.5 ± 2 mV in situ (n = 6) and -41 ± 3.7 mV in primary culture (n = 14), taken from the x-axis crossing of the linear fit to the current in the voltage range -80 to -50 mV). The liquid junction potentials of extracellular solutions against the caesium glutamate-based internal solutions were measured to be +10 mV for all extracellular solutions used and all clamp potentials were corrected accordingly. Currents were analysed using ‘Igor’ software (WaveMetrics, Lake Oswego, OR, USA). Data are given as means ±s.e.m. unless otherwise indicated. Student's paired t test was used for comparison of means.
Solutions and chemicals
The standard BBS (solution I) used for slice recordings contained (mM): 125 NaCl, 26 NaHCO3, 2.5 KCl, 1.25 NaH2PO4, 2 CaCl2, 1 MgCl2 and 10 glucose. For reduction of Ca2+ influx, we either omitted extracellular Ca2+ (replacing it with 2 mM MgCl2) or added 100 μM CdCl2. Our low-Ca2+ BBS (solution II) was identical to solution I except that it contained 0.1 mM CaCl2 and 3 mM MgCl2. All BBS solutions were adjusted to pH 7.4 by bubbling with 95 % O2-5 % CO2. The standard extracellular solution for experiments on isolated chromaffin cells (solution III) contained (mM): 150 NaCl, 2.8 KCl, 10 CaCl2, 1 MgCl2, 10 Na-Hepes (pH 7.2). Solutions I and III were supplemented with 200 μM d-tubocurarine to block small-conductance, Ca2+-activated potassium currents (SK potassium currents; Park, 1994).
All pipette solutions contained (mM): 145 caesium glutamate, 8 NaCl, 1 MgCl2, 2 Mg-ATP, 0.3 Na2-GTP (Boehringer Mannheim), 10 Cs-Hepes (CsOH was purchased from Aldrich). Solution IV contained 200 μM EGTA and no added Ca2+. Solutions V and VI were buffered to a [Ca2+] of about 300 nM using mixtures of free and calcium-loaded Ca2+ chelators. Solutions V and VI contained 1 mM free EGTA or BAPTA, respectively. Scatchard plot analysis was used to determine the KD for Ca2+ and the purity of BAPTA to be 220 nM and 98.8 %, respectively (the Ca2+ electrode was obtained from Microelectrodes Inc. (Londonderry, NH, USA) and Cs-BAPTA was obtained from Molecular Probes). EGTA was Ca2+ loaded as described in Neher (1988) and its KD for Ca2+ was assumed to be 150 nM. Neurobiotin and avidin-horseradish peroxidase complex were from Vector Labs (Burlingame, CA, USA). All other chemicals were from Sigma.
RESULTS
Comparison of electrical membrane parameters
Patch-clamp measurements of membrane capacitance (Cm) and membrane input resistance (Rin) were performed in both chromaffin cells in situ and in primary culture, as described in Methods. Chromaffin cells in situ showed a mean Cm of 9.1 ± 0.5 pF (n = 28; internal solution, solution IV) whereas isolated chromaffin cells had a mean Cm of 8.2 ± 0.2 pF (n = 79; internal solution, solution IV). The difference was statistically not significant (P > 0.05). This does not argue against low-conductance electrical coupling in situ (the presence of an additional slowly charged capacitance) since the capacitance neutralization network of the EPC-9 approximates a monoexponentially decaying capacitative current (Sigworth et al. 1995).
The membrane input resistance was estimated at negative membrane potentials (-80 to -50 mV). Analysis of the I-V relation in fourteen isolated cells gave a mean Rin of 9.9 ± 1.8 GΩ (see Fig. 1 for a typical example). In sixteen further cells a mean Rin of 7.1 ± 1.2 GΩ was calculated from the membrane current at -80 mV (see Methods). In situ the I-V relationship gave a value of 3.1 ± 0.5 GΩ (n = 6; see Fig. 1 for an example). In thirty-five further in situ cells, Rin was 2.8 ± 0.2 GΩ (calculated from the membrane current at -80 mV). The mean Rin was significantly smaller in situ than in isolated cells (P < 0.01 for both I-V and current analyses), consistent with the idea of an additional junctional conductance in situ.
Figure 1. I-V relationship for mouse chromaffin cells in situ and in primary culture.
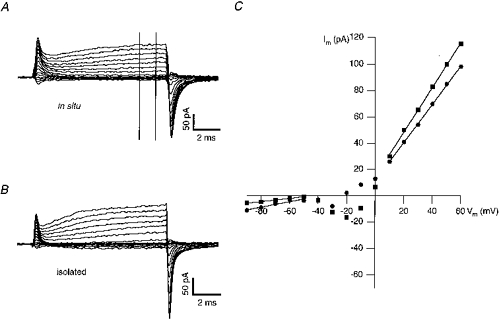
Cells were voltage clamped at -60 mV. Pulses of 10 ms from -90 to +60 mV, at 10 mV increments, were applied. Data from 2 cells are shown in A and B(A, slice; B, primary culture). The transient currents at the onset of the pulse are due to remaining (uncompensated) capacitance of the patch-clamped cells. The outward current at positive potentials probably represents current through some unblocked potassium channels. At the end of the pulse the current transients are larger than at the onset, most likely because tail currents added to the capacitative current. The external solution (solution I for in situ and solution III for isolated cells) was supplemented with 100 μM Cd2+, 10 μM TTX and 200 μM d-tubocurarine. C, currents in A and B were measured after reaching steady state (window indicated by vertical bars) and plotted vs. the corresponding potentials. Fits to the linear portions of the I-V curves gave slope conductances of 200 and 120 pS at negative potentials and 1.4 and 1.6 nS at positive potentials for the cell in situ and for the isolated cell, respectively. •, in situ; ▪, isolated cell, Im, membrane current; Vm, membrane potential.
Analysis of capacitative currents suggests low-conductance electrical coupling in chromaffin cells in situ
Capacitative currents were evoked by hyperpolarizing square pulses (amplitude, 50 mV) from a holding potential of -60 mV. In the presence of electrical coupling the resulting capacitative current should display at least two current components with different kinetics: a fast component due to charging of the membrane capacitance of the patch-clamped cell and a slow component caused by charging membrane capacitances of the neighbouring cells.
When the Cm of the patch-clamped cell was not compensated a double-exponential fit to the decaying current allowed for separation of two kinetic components in only six out of seventeen cells (for an example, see Fig. 2A). The fast current component had a mean decay time constant of about 10−4 s. The slow current component decayed with a mean time constant of 6.0 ± 1.2 ms. The mean apparent capacitance charged by the slow current component (calculated as the ratio of the integrated slow current component over the voltage increment) was 1.6 ± 0.33 pF. Since the slow current component was not recognized by a double-exponential fit in the majority of the cells, the capacitance compensation network of the EPC-9 was used to neutralize most of the Cm of the patch-clamped cell (Fig. 2B).
Figure 2. Capacitative currents during step hyperpolarization in chromaffin cells in situ and in primary culture.
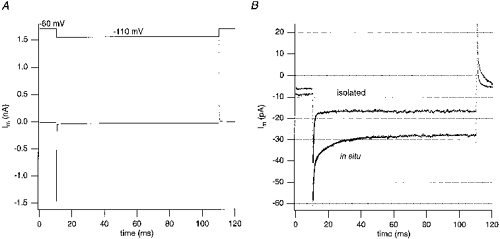
From a holding potential of -60 mV, a 50 mV hyperpolarizing pulse was applied for 100 ms. Twenty current responses were averaged for each cell. In these experiments the internal solution was solution IV, external solutions were solution I for slices and solution III for the isolated cells. A, mean capacitative current of a cell in situ without cancellation of cell membrane capacitance (Cm). The decaying current was fitted over a time range of 0.075-90 ms after the voltage step. In this particular cell the double-exponential fit (continuous line) allowed separation of 2 kinetic components. The fast current component had a decay time constant of 108 μs. The rapidly charged capacitance (estimated from the current integral of the fast component) was 5.6 pF. The capacitance charged by the slow current component (time constant, 10 ms) was 2.9 pF (estimated from the current integral of the slow component). B, data from the same cell as in A (in situ) and from an isolated cell after cancellation of Cm by the capacitance neutralization network of the EPC-9. The protocol was the same as in A. The decay of the remaining current transient was fitted over a time range of 0.125-50 ms after the voltage step. As for all cells, the double-exponential fit to the capacitative current recognized 2 kinetic components in both cells. In the in situ cell, the charging time constant and the capacitance of the slow component were comparable to the values obtained before Cm neutralization (10 ms and 2.4 pF). The slowly charged capacitance in the isolated cell was 0.21 pF.
Under these conditions, a double-exponential fit approximated two components (residual fast current and slow current) in all cells. When the results of twenty-seven cells were pooled a mean apparent capacitance of 3.4 ± 0.68 pF and a mean time constant of 11.7 ± 1.9 ms were estimated. In isolated chromaffin cells the same protocol revealed a mean slow capacitance component of 0.29 ± 0.05 pF charged with a mean time constant of 2.20 ± 0.73 ms (n = 10). Similar values were obtained with pipettes immersed in the bath solution but closed with Sylgard (0.28 ± 0.06 pF, 4.50 ± 0.57 ms, n = 3). These small, slow capacitative currents most likely result from a contaminating capacitance of the pipette-pipette holder assembly, which slowly decays, probably due to dielectric losses in the holder. In slices, the slow transient exceeds the size of this contamination by about ten times (see above) and the majority of the slow capacitative current is therefore ascribed to electrical coupling to neighbouring cells. The large decay time constant (11.7 ms) and the small mean initial amplitude (13.7 ± 1.3 pA, n = 27) of the slow capacitative current in slices indicate that the coupling is of low conductance.
In the expected serial combination of the total junctional conductance (Gj) of the patch-clamped cell and the capacitor representing the summed membrane capacitances of the neighbouring cells, the initial current caused by a voltage step is determined by the conductance Gj (see Fig. 3 for an equivalent circuit). From the mean initial current and the applied voltage change (50 mV), a conductance of 274 ± 25.6 pS (n = 27) was calculated. Besides the coupled membrane capacitance there is also some non-neutralizable capacitance of the pipette holder contributing to the slow capacitative current (see above). The ‘real’Gj was about 235 pS (after subtracting the mean non-coupling-related conductance of 39 ± 4 pS; eight experiments in isolated cells and with closed pipettes). It should be noted that the mean ‘apparent coupled capacitance’ of 3.4 pF deduced from the slow component most probably represents only a fraction of the capacitance coupled to the patch-clamped cell. At the low junctional conductances observed between chromaffin cells, the neighbouring cells cannot be clamped to the potential applied to the patch-clamped cell, because they do not behave like ideal capacitors. Under the assumption that a single cell of equal capacitance (mean, 9.1 pF) is coupled to the clamped cell, the mean value of 3.4 pF would mean that this second cell is charged up to 37.3 % of the applied potential. Still, the small capacitance value argues against electrical coupling of the patch-clamped cell to many neighbouring cells.
Figure 3. Equivalent circuit for a complex of electrically coupled chromaffin cells.
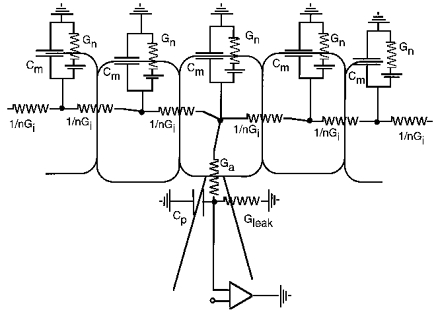
For simplicity, coupling is only shown in two dimensions and the circuit is extended only to the second row of neighbours of the patch-clamped cell. n, number of neighbours; Gj, total junctional conductance of a cell to its neighbours; Gn, non-junctional membrane conductance of a cell; Ga, pipette access conductance to the patch-clamped cell; Gleak, leak conductance; Cp, pipette-pipette holder capacitance; Cm, membrane capacitance.
If the slow capacitative current was due to electrical coupling, the Gj calculated from its size should positively correlate to the total measured conductance (the inverse of Rin). Figure 4 shows that such a correlation exists (correlation coefficient, 0.73; n = 25). The input resistances of the cells analysed were calculated from the membrane current at the holding potential (see Methods). The slope of the regression line (continuous line in Fig. 4) was approximately at unity. A slope of 1 would be expected if the total measured conductance was determined by the sum of a certain non-junctional conductance and the junctional conductance. The relation of total measured conductance versus junctional conductance, with a non-junctional conductance identical to that of isolated cells (1/Rin, estimated as for cells in situ), is shown by the dashed line in Fig. 4. The similar slope and y-crossings of the regression and the model line suggest that the lower mean Rin of in situ cells is mainly attributable to electrical coupling.
Figure 4. The total measured conductance is positively correlated to the junctional conductance estimated from the slow capacitative current.
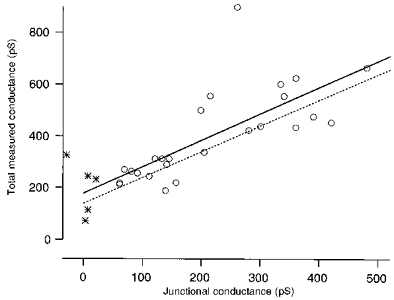
The total measured conductances were plotted vs. the conductance estimates obtained from the initial amplitude of the slow capacitative current in 25 experiments in situ (^) and 5 experiments on isolated cells ( ). From all data points, 39 pS were subtracted in order to correct for the mean contamination by the pipette holder. Two cells were excluded from both data sets for this analysis since they showed unstable resting currents (most likely due to leak). Total measured conductances and junctional conductances were positively correlated (r = +0.73) for slice cells. The regression line (continuous) had a slope of about 1. The dashed model line represents the total cell conductance resulting from a parallel combination of a fixed non-junctional conductance and an increasing junctional conductance. The mean total measured conductance of the isolated cells (1/7.1 GΩ, see Results) was used as the non-junctional conductance in the model.
Triggering of electrical activity in neighbouring cells by depolarization of the recorded cell
In in situ experiments, small current spikes riding on top of depolarization-induced currents were observed (Fig. 5). Such current spikes were not measured under conditions which block action potential (AP) generation (100 μM Cd2+ and 10 μM TTX, data not shown). Spikes were never seen in isolated chromaffin cells (n = 17). Therefore, these spike-like currents are interpreted as flowing across intercellular junctions during APs of neighbouring cells. The depolarization of the patch-clamped cell is assumed to trigger APs in neighbouring cells by injecting a small depolarizing current through the intercellular junctions. From the apparently coupled capacitance of 3.4 pF (see preceding section) it can be concluded that the neighbouring cell was charged to only 37 % of the potential of the patch-clamped cell. A depolarization to 0 mV of the patch-clamped cell is very likely to change the potential of the neighbour from the resting potential (around -60 mV; Fenwick et al. 1982) to above the threshold of sodium channels in chromaffin cells (-40 mV; Fenwick et al. 1982).
Figure 5. Depolarization of the patch-clamped cell triggers electrical activity in neighbouring cells in situ.
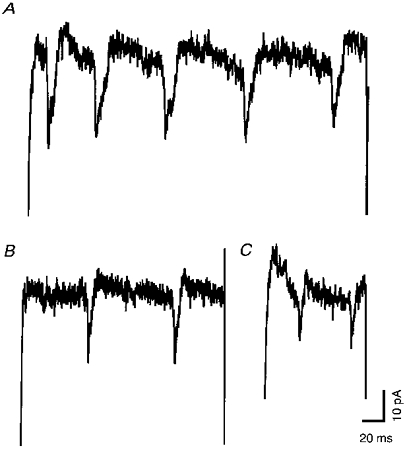
Cells were depolarized to 0 mV (A and B) or +50 mV (C) for variable durations (pipette solution, solution IV; external solution, solution I). With a variable delay after the onset of the depolarization, spike-like current transients riding on top of the voltage-activated calcium currents were observed. A, spike-like current transients recorded from the same cell as in Fig. 2A and B. The traces were corrected for the current decay due to Ca2+ channel inactivation. The spike amplitude (peak to the level reached during ‘hyperpolarization’) was approximately 30 pA. In this particular cell the first latency was shorter than 20 ms. The homotypic shape and the comparable (though increasing) interspike intervals suggest that the spikes resulted from APs of a neighbouring cell. B, representative trace of another cell with spike amplitude of approximately 30 pA but longer first latency (55 ms), thus closer to the latency observed in the majority of the cells. C, current spikes recorded during depolarization to +50 mV.
Two hundred and twelve current traces from forty-nine cells (depolarized to 0 mV for different durations) were analysed. Spikes were observed in thirty cells, irrespective of the type of pipette solution used. In twenty-two out of thirty cells, the homogeneous spike shape and amplitude as well as the regular interspike interval suggested that the spikes originated from only one neighbouring cell.
The shapes of the current spikes were very similar to that of APs (Fig. 6). A resistive rather than a capacitative transmission of the APs back to the clamped cell is favoured, since no signs of capacitative coupling were found (absence of clearly triphasic currents).
Figure 6. The shape of the current spikes is very similar to that of APs in Fig. 5.
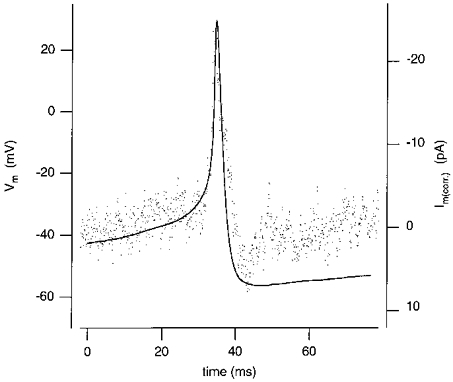
For comparison of the shapes, a current spike (Im (corr.), dots; identical to spike no. 2 in Fig. 5B but inverted in polarity) was overlayed with a mouse chromaffin cell AP (Vm, continuous line). Current spike and AP were aligned with respect to their peaks.
Spike amplitude was measured from the peak to the most positive values reached during the ‘repolarization’ (34 ± 2.3 pA, n = 30 cells). When depolarizing the patch-clamped cell to 0 mV, spikes appeared with a first latency of 46 ± 3.5 ms after the onset of depolarization. With 20 ms depolarizations spikes were observed only in two cells. The mean first latency was shorter (27 ± 7.3 ms) when depolarizing to +50 mV (mean spike amplitude, 36 ± 7.0 pA, n = 6 cells; Fig. 5C) as expected for a stronger depolarization and a voltage-independent junctional conductance. Considering the membrane time constant of mouse chromaffin cells in slices (2.8 GΩ× 9.1 pF = 25.5 ms), the latencies indicate that with the stronger depolarization the neighbour(s) would be charged to above the threshold within one membrane time constant, whereas with the weaker depolarizations, two membrane time constants would be needed.
In cells where spikes appeared to originate from only one neighbouring cell, the spike frequency was mostly below 20 Hz. There was no clear decline in spike amplitude during longer depolarizations (200-300 ms).
If the transmission to the patch-clamped cell was purely resistive, dividing the mean current spike amplitude by the maximal voltage shift during an AP of a neighbouring cell would yield the junctional conductance between the patch-clamped cell and its neighbour. The amplitude of APs was not directly measured in the neighbouring cell but the mean maximal voltage excursion during an AP (from peak to the level reached during hyperpolarization) was measured in separate current-clamp experiments to be 80 ± 0.9 mV (n = 32 traces). This value is comparable with results obtained in isolated bovine chromaffin cells (110 mV; Fenwick et al. 1982) and in guinea-pig chromaffin cells in situ (70-80 mV; taken from Figs 1 and 2 in Holman et al. 1994). Assuming the voltage amplitude of APs in neighbouring cells to be of the same size as that measured in the current-clamp experiments (80 mV), a conductance between two coupled cells of 425 pS (250-750 pS) was calculated. This, however, is an upper boundary, as a contribution from capacitative transmission cannot be completely ruled out.
No dye coupling between mouse chromaffin cells in situ
Gap junction channels are permeant to molecules up to 1 kDa (Flagg-Newton, Simpson & Loewenstein, 1979). This property has been exploited by the use of the low molecular weight tracers Lucifer Yellow (LY, 457 Da; e.g. Traub et al. 1994) and neurobiotin (323 Da, e.g. Peinado, Yuste & Katz, 1993) as indicators of cell coupling. Here, chromaffin cells in slices were loaded with either of these dyes (6 mM neurobiotin or 1 mM LY in solution IV) via the patch pipette for more than 10 min. In five out of six LY-loaded cells, depolarization-induced current spikes indicated electrical coupling. Capacitative currents suggested electrical coupling in all six cells. A strong fluorescent LY signal from the patch-clamped cell was observed, with the most intense emission coming from the nucleus. The patch pipette was removed from the cell (establishing the outside-out configuration) and photographs were taken after an additional 10 min. In all cases, staining of only a single nucleus (that of the patch-clamped cell) was observed. Moreover, there was no clear spreading of fluorescence with time (n = 6, three different slice preparations; a typical example is shown in Fig. 7A).
Figure 7. No clear spreading of Lucifer Yellow or neurobiotin into neighbouring cells.
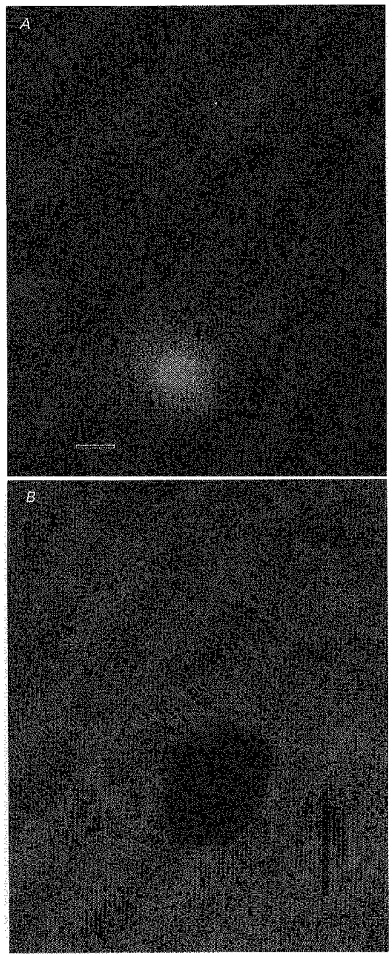
A, Lucifer Yellow-loaded cell. Bright field inspection revealed some swelling of the nucleus and the whole cell during the loading. The photograph was taken on a Zeiss Photomikroskop III microscope equipped with epifluorescence using a × 63 water-immersion objective about 20 min after removal of the patch pipette. Although electrical coupling was evident, there was no clear spreading of the dye to neighbouring cells. B, neurobiotin-filled cell. Fixation and HRP staining was done as described in Methods. Photographs were taken on a Zeiss Photomikroskop III microscope using a × 100 oil-immersion objective. Although the stained cell was electrically coupled, no clear neurobiotin spreading was detectable. Scale bar, 10 μm in both photographs.
In all neurobiotin-loaded cells, current spikes recorded during depolarization indicated electrical coupling with neighbouring cells. After fixation the neurobiotin-loaded cells (n = 5, three different slice preparations), slices were processed for the HRP staining (see Methods). Inspection at high magnification did not show clear spreading of the tracer to other cells (e.g. Figure 7B).
DISCUSSION
Passive electrical membrane parameters of chromaffin cells in situ
Tight-seal whole-cell recordings from mouse chromaffin cells in situ revealed membrane input resistances (Rin) in the gigaohm range. The mean Rin was significantly lower than that obtained in isolated mouse chromaffin cells (3.1 GΩ for in situ vs. 9.9 GΩ for in vitro). The mean cell membrane capacitances were not significantly different. Gigaohm Rin of chromaffin cells in situ indicate that, as in isolated chromaffin cells (Fenwick, 1982), small membrane currents can cause significant changes in membrane potential.
In the present study, pipette solutions contained Cs+ and d-tubocurarine to block potassium channels. Thus, one could argue that major conductances at negative membrane potential such as the d-tubocurarine-sensitive Ca2+-activated SK potassium conductance were blocked. However, similar Rin values were obtained in experiments with K+ in the pipette and no d-tubocurarine in the bath solution (2.1 ± 0.1 GΩ; n = 3). In addition, at least in patch-clamped isolated chromaffin cells, the potassium conductance is small at negative holding potentials and low [Ca2+]i (Fenwick et al. 1982; Neely & Lingle, 1992). Therefore the Rin estimate for resting cells in the present study should also apply for physiological ionic conditions.
Tetraethylammonium chloride did not affect the membrane potential of unstimulated mouse chromaffin cells in situ (Nassar-Gentina et al. 1988). Mouse chromaffin cells strongly express Ca2+-activated SK potassium channels (T. Moser, unpublished observation), which are relatively insensitive to tetraethylammonium chloride (Neely & Lingle, 1992; Park, 1994). It is therefore suggested that a larger leak conductance together with the thereby induced Ca2+-activated SK potassium conductance in intracellular microelectrodes experiments accounts for the major part of the difference in Rin estimates obtained by both recording techniques.
Electrical coupling in mouse adrenal chromaffin cells
This study presents evidence for low-conductance electrical coupling in the mouse adrenal medulla. The following three findings support this conclusion:
(1) Current spikes
In thirty out of forty-nine chromaffin cells in situ, small current spikes riding on top of a depolarization-induced calcium current were observed. These spikes were interpreted as junctional currents resulting from action potentials in neighbouring cell(s), since they were not seen in isolated cells or after addition of Cd2+ (100 μM) and TTX (10 μM) to the perfusate of the slices (data not shown). The mean voltage shift during a chromaffin cell AP (80 mV) and the mean current spike amplitude (34 pA) were used to infer an estimate of the junctional conductance (∼400 pS) between two chromaffin cells. This estimate is, surprisingly, somewhat larger than the mean total junctional conductance of a cell to its neighbours calculated from the capacitative currents (235 pS). The amplitude of the current spike might overestimate the cell-to-cell conductance since it cannot be ruled out that there is some contribution of capacitative transmission of the AP to the current spike amplitude.
Intracellular microelectrode membrane potential recordings have revealed small AP-like potential spikes in mouse chromaffin cells in situ (Nassar-Gentina et al. 1988) which were also interpreted as potentials caused by APs of neighbouring cells. These small AP-like potentials had a median of about 4 mV (taken from Fig. 3 in Nassar-Gentina et al. 1988). If one considers their membrane input resistance (102 MΩ at negative potentials), the current which caused the potential change of the cell membrane must have had an amplitude of 40 pA, which is comparable with the mean current spike amplitude reported here.
(2) Slowly charged capacitance
Square-pulse hyperpolarization of chromaffin cells in situ showed a slowly charged capacitance component which exceeded a contaminating capacitance attributable to the recording system. This capacitance most likely results from electrical coupling. However, it cannot be completely ruled out that other sources such as cellular processes, for example, contributed to the slow capacitative current. Ultramorphologically, microvilli are generally found in chromaffin cells (Grynszpan-Winograd, 1975). In the present study a visible cellular process was found in only one out of twelve stained chromaffin cells in situ. Such processes were not observed in the isolated chromaffin cells. If all the slow capacitative current was due to electrical coupling, still only a mean of 3.4 pF (instead of n × 9 pF, the number of coupled cells and the mean membrane capacitance of cells in situ) was charged. The low mean conductance of a cell to its neighbouring cell(s) was most probably not sufficient to completely charge the cell membrane capacitance of the neighbour(s). It should be noted that in the present study recordings were obtained only from superficial cells. Therefore, the total junctional conductance of chromaffin cells in the intact organ might be larger than the estimate of this study.
(3) Lower Rinin situ
The Rin estimates for chromaffin cells in situ were significantly lower than those obtained in isolated chromaffin cells. The inverse of Rin (the total measured conductance) and the total junctional conductance of a cell (estimated by capacitance analysis) were positively correlated (Fig. 4). When the regression line was back-extrapolated to zero junctional conductance, the total conductance was similar to that measured in isolated mouse chromaffin cells, indicating that the lower Rinin situ is primarily due to a parallel combination of non-junctional and junctional membrane conductances (as depicted in Fig. 3). A further piece of evidence supporting this hypothesis is the finding that the mean Rin was significantly lower in cells showing current spikes than in those lacking these spikes (2.3 ± 0.18 (n = 23) vs. 3.9 ± 0.25 (n = 13); P < 0.0001). Other possible reasons for low Rinin situ (e.g. larger membrane surface or lower seal resistance) are not likely to cause the observed difference to Rin values of isolated cells. Thus, the membrane capacitances do not differ significantly and a lower seal resistance would not be expected to correlate with the slow capacitative current.
The finding of electrical coupling by the present study is in agreement with a freeze-fracture study of the mouse adrenal medulla by Grynszpan-Winograd & Nicolas (1980), showing morphological equivalents of intercellular junctions.
Electrical coupling in the absence of dye coupling?
Gap junctional channels are formed by connexin (Cx) subunits which are coded for by genes of a large multigene family (Beyer, 1993). To the author's knowledge, so far no immunohistochemical data on the expression of connexins in the mouse adrenal medulla are available. Low or non-existent dye coupling, as in the present study (see Fig. 7A and B), has been shown for HeLa cells transfected with DNA for mouse Cx40 (Traub et al. 1994). However, Cx40 channels have been shown to inactivate rapidly with increasing transjunctional voltage (Hennemann et al. 1992; Traub et al. 1994) whereas in the mouse adrenal medulla there was no evidence for a major voltage-dependent decrease of electrical coupling. No or little voltage-dependent inactivation has been described for gap junctions formed by Cx43 (Swenson, Jordan, Beyer & Paul, 1989; Traub et al. 1994), which, on the other hand, support dye diffusion between coupled cells. It is possible that although the gap junctional channels were permeable to the dye molecules in the present study, the number of open gap junctions was too low to support sufficient dye spreading (Murphy, Hadley & Kater, 1983) in the 25-40 min allowed for dye diffusion. Taking the single channel conductances obtained for Cx43 (expressed in transfected HeLa cells, 60 and 40 pS; Traub et al. 1994) the upper estimate of the junctional conductance in a mouse chromaffin cell pair (approximately 400 pS) would correspond to 7-10 open gap junctional channels.
Is gap junctional coupling relevant for mouse chromaffin cell function?
Results presented here demonstrate that depolarization of one cell may trigger APs in neighbouring cells. However, low gap junctional conductance together with neighbours’ membrane capacitance and conductance will only allow delayed and incomplete charging of the coupled neighbour cell. The low cell-to-cell conductance will hardly lead to propagation of a single action potential. Gap junctional coupling, however, could allow longer depolarizations of one cell or simultaneous firing of several cells to trigger electrical activity in neighbouring cells. It has been suggested that the clusters formed by chromaffin cells may be functional units (Hillarp, 1946; Iijima, Matsumoto & Kidokoro, 1992). Each chromaffin cell receives its own synaptic input (Carmichael, 1986). Electrical coupling may therefore ensure activation of all cells within a cluster.
Acknowledgments
I am grateful to Dr Erwin Neher for advice and discussions. I would like to thank C. Pouzet for performing the HRP staining, Drs E. Neher, C. Smith, H. von Gersdorff and T. Müller for critical comments on the manuscript and F. Friedlein and M. Pilot for excellent technical assistance. This work was supported by grants of the HSFP (RG-4/95B) and the DFG (SFB 523) to E. Neher.
References
- Artalejo AR. The Electrophysiology of Neuroendocrine Cells. Boca Raton, Florida: CRC Press; 1995. Electrical properties of adrenal chromaffin cells; pp. 259–299. [Google Scholar]
- Beyer EC. Gap junctions. International Reviews of Cytology. 1993;137C:1–37. [PubMed] [Google Scholar]
- Carmichael SW. Morphology and innervation of the adrenal medulla. In: Rosenheek K, Lelkes P, editors. Stimulus-secretion Coupling. Vol. 1. Boca Raton, FL, USA: CRC Press; 1986. pp. 1–29. [Google Scholar]
- Fenwick EM, Marty A, Neher E. A patch-clamp study of bovine chromaffin cells and their sensitivity to acetylcholine. Journal of Physiology. 1982;331:577–597. doi: 10.1113/jphysiol.1982.sp014393. [DOI] [PMC free article] [PubMed] [Google Scholar]
- Flagg-Newton J, Simpson I, Loewenstein W. Permeability of the cell-to-cell membrane channels in mammalian cell junction. Science. 1979;205:404–407. doi: 10.1126/science.377490. [DOI] [PubMed] [Google Scholar]
- Grynszpan-Winograd O. Ultrastructure of the chromaffin cell. In: Greep RO, Astwood EB, editors. Handbook of Physiology section 7 Endocrinology Adrenal Gland. VI. Baltimore, Maryland: Waverly Press, Inc.; 1975. pp. 295–308. [Google Scholar]
- Grynszpan-Winograd O, Nicolas G. Intercellular junctions in the adrenal medulla: A comparative freeze-fracture study. Tissue and Cell. 1980;12:661–672. doi: 10.1016/0040-8166(80)90020-8. 10.1016/0040-8166(80)90020-8. [DOI] [PubMed] [Google Scholar]
- Hamill OP, Marty A, Neher E, Sakmann B, Sigworth F. Improved patch clamp techniques for high resolution current recordings from cells and cell-free membrane patches. Pflügers Archiv. 1981;391:85–100. doi: 10.1007/BF00656997. [DOI] [PubMed] [Google Scholar]
- Hennemann H, Suchyna T, Lichtenberg-Frate H, Jungbluth S, Dahl E, Schwarz J, Nicholson BJ, Willecke K. Molecular cloning and functional expression of mouse connexin40, a second gap junction gene preferentially expressed in lung. Journal of Cell Biology. 1992;117:1299–1310. doi: 10.1083/jcb.117.6.1299. [DOI] [PMC free article] [PubMed] [Google Scholar]
- Hillarp NA. Functional organization of the peripheral autonomic innervation. Acta Anatomica. 1946;4(suppl.):1–153. doi: 10.1111/j.1748-1716.1949.tb00558.x. [DOI] [PubMed] [Google Scholar]
- Holman ME, Coleman HA, Tonta MA, Parkington HC. Synaptic transmission from splanchnic nerves to the adrenal medulla of guinea-pigs. Journal of Physiology. 1994;487:115–224. doi: 10.1113/jphysiol.1994.sp020235. [DOI] [PMC free article] [PubMed] [Google Scholar]
- Iijima T, Matsumoto G, Kidokoro Y. Synaptic activation of rat adrenal medulla examined with a large photodiode array in combination with a voltage-sensitive dye. Neuroscience. 1992;51:211–219. doi: 10.1016/0306-4522(92)90486-l. [DOI] [PubMed] [Google Scholar]
- Ishikawa K, Kanno T. Influences of extracellular calcium and potassium concentrations on adrenalin release and membrane potential in the perfused adrenal medulla of the rat. Japanese Journal of Physiology. 1978;28:275–289. doi: 10.2170/jjphysiol.28.275. [DOI] [PubMed] [Google Scholar]
- Moser T, Neher E. Rapid exocytosis recorded from single chromaffin cells in mouse adrenal slices. Journal of Neuroscience. 1997;17:2314–2323. doi: 10.1523/JNEUROSCI.17-07-02314.1997. [DOI] [PMC free article] [PubMed] [Google Scholar]
- Murphy AD, Hadley RD, Kater SB. Axotomy-induced parallel increases in electrical and dye coupling between identified neurons of Helisoma. Journal of Neuroscience. 1983;3:1422–1429. doi: 10.1523/JNEUROSCI.03-07-01422.1983. [DOI] [PMC free article] [PubMed] [Google Scholar]
- Nassar-Gentina V, Pollard HB, Rojas E. Electrical activity of intact mouse adrenal gland. American Journal of Physiology. 1988;254:C675–683. doi: 10.1152/ajpcell.1988.254.5.C675. [DOI] [PubMed] [Google Scholar]
- Neely A, Lingle CJ. Two components of calcium-activated potassium current in rat adrenal chromaffin cells. Journal of Physiology. 1992;453:97–131. doi: 10.1113/jphysiol.1992.sp019220. [DOI] [PMC free article] [PubMed] [Google Scholar]
- Neher E. The influence of intracellular calcium concentration on degranulation of dialysed mast cells from rat peritoneum. Journal of Physiology. 1988;395:193–214. doi: 10.1113/jphysiol.1988.sp016914. [DOI] [PMC free article] [PubMed] [Google Scholar]
- Park YB. Ion selectivity and gating of small conductance Ca2+-activated K+ channels in cultured rat adrenal chromaffin cells. Journal of Physiology. 1994;481:555–570. doi: 10.1113/jphysiol.1994.sp020463. [DOI] [PMC free article] [PubMed] [Google Scholar]
- Peinado A, Yuste R, Katz LC. Extensive dye coupling between rat neocortical neurons during the period of circuit formation. Neuron. 1993;10:103–114. doi: 10.1016/0896-6273(93)90246-n. [DOI] [PubMed] [Google Scholar]
- Sigworth F, Affolter H, Neher E. Design of the EPC-9, a computer-controlled patch-clamp amplifier. 2. Software. Journal of Neuroscience Methods. 1995;56:203–215. doi: 10.1016/0165-0270(94)00129-5. [DOI] [PubMed] [Google Scholar]
- Swenson KI, Jordan JR, Beyer EC, Paul DL. Formation of gap junctions by expression of connexins in Xenopus oocyte pairs. Cell. 1989;57:145–155. doi: 10.1016/0092-8674(89)90180-3. [DOI] [PubMed] [Google Scholar]
- Traub O, Eckert R, Lichtenberg-Frate H, Elfgang C, Bastide B, Scheidtmann KH, Hülser DF, Willecke K. Immunochemical and electrophysiological characterization of murine connexin40 and -43 in mouse tissues and transfected human cells. European Journal of Cell Biology. 1994;64:101–112. [PubMed] [Google Scholar]