

Abstract
In this paper, we examine acetylcholine (ACh)-induced currents in quail fibroblast cell lines expressing either the fetal (Q-F18) or the adult (Q-A33) complement of nicotinic acetylcholine receptor subunits derived from mouse skeletal muscle. Pulses of ACh were applied to outside-out patches of cell membrane by means of a fast perfusion system, at concentrations from 100 nM to 10 mM. We obtained current records with intracellular potentials of -60 and +40 mV. The goal of this study was to estimate the channel opening rate.
By fitting sums of exponentials to averaged responses, we estimated the rate of development of the current on the application of acetylcholine. The rate constant of the predominant exponential component (the on-rate) ranges over 3 orders of magnitude, from around 100 s−1 (fetal) at low concentrations of ACh to over 100 000 s−1 (fetal and adult) at the highest concentrations.
We establish that our measurement of the on-rate is not limited by technical constraints, and can therefore be related to the rate constants of a kinetic scheme. Our observations are consistent with a model having a rate-limiting channel opening step with a forwards rate constant (β) of 80 000 s−1 on average for adult receptors and 60 000 s−1 for fetal receptors, and a minimum opening to closing ratio (β/α) of around 33 (adult) or 50 (fetal). The channel opening rate, β, varies from around 30 000 s−1 to well over 100 000 s−1 for different patches. The large variation cannot all be ascribed to errors of measurement, but indicates patch to patch variation.
The muscle nicotinic receptor contains two binding sites for acetylcholine and a cation-selective ion channel. Previous studies have shown that the channel is much more likely to be open after two agonist molecules have bound to the receptor, and that opening is rapid when both sites are occupied (Adams, 1981; Lingle, Maconochie & Steinbach, 1992; Edmonds, Gibb & Colquhoun, 1995). However, the channel opening rate is not known with a high degree of reliability. In large part, the uncertainty is due to the fact that the estimates for the channel opening rate, β, are very large, and so technical problems have made it difficult to obtain unambiguous results. An additional problem is that there are complexities in the gating of the muscle nicotinic receptor which can make it difficult to interpret the results of studies of single channel currents (Lingle et al. 1992).
Two types of the muscle nicotinic receptor have been described, the ‘fetal’ and the ‘adult’ type, which differ in their physiological and pharmacological properties (Mishina et al. 1986). Each type is known to be formed by the association of five monomeric subunits. Both types contain two α1-subunits, one β1-subunit and one δ-subunit, while the fetal type contains, in addition, one γ-subunit and the adult type one ε-subunit (Mishina et al. 1986).
Most estimates of the channel opening rate have been based on the interpretation of brief closed periods seen in records of single channel currents. This approach involves different assumptions when low or high concentrations of ACh are used. With low concentrations, brief closures within a ‘burst’ of openings are interpreted as the momentary closure of the channel of an individual receptor without loss of ligand, whereas longer closures involve the dissociation of ACh. When a simple scheme for receptor gating is assumed, the rates for channel opening and ACh dissociation can be calculated from the duration and frequency of the brief closures (Colquhoun & Hawkes, 1982). With high concentrations of ACh, the association rate is assumed to be so large that the mean duration of the brief, activation-related closures is simply the inverse of the channel opening rate.
The behaviour of single channel currents, recorded from several different preparations, has been studied and estimates for the channel opening rate, β, have generally been large. However, interpretation of single channel records requires assumptions both about the kinetic scheme involved and about which events in the data correspond to which aspects of the model. It is common to find more than a single component contributing to brief closures in a record, and it is not clear which components may be considered to be related to activation and which arise from other mechanisms. This ambiguity is of particular concern with high concentrations of ACh, at which channel block by ACh creates difficulties of interpretation (Sine & Steinbach, 1984). A second significant limitation is that the closed periods are so brief that their estimated mean duration is usually less than the resolution of the apparatus. The mean duration must therefore be extrapolated from the distribution of the detected events, with a corresponding uncertainty in the estimate for the mean. These complicating factors have been considered and discussed by several authors, including Colquhoun & Sakmann (1985), Sine & Steinbach (1986, 1987) and Zhang, Chen & Auerbach (1995). Finally, this approach utilizes records obtained in the presence of a steady concentration of agonist, raising concerns that parameter estimates may not be representative of a response to a more physiological stimulus. Hence, it would be valuable to obtain estimates of the channel opening rate by alternative methods.
An attractive alternative approach is essentially to duplicate synaptic transmission at the neuromuscular junction and produce rapid changes in acetylcholine concentration. This has the advantage that receptors are in a known ‘resting’ state before the application begins, and so some of the complications inherent in the interpretation of single channel records are avoided. Interpretation of the results still requires the assumption of a particular kinetic scheme. However, for many simple kinetic schemes, all that is required is that at high agonist concentrations the agonist association rate will become so fast that the time course at which the response develops will be determined by the final channel opening step.
The principle challenge is to make solution changes sufficiently fast that complicated manipulations of the data are not required to extract an expected value of β. Some attempts have been made to produce steps by photolysis of ‘caged’ agonists (Chabala, Gurney & Lester, 1986; Matsubara, Billington & Hess, 1992). These efforts have been complicated by several factors. One is that the precursors may have actions as agonists or antagonists (Chabala et al. 1986). A second is that the reaction involved often has a relatively slow time course (Matsubara et al. 1992), so that agonists producing a high opening rate (such as ACh itself) cannot be studied with this approach.
The main alternative method for producing rapid concentration changes is the ‘fast plumbing’ approach, in which the external medium is changed extremely rapidly at the surface of an excised patch of membrane (Brett, Dilger, Adams & Lancaster, 1986; Maconochie & Knight, 1989; Franke, Hatt, Parnas & Dudel, 1991). In this paper, we use the ‘fast solution change’ approach to examine the rate of rise of the response of acetylcholine receptors (AChRs) to an application of ACh, and from our measurements deduce new estimates of β from both adult- and fetal-type receptors.
METHODS
Cell culture
The cells used in this study are Q-A33 and Q-F18. Q-A33 and Q-F18 denote clones of a quail QT-6 fibroblast line that have been transfected with fetal (α, β, δ and γ) or adult (α, β, δ and ε) types of mouse muscle nicotinic acetylcholine receptor (nAChR) subunits, respectively. These clones were also transfected with a gene inducing resistance to the antibiotic geneticin (G-418). Stable clones were selected as described previously (Phillips, Kopta, Blount, Gardner, Steinbach & Merlie, 1991; Kopta & Steinbach, 1994).
We obtained cells expressing a high density of surface receptors by the process of selective adhesion (Barker, Worman & Smith, 1975) to plastic Petri dishes coated with monoclonal antibody mAb-35 (Chen, Fletcher & Steinbach, 1995).
Cells were cultured in medium 199 (Gibco) including 10 % tryptose phosphate broth (Gibco), 5 % fetal bovine serum (Hyclone Laboratories, Logan, UT, USA), 1 % dimethyl sulphoxide (Sigma Chemical Co.), 100 units ml−1 penicillin, 100 μg ml−1 streptomycin, and 150 μg ml−1 G-418 (Gibco). Cells were passaged every 3-4 days. For electrophysiological recording, cells were plated on collagen-coated glass coverslips in the usual culture medium but without G-418, and used for recordings between 24 and 48 h.
Recordings
All our records were made from patches in the outside-out configuration (Hamill, Marty, Neher, Sakmann & Sigworth, 1981). Patch pipettes of 3-5 MΩ were produced from Kimax (Kimble Glass, Toledo, OH, USA) standard-wall glass (1.4 mm o.d.) and were fire polished. Currents were measured with an EPC7 amplifier (List) and digitized at 20 kHz to 1 MHz (DAS50, Keithley-Metrabyte, Taunton, MA, USA). All experiments were performed at ambient room temperature (20-23°C).
Data were filtered using an analog 5-pole Bessel filter. Some responses to high agonist concentrations were filtered only by the bandwidth characteristics of the patch-clamp amplifier and pipette combination, which is approximately 75 kHz at the -3 dB point (Maconochie, Fletcher & Steinbach 1995). These data were subsequently filtered digitally using a sinc or sin(x)/x function, truncated at the third minimum or above by a raised cosine window. In the frequency domain this function resembles a square aperture, i.e. it has a steep roll-off.
The intracellular (or transmembrane) potential relative to ground was assumed to be equal to the pipette holding potential (Vp), and no corrections were made for either junction potentials or series resistance error. The real transmembrane potential difference is likely to differ from Vp by no more than about 5 mV.
Extracellular solution contained (mM): NaCl, 150; KCl, 5; MgCl2, 2; CaCl2, 2; Hepes, 10 (pH adjusted to 7.4 with NaOH). Pipette filling solution for outside-out patch recordings contained: CsCl, 140; MgCl2, 2; EGTA, 1; CaCl2, 0.1; Hepes, 10; TEA, 10; Na2ATP, 5; dithiothreitol, 0.3 (pH adjusted to 7.4 with NaOH).
Solution changes
Solution changes were made essentially according to the methods of Maconochie & Knight (1989), except that faster perfusion speeds were used. The timing of valve switching and data acquisition was determined by software written in Assembler and using the PC timer chip in the acquisition computer. The accuracy of timing was therefore better than 1 μs. The exact moment of the solution change varies a little from one application to another, which we attribute to chaotic fluid motions in the recording bath. At best, the moment of the solution change is reproducible to around 6 μs, although with a few data sets, the variation is hundreds of microseconds.
Each day that we performed experiments, and several times during that day, we checked the speed of the solution change by following the time course of junction potential changes at an open patch pipette on doubling the external NaCl concentration. Two further checks were performed with equivalent results (as described by Maconochie & Steinbach, 1995): changes in the NaCl concentration were applied to intact outside-out patches, and also to a patch containing open AChRs.
Junction current time course
Figure 1 shows the time course of three solution change protocols used in obtaining the data presented in this paper. The nominal durations of the agonist application are 50, 20 or 2 ms (Fig. 1A, B and C, respectively). The 2 ms protocol was used for the application of high concentrations of agonist. The brief duration of the agonist pulse helps to minimize the amount of desensitization during a response and therefore allows faster repeat rates. The 20 ms protocol was used for generating responses to high ACh concentrations as displayed in Figs 3 and 4. A comparison of D and F in Fig. 1 shows that the 10-90 % rise times for the start of each agonist application are similar, so that either protocol is suitable for recording relaxations immediately following the start of an application of ACh. A similar comparison of E and G in Fig. 1 shows that the shorter protocol has a faster 10-90 % rise time at the end of the application, making it more suitable for recording relaxations following the removal of agonist. Most of the data presented in this paper were generated from the 50 ms and the 2 ms solution change protocols.
Figure 1. Open pipette junction current changes.
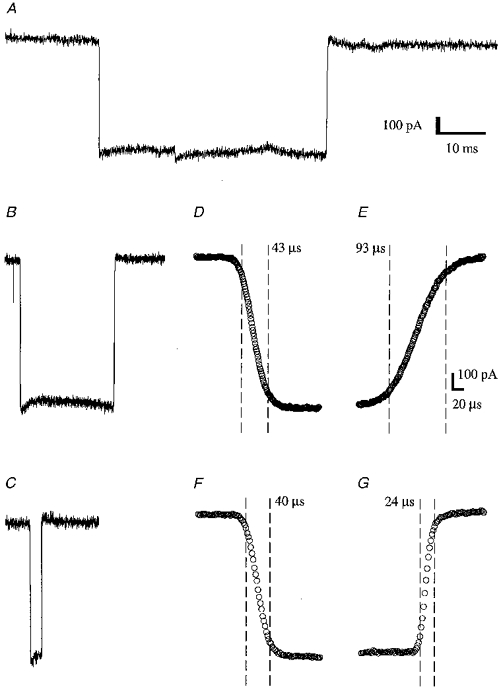
A shows the current recorded from an open pipette when the NaCl concentration was changed from 150 to 300 mM. The duration of the step is approximately 50 ms. B and C show, on the same scale, a 20 ms and a 2 ms step, respectively. D-G show the leading and trailing edges of the 20 and 2 ms steps. The vertical dashed lines indicate the points that lie nearest to 10 and 90 % of the solution change, with the 10-90 % rise time written close by. The speed of the solution change depends upon a number of parameters: the perfusion speed, the angle between the perfusion pipes and the precise valve timing all play a part. Finding a combination that gives a fast solution change is a matter of trial and error. Although some of our data (the data of F-K in Figs 2 and 3) were collected using the 20 ms protocol (trace B), most of our data were collected using the 50 ms protocol to apply low ACh concentrations (trace A) and the 2 ms protocol to apply the high concentations (trace C). Although the 2 ms protocol has a faster offset 10-90 % rise time (trace G) than the 20 ms protocol (trace E), the onset times (traces D and F) are nearly identical, so either protocol is suitable for the measurement of on-rates. Data were digitized at 30 kHz (A), 1 MHz (B, D and E) or 500 kHz (C, F and G). A, B and C are single responses; D-G are each averages of 12 responses.
Figure 3. Examples of the current recorded from a single outside-out-patch isolated from a Q-F18 cell, expressing fetal receptors, in response to applications of ACh over a wide concentration range.
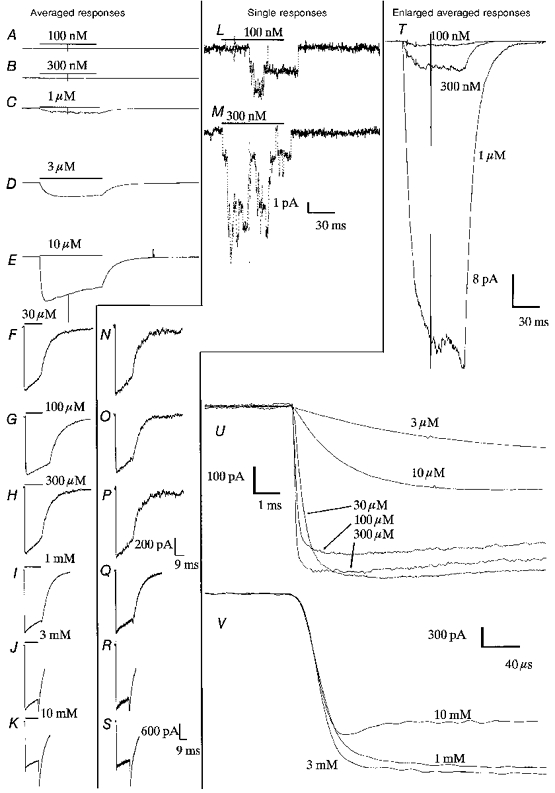
The patch was voltage clamped to Vp = -60 mV. In the far left-hand column are averages of many single responses (A-K). The middle column shows examples of a single response (L-S). The right-hand column (T-V) shows averaged traces enlarged so that the initial rate of rise of current may be discerned. The scale bars relate to the traces above them; for example, traces A-H and N-P have the same scale bar, shown to the right of trace P. The data were collected in the following order: 10 mM, 3 mM, 1 mM, 100 nM, 300 nM, 1 μM, 3 μM, 10 μM, 30 μM, 100 μM, 300 μM. For each concentration, data were collected at two potentials, +40 mV and -60 mV. During the course of the experiment, the currents appeared to run down to a little less than half their original value. The responses to the first three concentrations of ACh are therefore shown scaled down in comparison with the rest of the data. Data were filtered at 3 kHz, 4-pole Bessel, -3 dB (100 nM to 10 μM); 10 kHz, Bessel (30 μM to 300 μM); 75 kHz, the amplifier bandwidth (1 mM to 10 mM). Data were then digitized at 30 kHz (100 nM to 10 μM); 100 kHz (30 μM to 300 μM); 500 kHz (1 mM), 1 MHz (3 mM and 10 mM). For display here, the data are either not filtered further (10 μM to 300 μM) or filtered with a digital sinc filter (see Methods) at 2 kHz (100 nM to 3 μM) or 50 kHz (1 mM to 10 mM). The number of single responses averaged was 60 (100 nM to 3 μM), 20 to 50 (10 μM to 100 μM) or 10 (300 μM to 10 mM).
Figure 4. Examples of patch current recorded with Vp = +40 mV.
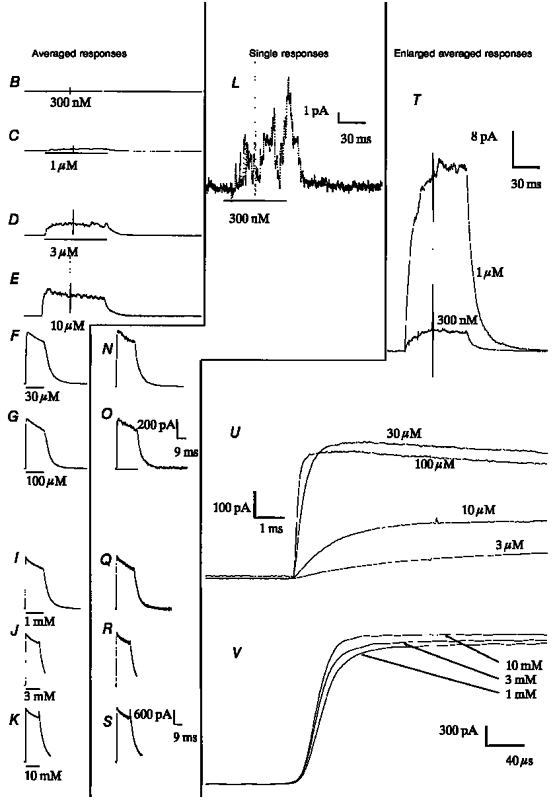
The data shown were recorded from the same patch as the data shown in Fig. 2. Except that Vp is +40 mV and not -60 mV, all conditions and subsequent processing are the same as in Fig. 2. No responses to 100 nM ACh were recorded.
In Fig. 1, we present the time course of the change in junction current as the NaCl concentration is approximately doubled. The time course of the junction current can only be used as a direct indicator of the time course of the solution exchange if the one is a linear function of the other. The junction current between two dissimilar ionic compositions is not, in general, a linear function of the ionic concentration. However, over a sufficiently small range, a linear approximation will suffice for our purposes. In Fig. 2, we show measurements of the change in junction current at a patch pipette, on changing the external NaCl concentration from 150 mM to a higher value. In the range 150 mM to 1 M, the relationship is substantially non-linear (circles). For a concentration jump of 150 mM to 1 m, the junction current is half-way to its final value when the NaCl concentration is only 340 mM, which represents a change of around 24 % (Fig. 2, dotted lines). Thus, a concentration jump to 1 M NaCl is not an appropriate way of estimating the time course of the solution exchange. Over the small range 150-300 mM, the relationship of the NaCl concentration to the junction current is closer to being linear, so that the junction current is 50 % of the way to the final value when the solution exchange is around 50 % complete (Fig. 2, squares and dashed lines). A concentration jump of 150 to 300 mM NaCl is therefore an appropriate way of estimating the time course of the solution exchange.
Figure 2. The junction current as a function of the NaCl concentration.

The junction current at a 3 MΩ pipette filled with 150 mM KCl was followed as the external NaCl concentration was increased from 150 mM to a range of values. The junction current was measured while the pipette was being perfused with 150 mM NaCl and again while the pipette was perfused with a higher NaCl concentration (200-1000 mM). The difference between these two measurements is plotted (^) as a function of the NaCl concentration. The relationship is non-linear. However, over the small range 150-300 mM, the non-linearity is less extreme. This range (150-300 mM) is expanded to match the full range and plotted as squares. The dotted and dashed lines indicate the percentage solution change necessary for a 50 % change in the junction current.
Computer analysis
Most digital processing of the data (alignment, filtering, fitting with sums of exponentials, and plotting for display purposes) was performed on a PC clone using the software package VIEWMENU (available as DELPX02 from the following sources: gopher://sunsite.doc.ic.ac.uk/1/computing/systems/ibmpc/simtel/msdos/math" or http://www/acs/oakland.edu/oak/simtel/msdos/math). A detailed description of these processes may be found in Maconochie & Steinbach (1995) and Martin, Maconochie & Knight, (1994). Simulations of the time course of responses were made as described below.
Kinetic scheme for simulations
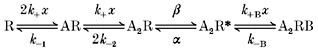
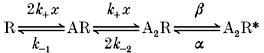
We have used, for the purposes of computer simulation of current responses, a simple linear kinetic scheme based on the model of del Castillo & Katz (1957).
In this scheme, R is the nicotinic ACh receptor, A is an agonist molecule (ACh) and x its concentration, R* represents the open conformation of the associated ion channel, and B is a molecule of a blocking ligand (in this case also ACh). k+, k-1 and k-2 are the microscopic rates of binding and unbinding and α and β are the channel closing and opening rate constants. This scheme implies a view of the receptor in which there are two initially equivalent binding sites, and where a ligand may bind to either site with an identical assocation rate. We allow for the possibility that the unbinding of a ligand may be affected by the presence of a ligand on the other site by allowing k-2 to be different from k-1, but assume that the forwards binding rate k+ is unaffected.
Generation of current simulations
Colquhoun & Hawkes (1977) show how to use the methods of Eigen & de Maeyer (1963) to calculate the open probability of an AChR as a function of time, using the rate constants of a kinetic scheme such as Scheme 1. Their approach is unsuitable here because it relies on the ACh concentration being constant after a jump. All real solution changes take place over a finite period of time, so a different approach is needed. Scheme 1 may also be described by a series of differential equations. These may be integrated numerically to obtain a description of Scheme 1 as a function of time. The integration was performed using the Runge-Kutta method (subroutine OdeInt, with adaptive step-size control: Press, Teukolsky, Vetterling & Flannery, 1992). This generates estimates of the occupancy of each of the states in Scheme 1 at a series of discrete, although not equally spaced, times. The current, as an equally spaced time series, was then determined by decimation or linear interpolation of the time course of the open state A2R* of Scheme 1.
Scheme 1.
The other part to the procedure of generating simulated responses to a change in the ACh concentration is the provision of a description of the ACh concentration as a function of time, so that at each step in the numerical integration of Scheme 1, the exact agonist concentration may be calculated. Since junction current changes, as measured at an open patch pipette, are sigmoidal in shape, we use the following function to represent the ACh concentration as a function of time:
| (1) |
In eqn (1), G is the profile of the solution change (ranging from 0 to 1), t is time, tm is the mid-point of the solution change, and τ is a constant determining the rise time of the solution change.
Estimation of the channel opening rate and solution change time by modelling
We have attempted to simulate some of our recorded responses to applications of 10 mM ACh. We have used a combination of eqn (1) to describe the solution change and integration of Scheme 1 to produce the current as a function of time. To get the best fit to the recorded data, various parameters including the channel opening rate (β) and the solution change time (τ) have to be adjusted. Thus, we can use this approach to estimate τ and β.
The response of an unknown number (N) of AChRs to an application of 10 mM ACh with a sigmoidal time course was generated as described above, by numerical integration of Scheme 1. At each integration step, the ACh concentration (x) was calculated from eqn (1), to obtain the ligand binding rates k+x and k+Bx.
In the case of data recorded with Vp at +40 mV, the parameters tm, τ, N, β, k+B and k-B were adjusted to give the best least-squares representation of a data trace over a short range that encompassed the initial onset of the response. For data recorded at -60 mV, the values of k+B and k-B were estimated directly from each averaged response examined, by calculating the rate and amplitude of the relaxation from the blocked state (Maconochie, Fletcher & Steinbach, 1995). Therefore the only parameters that needed adjusting were tm, τ to describe the time course of the concentration change, N to scale the amplitude of the response and β. The remaining parameters α, k+, k-1 and k-2 were fixed to values that varied with the cell type and the potential and were taken from our unpublished observations of a selected set of data for each cell type. The values used for these parameters are given in the legends to Figs 7 and 8. A Levenberg-Marquardt approach was used to reduce the sum of squared differences between the data and the simulation.
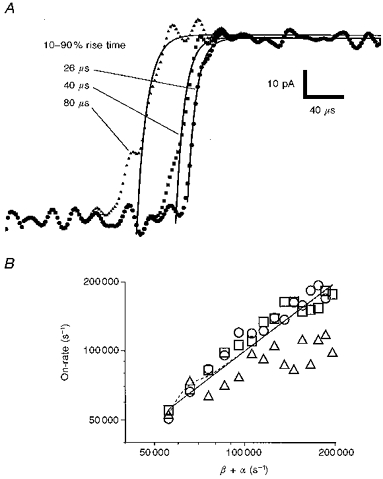
Figure 7. Comparing on-rate measurements with α+β derived from time course fitting.
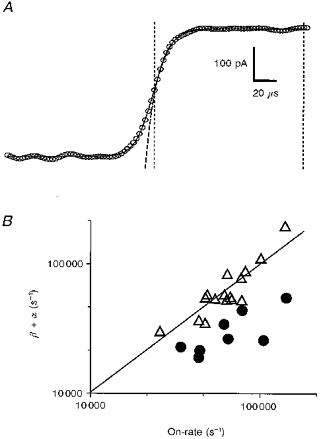
A shows the time course of an averaged response of a patch containing adult receptors to 10 mM ACh, at +40 mV. Overlaid is a continuous curve that is the result of a Runge-Kutta simulation of the response of Scheme 1, assuming a sigmoidal solution change profile with a 10-90 % rise time of 24 μs (see Methods). Also overlaid, as a dashed line, is a single exponential fit to the section of data indicated by the two vertical lines. From the Runge-Kutta simulation, we obtain a value for α+β (51 000 s−1 for the response shown). From the exponential fit, we have the on-rate (78 000 s−1 for the response shown). In B, we plot α+β against the on-rate for data recorded from both adult and fetal receptors for Vp = +40 mV (▵) and find that data lie close to the line representing equivalence. In contrast, when Vp = -60 mV (•), the on-rate does not correspond to α+β (data only available from fetal receptors). For all the simulations, k+ was fixed at 2.5 × 10⁸ M−1 s−1. Other rate constants, k-1, 2k-2 and α were fixed to, respectively, 33 000, 32 000 and 5700 s−1 (adult, +40 mV), 16 000, 55 000 and 505 s−1 (fetal, +40 mV) or 8800, 42 000 and 280 s−1 (fetal, -60 mV). For all the simulations at +40 mV, k+B and k-B were allowed to vary. For the simulations at -60 mV (fetal), k+B and k-B were assigned a different value for each trace fitted, the values for which were estimated from the rapid unblock of channels on the removal of 10 mM ACh (e.g. Fig. 3K). No suitable data were available for the adult type receptor for Vp= -60 mV.
Figure 8. The influence of channel ‘block’ and finite solution change times on the shape of the initial response to 10 mM ACh.
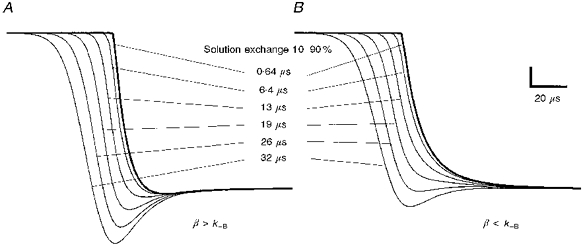
The data in this figure have been synthesized using a combination of the kinetic scheme (Scheme 1) and eqn (1) describing the solution change profile. They are simulations of the response of fetal receptors to 10 mM ACh at -60 mV. The procedure is described in the Methods section. The six curves in A and B correspond to the simulated response of an ensemble of AChRs, at -60 mV, to 10 mM ACh. Each curve is the result of a simulation with a different τ (in eqn (1)), producing the 10-90 % rise times indicated in the figure. The following rates constants were used: k+ = 2.5 × 10⁸ s−1 m−1, k-1 = 8800 s−1, 2k-2= 42000 s−1, k+B = 6 × 10⁶ s−1 m−1, k-B = 60 000 s−1, α = 280 s−1, β = 80 000 s−1 (A) or 40 000 s−1 (B).
RESULTS
The raw data
The data presented in this paper were recorded from outside-out patches of cell membrane, isolated from cultured fibroblast cells expressing subunits for fetal (Q-F18) or adult (Q-A33) types of nAChR (Kopta & Steinbach, 1994). All the data of Figs 3 and 4 were recorded from a single outside-out patch isolated from a Q-F18 cell. They represent the current recorded on the application of a range of concentrations of ACh, and at two holding potentials: Vp=+40 mV (Fig. 4) and Vp= -60 mV (Fig. 3). From a visual examination alone, we can draw inferences about the concentration dependence of the onset and peak amplitude of the current, the concentration and voltage dependence of what appears to be ‘open channel block’, and about desensitization. Data from some patches also show an initial current overshoot in the response to 10 mM ACh at -60 mV (Fig. 3, K, S and V). These qualitatively apparent aspects of our data are described in more detail below.
The concentration dependence of the peak amplitude and the rate of onset of the current
The responses shown to the far left of each part of Figs 3A-K and 4B-K are averages of many responses. Most of the data (Figs 3A-H and 4B-H) are displayed with a common scaling so that changes in the peak amplitude of the response are obvious. We see that the response to ACh gets larger with increasing ACh concentrations, saturating at around 30 μM.
On the far right of Figs 3 and 4 (T-V) we show sections of the averaged responses enlarged and overlaid to emphasize differences in the time course of the onset of the response. The responses to 100 nM, 300 nM and 1 μM have a similar and slow rate of rise, and appear to differ mainly in size (Figs 3T and 4T). Above 1 μM, the onset of the response gets faster with increasing ACh concentrations. This can be seen most clearly in U and V in Figs 3 and 4, where averages of ten to sixty single responses are shown enlarged and overlaid. In contrast to the concentration dependence of the amplitudes, the onset of the response continues to get faster as the ACh concentration increases above 30 μM, although the change in the rate of onset over 1-10 mM ACh is small.
Channel block
On the removal of 1 to 10 mM ACh from the patch at -60 mV (Fig. 3I-K) and to a lesser extent at +40 mV (Fig. 4J-K), there is an abrupt increase in current. This process can be attributed to the relief from the effects of fast self-inhibition by ACh. The block of open channels by molecules of ACh has been described by Sine & Steinbach (1984) and Ogden & Colquhoun (1985). The process of fast self-inhibition by ACh is more complex than can be accounted for by a simple model of open channel block and is better represented by models with at least two blocked states (Maconochie & Steinbach, 1995). We shall for the sake of brevity use the term ‘block’, and use Scheme 1 with only a single blocked state, since for our purposes here, it gives a sufficiently accurate representation of the data. Examining the response to 10 mM ACh, at -60 mV (Fig. 3K), we see that the current nearly doubles in size on the removal of ACh from the patch. This suggests that immediately before the removal of ACh, approximately half of the channels that might otherwise have been open were instead in a closed or ‘blocked’ state from which they were able to return rapidly to an open state.
An initial current ‘overshoot’
A further feature is evident in the response of this patch to 10 mM ACh at -60 mV (Fig. 3K, S and V). In the data shown, there is an initial ‘overshoot’ of the current lasting around 40 μs. Following the fast onset of the response, there is a decline in the current of around 10 % over 40 μs to a relatively constant plateau (but see the description of desensitization that follows). This feature is apparent in eleven of fifteen responses to 10 mM ACh of patches with adult receptors and five of twenty patches with fetal receptors. In other experiments (for example see Fig. 5A and D), an overshoot was not present. A similar but somewhat longer overshoot (lasting 400 μs) has been reported by Liu & Dilger (1991), who ascribe the effect to a slow solution change, so that the patch is exposed first to a concentration of ACh that opens all the channels and then to a concentration of ACh that blocks some of them.
Figure 5. The development of the current on applying ACh, described as a sum of exponentials.
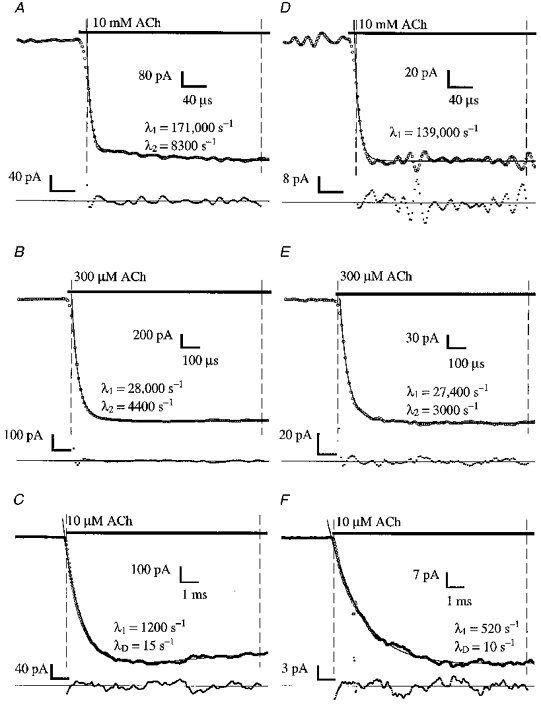
The onset of the response on the application of ACh to voltage-clamped outside-out patches is shown here. Traces A-C were recorded from a single patch containing adult receptors, and traces D-F from a patch containing fetal receptors, all with Vp = -60 mV. Note that different time scales are used for each ACh concentration. The data shown are averages of 21 (A-C), 11 (D and E) or 31 (F) single responses. A trace representing a single exponential or the sum of two or three exponentials overlies (continuous curve) the raw data, with the exponential rate constants shown next to the data trace. The increase in current is described by one or two exponential components (rate constants λ1 and λ2) while desensitization is described by a single exponential component (rate constant λD). Although the responses A, B, D and E also show some desensitization, the effects are not visible on this time scale, and so no extra exponential relaxation is needed to describe these brief sections of data. The fit is to the data between the points indicated by the vertical dashed lines. Underneath is shown the difference between the data and the fit, scaled up so that the difference is visible. Data were filtered at 3 kHz, -3 dB 4-pole Bessel (10 μM), 10 kHz (300 μM) or 75 kHz the amplifier bandwidth, digitized at 30 kHz (10 μM), 100 kHz (300 μM) or 1 MHz (10 mM). The 10 mM data were further digitally filtered for display with a 50 kHz sinc filter.
We will explore an alternative interpretation of the overshoot in the Discussion. We describe it here briefly. Suppose that the solution change is fast enough for the recorded current to be determined by the intrinsic kinetic properties of the AChR. In this case, on the application of high concentrations of ACh, receptors rapidly reach the open state. The subsequent reduction in current immediately after the initial rise of current can then be attributed to a slower accumulation of the channels into a blocked state. This effect is not seen if block is relatively fast.
To avoid difficulties of interpretation of what is an on-rate with data showing an overshoot, we have not presented any exponential fits to those data showing an overshoot. We have, however, obtained on-rate estimates from other data from such a patch at positive potentials and/or different ACh concentrations.
‘Run-down’ and desensitization
With every patch, there was an irreversible loss of responsiveness over time (run-down). The responses to 1, 3 and 10 mM ACh shown in Figs 3 and 4, traces I-K were collected first. They are consequently relatively larger than the rest of the data and so are shown with their own vertical scale. By comparing responses to similar concentrations applied some time apart, we note that for this patch there was little more in the way of ‘run-down’ while ACh concentrations of between 100 nM and 300 μM were being applied. ‘Run-down’ is regarded here as an experimental difficulty rather than an interesting kinetic phenomenon. Although run-down complicates the estimation of the relative peak amplitude of data, there was no apparent effect on the rate of development of current.
In the continued presence of ACh concentrations above 3 μM, the current declines (desensitizes). This process seems to be distinct from run-down in that its effects are reversible by the removal of ACh from the patch for a period of a second or two. We can see that for ACh concentations of 3 μM and below (Figs 3 and 4, A-D), desensitization is not a prominent feature during a 50 ms application. Even with the brief applications of agonist that we have used here, we can see that there is more than a single component to desensitization. We cannot, however, accurately measure the rates involved. We can observe that the extent of desensitization after 20 ms perfusion with 3 mM ACh (Fig. 3J) is similar to that observed with 30 μM ACh (Fig. 3F). We also note that the rate of desensitization varies considerably from one patch to another.
Fitting sums of exponentials to data recorded in the presence of ACh
We examined the onset of current on applying ACh to a patch, by fitting averaged current traces with sums of exponentials (Fig. 5). To describe the data in the presence of ACh, we usually require one component (λ1) for the rapid increase in current on applying ACh and another (λD) for the subsequent decline or desensitization (Fig. 5C and F). However, the rapid increase in current is frequently described by two exponentials (λ1 and λ2 in Fig. 3A, B and E). For example, in response to an application of 10 mM ACh, the current recorded from a patch with adult receptors rises with rates 171 000 and 8300 s−1 (Fig. 5A). The slower component gets faster with higher agonist concentrations. Even when it is seen, it contributes on average only 15 % of the total amplitude. A slower component is observed in 30 % of data from adult receptors and 32 % of data from fetal receptors. The slower component is more frequently found in responses to higher ACh concentrations, and does not appear at all in any responses to 10 μM ACh or less.
Note that the current does not rise abruptly from the equilibrium current level, but has a degree of sigmoidicity that is more apparent on the greatly expanded time scale of Fig. 5A and D. Although, in principle, this could be indicative of more than a single rate limiting step, we show later that a finite time for the solution exchange is a sufficient explanation.
We will use the term ‘on-relaxation’ to describe the time course of the development of current in response to a step in the agonist concentration. We will also concentrate on the dominant relaxation component. So when we say ‘the on-rate’, we will be referring to the rate constant of the larger amplitude exponential component describing the initial rise of the current in averaged traces, on applying ACh to an outside-out patch.
The concentration dependence of the on-rate
In Fig. 6, we have plotted the exponential rate constant of the dominant component in the on-relaxation, i.e. the on-rate. There is clearly a sigmoidal relationship with the ACh concentration. There is a limiting low on-rate at low ACh concentrations of around 930 ± 300 s−1 (values are means ±s.d. here and subsequently; N = 15, adult, -60 mV, pooled data from 10, 3 and 1 μM) or 100 ± 45 s−1 (N = 20, fetal, -60 mV, pooled data from 1, 0.3 and 0.1 μM). The limiting low concentration on-rate at a positive potential is higher: 2200 ± 800 s−1 (N = 7, adult, +40 mV, pooled data from 10 and 3 μM) or 200 ± 100 s−1 (N = 7, fetal, +40 mV, pooled data from 1 and 0.3 μM). The on-rate rises with increasing ACh concentrations, with a maximum log slope of a little under unity (adult) or around 1.3 (fetal). The on-rate is half-maximal at approximately 1 mM ACh (adult) or 500 μM (fetal) for both potentials. Above 1 mM ACh, the on-rate flattens and reaches a maximum value of 84 000 ± 42 000 s−1 (adult, +40 mV) or 61 000 ± 27 000 s−1 (N = 25, fetal, +40 mV), with similar values measured at -60 mV.
Figure 6. The concentration dependence of the on-rate.
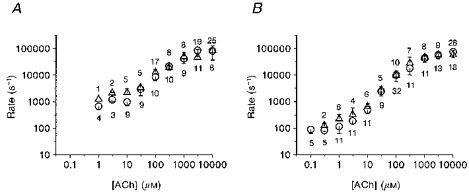
We show values of the on-rate obtained from 33 Q-A33 (adult, A) and 49 Q-F18 (fetal, B) cell patches. These values are the arithmetic mean ±s.d. of up to 25 individual measurements, for Vp = +40 mV (▵) and -60 mV (^). The N for each point is given above (+40 mV) or below (-60 mV) each data point.
DISCUSSION
This paper has been concerned with the investigation of the transient properties of AChR activation, specifically what limits the rate of rise of current when a patch containing many AChRs is exposed to ACh. In terms of Scheme 1, we ask if the isomerization step A2R to A2R* is rate limiting, and if so, then what are the values of the rate constants α and β. We have done this by exposing many AChRs on an outside-out patch to what are, nominally, step changes of ACh concentration. This approach is in contrast to the great majority of recent studies, which have concentrated on the behaviour of single AChRs, which have been exposed to ACh for a sufficient length of time that the transient features of the response have become small relative to the steady-state features. We have analysed the on-rate, a name that we have applied to the rate constant of the exponential relaxation that dominates the initial response of our patches to ACh.
We have found that for both receptor types, when we plot the on-rate as a function of ACh concentration, there is a plateau in the on-rate at high ACh concentrations. We assert that this indicates that the agonist dependent steps of Scheme 1 leading to channel opening are saturated, and that the on-rate therefore is determined principally by the rate constants of the isomerization step A2R to A2R*. This assertion is also dependent on the following assumptions: that our measurement of the on-rate is not limited by experimental constraints, that Scheme 1 is appropriate, and lastly that channel block does not contribute, to a significant extent, to the shape of the initial response to ACh. This last assumption is far from always true, in particular for negative pipette potentials.
Later, we will show how the on-rate and the microscopic rate constants α and β of Scheme 1 may be related (with a few assumptions). We deal with our first assumption first.
What limits the on-rate?
Our first concern is which factors, besides kinetic properties of the receptor, might limit the maximal on-rate that we measure. We will first consider two hypotheses briefly: that the initial rise of current on applying 10 mM ACh is limited by the time taken for the ion pore of the AChR to change its conformation from the closed to the open state, or that the rate of rise of current is limited by the recording bandwidth. A third possibility, that the finite time taken for the solution change limits the rate of rise of current, will then be considered.
The change in conductance of the AChR channel
The first hypothesis is dealt with in Maconochie et al. (1995), whose essential conclusion was that the AChR channel opening and closing transition is too fast to be observed by the methods employed, but can take no longer than 2-3 μs. This means that for rates of rise of current of less than 5 × 10⁵ s−1, we do not need to consider that a gradual change in the current through an opening channel might be responsible for limiting the on-rate. The fastest on-rates that we have measured have been close to 2 × 10⁵ s−1, so we reject this hypothesis.
The finite recording bandwidth
We have recorded the system step response as described in Maconochie et al. (1995). The 10-90 % rise time of the step response is around 3 μs for the 0.5 GΩ current measuring resistor in the patch recording headstage and around 5 μs for the 50 GΩ resistor. The 10-90 % rise time of an exponential with a rate constant of 2 × 10⁵ s−1 is 11 μs. We always used the 0.5 GΩ feedback resistor for measuring responses to 10 mM ACh, so we expect that although the overall shape of the fastest responses will be modified by the limited bandwidth of the recording system, the effect on the measured on-rate will not be significant.
The solution change
We have demonstrated elsewhere (Maconochie & Steinbach, 1995) that our fast perfusion method is capable of making solution changes with a 10-90 % rise time of 20 μs. In Maconochie & Steinbach (1995), Fig. 1, we examine the change in the conductance of open nicotinic channels on replacing some of the external NaCl with mannitol and show that the time course is indistinguishable from the time course of the junction current at either an open patch pipette or a leaky patch. The time course of the solution change at the beginning of a brief (1-10 ms) application of agonist is not necessarily identical to that at the end of the application. It seems that the time course of a given solution exchange depends on the sequence of applications over the preceding 50 ms. As a consequence, we find that the 10-90 % rise time of the solution change at the beginning of an application of ACh is closer to 40 μs. Although we have shown that our solution changes are fast, we believe that it is important to demonstrate that, for responses to the highest ACh concentrations, we are not merely measuring the time course of the solution change when we fit sums of exponentials to our averaged current responses.
By modelling the response of a system based on Scheme 1, in conjunction with a solution change taking a finite time, we are able to show two things. First, we show that at the highest concentration of ACh used, the on-rate is a reasonable predictor of α+β. Second, that the 10-90 % rise time of the solution change, obtained from the modelling process, is on average 34 ± 16 μs (n = 24). This value includes some data in which it seems likely that the solution change to a patch is slow, skewing the average 10-90 % rise time to longer times.
We have modelled the response of an ensemble of AChRs to a graded change in the ACh concentration. We then compared the modelled response with actual responses to 10 mM ACh. We adjusted the parameters in the model to get a closer representation of the real data. From this, we obtain the rate constant β for the isomerization step (α is fixed; see legends to Figs 7 and 8) and the 10-90 % rise time of the solution change profile. This process is described in more detail in the Methods section.
We do not, at this stage, have a complete kinetic scheme to represent all the details of AChR activation, so we have used, as an approximation, a simple linear scheme (Scheme 1). The affinity of each ligand binding step may vary from one patch to another, so it is well to examine data where the ligand binding steps leading to activation are saturated. Judging from the concentration dependence of the on-rate (Fig. 6), 10 mM appears to be a saturating concentration of ACh. We therefore have modelled responses to 10 mM ACh. Channel block by ACh is an additional complication. The data recorded at negative potentials show the effects of block quite strongly (Fig. 3K and S), but estimates of the unblocking rate k-B and the affinity of the blocking step (k-B/k+B) may be made from the amplitude and rate constant of the relaxation describing the increase in current at the end of an application of 10 mM ACh. The rates k+B and k-B can therefore be fixed for each individual averaged response. The data recorded at +40 mV are less easy to address this way, and as Maconochie & Steinbach (1995) have shown, a single reaction step does not do a good job of describing block at positive potentials. However, for reproducing a response only to 10 mM ACh at +40 mV, if the rates k+B and k-B are allowed to vary, a single blocking step is an adequate compromise. One last point to note is that Scheme 1 cannot reproduce an on-relaxation with two components of significant amplitude. We have therefore selected only data where the on-relaxation is well represented by a single exponential.
We show in Fig. 7 the results of this exercise in modelling responses to applications of 10 mM ACh. In Fig. 7A, the simulated response is shown as a continuous line overlaid on the data (circles). A single exponential fit to this initial rise of current is also shown (dashed line). In Fig. 7B, the sum of the two rate constants α and β, obtained from the modelling, is plotted as a function of the on-rate (+40 mV, ▵; -60 mV, •). We see that for the data recorded at +40 mV, the on-rate and the sum of α and β are closely equivalent, indicating that fitting the data with a sum of exponentials is a reasonable way of obtaining an estimate of α+β, even though the solution exchanges cannot be considered instantaneous on the time scale of the response to 10 mM ACh. We also obtain, from this exercise, the estimate of the 10-90 % rise time of the solution change that we gave above. We will consider the data from responses at -60 mV further, below.
This approach demonstrates that, in principle, instantaneous solution changes are not necessary for making useful measurements of the on-rate. We have estimated the 10-90 % rise time of the solution change for a number of real responses to 10 mM ACh. We would expect the solution exchange time estimated this way to mirror the 10-90 % rise time of junction current changes. However, our estimates of the solution exchange time, obtained this way, depend to some extent on the precise values of k+, k-1 and k-2 assumed. We also find a wide range of values for the estimated solution exchange time, even though the rise time of the junction current at the start of a solution change is always close to 40 μs.
Channel gating limits the on-relaxation
The on-rate saturates at high ACh concentrations. Since the experimental factors considered above do not appear to limit the maximal on-rate which we measure, we assume that the limit is imposed by properties intrinsic to the receptor. In terms of the simple kinetic scheme (Scheme 1): since the ligand binding steps are linearly dependent on the agonist concentration, they will not lead to a saturation of the on-rate. The channel opening step must therefore be what limits the maximal on-rate.
This interpretation, that the on-rate is limited by the channel opening step, is only applicable to a limited range of simple models of which Scheme 1 is an example. However, a single exponential on-relaxation may reflect the net equilibration between groups of linked states in a model rather than simply a single open/closed isomerization. With that caveat in mind, however, we will proceed to discuss the on-rate in terms of the simple scheme (Scheme 1).
The initial current overshoot with high ACh concentrations
With many of our responses to 10 mM ACh at -60 mV, we find that the shape of the initial response looks like the response shown in Fig. 3K and V rather than Fig. 5D. Immediately after the initial rise of current, there is a decrease of 5-10 % over the following 40 μs. This is not a phenomenon that we can simply ignore, for two reasons. First, 70 % of the patches with adult receptors and 25 % of patches with fetal receptors showed an overshoot in the responses to 10 mM ACh at -60 mV. Second, when an overshoot is present, we are unable to make an estimate of the on-rate.
The origin of the overshoot
As Liu & Dilger (1991) have pointed out, a slow solution change is an obvious candidate for the origin of the overshoot. They suggest that, as the ACh concentration rises, at some point most of the channels are open, but only later does the ACh concentration reach a level where the channels are blocked.
A similar effect can be obtained even with a fast solution change. Block by 10 mM ACh is still the root cause of the overshoot, which will occur if channels open faster than they can be blocked. The equilibrium constant for the blocking reaction at -60 mV is around 10 mM, so we set k+B=k-B/10−2 s−1 M−1. If β is less than k-B, then an overshoot is not observed. If, however, β is greater than k-B, then an overshoot is observed. The exact point at which an overshoot first appears is close to, but not quite β=k-B for Scheme 1.
These two situations are modelled in Fig. 8. In each part of Fig. 8, the thick line represents a response of Scheme 1 to a fast solution change (10-90 % rise time of 0.64 μs). For all the traces of Fig. 8A, β > k-B (β= 80 000 s−1, k-B = 60 000 s−1), and we see that there is a small overshoot in the response to a fast solution change and successively larger overshoots in the responses to slower solution changes. In contrast, in Fig. 8B, β < k-B (β= 40 000 s−1, k-B= 60 000 s−1), and we see that the response to the fast solution change has no overshoot. Nor do the responses to solution changes with 10-90 % rise times of 6.4, 13 and 19 μs. Only when the 10-90 % rise time of the solution change is 26 μs or greater is an overshoot seen. The conclusion that we come to, therefore, is that for data that show no overshoot, the solution change must have a 10-90 % rise time of less than about 26 μs.
This estimate of the maximum 10-90 % rise time is a little shorter than the average of 34 μs obtained from modelling responses to 10 mM ACh (see Fig. 7), and even shorter than the 10-90 % rise time of the junction current changes that we show in Fig. 1. The estimate we make here, from the observation that an overshoot is or is not seen, is dependent to some extent on the precise values that we pick for k+B and k-B. However, the values of k+B and k-B that we use in the simulations of Fig. 8 are representative of values that we estimate directly from individual responses to 10 mM ACh. We therefore expect the conclusions about the maximum 10-90 % rise time to also be representative. This begs the question of how the solution change with ACh can be any faster than that observed in the junction current changes of Fig. 1. Maconochie & Knight (1989) noted that the principle cause of a broadening of the 10-90 % rise time is the diffusion of solutes across the boundary between the two solutions. The thickness of ‘unstirred layers’ had little contribution to make. To explain the observation that in some instances the solution change with ACh appears to be faster than the junction current change with NaCl, we offer the following hypothesis. It has been noted that AChCl has a diffusion coefficient of 6.1 × 10⁻⁶ cm2 s−1 (Dionne, 1976). This is approximately half the size of the value for NaCl of 1.48 × 10⁻⁵ cm2 s−1 (Weast & Astle, 1982). So in the time taken to go from the end of the perfusion pipes to the recording pipette, less diffusional thickening of the boundary between two solutions will occur with ACh than with NaCl. If there has been less diffusional thickening of the boundary between the two solutions, then the 10-90 % rise time is expected to be faster.
The significance of the overshoot for the on-rate measurement
. As we have already mentioned above, in the presence of an overshoot, we are unable to make an estimate of the on-rate. However when an overshoot is absent from responses to 10 mM ACh at -60 mV, the on-rate no longer corresponds to the value of α+β. This is most easily seen in Fig. 7B (•), where the on-rate for 10 mM responses at -60 mV is plotted against the value of α+β derived by modelling the data with a simulated solution change and kinetic scheme (Scheme 1). With modelled data, there is a significant contribution to the initial increase of current from not one but two exponential relaxations. The two relaxation rate constants are determined almost entirely by the four reaction rates α, β, k+Bx and k-B. Although these two relaxations rates are easily distinguished in simulated data, with the signal-to-noise ratio of real data they are impossible to separate. The result of fitting a single relaxation to our data is therefore an on-rate that is somewhat greater than α+β. The two fast components of the on-relaxation, which are found only by modelling responses to 10 mM ACh at -60 mV, should not be confused with the small amplitude, slower relaxation (rate constant λ2) that we sometimes find in our data at both potentials.
There is an additional piece of circumstantial evidence which supports the conclusion that the overshoot we observe is not the result of a slow solution change. We examined the on-rate for responses of patches with adult receptors to 10 mM ACh at -60 mV, where an overshoot was seen sometimes, and at +40 mV, where it was not. Where a patch shows an overshoot at -60 mV then the on-rate at +40 mV is on average 104 000 ± 28 000 s−1 (mean ±s.d., N = 11). The corresponding figure at +40 mV for when an overshoot is not observed is 35 000 ± 14 000 s−1 (n = 4). We have a similar although less extreme result with data recorded at +40 mV from fetal receptors. When an overshoot at -60 mV is not observed, then the on-rate at +40 mV is 78 000 ± 23 000 s−1 (n = 6). When an overshoot at -60 mV is observed, the on-rate at + 40 mV is 52 000 ± 21 000 s−1 (n = 14). If a slow solution change were producing the overshoot at -60 mV, then the maximal on-rate at +40 mV might be expected to be faster for patches with no overshoot. Instead, our data are consistent with the earlier assertion that a value of β that is high relative to k-B is the underlying cause of the overshoot.
Variations in the on-rate
For any one concentration, we have measurements of the on-rate from up to twenty-five different patches. They vary substantially. For example, even if we neglect the two most extreme values, the on-rate (adult, 10 mM, +40 mV) ranges from 30 000 to 150 000 s−1. We have no easy explanation for this variability but can at least exclude two obvious candidates.
Deterioration of the agonist solution
. ACh deteriorates in solution. Aware of this pitfall, we made up concentrated stocks of solution for use the same day, and stored them at 0°C. Solutions were discarded after 1-2 h at room temperature. Variations in the value of the on-rate are not matched by variations in the degree of block induced by 10 mM ACh at -60 mV. Although we have no evidence that the breakdown products of ACh are not also inhibitors of the AChR current, we believe that changes of the ACh concentration with time are not a problem.
Repeatability of the on-rate measurement
. If the variations in the measurement of the on-rate are simply the random errors of measurement, we would expect to see firstly as much variation between responses to 3 mM and 10 mM applied to a single patch as between patches, and secondly an even wider variation in the on-rate when measured from consecutive single responses. We can state here that as a rule, if the response to 10 mM ACh has an above-average on-rate then so does the response to 3 mM ACh.
We use here, as an example, two sets of data. One has a high on-rate and the other has a low on-rate, and both have a sufficient signal-to-noise ratio that an on-rate may be obtained from single responses. Both of our examples are sets of responses of patches containing adult receptors to 10 mM ACh, at +40 mV. In both sets, the initial part of the response is well represented by a single exponential. The on-rates obtained from single responses were as follows (means ±s.d.): 102 000 ± 12 000 s−1 (n = 11) and 50 800 ± 8500 s−1 (N = 10). The on-rates obtained from individual responses correspond favourably with the on-rate fitted to the average of ten or eleven individual responses: 116 000 and 51 100 s−1, respectively. The differences between these two patches clearly cannot be ascribed to random errors of measurement.
What value of the on-rate would be outside the resolution of our methods?
Thus far, we have demonstrated that our measurements of the on-rate are not limited by the finite time required for the solution change, as estimated from real responses to 10 mM ACh (see Fig. 7). We also have circumstantial evidence that, for many of our data, the solution change must be faster than 26 μs, otherwise an overshoot would be visible in responses of patches to 10 mM ACh at -60 mV (see Fig. 8). We now ask if our measurements of the on-rate are only just within the resolution of the apparatus, or well within? With the help of Fig. 9, we set out to show that, for solution changes taking 26 to 40 μs, and for theoretical on-rates or β+α values up to 200 000 s−1, our methods lead to an estimate of the on-rate from data recorded at +40 mV, with 10 mM ACh, that is close to the true value.
Figure 9. The effects of slow solution changes on the measured on-rate in simulated data.
In A, we show three simulations of the response of adult receptors to 10 mM ACh at +40 mV. The simulation combines Scheme 1 with a sigmoidal solution change, as described in the Methods section. The 10-90 % rise times of the solution change simulated were 26, 40 and 80 μs. To each simulation was added noise taken from the baseline of a real data record. The continuous curves represent a single exponential fit to each of the simulations. In B, we plot the rate constant of the exponential fit (on-rate) to simulations such as are shown in A. Each point in the graph of B represents a different combination of 10-90 % rise time (26 μs, ^; 40 μs, □; 80 μs, ▵) and channel opening rate. The continuous line shows β+α equal to the on-rate. The dashed line shows the value of the on-rate calculated from Scheme 1 by the methods of Colquhoun & Hawkes (1977). Other rate constants used in Scheme 1 were: 2k+= 5 × 10⁸ s−1 M−1; k-1= 64 000 s−1; 2k-2 = 19 000 s−1; α= 5700 s−1; k+B = 6 × 10⁵ s−1 M−1; k-B = 60 000 s−1. For each value of β, a different sample of background noise was used. At a single value of β, the same noise sample was used for each of the three 10-90 % rise times modelled.
Two factors besides the 10-90 % rise time of the solution change are likely to lead to inaccuracy in the on-rate measurement. These are the peak amplitude of the response and the background noise. We have added to our simulations samples of background noise from the baseline of a real response. The peak amplitude we have chosen to model (100 pA) is well under the average peak amplitude of real data (174 ± 300 pA, mean ±s.d., N = 49, adult, 300 μM to 10 mM ACh, +40 mV). Three examples of simulations of the response of adult receptors, with β set to 100 000 s−1, are shown in Fig. 9A. These examples have been fitted with a single exponential. The exponential rate constant (on-rate) from these, and fits to further simulations with different β, are shown in Fig. 9B. Also in Fig. 9B, we show β+α equal to the on-rate (continuous line) and the expected value of the on-rate (dashed line) calculated by the methods of Colquhoun & Hawkes (1977). We plot the results of simulations with three different 10-90 % rise times of the solution change: 26 μs (^), 40 μs (□) and 80 μs (▵).
The most significant point to note is that the on-rate for simulations involving solution changes with a 10-90 % rise time of 26 or 40 μs is very close to β+α over the entire range. In contrast, when a 10-90 % rise time of 80 μs is assumed (Fig. 9B, ▵), the on-rate measurement is an innaccurate estimate of β+α much above 50 000 s−1. The largest value of the 10-90 % rise time of the solution change, estimated from the fitting of Scheme 1 to real data (Fig. 7), is 73 μs. The average is 34 ± 16 μs (n = 24). We therefore expect that for none of our data is the solution change substantially rate limiting, or likely to be, even if β+α were as high as 200 000 s−1, and the solution change as slow as our ‘worst case’ estimate.
The origin of the smaller amplitude on-relaxation component
As we have pointed out in the Results, we find that we need two exponential components to describe the increase in current on the initial application of ACh. The larger and faster component is always seen. Its rate constant (the on-rate) has been the principal subject of this paper. The second component is slower by a factor of about 10. Putative mechanisms in the literature for the origin of the second component are essentially as follows. The second component could be a part of a single gating process. Alternatively, the second component could arise from kinetically distinct populations of receptors. In the second alternative, a single receptor could show ‘mode switching’, in which the channel opening rate might differ between the different modes. Alternatively, receptors might differ in their structure: examples might include receptors with different subunit stoichiometries, or with different post-translational modifications.
We have already mentioned our reason for rejecting the second component as an integral part of the normal gating process, which was that the second component does not appear in every patch.
Mode switching has been convincingly demonstrated to occur in the AChRs of Xenopus myocytes (Auerbach & Lingle, 1986), and has been suggested to occur in receptors from most preparations (for review, see Lingle et al. 1992). Thus there are indications that a single receptor may show changes in kinetic behaviour which might involve changes in the channel opening rate. Alternatively, structural differences may underly functional differences. Studies of the properties of ACh induced currents in Xenopus oocytes that have been injected with incomplete sets of subunits show that several combinations can give rise to a current. The Q-F18 and Q-A33 cells have been demonstrated to express all their appropriate subunits (Kopta & Steinbach, 1994), but so far it has not been possible to show that each of the active AChRs contains a correct complement of subunits.
There is also some evidence that the properties of open and closed intervals within ‘clusters’ of single channel openings differ from one cluster to another, even for cells expressing defined combinations of subunits (for example, Sine & Steinbach 1987; Gibb, Kojima, Carr, & Colquhoun 1990). Together with the findings that inhibiting the normal glycosylation of AChRs results in altered channel function (Covarrubias & Steinbach, 1989) and that the single channel kinetics change following patch isolation (Covarrubias & Steinbach, 1990), we suggest that heterogeneity might reflect some post-translational modification.
What are the microscopic rate constants α and β of Scheme 1?
Thus far, we have presented simply the on-rate as a function of the ACh concentration. We are tempted to believe that the channel opening rate β is at least similar to the on-rate, but this cannot be assumed to be true. We therefore set out a rationale for estimating α and β from our data.
We have the following measurements: maximum on-rate, minimum on-rate, and the concentration of ACh that produces a half-maximal on-rate. One more value that we need is the concentration of ACh that produces the half-maximal peak amplitude of the current response. It need not be known with any great accuracy, so for the purpose of these speculative estimates, we can make a guess from the data of Fig. 3 that it is around 10 μM for fetal receptors and that it is 30 μM for adult receptors (data not shown).
To simplify the algebra, we will assume that we are examining only data recorded at +40 mV, and that therefore the rapid self-inhibition by ACh (block), which is prominent for responses to 10 mM ACh at -60 mV, has little or no effect on the on-rate and current peak amplitude. Scheme 1 then simpfies to:
Let λ be the rate constant of the dominant exponential (on-rate) in the initial response to a concentration x of ACh and λH its maximum (as determined from the high concentration asymptote of Fig. 6).
Let K1 be the dissociation constant of the first ligand binding step (K1=k-1/2k+) and K2 be that of the second ligand binding step (K2= 2k-2/k+).
K2 is approximately equal to the concentration of ACh that produces a half-maximal on-rate. We can more easily examine the relation between the ACh concentration and the on-rate if we assume that for the highest concentrations of ACh used, isomerization of the AChR between closed and open (A2R to A2R*) is slow compared to the agonist binding steps:
| (2) |
In the case of eqn (2) being true, then Scheme 2 may be approximated by a single-step reaction scheme. The rate constant of the single exponential relaxation associated with such a single-step scheme may be written down by inspection as:
| (3) |
which has a maximum value for large x of λH=α+β.
Scheme 2.
By setting λ= 0.5λH, we can find the concentration xR that gives a half-maximal on-rate from the following expression:
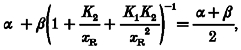 |
(4) |
This is a quadratic in xR that only has a real positive solution if β > α. It would also be simpler to solve if we could assume at this point that β ≫ α. The consensus of opinion is that β/α is at least 10. Making this assumption then, we find that eqn (4) reduces to:
| (5) |
We obtain an approximation to the roots of this quadratic eqn (5) by considering two possibilities: (1) the two ligand binding sites are substantially non-equivalent and (2) the two ligand binding sites are equivalent.
Equivalent binding sites
. In the situation where the two ligand binding sites are equivalent, i.e. k-1=k-2, we can set K1=K2/4. The real root of eqn (5) is then:
Non-equivalent binding sites
If the two ligand binding sites are substantially non-equivalent, we can assume that xR ≫ K1, and obtain the result:
We will state without proof that, in between the two extremes, xR does not stray outside K2 and 1.2K2, and therefore that xR is an adequate estimate of K2.
What concentration of agonist gives a half-maximal peak amplitude of response?
The equilibrium occupancy no of the open-state A2R* in Scheme 2 can be written down by inspection. It is:
| (6) |
Equation (6) has a maximum value of:
If we set no equal to half of its maximum value, and rearrange a little, we have:
| (7) |
where xP is the concentration of ACh that produces a half-maximal peak amplitude current.
Again, examining the two extremes of equivalent ligand binding sites and substantially non-equivalent ligand binding sites, we find that eqn (7) simplifies to:
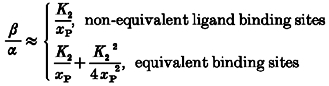 |
(8) |
The ratio β/α
We can now put some real measurements into eqns (8), and obtain β/α.
For fetal receptors, K2 is roughly 500 μM and xP is roughly 10 μM. Thus we see that:
For adult receptors, K2 and xP are approximately 1 mM and 30 μM, indicating that:
If we take the mean value of α+β to be 84 000 s−1 (adult) or 61 000 s−1 (fetal), then α lies between 260 and 2400 s−1 (adult) or between 90 and 1200 s−1 (fetal).
The value of β, at last!
It is now a simple matter of subtraction to realize that, on average, β for adult receptors must be between 82 000 and 84 000 s−1 or, for fetal receptors, between 60 000 and 61 000 s−1.
Off-relaxations
Scheme 2 has two predictions for the decay of current on the removal of ACh from the patch (off-relaxations). First that there will be only a single significant exponential relaxation component, whose rate is independent of the preceding ACh concentration. Second that, provided that k-1 is not so small as to be rate limiting, the ‘off’ exponential relaxation rate will be identical to the on-relaxation rate at low ACh concentrations. What we observe is that there are usually more than a single component to the off-relaxation. There is a single dominant component, always present, whose rate constant is close to the minimum value of the on-rate for low ACh concentrations. There are, in addition, smaller amplitude components with rate constants of the order of three times and one-third that of the dominant component. The origin of these components is presently obscure, although elsewhere we will offer evidence for particular models (D. J. Maconochie & J. H. Steinbach, in preparation).
Scheme 1 also has predictions for the off-relaxation following the removal of high concentrations of ACh. There should be a rapid recovery of current from the blocked state to the open state. This, and other models that more closely represent rapid self-inhibition by ACh at positive potentials, are examined by Maconochie & Steinbach (1995).
Comparisons with previous studies
A number of investigators have estimated β from studies of single channel currents (Table 1). There are two principal difficulties in obtaining estimates of the opening rate from single channel data. First, the relevant closed periods at either the limiting low or high concentrations of ACh are so brief that the majority are obscured by filtering and are not recorded. In addition, most researchers impose an arbitrary minimum value on the duration for a dwell in either an open or closed state to be counted. For the majority of studies shown in Table 1, the mean duration of the closures measured was briefer than this arbitrary minimum value, in some cases considerably less. The consequence is that between 40 and 90 % of putative brief closures are not recorded, and the mean duration must be inferred from the tail of the distribution rather than directly estimated. The estimated number of brief duration closures must be corrected for the low resolution. The uncertainties in determining the duration and number of closed periods significantly affect the interpretation of data at all agonist concentrations.
Table 1.
Nicotinic receptor activation parameters, obtained from fitting single-channel data
| AChR type | Highest [ACh] used (μM) | K1 (μM) | K2 (μM) | Filter frequency (Hz) | Dead time (μs) | Mean gap (μs) | β (s−1) | Ref. | |
|---|---|---|---|---|---|---|---|---|---|
| Native receptors | |||||||||
| Rana endplate | Adult | 0·1 | — | — | 4000 | 25 | 20 | 31 000 | 1 |
| Xenopus myocyte | Fetal | 1·0 | — | — | 10 000 | 25 | 25 | 30 000 | 2 |
| Xenopus myocyte | Adult | 1·0 | — | — | 10 000 | 25 | 32 | 16 000 | 2 |
| Xenopus myocyte | Fetal | 100 | 22 | 93 | 20 000 | 35 | 30 | (30 000) | 3 |
| Rat myotube | Fetal | 0·1 | — | — | 4000 | 100 | 90 | 5800 | 4 |
| Rat myotube | Adult | 0·1 | — | — | 4000 | 100 | 30 | 23 000 | 4 |
| Mouse BC3H1 | Fetal | 0·1 | — | — | 8000 | 100 | 50 | 14 000 | 5 |
| Recombinant receptors | |||||||||
| Torpedo | — | 300 | 4 | 400 | 20 000 | 10 | 10 | 45 000 | 6 |
| Mouse | Fetal | 500 | 21 | 675 | 20 000 | 15 | 19 | (60 000) | 7 |
| Mouse | Adult | 0·3 | 3 | 889 | 12 000 | 16 | 11 | 55 000 | 8 |
| Mouse | Adult | 20 | 2·5 | 914 | 10 000 | 25 | — | (60 000) | 8 |
| Mouse | Adult | 100 | 49 | 194 | 7000 | 100 | — | (55 000) | 9 |
| Human | Adult | 100 | 24 | 127 | 9000 | 25 | 15 | 50 600 | 10 |
The first column gives the source of tissue used in studies, or in the case of recombinant receptors the source of the cDNA sequences used for expression. The second column gives the type of receptor, either inferred from the tissue or receptor properties, or based on the expressed subunit combinations. The third column gives the highest concentration of ACh used in the studies, and the fourth and fifth columns the values for dissociation constants for ACh. The filter half-power frequency and stated minimum resolved or fitted intervals (dead time) are shown in the sixth and seventh columns. The eighth column gives the mean duration of the relevant closed period in the data. The ninth column gives the channel opening rate β. Parentheses indicate that the value was assumed by the authors, rather than calculated. All the authors have used Scheme 2 as the basis for analysis. A dash indicates that a value was not provided for that datum. The last column gives the reference (Ref.) for the data: 1: Colquhoun & Sakmann, 1985; 2: Rohrbough & Kidokoro, 1990; 3: Auerbach, 1993; 4: Jaramillo & Schuetze, 1988; 5: Sine & Steinbach, 1986; 6: Sine, Claudio & Sigworth, 1990; 7: Zhang et al. 1995; 8: Sine et al. 1995; 9: Akk, Sine & Auerbach, 1996; 10: Ohno et al. 1996.
In general, it is not possible to demonstrate that a given component in the distribution of closed times is related to channel activation. This introduces uncertainty about β since it is often the case that more components are observed than would be predicted on the basis of a simple kinetic scheme (e.g. Colquhoun & Sakmann, 1985; Sine & Steinbach, 1986; reviewed in Lingle et al. 1992). The problem is particularly apparent at high concentrations of ACh because of the additional brief closures thought to be the result of channel block by ACh (Sine & Steinbach, 1984; Ogden & Colquhoun, 1985; Maconochie & Steinbach, 1995). These block-related closures have a similar mean duration to the putative activation-related closures, which complicates the analyses.
Because of the difficulties of interpretation introduced by channel block by ACh, most authors only explore a limited range of ACh concentrations. Indeed, the highest concentrations used in the studies cited in Table 1 may not have been high enough to fully saturate the binding sites and so it has not been possible to obtain an independent, high-concentration, estimate of β. As discussed below, the on-rate (and the inverse of the mean duration of the relevant closed period in the single channel record) will be half-maximal at an ACh concentration close to the dissociation constant for the lower affinity site (K2). However, for the studies shown in Table 1 the ratio of the inferred K2 to the highest concentration used is 1.6 (± 0.7, N = 6) so the high concentration studies have not been able to provide a direct estimate of the opening rate.
In spite of these uncertainties, it is reassuring that at least some of the estimates of β from single channel recordings are not too dissimilar to the estimates we present here. Since the two approaches involve very different data, the agreement lends credibility to both approaches.
Two other approaches have been used to estimate β. One is to analyse the rising phase of miniature endplate currents to provide a lower limit for the channel opening rate. Estimates of a lower limit for β have ranged from 6 000 to 25 000 s−1 (Land, Saltpeter & Saltpeter, 1981; Linder, Pennefather & Quastel, 1984; Jaramillo & Schuetze, 1988; Tanzi & D'Angelo, 1995).
Finally, investigators other than ourselves have also used fast applications of ACh (Franke et al. 1991; Liu & Dilger, 1991; Liu, Dilger & Vidal, 1994). In one study (Franke et al. 1991), the fastest 10-90 % rise time of the on-relaxation was 0.3-0.5 ms (in response to 1 mM ACh), severely restricting the resolution for responses to high ACh concentrations. For comparison, our responses to 1 and 10 mM ACh have 10-90 % rise times of the order of 100 and 20 μs, respectively. Liu & Dilger (1991) estimated the opening rate for the fetal receptors expressed by clonal mouse BC3H1 cells at 15000 s−1 (12°C), well within the resolution of their apparatus. They obtained an approximately two-fold faster on-rate by raising the temperature to 22°C (Liu & Dilger, 1991) or by adding butanol or pentanol to the solutions (Liu et al. 1994). The estimate for β at 12°C is quite similar to one value calculated from single channel studies of receptors on these cells (see Table 1; Sine & Steinbach, 1986).
In summary, a number of studies have found that the channel opening rate is high for muscle nicotinic receptors. The estimates are rather different from each other, but receptors from a number of species have been studied and the experimental conditions are not constant so the variability is not surprising. Our estimates indicate that the opening rates inferred from analyses of single channel records are generally a little on the low side. A possible point of concern, however, is the evidence available that muscle nicotinic receptors can show significant heterogeneity in kinetic properties.
Acknowledgments
We thank Carrie Kopta and Qing Chen for advice and for providing the cells used in these experiments. We also thank Drs J. L. Albert and M. Cuttle and Professor P. R. Stanfield for their comments on the manuscript. This work was supported by National Institiutes of Health grants R01 NS22356 and PO1 GM47969 to J. H. Steinbach and Wellcome Trust grant 039729/Z/93 to D. Maconochie.
References
- Adams PR. Acetylcholine receptor kinetics. Journal of Membrane Biology. 1981;58:161–174. doi: 10.1007/BF01870902. [DOI] [PubMed] [Google Scholar]
- Akk G, Sine S, Auerbach A. Binding sites contribute unequally to the gating of mouse nicotinic αD200N acetylcholine receptors. Journal of Physiology. 1996;496:185–196. doi: 10.1113/jphysiol.1996.sp021676. [DOI] [PMC free article] [PubMed] [Google Scholar]
- Auerbach A. A statistical analysis of acetylcholine receptor activation in Xenopus myocytes: Stepwise versus concerted models of gating. Journal of Physiology. 1993;461:339–378. doi: 10.1113/jphysiol.1993.sp019517. [DOI] [PMC free article] [PubMed] [Google Scholar]
- Auerbach A, Lingle CJ. Activation of the primary kinetic modes of large- and small-conductance cholinergic ion channels in Xenopus myocytes. Journal of Physiology. 1986;393:437–466. doi: 10.1113/jphysiol.1987.sp016832. [DOI] [PMC free article] [PubMed] [Google Scholar]
- Barker CR, Worman CP, Smith JL. Purification and quantification of T and B lymphocytes by an affinity method. Immunology. 1975;29:765–777. [PMC free article] [PubMed] [Google Scholar]
- Brett RS, Dilger JP, Adams PR, Lancaster B. A method for the rapid exchange of solutions bathing excised membrane patches. Biophysical Journal. 1986;50:987–992. doi: 10.1016/S0006-3495(86)83539-1. [DOI] [PMC free article] [PubMed] [Google Scholar]
- Chabala LD, Gurney AM, Lester HA. Dose- response of acetylcholine receptor channels opened by a flash-activated agonist in voltage-clamped rat myoballs. Journal of Physiology. 1986;371:407–433. doi: 10.1113/jphysiol.1986.sp015983. [DOI] [PMC free article] [PubMed] [Google Scholar]
- Chen Q, Fletcher GH, Steinbach JH. Selection of stably transfected cells expressing a high level of fetal muscle nicotinic receptors. Journal of Neuroscience Research. 1995;40:606–612. doi: 10.1002/jnr.490400505. [DOI] [PubMed] [Google Scholar]
- Colquhoun D, Hawkes AG. Relaxations and fluctuations of membrane currents that flow through drug-operated channels. Proceedings of the Royal Society. 1977;B 199:231–262. doi: 10.1098/rspb.1977.0137. [DOI] [PubMed] [Google Scholar]
- Colquhoun D, Hawkes AG. On the stochastic properties of single ion channel openings and of clusters of bursts. Philosophical Transactions of the Royal Society. 1982;B 300:1–59. doi: 10.1098/rstb.1982.0156. [DOI] [PubMed] [Google Scholar]
- Colquhoun D, Sakmann B. Fast events in single-channel currents activated by acetylcholine and its analogues at the frog muscle end-plate. Journal of Physiology. 1985;369:501–557. doi: 10.1113/jphysiol.1985.sp015912. [DOI] [PMC free article] [PubMed] [Google Scholar]
- Covarrubias M, Steinbach JH. Inhibitors of asparagine-linked oligosaccharide processing alter the kinetics of the nicotinic acetylcholine receptor. Journal of General Physiology. 1989;93:765–783. doi: 10.1085/jgp.93.5.765. [DOI] [PMC free article] [PubMed] [Google Scholar]
- Covarrubias M, Steinbach JH. Excision of membrane patches reduces the mean open time of nicotinic acetylcholine receptors. Pflügers Archiv. 1990;416:385–392. doi: 10.1007/BF00370744. [DOI] [PubMed] [Google Scholar]
- del Castillo J, Katz B. Interaction at end-plate receptors between choline derivatives. Proceeedings of the Royal Society. 1957;B 146:369–381. doi: 10.1098/rspb.1957.0018. [DOI] [PubMed] [Google Scholar]
- Dionne VE. Characterization of drug iontophoresis with a fast microassay technique. Biophysical Journal. 1976;16:705–717. doi: 10.1016/S0006-3495(76)85723-2. [DOI] [PMC free article] [PubMed] [Google Scholar]
- Edmonds B, Gibb AJ, Colquhoun D. Mechanisms of activation of muscle nicotinic acetylcholine receptors and the time course of endplate currents. Annual Review of Physiology. 1995;57:469–493. doi: 10.1146/annurev.ph.57.030195.002345. [DOI] [PubMed] [Google Scholar]
- Eigen M, Maeyer L. Relaxation methods. Techniques of Organic Chemistry. 1963;8:895–1054. [Google Scholar]
- Franke C, Hatt H, Parnas H, Dudel J. Kinetic constants of the acetylcholine (ACh) receptor reaction deduced from the rise in open probability after steps in ACh concentration. Biophysical Journal. 1991;60:1008–1016. doi: 10.1016/S0006-3495(91)82138-5. [DOI] [PMC free article] [PubMed] [Google Scholar]
- Gibb AJ, Kojima H, Carr JA, Colquhoun D. Expression of cloned receptor subunits produces multiple receptors. Proceedings of the Royal Society. 1990;B 242:108–112. doi: 10.1098/rspb.1990.0112. [DOI] [PubMed] [Google Scholar]
- Hamill OP, Marty A, Neher E, Sakmann B, Sigworth FJ. Improved patch-clamp techniques for high-resolution current recording from cells and cell-free membrane patches. Pflügers Archiv. 1981;391:85–100. doi: 10.1007/BF00656997. [DOI] [PubMed] [Google Scholar]
- Jaramillo F, Schuetze SM. Kinetic differences between embryonic- and adult-type acetylcholine receptors in rat myotubes. Journal of Physiology. 1988;396:267–296. doi: 10.1113/jphysiol.1988.sp016962. [DOI] [PMC free article] [PubMed] [Google Scholar]
- Kopta C, Steinbach JH. Comparison of mammalian adult and fetal nicotinic acetylcholine receptors stably expressed in fibroblasts. Journal of Neuroscience. 1994;14:3922–3933. doi: 10.1523/JNEUROSCI.14-06-03922.1994. [DOI] [PMC free article] [PubMed] [Google Scholar]
- Land BR, Salpeter EE, Salpeter MM. Kinetic parameters for acetylcholine interaction in intact neuromuscular junction. Proceedings of the National Academy of Sciences of the USA. 1981;78:7200–7204. doi: 10.1073/pnas.78.11.7200. [DOI] [PMC free article] [PubMed] [Google Scholar]
- Linder TM, Pennefather P, Quastel DM. The time course of miniature endplate currents and its modification by receptor blockade and ethanol. Journal of General Physiology. 1984;83:435–468. doi: 10.1085/jgp.83.3.435. [DOI] [PMC free article] [PubMed] [Google Scholar]
- Lingle C, Maconochie D, Steinbach JH. Activation of skeletal muscle nicotinic acetylcholine receptors. Journal of Membrane Biology. 1992;126:195–217. doi: 10.1007/BF00232318. [DOI] [PubMed] [Google Scholar]
- Liu Y, Dilger JP. Opening rate of acetylcholine receptor channels. Biophysical Journal. 1991;60:424–432. doi: 10.1016/S0006-3495(91)82068-9. [DOI] [PMC free article] [PubMed] [Google Scholar]
- Liu Y, Dilger JP, Vidal AM. Effects of alcohols and volatile anesthetics on the activation of nicotinic acetylcholine receptor channels. Molecular Pharmacology. 1994;45:1235–1241. [PubMed] [Google Scholar]
- Maconochie DJ, Fletcher GH, Steinbach JH. The conductance of the muscle nicotinic receptor channel changes rapidly upon gating. Biophysical Journal. 1995;68:483–490. doi: 10.1016/S0006-3495(95)80209-2. [DOI] [PMC free article] [PubMed] [Google Scholar]
- Maconochie DJ, Knight DE. A method for making solution changes in the sub-millisecond range at the tip of a patch pipette. Pflügers Archiv. 1989;414:589–596. doi: 10.1007/BF00580996. [DOI] [PubMed] [Google Scholar]
- Maconochie DJ, Steinbach JH. Block by acetylcholine of mouse muscle nicotinic receptors, stably expressed in fibroblasts. Journal of General Physiology. 1995;106:113–147. doi: 10.1085/jgp.106.1.113. [DOI] [PMC free article] [PubMed] [Google Scholar]
- Martin JL, Maconochie DJ, Knight DE. A novel use of differential equations to fit exponential functions to experimental data. Journal of Neuroscience Methods. 1994;51:135–146. doi: 10.1016/0165-0270(94)90003-5. [DOI] [PubMed] [Google Scholar]
- Matsubara N, Billington AP, Hess GP. How fast does an acetylcholine receptor channel open? Laser-pulse photolysis of an inactive precursor of carbamoylcholine in the microsecond time region with BC3H1 cells. Biochemistry. 1992;31:5507–5514. doi: 10.1021/bi00139a012. [DOI] [PubMed] [Google Scholar]
- Mishina M, Takai T, Imoto K, Noda M, Takahashi T, Numa S, Methfessel C, Sakmann B. Molecular distinction between fetal and adult forms of muscle acetylcholine receptor. Nature. 1986;321:406–411. doi: 10.1038/321406a0. [DOI] [PubMed] [Google Scholar]
- Ogden DC, Colquhoun D. Ion channel block by acetylcholine, carbachol and suberyldicholine at the frog neuromuscular junction. Proceedings of the Royal Society. 1985;B 225:329–355. doi: 10.1098/rspb.1985.0065. [DOI] [PubMed] [Google Scholar]
- Ohno K, Wang HL, Milone M, Bren N, Brengman JM, Nakano S, Quiram P, Pruitt JN, Sine SM, Engel AG. Congenital myasthenic syndrome caused by decreased agonist binding affinity due to a mutation in the acetylcholine receptor epsilon subunit. Neuron. 1996;17:157–170. doi: 10.1016/s0896-6273(00)80289-5. [DOI] [PubMed] [Google Scholar]
- Phillips WD, Kopta C, Blount P, Gardner PD, Steinbach JH, Merlie JP. Acetylcholine receptor-rich membrane domains organized in fibroblasts by recombinant 43-kD protein. Science. 1991;251:568–570. doi: 10.1126/science.1703661. [DOI] [PubMed] [Google Scholar]
- Press WH, Teukolsky SA, Vetterling WT, Flannery BP. Numerical Recipes in Pascal. Cambridge, UK: Cambridge University Press; 1992. [Google Scholar]
- Rohrbough J, Kidokoro Y. Changes in kinetics of acetylcholine receptor channels after initial expression in Xenopus myocyte culture. Journal of Physiology. 1990;425:245–269. doi: 10.1113/jphysiol.1990.sp018101. [DOI] [PMC free article] [PubMed] [Google Scholar]
- Sine SM, Claudio T, Sigworth FJ. Activation of Torpedo acetylcholine receptors expressed in mouse fibroblasts. Journal of General Physiology. 1990;96:395–437. doi: 10.1085/jgp.96.2.395. [DOI] [PMC free article] [PubMed] [Google Scholar]
- Sine SM, Ohno K, Bouzat C, Auerbach A, Milone M, Pruitt JN, Engel AG. Mutation of the acetylcholine receptor alpha subunit causes a slow-channel myasthenic syndrome by enhancing agonist binding affinity. Neuron. 1995;15:229–239. doi: 10.1016/0896-6273(95)90080-2. [DOI] [PubMed] [Google Scholar]
- Sine SM, Steinbach JH. Agonists block currents through acetylcholine receptor channels. Biophysical Journal. 1984;46:277–284. doi: 10.1016/S0006-3495(84)84022-9. [DOI] [PMC free article] [PubMed] [Google Scholar]
- Sine SM, Steinbach JH. Acetylcholine receptor activation by a site-selective ligand: nature of brief open and closed states in BC3H-1 cells. Journal of Physiology. 1986;370:357–379. doi: 10.1113/jphysiol.1986.sp015939. [DOI] [PMC free article] [PubMed] [Google Scholar]
- Sine SM, Steinbach JH. Activation of acetylcholine receptors on clonal mammalian BC3H-1 cells by high concentrations of agonist. Journal of Physiology. 1987;385:325–359. doi: 10.1113/jphysiol.1987.sp016496. [DOI] [PMC free article] [PubMed] [Google Scholar]
- Tanzi F, D'Angelo E. Miniature endplate current kinetics at the mouse neuromuscular junction: effects of temperature and medium viscosity. European Journal of Neuroscience. 1995;7:1926–1933. doi: 10.1111/j.1460-9568.1995.tb00715.x. [DOI] [PubMed] [Google Scholar]
- Weast RC, Astle J. Handbook of Chemistry and Physics. 63. Boca Raton, FL, USA: CRC Press; 1982. [Google Scholar]
- Zhang YN, Chen J, Auerbach A. Activation of recombinant mouse acetylcholine receptors by acetylcholine, carbamylcholine and tetramethylammonium. Journal of Physiology. 1995;486:189–206. doi: 10.1113/jphysiol.1995.sp020802. [DOI] [PMC free article] [PubMed] [Google Scholar]