

Abstract
[Ca2+]i was recorded in voltage-clamped gastric myocytes from Bufo marinus. Repolarization to -110 mV following a 300 ms depolarization to +10 mV led to triphasic [Ca2+]i decay, with a fast-slow-fast pattern. After a conditioning train of repetitive depolarizations the duration of the second, slow phase of decay was shortened, while the rate of decay during the third, faster phase was increased by 34 ± 6 % (mean ± s.e.m., n = 21) when compared with unconditioned transients.
[Ca2+]i decay was biphasic in cells injected with the calmodulin-binding peptide RS20, with a prolonged period of fast decay followed by a slow phase. There was no subsequent increase in decay rate during individual transients and no acceleration of decay following the conditioning train (n = 8). Decline of [Ca2+]i in cells injected with the control peptide NRS20 was triphasic and the decay rate during the third phase was increased by 50 ± 19 % in conditioned transients (n = 6).
Cell injection with CK3AA, a pseudo-substrate inhibitor of calmodulin-dependent protein kinase II, prevented the increase in the final rate of decay following the conditioning train (n = 6). In cells injected with an inactive peptide similar to CK3AA, however, there was a 45 ± 17 % increase after the train (n = 5).
Inhibition of Ca2+ uptake by the sarcoplasmic reticulum with cyclopiazonic acid or thapsigargin did not prevent acceleration of decay.
These results demonstrate that [Ca2+]i decay is accelerated by Ca2+-calmodulin and calmodulin-dependent protein kinase II. This does not depend on Ca2+ uptake by the sarcoplasmic reticulum but may reflect upregulation of mitochondrial Ca2+ removal.
Given that the intracellular free Ca2+ concentration ([Ca2+]i) plays a crucial role in the activation of smooth muscle contraction, it is important to understand the processes which regulate [Ca2+]i itself (Van Breemen & Saida, 1989). Numerous mechanisms affect the rates of Ca2+ entry into, or removal from, the cytoplasm of the cell and it is the balance of these processes, along with the Ca2+-buffering properties of the cell, which determines the [Ca2+]i at any time. Considerable attention has focused on the regulation of Ca2+ entry through voltage- and ligand-gated channels in the plasma membrane and on Ca2+ release from intracellular stores (Missiaen, Desmedt, Droogmans, Himpens & Casteels, 1992). Less information is available, however, concerning signalling pathways which act on Ca2+ removal in smooth muscle, despite the range of identified removal mechanisms which might be targeted by such pathways. These may include Ca2+-ATPases in both the plasma membrane and the sarcoplasmic reticulum (for review see Missiaen et al. 1991), the Na+-Ca2+ exchanger in the plasma membrane (McCarron, Walsh & Fay, 1994) and the mitochondrial Ca2+ uniporter (Drummond & Fay, 1996). In vitro studies using isolated membrane fractions have identified a variety of different signalling pathways which modulate Ca2+ removal. For example, the activity of the plasma membrane Ca2+-ATPase may be regulated by Ca2+-calmodulin, protein kinases or acidic phospholipids (Carafoli & Stauffer, 1994). Similarly, the Ca2+-ATPase pump in the sarcoplasmic reticulum may be stimulated by both cyclic nucleotide-dependent and Ca2+-calmodulin-dependent kinases, either through phosphorylation of the regulatory protein phospholamban (Raeymaekers, Hofmann & Casteels, 1988; Colyer & Wang, 1991), or as a result of direct phosphorylation of the Ca2+-ATPase itself (Grover, Xu, Samson & Narayanan, 1996).
Experiments using membrane fragments and isolated molecules cannot establish whether the identified mechanisms actually regulate [Ca2+]iin vivo. Upregulation of Ca2+ removal in intact smooth muscle cells is suggested by the undershoot in baseline [Ca2+]i after exposure to caffeine, probably due to increased uptake by the Ca2+-depleted stores (Ganitkevich & Isenberg, 1992; Baró, O'Neill & Eisner, 1993). Increased rates of [Ca2+]i decline are also seen following prolonged periods of [Ca2+]i elevation elicited by depolarizing trains (Becker, Singer, Walsh & Fay, 1989). More recently, it has also been shown that the rate of [Ca2+]i decay in voltage-clamped gastric myocytes can actually accelerate during a single Ca2+ transient, and that this is a [Ca2+]i- and time-dependent process (McGeown, Drummond, McCarron & Fay, 1996). Blockade of Ca2+ uptake into mitochondria prevents both the acceleration of decay following a train of depolarizing pulses (Drummond & Fay, 1996) and that seen during single transients (McGeown et al. 1996). Thus, there is a feedback mechanism in these cells whereby elevation of [Ca2+]i promotes more rapid Ca2+ removal from the cytoplasm, and this is a mitochondrial-dependent Ca2+ uptake process. However, none of the molecular details of the pathway controlling this feedback have previously been established.
In the present paper we report the results of experiments designed to identify signalling molecules involved in Ca2+-dependent regulation of [Ca2+]i decay in intact gastric myocytes. Our data show that calmodulin and calmodulin-dependent protein kinase II are involved. The target removal mechanism does not appear to be either the sarcoplasmic reticulum Ca2+ pump or the Na+-Ca2+ exchanger in the plasma membrane, but rather Ca2+ uptake by mitochondria.
Preliminary aspects of this work have been presented to The Biophysical Society (McGeown, McCarron, Ikebe, Walsh & Fay, 1992; Drummond, McCarron, Ikebe, Walsh & Fay, 1994), The Physiological Society (McGeown, McCarron, Ikebe, Walsh & Fay, 1993a) and the International Union of Physiological Sciences (McGeown, McCarron, Ikebe, Walsh & Fay, 1993b).
METHODS
Recording techniques
The methods used have been described in detail elsewhere (Becker et al. 1989; McGeown et al. 1996) and will only be outlined here. Adult toads (Bufo marinus) were killed by decapitation, as approved by the University of Massachusetts Medical School Animal Care and Use Committee following guidelines of the US Departments of Agriculture, and Health and Human Services. Gastric myocytes were isolated using standard enzymatic digestion techniques (Fay, Hoffman, Leclair & Merriam, 1982) and were voltage clamped in the whole-cell mode using an Axoclamp-2A amplifier (Axon Instruments). Inward Ca2+ currents (ICa) were recorded by including Cs+ in the pipette solution and tetraethylammonium in the bath solution to block outward K+ currents. Intracellular Ca2+ concentrations ([Ca2+]i) were simultaneously recorded with fura-2 which was allowed to diffuse into the cells from the patch electrodes. The dye was excited alternately at 340 nm and 380 nm and the ratio of the background corrected fluorescence was converted to [Ca2+]i using the equation of Grynkiewicz, Poenie & Tsien (1985), with in vitro values of β (fluorescence ratio for dye excited at 380 nm; Ca2+ free/saturating Ca2+), Rmax (fluorescence ratio in saturating Ca2+, 340 nm/380 nm excitation) and Rmin (fluorescence ratio in the absence of Ca2+, 340 nm/380 nm excitation), and the Kd determined in vivo for this cell type (200 nM; Williams, Fogarty, Tsien & Fay, 1985). Step depolarizations were used to evoke ICa and thus raise [Ca2+]i. The decay of [Ca2+]i was then recorded following repolarization to -110 mV. This negative holding potential ensured rapid deactivation of ICa (Kostyuk & Shirokov, 1989) and prevented the continued rise in [Ca2+]i sometimes observed immediately after repolarization to more positive potentials, presumably due to Ca2+ tail currents (McGeown et al. 1996). The rate of [Ca2+]i decline (-Δ[Ca2+]i/Δt) during each transient was calculated using a least-squares linear fit to data samples as previously described (Becker et al. 1989) and this absolute rate was then plotted at intervals of 50 or 100 ms. Cells were also observed throughout the experiments using a CCD video camera (Sony Model XC-38) and red light illumination (> 680 nm) since this does not interfere with the fura-2 fluorescence signal.
Solutions and peptides
Experiments were carried out at room temperature (24-26°C) with the following solutions: bath solution (mM): 94 NaCl, 3 KCl, 20 CaCl2, 1 MgCl2, 5 Hepes, 10 tetraethylammonium chloride, pH adjusted to 7.4 with NaOH; pipette solution (mM): 140 CsCl, 4 MgCl2, 3.5 Na2ATP, 0.05 fura-2 pentapotassium salt, 20 Pipes, pH adjusted to 7.2 with CsOH. Na2ATP, Hepes and tetraethylammonium chloride were obtained from Sigma, and fura-2 from Molecular Probes. Where used, peptides were included in the pipette solution and pressure injected into the cell from the patch pipette (5-15 p.s.i., 30-100 ms) using a picospritzer (WPI). The peptides were as follows.
(a) The calmodulin inhibitory peptide RS20 (Lukas, Burgess, Prendergast, Lau & Watterson, 1986), which corresponds to residues 493-512 in the calmodulin-binding domain of smooth muscle myosin light chain kinase, and has the amino acid sequence Ala-Arg-Arg-Lys-Trp-Gln-Lys-Thr-Gly-His-Ala-Val-Arg-Ala*-Ile-Gly-Arg-Leu-Ser-Ser.
(b) NRS20, a control peptide for RS20 in which the alanine residue at position 506 (marked *) is deleted.
(c) CK3AA, which corresponds to residues 277-298 in the auto-inhibitory domain of calmodulin-dependent protein kinase II from brain (Payne et al. 1988) with alanine substitutions at positions 279 and 286; sequence Val-Ala-Ala-Met-Met-His-Arg-Gln-Glu-Ala-Val-Glu-Cys-Leu-Lys-Lys-Phe-Asn-Ala-Arg-Arg-Lys. In some experiments using CK3AA the protease inhibitor leupeptin (Sigma) was also included in the pipette solution at a concentration of 20 μg ml−1.
(d) NCK3AA, a control peptide for CK3AA, which has the sequence Val-Ala-Ala-Met-Met-His-Gln-Glu-Ala-Val-Glu-Cys-Leu-Glu-Phe-Asn-Ala-Arg-Arg-Lys.
Statistical analysis
[Ca2+]i decay after repolarization occurred in up to three phases separated by rapid and distinct changes in the slope of the [Ca2+]i record. Each phase was identified as previously described (McGeown et al. 1996) by visual inspection of the [Ca2+]i transient, which was displayed on the same time base as the derived [Ca2+]i decay rate (-Δ[Ca2+]i/Δt) for that transient. For summary purposes the fall in [Ca2+]i during each of the first two phases of a transient was expressed as a percentage of the total fall in [Ca2+]i. This normalization allowed results for transients of differing sizes to be combined without distorting the temporal profile of decay. The duration and normalized [Ca2+]i changes for phases 1 and 2 of each transient were also used to calculate the rates of fall in percentage [Ca2+]i (% s−1), and these are referred to as the percentage decay rates. Phase 3 percentage decay rates were calculated from the times required for [Ca2+]i to fall from the value equivalent to 30 % decay down to the value equivalent to 60 % decay (30-60 % decay rates). Data have been summarized in terms of the mean ± standard error of the mean (s.e.m.) for each set of conditions.
The statistical significance of apparent differences between mean percentage changes and mean percentage decay rates was tested using either the Wilcoxon signed-rank test for comparison of paired observations, or the Mann-Whitney U test when comparing unpaired observations. Student's t tests, paired or unpaired as appropriate, were used for comparison of the mean peak currents, mean absolute duration of separate phases and [Ca2+]i levels under different experimental conditions. Differences between means were accepted as statistically significant at the 95 % significance level.
RESULTS
Repolarization of voltage-clamped gastric myocytes to -110 mV following 300 ms depolarizations to +10 mV led to decay in [Ca2+]i (Fig. 1). Decay occurred in three phases, as previously reported (McGeown et al. 1996), with an initial period of rapid decline (phase 1), a more prolonged, slower phase (phase 2), and a delayed acceleration of [Ca2+]i decay (phase 3). These phases show up as a peak- trough-peak pattern when the absolute rate of [Ca2+]i decay (-Δ[Ca2+]i/Δt) is plotted on the same time base as the transient itself (Fig. 1).
Figure 1. [Ca2+]i decay in a voltage-clamped gastric myocyte.

The decay in [Ca2+]i following a step in membrane potential (Vm, top record) from -110 to +10 mV for 300 ms was recorded from a single cell (middle trace). Arrows indicate rapid changes in the gradient of [Ca2+]i record which divide the decay into 3 phases (as labelled). The bottom graph shows how the absolute rate of [Ca2+]i decay (-Δ[Ca2+]i/Δt) changes with time during this transient.
[Ca2+]i decay is accelerated following a depolarizing train
Earlier studies with this cell type had revealed that the rate of [Ca2+]i decline was increased for some tens of seconds following a conditioning train of repetitive depolarizing pulses (Becker et al. 1989). Protocols were devised to examine the effects of such trains on the separate phases of [Ca2+]i decay described above. Test depolarizations (from -110 to +10 mV, 300 ms duration) were applied before (T1), and 15 s after (T2), an 8 s conditioning train (250 ms depolarizations from -110 to +10 mV, 2 pulses s−1). Records for one such experiment show that [Ca2+]i decay was faster following T2 (Fig. 2A). Detailed examination of the transients reveal that there were two changes in the temporal profile of [Ca2+]i decay following the test pulse after the train, with shortening of the slow decay phase (phase 2) as well as acceleration of the subsequent rate of decay (an increased slope for T2 during phase 3, Fig. 2B). The relationship between the absolute rate of [Ca2+]i decay and [Ca2+]i was also shifted after the train, suggesting that one or more Ca2+ removal processes have been upregulated (Fig. 2C).
Figure 2. [Ca2+]i decay before and after a conditioning train of depolarizing pulses.
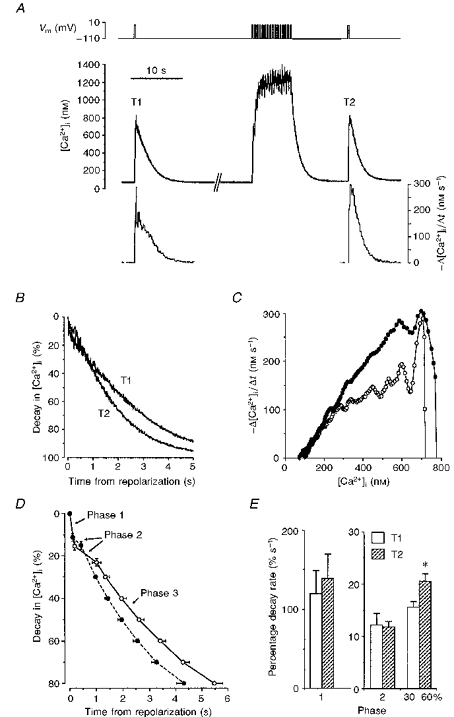
A, identical depolarizing pulses were applied before and after a train of repetitive depolarizations, as indicated in the top record (Vm). [Ca2+]i was recorded (middle trace) and used to calculate absolute decay rates (-Δ[Ca2+]i/Δt, bottom graph) for both the unconditioned transient (T1) and the conditioned transient evoked after the train (T2). B, superimposed plots showing the normalized decay in [Ca2+]i after cell repolarization for T1 and T2. C, graphs comparing the relationship between absolute decay rate (-Δ[Ca2+]i/Δt) and [Ca2+]i for the same 2 transients (T1, ^; T2, •). D, summary of the mean percentage decay in [Ca2+]i (±s.e.m.) after cell repolarization for unconditioned (T1, ^) and conditioned (T2, •) transients in 21 cells (17 animals). Mean [Ca2+]i decay during phases 1 and 2 is plotted along with the mean time required for subsequent [Ca2+]i decay plotted at 10 % intervals. E, mean percentage decay rates (±s.e.m.) for the 3 phases of [Ca2+]i decay in unconditioned (T1) and conditioned (T2) transients. Rates for phase 3 (30-60 %) were calculated for the [Ca2+]i decline from 30 % decay down to 60 % decay. Rates for phase 2, and for the 30-60 % interval have been scaled separately to allow easier comparison. * indicates a statistically significant difference between T1 and T2 rates (P < 0.0005, Wilcoxon signed-rank test).
Similar results were obtained in a series of twenty-one control cells in which [Ca2+]i decay was compared for transients evoked before and after a depolarizing train. The peak inward current (ICa) was increased by an average of 21 ± 5 % after the train (P < 0.005, paired t test applied to absolute current values, n = 20) due to Ca2+-dependent facilitation, as previously reported (McCarron, McGeown, Reardon, Ikebe, Fay & Walsh, 1992). This was associated with an increase in the mean value for the peak [Ca2+]i from 510 ± 45 nM in the initial transients to 621 ± 66 nM for transients following the train (P < 0.02, paired t test, n = 21). That accelerated decay during T2 did not depend on an increase in peak [Ca2+]i, however, is demonstrated by Fig. 2A in which an increased rate of [Ca2+]i decline is seen even though T1 and T2 are similar in amplitude. The conditioning train did not affect the rate or duration of the initial rapid phase of decay (Fig. 2D and E). There was, however, a reduction in the duration of the second, slow phase of decay from an average of 1.135 ± 0.175 s before, to 0.402 ± 0.084 s after the train (Fig. 2D, P < 0.001, paired t test, n = 16), although there were no changes in the corresponding mean percentage decay rates (phase 2 rates, Fig. 2E). The rate of decline during the final, more rapid phase, as measured over the 30-60 % decay interval, was further accelerated following the train, however, with an increase in the mean percentage decay rate from 15.7 ± 1.0 % s−1 for unconditioned transients (T1), to 20.7 ± 1.3 % s−1 for transients evoked after repetitive depolarization (T2) (30-60 % rates, Fig. 2E; P < 0.0005, Wilcoxon signed-rank test, n = 21).
Effect of calmodulin inhibition on [Ca2+]i decay
Experiments were carried out in which a calmodulin-binding peptide, known as RS20, was included in the pipette solution (200 μM) and pressure injected into the cell. This blocks the Ca2+-calmodulin signalling pathway responsible for many Ca2+-dependent processes (Cheung, 1980). Test depolarizations to +10 mV were then applied before and after the conditioning train, exactly as before. Data from experiments in which ICa was increased by more than 10 % after the train were excluded since successful injection with RS20 blocks this calmodulin-dependent facilitation (McCarron et al. 1992). Calmodulin blockade had several effects. The test transients were biphasic rather than triphasic, with an initial, prolonged period of rapid decline, followed by a slower tail of [Ca2+]i decay (Fig. 3A). The secondary acceleration of decline seen during the unconditioned transient in control cells was no longer apparent. In addition, there was no acceleration of [Ca2+]i decay following the depolarizing train, so that the normalized plots of [Ca2+]i against time for the two test pulses overlap for most of their extent (Fig. 3B). When the [Ca2+]i decay rates were plotted against [Ca2+]i for the two transients, the rates for the conditioned pulse (T2) were no faster than those for the unconditioned test pulse (T1, Fig. 3C). In a series of eight such cells the initial rapid decay phase for unconditioned pulses was prolonged, with a mean duration of 0.442 ± 0.066 s (Fig. 3D) compared with 0.191 ± 0.034 s under control conditions (Fig. 2D; P < 0.002, unpaired t test, n = 21). This phase accounted for 29 ± 4 % of the total decay in [Ca2+]i for RS20-treated cells (n = 8) compared with 15 ± 2 % for control cells (n = 21; P < 0.005, Mann-Whitney U test). Repetitive depolarization of RS20-treated cells produced no subsequent change in either the average profile of decay (Fig. 3D) or the mean percentage decay rates (Fig. 3E). It seems, therefore, that calmodulin blockade prolongs the initial phase of rapid [Ca2+]i decay and blocks the secondary acceleration of decay normally seen during a single transient. It also prevents any increase in the rate of decay after a conditioning train.
Figure 3. Effect of calmodulin inhibition on [Ca2+]i decay before and after a conditioning train.
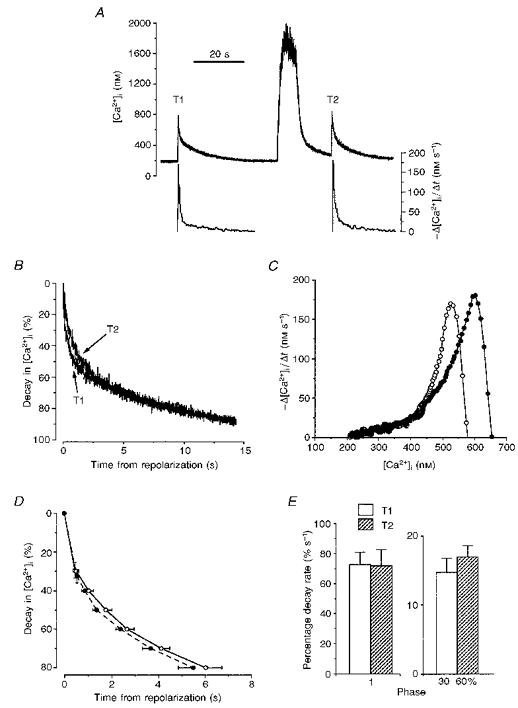
A, records showing [Ca2+]i (upper trace) and [Ca2+]i decay rate (-Δ[Ca2+]i/Δt), lower graphs) for the voltage protocol in Fig. 2A in a single cell pressure injected with the calmodulin-binding peptide RS20 (200 μM in pipette solution). B, superimposed records of the percentage decay in [Ca2+]i for T1 and T2. C, graphs showing the relationship between [Ca2+]i decay rate and [Ca2+]i during these 2 transients (T1, ^; T2, •). D, summary of the mean percentage decay in [Ca2+]i (±s.e.m.) for 8 cells (2 animals) injected with RS20. The first 2 points on each graph represent the initial, rapid phase of decay (Phase 1 in Fig. 1). Subsequent points represent fixed [Ca2+]i values plotted against time at 10 % intervals (T1, ^; T2, •). E, mean percentage decay rates (±s.e.m.) for the 2 phases of [Ca2+]i decay seen in unconditioned (T1) and conditioned (T2) transients. Rates for 30-60 % were for the [Ca2+]i fall from 30 % decay down to 60 % decay. Different scales apply to the decay rates for each of the two phases.
In an attempt to rule out non-specific actions of peptide injection, control experiments were carried out using NRS20 which, although it differs from RS20 by only a single amino acid deletion, has very little calmodulin-binding activity (McCarron et al. 1992). Cells pressure injected with NRS20 (200 μM in pipette solution) showed triphasic [Ca2+]i decay (data not shown). Facilitation of ICa was seen, with a 16 ± 3 % increase in the average value for peak current after the train (P < 0.01, paired t test, n = 6). The mean duration of the slow phase (phase 2) was shortened from 1.486 ± 0.072 s before to 0.366 ± 0.136 s after the conditioning train (P < 0.005, paired t test, n = 5) and the mean percentage decay rate over the 30-60 % decay interval was accelerated in each of the cells tested, rising from 9.8 ± 1.1 % s−1 before the train, to 14.4 ± 2.2 % s−1 after it (P < 0.05, Wilcoxon signed-rank test, n = 6). The similarity of these findings to those in uninjected cells indicates that it is the calmodulin-binding activity of RS20 which accounts for its effects.
Effect of inhibition of calmodulin-dependent protein kinase II
Many Ca2+-calmodulin-activated signalling pathways make use of the multifunctional calmodulin-dependent protein kinase II (Colbran et al. 1989). A previous study had demonstrated that the calcium-dependent facilitation of ICa in gastric myocytes from Bufo marinus was blocked by peptides which inhibit this enzyme (McCarron et al. 1992). In order to test whether calmodulin-dependent protein kinase II plays a role in the persistent acceleration of [Ca2+]i decay following the conditioning train, cells were pressure injected with CK3AA (200 μM in the pipette solution), a peptide based on the auto-inhibitory domain of the enzyme (Payne et al. 1988). When tested in vitro, CK3AA inhibited calmodulin-dependent protein kinase II from toad stomach with an IC50 of 8 μM (McCarron et al. 1992). Records from one CK3AA-injected cell show that there was neither an increase in the slope of [Ca2+]i decay (Fig. 4A and B), nor any change in the relationship between the decay rate and [Ca2+]i (Fig. 4C) after the conditioning train. The decay of [Ca2+]i during the unconditioned transient still occurred in three phases, however, as indicated by the peak-trough- peak pattern of the plot for decay rate against [Ca2+]i (Fig. 4C, see graph for T1). In two out of a series of six CK3AA-injected cells, the protease inhibitor leupeptin was also included in the pipette solution (20 μg ml−1) in order to minimize possible breakdown of the peptide. This produced no obvious change in the [Ca2+]i transients and results from all six cells have been grouped. Three phases of decay were identifiable within the initial (unconditioned) transient in four out of the six cells. After the conditioning train, however, the second, slower phase could only be identified in two cases and so no further attempt has been made to statistically summarize the phase 2 decay rates. Comparison of the mean percentage decay rates over the 30-60 % decay interval shows that CK3AA prevented any increase in the rate of [Ca2+]i decay following the conditioning train, with average values of 14.3 ± 3.1 % s−1 before, and 13.9 ± 2.6 % s−1 after the train (Fig. 4E; n.s., Wilcoxon signed-rank test, n = 6). Cells injected with the control peptide NCK3AA produced smaller transients than those studied under other conditions (Fig. 5A and B), perhaps due to increased buffering by injected fura-2. This may have accounted for the less pronounced increase in decay rate during phase 3 of T1 since this is [Ca2+]i dependent (McGeown et al. 1996). Nevertheless, these cells still demonstrated an enhanced rate of [Ca2+]i decline following the train, which produced a much higher [Ca2+]i than the single transients, with an increase in the mean percentage decay rate during phase 3 from 17.4 ± 2.5 % s−1 before to 23.8 ± 1.8 % s−1 after the train (Fig. 5E; P < 0.05, Wilcoxon signed-rank test, n = 5). Thus, it appears that the persistent enhancement of [Ca2+]i decay rate normally seen after the conditioning train is blocked by CK3AA through its action on calmodulin-dependent protein kinase II.
Figure 4. Effect of inhibition of calmodulin-dependent protein kinase II on [Ca2+]i decay.

A, records showing [Ca2+]i (upper trace) and [Ca2+]i decay rate (lower graphs) for a single cell pressure injected with the calmodulin-dependent protein kinase II antagonist CK3AA (200 μM in pipette solution). The voltage protocol in Fig. 2A was used. B, superimposed records of the percentage decay in [Ca2+]i for T1 and T2. C, graphs showing the relationship between [Ca2+]i decay rate and [Ca2+]i (T1, ^; T2, •). D, mean data summarizing [Ca2+]i decay during unconditioned (T1, ^) and conditioned (T2, •) transients in 6 cells (2 animals) pressure injected with CK3AA. Mean percentage decay in [Ca2+]i (±s.e.m.) against mean time from repolarization (±s.e.m.) is plotted for phases 1 and 2, and for fixed [Ca2+]i values at 10 % intervals. E, mean percentage decay rates (±s.e.m.) during phase 1 and for [Ca2+]i decay from 30 to 60 % (30-60 %). These rates have been plotted on separate scales. Phase 2 rates were excluded since only 2 cells showed a slow second phase after the conditioning train.
Figure 5. [Ca2+]i decay in the presence of the control peptide NCK3AA.

A, traces from a cell pressure injected with the peptide NCK3AA (200 μM in pipette solution) showing [Ca2+]i (upper record) and [Ca2+]i decay rate (lower graphs). The voltage protocol in Fig. 2A was applied. B, normalized [Ca2+]i data from the same experiment. C, relationship between [Ca2+]i decay rate and [Ca2+]i during T1 (^) and T2 (•). D, mean percentage fall in [Ca2+]i (±s.e.m.) plotted against time from repolarization for 5 cells (3 animals) injected with this control peptide. The initial points on each graph represent the first two phases of decay. Subsequent points plot the percentage [Ca2+]i at 10 % intervals (T1, ^; T2, •). E, mean percentage decay rates (±s.e.m.) during the 3 phases of decay. Phase 1 rates have been scaled separately. Phase 3 rates (30-60 %) were determined using the [Ca2+]i decay interval from 30 to 60 % total decay. * indicates a statistically significant difference between T1 and T2 rates (P < 0.05, Wilcoxon signed-rank test).
[Ca2+]i decay in presence of inhibitors of the sarcoplasmic reticulum Ca2+-ATPase
It seemed reasonable to suggest that the ability of calmodulin-dependent protein kinase II to increase the rate of [Ca2+]i decay after a conditioning train might depend on activation of the Ca2+-ATPase of the sarcoplasmic reticulum, especially since calmodulin-dependent kinases are known to stimulate Ca2+ pumping by sarcoplasmic reticulum membrane fragments from both cardiac and smooth muscle (Raeymaekers et al. 1988; Xu, Hawkins & Narayanan, 1993; Grover et al. 1996). In our preparation, however, cyclopiazonic acid (30 μM in bath solution), an agent which inhibits Ca2+ pumping by the sarcoplasmic reticulum, had no effect on the triphasic pattern of decay seen following the initial, unconditioned depolarizing pulse (T1, Fig. 6). It also failed to prevent the further increase in the late rate of decay after the conditioning train, with the mean phase 3 percentage decay rate rising from 15.9 ± 2.5 % s−1 before the train to 19.6 ± 1.5 % s−1 after it (Fig. 6E; P < 0.05, Wilcoxon signed-rank test, n = 8). Similar results were obtained with thapsigargin (500 nM in both bath and pipette solutions), another inibitor of the Ca2+-ATPase in the sarcoplasmic reticulum. Decay after a single pulse was again triphasic and the rate of [Ca2+]i decay during the final phase, measured between 30 and 60 % decay points, rose from 16.5 ± 1.6 % s−1 before to 23.0 ± 2.7 % s−1 after the conditioning train (P < 0.05, Wilcoxon signed-rank test, n = 9; data not shown). These results indicate that calmodulin-dependent upregulation of [Ca2+]i decay does not depend on increased Ca2+ uptake by the sarcoplasmic reticulum.
Figure 6. Effect of cyclopiazonic acid on [Ca2+]i decay.

A, records showing [Ca2+]i (upper trace) and [Ca2+]i decay rate (lower graphs) for a single cell exposed to cyclopiazonic acid (30 μM in bath solution). The voltage protocol in Fig. 2A was applied. B, superimposed records of the percentage decay in [Ca2+]i for T1 and T2. C, graphs of the relationship between [Ca2+]i decay rate and [Ca2+]i during these two transients (T1, ^; T2, •). D, mean percentage [Ca2+]i decay during unconditioned (T1, ^) and conditioned (T2, •) transients in 8 cells (3 animals) exposed to cyclopiazonic acid. The initial points on each graph represent the first two phases of decay. Subsequent points plot the percentage [Ca2+]i at 10 % intervals. E, mean percentage decay rates (±s.e.m.) during the 3 phases of decay in these cells (phase 1 rates have been scaled separately). Phase 3 rates (30-60 %) were determined using the [Ca2+]i decay interval from 30 to 60 % total decay. * indicates a statistically significant difference between T1 and T2 rates (P < 0.05, Wilcoxon signed-rank test).
DISCUSSION
This report extends a previous study demonstrating a persistent increase in the rate of [Ca2+]i decay following repetitive depolarization (Becker et al. 1989). With 300 ms step depolarizations, single transients decayed in three phases, with an initial rapid phase followed by a phase of slower decay leading to a final, faster phase (Fig. 1 and McGeown et al. 1996). Transients evoked following a conditioning train differed from paired, unconditioned transients in that the slow decay phase was shorter and the subsequent decline was more rapid (Fig. 2), with a reduction in the time taken for [Ca2+]i to fall between values 30 % and 60 % below the peak. One way to explain these findings is to propose a Ca2+-dependent upregulation of Ca2+ removal which develops within seconds. The rise in [Ca2+]i during a single transient would explain the delayed acceleration of decay (Phase 3, Fig. 1), which developed with a latency of 1.302 ± 0.166 s from depolarization (T1; n = 21). Prolonged exposure to high [Ca2+]i might be expected to further accelerate removal during test transients elicited after the conditioning train compared with paired, unconditioned transients (Fig. 2E; also Becker et al. 1989).
In considering the mechanisms underlying these changes two possibilities can initially be excluded. Firstly, although it has been shown that Ca2+ depletion of the sarcoplasmic reticulum may increase the rate of Ca2+ uptake (Ganitkevich & Isenberg, 1992) this is unlikely to explain the accelerated decay rate reported here since it was not blocked by inhibitors of the sarcoplasmic reticulum-associated Ca2+-ATPase (Fig. 6). In addition, experiments in which gastric myocytes were loaded with the relatively low-affinity dye mag-fura-2 as its acetoxymethyl ester, thus favouring indicator accumulation in membrane-bound subcellular compartments, suggest that [Ca2+] within the intracellular stores is unchanged during depolarizing trains (R. M. Drummond & F. S. Fay, unpublished results). A second possibility is that apparent changes in the percentage decay rate simply resulted from changes in the test transient amplitude (Bers & Berlin, 1995). The fact that the rate of decay was still increased in experiments in which the amplitudes of the test transients were similar (Fig. 2A), however, and that the relationship between absolute [Ca2+]i decay rate and [Ca2+]i was shifted upwards (Fig. 2C), indicate that there was true upregulation of removal.
Molecular basis of upregulation of [Ca2+]i decay
The ability of the calmodulin-binding agent RS20 to prevent the secondary increase in decay rate during a single transient as well as any additional persistent acceleration following a depolarizing train suggests that a Ca2+- calmodulin-dependent mechanism is responsible for both these features (Fig. 3). Injection of RS20 also prolonged the initial phase of rapid decay relative to control conditions, a point which will be discussed later. Upregulation of removal following the train appears to be mediated by calmodulin-dependent protein kinase II since injection with CK3AA prevented any further increase in the final rate of [Ca2+]i decay in the second test transient (Fig. 4). The secondary increase in decay rate during a single transient, however, was less effectively blocked by CK3AA than by RS20. Thus, Ca2+ removal during a single transient may be accelerated by a calmodulin-dependent pathway which does not require calmodulin-dependent protein kinase II. The data are inconclusive, however, and do not exclude the possibility that this process has also been partially inhibited by CK3AA.
Removal mechanisms and upregulation of [Ca2+]i decay
The identity of the Ca2+-removal mechanisms targeted by calmodulin and calmodulin-dependent protein kinase II is of considerable interest. This enzyme has been reported to stimulate Ca2+ uptake by the Ca2+-ATPase pump in the sarcoplasmic reticulum of vascular smooth muscle, with an association between calmodulin-dependent kinase phosphorylation of the sarcoplasmic reticulum Ca2+-ATPase and increased Ca2+ uptake in vitro (Grover et al. 1996). As mentioned above, however, the failure of cyclopiazonic acid or thapsigargin to block either the increased rate of decay during a single transient or the further acceleration of [Ca2+]i decline after the conditioning train (Fig. 6), and the absence of any depolarization-induced change in store [Ca2+], as measured using mag-fura-2, are inconsistent with a major role for upregulation of Ca2+ pumping by the sarcoplasmic reticulum under current conditions. In addition, the rate of decline of store [Ca2+] following treatment with thapsigargin is slow, suggesting a low rate of unstimulated leak, which may explain why baseline [Ca2+]i was not increased with this drug (R. M. Drummond & F. S. Fay, unpublished results). It appears, therefore, that although agonists such as caffeine can release stored Ca2+ in these cells (Guerrero, Fay & Singer, 1994), uptake into these stores is not important in removing Ca2+ following influx through voltage-activated channels.
Previous studies also indicated that [Ca2+]i decay could still be accelerated when the [Na+] gradient driving Na+-Ca2+ exchange was abolished (McGeown et al. 1996). Inhibitors of mitochondrial Ca2+ transport, on the other hand, prevented any increase in the rate of [Ca2+]i decline during a single transient, converting a triphasic temporal profile of decay to a biphasic one, and also blocked the increase in decay rate normally seen following a conditioning train (McGeown et al. 1996; Drummond & Fay, 1996). This suggests that the upregulation of [Ca2+]i decay normally seen reflects increased mitochondrial Ca2+ transport. The previously reported effects of mitochondrial blockade correlate well with those described here for RS20, suggesting that Ca2+- calmodulin upregulates Ca2+ removal by mitochondria in this cell type. This may also explain why RS20 prolonged the initial phase of rapid [Ca2+]i decay (Fig. 3). Re-analysis of grouped data from experiments using the mitochondrial Ca2+ uptake inhibitors FCCP and Ruthenium Red (Figs 10 and 11 of McGeown et al. 1996) demonstrated that they also enhanced the initial rapid phase, increasing the percentage contribution of phase 1 to total [Ca2+]i decay from 13 ± 2 % in control cells (n = 19) to 20 ± 3 % in the presence of these agents (n = 11, P < 0.05, Mann-Whitney U test). Equivalent values in the current experiments were 29 ± 4 % in RS20-injected cells (n = 8) and 15 ± 2 % for control cells (n = 21, P < 0.001, Mann-Whitney U test). It is tempting to speculate, therefore, that following Ca2+ influx, mitochondria and the Na+-Ca2+ exchanger compete for Ca2+, with Ca2+ uptake into mitochondria reducing [Ca2+] near the plasma membrane, thus curtailing the period during which removal by the low-affinity but high-capacity Na+-Ca2+ exchanger predominates (Matlib, Kihara, Farrell & Dage, 1988). If Ca2+ removal by this exchanger accounts for the initial phase of rapid [Ca2+]i decay (McGeown et al. 1996), then either inhibition of mitochondrial Ca2+ uptake, e.g. with FCCP, or blockade of upregulation of mitochondrial Ca2+ removal, e.g. with RS20, could prolong this rapid phase.
The role of the plasma membrane Ca2+-ATPase has not been tested directly in this study, largely due to the absence of the specific pharmacological tools. Calmodulin inhibition might be expected to reduce the rate of Ca2+ pumping by the plasma membrane Ca2+-ATPase (Carafoli & Stauffer, 1994), so the effects of RS20 could be consistent with a role for this system in the normal acceleration of decay. Nevertheless, the ability of mitochondrial inhibitors to completely block any upregulation, despite cell dialysis with 3.5 mM ATP as a substrate for ATP-dependent pumps, suggests that other removal mechanisms do not play a crucial role (McGeown et al. 1996; Drummond & Fay, 1996). This does not, of course, preclude involvement of Ca2+ pumping across the cell membrane in determining the background rate of [Ca2+]i decay, e.g. as revealed when calmodulin-dependent acceleration has been blocked (Fig. 3).
Overview and conclusions
A synthesis of the current results with those reported in previous studies (Becker et al. 1989; Drummond & Fay, 1996; McGeown et al. 1996) suggests the following model for Ca2+ removal in amphibian gastric myocytes under voltage-clamp conditions. The initial influx of Ca2+ through voltage-gated channels leads to a high [Ca2+] near the membrane. This favours rapid Ca2+ removal via Na+-Ca2+ exchange during phase 1 of decay (Fig. 1). As the near-membrane [Ca2+] falls, [Ca2+]i decay rate decreases, leading to phase 2 of the transient. This phase presumably reflects basal removal by the plasma membrane Ca2+-ATPase and the mitochondria. Mitochondrial Ca2+ transport is then upregulated by a calmodulin-dependent protein kinase, leading to accelerated decay in phase 3. The latency in this process may well depend on the time required for activation of a multistep signalling pathway. Prolonged elevation of [Ca2+]i during a depolarizing train produces further concentration- and time-dependent upregulation of mitochondrial uptake, leading to a faster decay rate on repolarization. Activation of some of the relevant targets in the pathway persists after [Ca2+]i has returned to basal levels, probably due to persistent phosphorylation. This accelerates the final phase of rapid decay for transients elicited after the train compared with those elicited before it (phase 3 rates, Fig. 2E). Prior activation of some of the steps in the pathway responsible for upregulation of removal might also be expected to reduce the time taken for subsequent acceleration of mitochondrial uptake, thus shortening the phase 2 duration in transients elicited after the train (Fig. 2D).
In conclusion, we propose that Ca2+ removal in amphibian gastric myocytes is upregulated by Ca2+-calmodulin acting through a Ca2+-calmodulin-dependent protein kinase closely related to calmodulin-dependent protein kinase II. This pathway does not accelerate Ca2+-ATPases in the sarcoplasmic reticulum or increase Na+-Ca2+ exchange but rather promotes mitochondrial Ca2+ uptake. We believe this to be a novel mechanism for the regulation of smooth muscle [Ca2+]i. In addition, since several mitochondrial dehydrogenases are Ca2+ sensitive, upregulation of mitochondrial Ca2+ transport may also play a role in coupling mitochondrial activity to cellular metabolic needs during periods of repetitive cell stimulation (Hansford, 1994).
Acknowledgments
This work was supported by grants from The Wellcome Trust (grant no. 038710/Z/93/Z to G. McG. and grant no. 036885/Z/92/Z to J. McC.) and the NIH (HL14523 and HL47530 to F. S. F.), and a postdoctoral fellowship from the Massachusetts Heart Association (R. M. D.). We wish to thank Kristine Perry and Jeff Carmichael for their expert technical assistance.
References
- Baró I, O'Neill SC, Eisner DA. Changes of intracellular [Ca2+] during refilling of sarcoplasmic reticulum in rat ventricular and vascular smooth muscle. Journal of Physiology. 1993;465:21–41. doi: 10.1113/jphysiol.1993.sp019664. [DOI] [PMC free article] [PubMed] [Google Scholar]
- Becker PL, Singer JJ, Walsh JV, Jr, Fay FS. Regulation of calcium concentration in voltage clamped smooth muscle cells. Science. 1989;244:211–214. doi: 10.1126/science.2704996. [DOI] [PubMed] [Google Scholar]
- Bers DM, Berlin JR. Kinetics of [Ca]i decline in cardiac myocytes depend on peak [Ca]i. American Journal of Physiology. 1995;268:C271–277. doi: 10.1152/ajpcell.1995.268.1.C271. [DOI] [PubMed] [Google Scholar]
- Carafoli E, Stauffer T. The plasma-membrane calcium-pump - functional domains, regulation of activity, and tissue specificity of isoform expression. Journal of Neurobiology. 1994;25:312–324. doi: 10.1002/neu.480250311. [DOI] [PubMed] [Google Scholar]
- Cheung WY. Calmodulin plays a pivotal role in cellular regulation. Science. 1980;207:19–27. doi: 10.1126/science.6243188. [DOI] [PubMed] [Google Scholar]
- Colbran RJ, Schworer CM, Hashimoto Y, Fong YL, Rich DP, Smith MK, Soderling TR. Calcium calmodulin-dependent protein kinase-II. Biochemical Journal. 1989;258:313–325. doi: 10.1042/bj2580313. [DOI] [PMC free article] [PubMed] [Google Scholar]
- Colyer J, Wang JH. Dependence of cardiac sarcoplasmic-reticulum calcium pump activity on the phosphorylation status of phospholamban. Journal of Biological Chemistry. 1991;266:17486–17493. [PubMed] [Google Scholar]
- Drummond RM, Fay FS. Mitochondria contribute to Ca2+ removal in smooth muscle cells. Pflügers Archiv. 1996;431:473–482. doi: 10.1007/BF02191893. [DOI] [PubMed] [Google Scholar]
- Drummond RM, McCarron JG, Ikebe M, Walsh JV, Fay FS. Calmodulin dependent protein kinase II is responsible for persistent acceleration of Ca2+ removal in smooth muscle. Biophysical Journal. 1994;66:A96. [Google Scholar]
- Fay FS, Hoffman R, Leclair S, Merriam P. Preparation of individual smooth-muscle cells from the stomach of Bufo marinus. Methods in Enzymology. 1982;85:284–292. doi: 10.1016/0076-6879(82)85027-1. [DOI] [PubMed] [Google Scholar]
- Ganitkevich VYa, Isenberg G. Caffeine-induced release and reuptake of Ca2+ by Ca2+ stores in myocytes from guinea-pig urinary bladder. Journal of Physiology. 1992;458:99–117. doi: 10.1113/jphysiol.1992.sp019408. [DOI] [PMC free article] [PubMed] [Google Scholar]
- Grover AK, Xu A, Samson SE, Narayanan N. Sarcoplasmic-reticulum Ca2+ pumping in pig coronary-artery smooth-muscle is regulated by a novel pathway. American Journal of Physiology. 1996;271:C181–187. doi: 10.1152/ajpcell.1996.271.1.C181. [DOI] [PubMed] [Google Scholar]
- Grynkiewicz G, Poenie M, Tsien RY. A new generation of Ca2+ indicators with greatly improved fluorescence properties. Journal of Biological Chemistry. 1985;260:3440–3450. [PubMed] [Google Scholar]
- Guerrero A, Fay FS, Singer JJ. Caffeine activates a Ca2+-permeable, nonselective cation channel in smooth muscle cells. Journal of General Physiology. 1994;104:375–394. doi: 10.1085/jgp.104.2.375. [DOI] [PMC free article] [PubMed] [Google Scholar]
- Hansford RG. Physiological role of mitochondrial Ca2+ transport. Journal of Bioenergetics and Biomembranes. 1994;26:495–508. doi: 10.1007/BF00762734. [DOI] [PubMed] [Google Scholar]
- Kostyuk PG, Shirokov RE. Deactivation kinetics of different components of calium inward current in the membrane of mice sensory neurones. Journal of Physiology. 1989;409:343–355. doi: 10.1113/jphysiol.1989.sp017501. [DOI] [PMC free article] [PubMed] [Google Scholar]
- Lukas TJ, Burgess WH, Prendergast FG, Lau W, Watterson DM. Calmodulin binding domains - characterization of a phosphorylation and calmodulin binding-site from myosin light chain kinase. Biochemistry. 1986;25:1458–1464. doi: 10.1021/bi00354a041. [DOI] [PubMed] [Google Scholar]
- McCarron JG, McGeown JG, Reardon S, Ikebe M, Fay FS, Walsh JV., Jr Calcium-dependent enhancement of calcium current in smooth muscle by calmodulin-dependent protein kinase II. Nature. 1992;357:74–77. doi: 10.1038/357074a0. [DOI] [PubMed] [Google Scholar]
- McCarron JG, Walsh JV, Jr, Fay FS. Sodium/calcium exchange regulates cytoplasmic calcium in smooth muscle. Pflügers Archiv. 1994;426:199–205. doi: 10.1007/BF00374772. [DOI] [PubMed] [Google Scholar]
- McGeown JG, Drummond RM, McCarron JG, Fay FS. The temporal profile of calcium transients in voltage clamped gastric myocytes from Bufo marinus. Journal of Physiology. 1996;497:321–336. doi: 10.1113/jphysiol.1996.sp021771. [DOI] [PMC free article] [PubMed] [Google Scholar]
- McGeown JG, McCarron JG, Ikebe M, Walsh JV, Fay FS. Ca-calmodulin accelerates Ca removal in isolated smooth muscle cells. Biophysical Journal. 1992;61:A336. [Google Scholar]
- McGeown JG, McCarron JG, Ikebe M, Walsh JV, Jr, Fay FS. Calcium-calmodulin induces persistent enhancement of calcium removal in isolated gastric smooth muscle cells from Bufo marinus. Journal of Physiology. 1993a;459:339P. [Google Scholar]
- McGeown JG, McCarron JG, Ikebe M, Walsh JV, Jr, Fay FS. Acceleration of calcium removal in smooth muscle by calcium-calmodulin. XXXII Congress of the International Union of Physiological Sciences. 1993b;140.21/P [Google Scholar]
- Matlib MA, Kihara M, Farrell C, Dage RC. The Na+-Ca2+ exchange system in vascular smooth muscle cell membrane vesicles isolated from cultured cells and from tissue is similar. Biochimica et Biophysica Acta. 1988;939:173–177. doi: 10.1016/0005-2736(88)90060-0. [DOI] [PubMed] [Google Scholar]
- Missiaen L, Desmedt H, Droogmans G, Himpens B, Casteels R. Calcium-ion homeostasis in smooth-muscle. Pharmacology and Therapeutics. 1992;56:191–231. doi: 10.1016/0163-7258(92)90017-t. [DOI] [PubMed] [Google Scholar]
- Missiaen L, Wuytack F, Raeymaekers L, Desmedt H, Droogmans G, Declerck I, Casteels R. Ca2+ extrusion across plasma-membrane and Ca2+ uptake by intracellular stores. Pharmacology and Therapeutics. 1991;50:191–232. doi: 10.1016/0163-7258(91)90014-d. [DOI] [PubMed] [Google Scholar]
- Payne MM, Fong YL, Ono T, Colbran RJ, Kemp BE, Soderling TR, Means AR. Calcium calmodulin-dependent protein kinase-II - characterization of distinct calmodulin binding and inhibitory domains. Journal of Biological Chemistry. 1988;263:7190–7195. [PubMed] [Google Scholar]
- Raeymaekers L, Hofmann F, Casteels R. Cyclic GMP-dependent protein-kinase phosphorylates phospholamban in isolated sarcoplasmic-reticulum from cardiac and smooth-muscle. Biochemical Journal. 1988;252:269–273. doi: 10.1042/bj2520269. [DOI] [PMC free article] [PubMed] [Google Scholar]
- Van Breemen C, Saida K. Cellular mechanisms regulating [Ca2+]i in smooth muscle. Annual Review of Physiology. 1989;51:315–329. doi: 10.1146/annurev.ph.51.030189.001531. [DOI] [PubMed] [Google Scholar]
- Williams DA, Fogarty KE, Tsien RY, Fay FS. Calcium gradients in single smooth-muscle cells revealed by the digital imaging microscope using fura-2. Nature. 1985;318:558–561. doi: 10.1038/318558a0. [DOI] [PubMed] [Google Scholar]
- Xu A, Hawkins C, Narayanan N. Phosphorylation and activation of the Ca2+-pumping ATPase of cardiac sarcoplasmic-reticulum by Ca2+/calmodulin-dependent protein-kinase. Journal of Biological Chemistry. 1993;268:8394–8397. [PubMed] [Google Scholar]