Abstract
Visual response properties and conduction velocities of retinal ganglion cells were studied by extracellular recordings in the intact goldfish eye. Visually responsive single units were confirmed as ganglion cells by collision testing, and their receptive fields were mapped.
From compound action potentials, we identified groups I-V in the optic nerve, with overall conduction velocities of 11.5 ± 1.17, 7.1 ± 0.79, 4.4 ± 0.56, 3.1 ± 0.31 and 2.3 ± 0.18 m s−1 (mean ± s.d.) at 23 °C.
Ganglion cells were classified by their receptive fields as off-, on-off- or on-centre. Nearly all confirmed ganglion cells had axonal conduction velocities in groups II, III and IV; none fell in the fastest group, I.
Off-centre ganglion cells had conduction velocities only in the fast group, II. On-off-centre cells fell mainly in group III, with some in group II. On-centre cells fell in groups II-V, but mainly in groups III and IV.
Receptive field centre diameters were 5-30 deg measured with a photopic background. The mean diameters for off-, on-off- and on-centres were 24, 15 and 18 deg, respectively. The relatively larger diameter and higher rate of spontaneous firing of the off-centre cells were maintained under different adaptation conditions.
The off-centre cells can be identified with an anatomical class of large, α-like ganglion cells in the goldfish retina.
Much work has gone into classifying the retinal ganglion cells of various vertebrate species. In the case of cats and monkeys, different ganglion cell types can be consistently identified by both their physiology and their morphology (for reviews see Kaplan, Lee & Shapley, 1990; Wässle & Boycott, 1991). As a result, we can see the main types as information channels signalling such dimensions of visual input as colour and movement, their influence threading through several levels of the visual system (Van Essen & Gallant, 1994).
Although the goldfish retina has been studied intensively, and the goldfish retinotectal system has long been a model for understanding the formation of ordered neural connections (Sharma, 1993), there are still no satisfying correlations between structure and function for goldfish retinal ganglion cells. They bear morphological resemblances to ganglion cells in cats and monkeys in that there are large α-like cells, in addition to a variety of smaller types (Hitchcock & Easter, 1986; Cook, Becker & Kapila, 1992). Goldfish ganglion cell functional properties are also familiar, having been characterized as on/off, X-like/Y-like, tonic/ phasic, spectrally opponent/non-opponent and spatially opponent/non-opponent (Levine & Shefner, 1979; Bilotta & Abramov, 1989), but it is unclear how these cohere to form a classification. For example, establishing that a goldfish retinal ganglion cell is X-like does not predict its spectral properties or its receptive field size (Bilotta & Abramov, 1989).
Here we apply a simple and venerable system of analysing visual receptive fields (Hartline, 1938), characterizing goldfish ganglion cells as either on-, off-, or on-off-centred. We then determine the conduction velocities of their axons. Because conduction velocity is directly related to axon calibre, and hence to soma size and dendritic field, the results help make the functional-morphological correlation.
Another aim was to understand the organization of retinofugal information channels in goldfish, and how they signal and reconnect to the brain during optic nerve regeneration (Northmore, 1987). Several pieces of experimental data suggest that positive and negative contrasts are processed differently, not only in the eye (Famiglietti, Kaneko & Tachibana, 1977), but also in the midbrain of goldfish. The optic tectum is reciprocally connected with the torus longitudinalis (TL), a nucleus peculiar to actinopterygian fish (Northcutt, 1983). The TL receives off-input transynaptically from the tectum, accounting for the responsiveness of the TL to negative contrast stimuli and to dimming of the visual field (Northmore, 1984). In studies of visual recovery during regeneration of the goldfish optic nerve, the first multiunit responses recordable in the tectum were evoked by negative contrasts and dimming (Northmore, 1989). Responses to the same stimuli simultaneously reappeared in the TL. From the time of their appearance, 20 days after optic nerve crush, the ‘off’ multiunit receptive fields in the tectum and the TL shrank progressively to normal; only after 40 days were small spots of light able to evoke on-responses from the tectum. This sequence of recovery was mirrored in psychophysical tests on fish with regenerating optic nerves, showing that negative contrast stimuli were detected before positive contrast stimuli (Northmore & Celenza, 1992).
Close morphological parallels were found in the pattern of regenerating optic terminals in the tectum by Schmidt, Turcotte, Buzzard & Tieman (1988). During early regeneration, when only off-responses are recorded, the tectum is covered by abnormally large terminal arbors that stem from large-calibre axons. Later, when on-responses recover, the large arbors have shrunk and many smaller arbors have moved into place on the tectum, the smaller arbors stemming from intermediate and small-calibre optic axons (see also Stuermer, 1984).
The implication is that off-signals are conveyed to the tectum by the largest axons and arbors, while on-signals are conveyed by smaller axons and arbors. Here, we confirmed this prediction by recording from ganglion cells intraocularly, and correlating their response properties with axon conduction velocities.
METHODS
Goldfish (Carassius auratus), of 6.5-9 cm (mean, 7.5 cm) standard body length, were obtained from local fish suppliers, kept under a light regimen of 14 h light, 8 h dark at 23-25°C, and fed dried goldfish pellets. Before electrophysiological recording, fish were deeply anaesthetized by immersion in a pH-neutralized 0.05% solution of tricaine methanesulphonate (Sigma) until breathing ceased. The cranium was opened by removing a flap of skull with a sharp scalpel and trimming the opening with rongeurs. The fish was then mounted in an upright position with its long axis horizontal on a stainless steel V-block. A stainless steel tube was inserted into the mouth to support the head and provide a stream of aerated water during electrophysiological recording. The wound margins were treated with a local anaesthetic (lidocaine (lignocaine), Sigma). The entire forebrain was removed by aspiration, exposing the optic tracts. These surgical procedures were completed within 5 min, well within the time normally required for movements to recover after anaesthesia. The fish was then immobilized by an injection of 0.1-0.2 mg Flaxedil (Davis & Geck, Pearl River, NY, USA) into the dorsal musculature. To allow electrode access to the retina, a slit 0.5 mm long was made with a scalpel in the top of the eyeball, close to the corneoscleral junction.
The tip of a concentric stimulating electrode (Frederick Haer & Co., Brunswick, ME, USA) was placed on the right optic tract just anterior to the optic tectum. A reference electrode was placed just inside the slit opening in the eyeball, and the recording microelectrode (4-5 MΩ tungsten, Frederick Haer & Co., or 1-2 MΩ stainless steel or tungsten, Microprobe Inc., Clarksburg, MD, USA) was inserted through the same opening at 45 deg to the vertical. A hydraulic microdrive advanced the electrode tip through the vitreous humour, aiming at the central retina.
Ganglion cells were activated antidromically by delivering 0.1 ms cathodal pulses via the stimulating electrode from a constant-current stimulus isolation unit (Model PSIU6, Grass Instrument Co.). Maximal compound action potentials could be recorded by the microelectrode in, or close to, the retina using the 0.1-1.5 mA current range on the isolation unit. All electrically stimulated responses were recorded differentially between the microelectrode and the reference electrode, amplified with a band pass of 1 Hz to 10 kHz (half-amplitude), and sampled at 60 kHz by an A/D convertor and computer.
Spontaneous and visually evoked single unit activity was recorded extracellularly with the microelectrode using the same differential amplifier, bandpass filtered (0.1-3 kHz, half-amplitude), and digitized at 7-10 kHz sampling rate for storage and analysis by the computer. For collision experiments, a visually evoked spike was isolated by a time-amplitude window discriminator (Model DIS-1, Bak Electronics, Rockville, MD, USA), which triggered the electrical stimulus to the optic tract after a predetermined delay.
Ganglion cell receptive fields were mapped by visual stimulation with red light-emitting diodes (LEDs), arranged in a concave, rectangular array five high and thirteen wide at a radial distance of 3.5 cm from the left eye. The LEDs (maximum wavelength, 665 nm), selected for equal radiant intensity, shone through a sheet of white paper covering the array, making circular patches of light (84 cd m−2) that subtended 5 deg, on 5 deg centres. The LED array was positioned to cover the receptive field being studied. In most experiments, the eye was adapted to a background luminance of 5 cd m−2 produced by an unfocused tungsten-halogen lamp that shone onto the white paper covering the LED array. Individual LEDs were flashed for 200 ms in a random order. The computer sampled the amplified waveform from the microelectrode and stored it for later analysis, which involved window discrimination of spikes, and the compilation of spike rasters and peristimulus time histograms.
In experiments to measure receptive field size, a specially fabricated contact lens was used to mitigate the high degree of astigmatism and myopia suffered by the goldfish eye in air (Charman & Tucker, 1973). This lens was made from a polished Plexiglass hemisphere (refractive index, 1.49) of radius 12.7 mm with a concentric cavity of radius 4.2 mm that was placed over the cornea and kept filled by a continuous trickle of water. The lens was originally designed to focus the goldfish eye, assumed to be emmetropic under water, for objects at 130 mm in air (Northmore, 1989). Points in the plane of the LED array, being 35 mm distant, would be imaged on the retina with a blur circle subtending about 3 deg. Receptive field centre diameters measured with the lens averaged 67% of the diameters measured without the lens, indicating a substantial corrective effect. Because the added complication of fitting the lens reduced the yield of recordable single units, the lens was not generally used in experiments that correlated conduction velocity with receptive field centre type.
After isolating a single retinal unit and determining its receptive field properties, shocks was delivered to the optic tract in order to fire the unit antidromically and to determine its axonal conduction velocity. A range of shock currents was used to determine the firing threshold of the unit, and a sufficiently strong suprathreshold shock was chosen that elicited antidromic spikes with a reliable minimal latency. Collision testing was done by triggering the optic tract shock from a light-evoked spike after an adjustable delay. At the end of the experiment, the brain was destroyed by aspiration.
Conduction distances were obtained by dissecting a representative sample of fish and measuring the distances between the stimulating point on the optic tract, the optic chiasm and the optic disc. The intraretinal conduction distance was estimated by making a puncture mark in the retina at the recording site and measuring the distance to the optic disc. Recording sites were 1-2 mm dorsal to the optic disc.
RESULTS
As the tip of the recording electrode approached the retina, maximal shocks to the optic tract elicited a complex waveform that grew in amplitude. Figure 1 shows two such waveforms recorded in different experiments that together demonstrate the five negative waves (i-v) seen in this study. The negative waves are axonal compound action potentials whose latencies were: 0.70 ± 0.08, 1.13 ± 0.14, 1.83 ± 0.26, 2.62 ± 0.29 and 3.52 ± 0.29 ms (mean ±s.d.). The total distance between the stimulating and recording sites was estimated to be 8.1 ± 0.5 mm (mean ±s.d.), of which 1.5 ± 0.3 mm were intraretinal. The overall axonal conduction velocities were calculated to be: 11.57 ± 1.17, 7.13 ± 0.79, 4.43 ± 0.56, 3.09 ± 0.31 and 2.30 ± 0.18 m s−1 (mean ±s.d.), at a temperature of 23°C.
Figure 1. Compound action potentials recorded in retina evoked by optic tract stimulation.
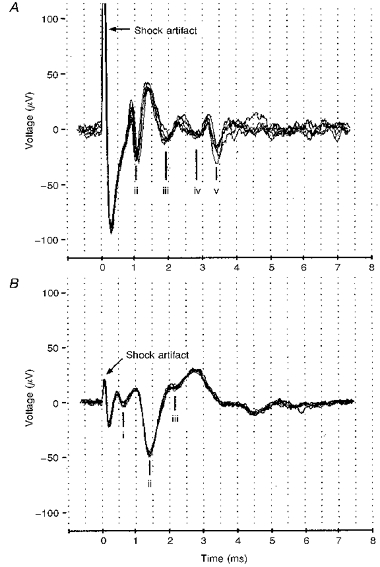
A, four negative waves labelled ii, iii, iv and v are typically recorded at latencies of 1, 1.8, 2.8, and 3.4 ms. B, a different recording of compound action potentials showing the fastest wave, i, at a latency of 0.7 ms, in addition to waves ii and iii.
In Table 1, the numbers outside parentheses show the frequencies with which the five waves were observed in recordings of compound action potentials from forty-one goldfish. Waves ii-v were seen in most recordings, but in some recordings only waves ii-iv were seen. Wave i with 0.7 ms latency tended to be masked by the stimulus artifact, but could be seen with weak stimulation in some recordings (e.g. Fig. 1B). Although all five waves were never seen together in a recording, those that were could be put into the conduction velocity groups that we designate I, II, III, IV and V, albeit with some overlap. Wave i, when seen, always occurred with the later wave ii, hence the justification for separate conduction velocity groups I and II.
Table 1.
Latency distribution of electrically evoked action potentials and their corresponding conduction velocity groups
| Wave | |||||||
|---|---|---|---|---|---|---|---|
| Group no. | |||||||
| Latency (ms) | i | ii | iii | iv | v | Totals | |
| 0·0 | 0 | ||||||
| 0·2 | 0 | ||||||
| 0·4 | 0 | ||||||
| I | 0·6 | 5 | 5 | ||||
| 0·8 | 11 | 11 | |||||
| II | 1·0 | 14 (6) | 14 (6) | ||||
| 1·2 | 21 (10) | 21 (10) | |||||
| 1·4 | 10 (6) | 4 | 14 (6) | ||||
| III | 1·6 | 9 (5) | 9 (5) | ||||
| 1·8 | 8 (4) | 8 (4) | |||||
| 2·0 | 17 (7) | 17 (7) | |||||
| 2·2 | 4 (1) | 1 | 5 (1) | ||||
| IV | 2·4 | 3 (1) | 15 (3) | 18 (4) | |||
| 2·6 | 10 (2) | 10 (2) | |||||
| 2·8 | 8 (1) | 8 (1) | |||||
| 3·0 | 7 (2) | 1 | 8 (2) | ||||
| V | 3·2 | 5 | 4 | 9 | |||
| 3·4 | 6 (1) | 6 (1) | |||||
| 3·6 | 5 | 5 | |||||
| 3·8 | 5 | 5 | |||||
| 4·0 | 2 | 2 | |||||
| 4·2 | 1 | 1 | |||||
| Totals | 16 | 45 (22) | 45 (18) | 45 (8) | 24 (1) | 176 (49) | |
The numbers outside parentheses give the number of times the waves i-v were observed in compound action potentials in retinal recordings from 41 different goldfish. Numbers in parentheses give the number of single units confirmed as retinal ganglion cells by collision testing.
After isolation of a single unit in the retina, its receptive field was mapped using the LED array. The resulting spike rasters and peristimulus time histograms, examples of which are shown in Fig. 2, allowed units to be classified by the field centre responses as either off-, on-off-, or on-centre units. The axon conduction velocity was then measured by antidromic activation. Whenever possible, the ganglionic origin of the spike was confirmed by a collision test.
Figure 2. Receptive field plots of an off-centre unit.
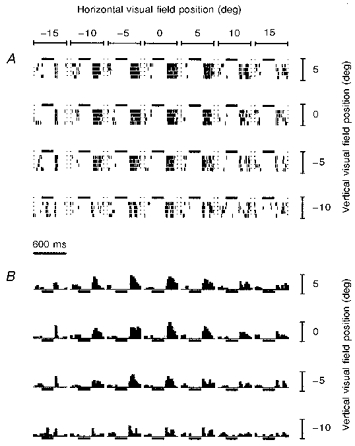
A, spike rasters showing responses to 4 repetitions of flashes delivered at each of 28 (4 × 7) positions in the 13 × 5 LED array. Horizontal and vertical spacing of LEDs was 5 deg. Each raster, delimited by columns of small dots, lasted 600 ms. Horizontal bars show the LED duration of 200 ms. B, peristimulus time histograms derived from the spike rasters. Horizontal bars show LED duration.
Figure 2 shows a typical receptive field mapping of an off- centre unit with the eye optically corrected by the contact lens. Spike responses to seven horizontal and four vertical field positions spaced 5 deg apart are shown by spike rasters (Fig. 2A) and corresponding peristimulus time histograms (Fig. 2B). Each raster and histogram represents a 600 ms period containing the 200 ms LED flash. The greatest concentration of spiking indicated the receptive field centre, which in this case occurred to the LED offset. Usually, receptive field centres were horizontally symmetrical; the limited height of the LED array precluded any assessment of vertical symmetry. A differently responding surround region was not always observed. Figure 3A shows the same unit antidromically activated by electrical stimulation of the optic tract with a latency of 1 ms, corresponding to the conduction velocity group II. That this antidromic spike was fired by the same ganglion cell that generated the receptive field mapping was proved by collision with light-evoked spikes. When one of these spikes triggered the electrical stimulus after an interval greater than about 1 ms, an antidromic spike was recorded in the retina (Fig. 3A); when the interval was less than 1 ms, the antidromic spike was abolished by collision (Fig. 3B).
Figure 3. Antidromic activation of an off-centre unit by electrical stimulation of the optic tract.
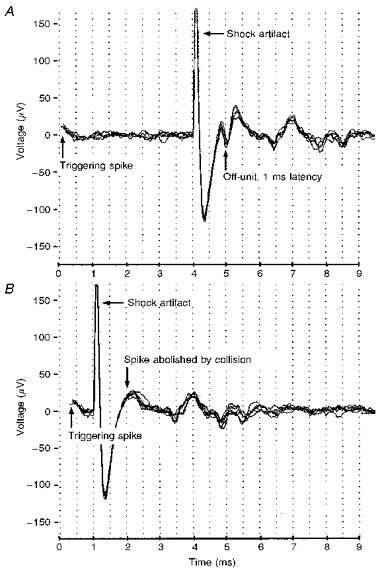
A, light-evoked spikes initiated the traces at the arrow indicated by ‘Triggering spike’. Shocks given after a 4 ms delay evoked an antidromic spike with 1 ms latency, indicating conduction velocity group II. Several successive traces are shown superimposed. B, no antidromic spike was recorded when shocks were given at less than 1 ms delay, due to collision with the light-evoked spike.
The parentheses in Table 1 denote the number of ganglion cells that were successfully confirmed by collision tests, and how their spike latencies fell within the conduction velocity groups I-V. The way in which a cell's functional classification by receptive field centre response related to its axonal conduction latency is shown by the histogram of Fig. 4, which summarizes the properties of units that were confirmed as retinal ganglion cells by collision tests. No visually responsive units were found in the fastest group, I. All off-centre cells fell into group II. On-centre cells were widely distributed from group II to group V, but fell mainly into groups III and IV. On-off-centre cells fell almost entirely into groups II and III. The mean latencies of the three functional types of ganglion cell were statistically different from each other (P < 0.001, ANOVA). Off-centre ganglion cells had the shortest latencies (1.16 ± 0.14 ms, n = 17), followed by on-off-centres (1.64 ± 0.38 ms, n = 15), followed by on-centres (2.26 ± 0.53 ms, n = 17). All post hoc comparisons between pairs were statistically significant (P < 0.05, Tukey's test).
Figure 4. Distribution of centre types among conduction velocity groups.
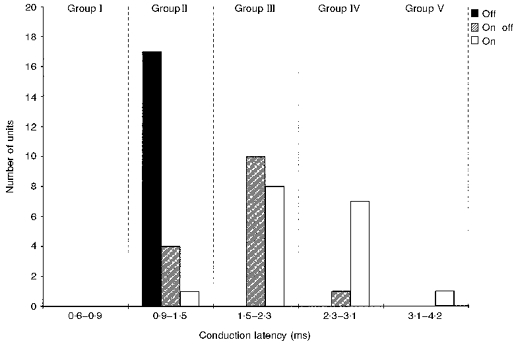
Histogram shows numbers of off-, on-off- and on-centre units falling into each conduction velocity group. All units were verified as ganglion cells by collision testing.
To obtain estimates of receptive field centre size, mappings were made of seventy-nine retinal units with the eye corrected by the contact lens at a background luminance of 5 cd m−2. The horizontal diameters of receptive field centres were measured by plotting the numbers of spikes evoked at each horizontal LED position. Using the row of LEDs that yielded the highest rate of firing, at either on or off, the half-maximum width was obtained by interpolation. Figure 5 shows that the three receptive field centre types had different size distributions. The off-centre fields were the largest in diameter (23.6 ± 4.0 deg, mean ±s.d., n = 32), followed by on-centres (18.2 ± 2.6 deg, n = 16), followed by on-off-centres (15.2 ± 3.6 deg, n = 30), the means being statistically different from each other (P < 0.001, ANOVA). All post hoc comparisons between pairs were statistically significant (P < 0.05, Tukey's test).
Figure 5. Size distribution of centre types.
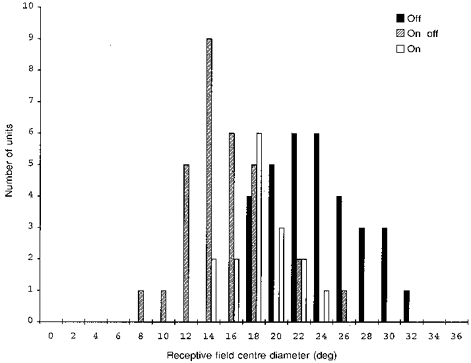
Histogram shows the distribution of centre diameters of off-, on-off-, and on-centre units at a background luminance of 5 cd m−2. Eye optically corrected by contact lens.
To see how measurements of receptive field properties might vary with conditions of visual stimulation, we studied seventeen retinal units while the tungsten light background was varied in luminance from 0.5 to 200 cd m−2. Because the luminance of the LEDs remained fixed, raising the background also reduced LED contrast. The basic on-, off- or on-off-response types of the receptive field centre remained stable, as did the surround response types, where they were observed. Figure 6 shows that the measured centre diameter of each type declined as background luminance was increased. Statistically, the off-centre diameters (n = 8) were larger than the other centre types for background luminances at 10 cd m−2 and below (P < 0.05, Tukey's test); on-centres (n = 5) were larger than on-off-centres (n = 5) at 5 cd m−2 and below (P < 0.05, Tukey's test).
Figure 6. Measured receptive field centre diameters as a function of background luminance.
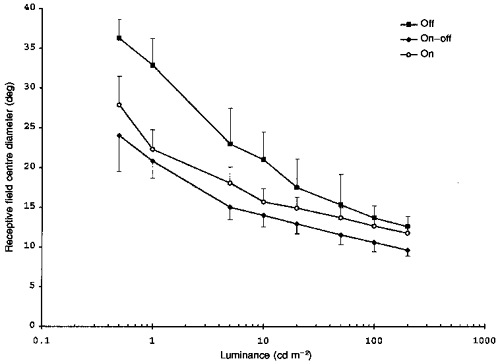
Off-, on-off- and on-centre diameters at different background luminances. Bars show 1 s.d. Contact lens on eye.
We also measured the maintained spike firing rate of the different receptive field centre types over background luminances ranging from 0.01 to 200 cd m−2. After changing the background, the eye was allowed to adapt for 5-15 min while the firing rate stabilized. Figure 7 shows the effect of adapting background luminance on the maintained discharge rate of the three centre types. The off-centre units (n = 12) differed from both on- (n = 7) and on-off-centre (n = 7) units in their higher maintained rate (P < 0.001, ANOVA). The maintained rate of all three centre types showed a weak inverse correlation with log luminance (off: r = -0.24; on: r = -0.29; on-off: r = -0.27; P < 0.05 in each case).
Figure 7. Maintained firing rate as a function of background luminance for off-, on-off- and on-centre units.
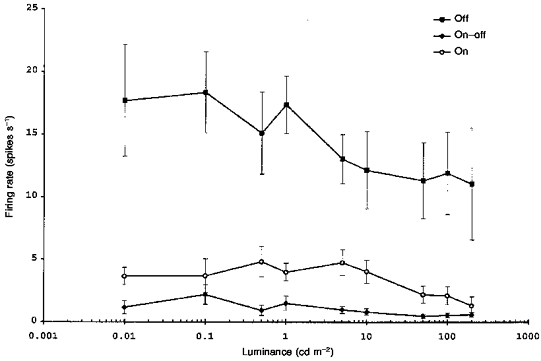
Bars show ± 1 s.e.m. Contact lens on eye.
DISCUSSION
We concentrated our attention upon those single units in the retina that were visually responsive, were activated antidromically from optic tract stimulation, and passed the collision test. The collision test confirmed that the retinally recorded spikes were destined to travel through the optic tract, thereby excluding the possibility that they originated in spiking amacrine cells, or in efferents from the brain to the retina.
The use of the LED array allowed us to map receptive fields in a standardized, objective fashion. Because the LEDs emitted long wavelength light (665 nm), the characterization of the ganglion cell receptive field centres was in terms of the long wavelength cone (L-cone) contribution to the on-, off- or on-off-responses. It is a valid basis for classification because virtually all receptive field centres of goldfish ganglion cells have L-cone input (Spekreijse, Wagner & Wolbarsht, 1972), together with rod input of the same sign (Raynauld, 1972).
Conduction velocity groups
Electrical stimulation of the optic tract evoked compound action potentials recorded from a retinal electrode that represent spike invasion of ganglion cell initial segments, somata and possibly dendrites, optic axons of passage, and terminals of efferents to the retina. Not surprisingly, the various waves of the compound action potentials are differentially emphasized in different recordings. Table 1 shows that the fastest, group I (11.6 m s−1), spikes were observed infrequently; nor did this group include any visually driven single units. The slower components, groups II (7.1 m s−1), III (4.4 m s−1) and IV (3.1 m s−1) appeared reliably, and included virtually all the visually responsive ganglion cells that were confirmed by collision testing. The slowest component, group V (2.3 m s−1), was recorded less frequently than groups II-IV, and included only one visually responsive, collision-confirmed ganglion cell.
In a study on goldfish, Schmidt (1979) recorded electrical responses in the optic tectum evoked by shock to the optic nerve, finding four groups of axons in the optic nerve that conducted at about 7, 5, 3, and 2 m s−1 at 10°C. Comparison with our velocity data is complicated because they were obtained at a higher temperature and are probably heavily weighted by the conduction times of the unmyelinated intraretinal segments of the optic axons. If Schmidt's velocities are scaled up by 53 % they match those of our four fastest groups.
Our fastest fibres, group I, correspond to the fibres that Schmidt (1979) concluded were centrifugal efferents to the retina. A number of other studies in fish have suggested that efferents constitute the largest and therefore fastest-conducting fibres in the optic nerve (Vanegas, Amat & Essayag-Millan, 1973; Guthrie & Banks, 1990). Our failure to find any photically driven units in group I is consistent with these being efferents. However, there is also evidence from different fish species for efferent fibres occurring in a wide range of calibres, including the finest, and therefore slowest-conducting, in the optic nerve (Witkovsky, 1971; Guthrie, 1990). The rarity of visually driven units in goldfish group V could be explained if fibres in this slowly conducting group were mainly efferents; alternatively, it might reflect electrode sampling bias against isolating spikes from fine-calibre fibres and small cells.
The ganglion cells that were functionally identified by their centre response nearly all fell into the conduction velocity groups II, III and IV (Fig. 4). If group I represents efferent fibres, then the finding that all the confirmed off-centre ganglion cells fall into group II fulfills the prediction that the off-signals are carried to the tectum by the largest, and therefore the fastest-conducting, retinotectal axons. It was surprising that the off-centre ganglion cells that we recorded belonged exclusively to group II. This is to be contrasted with the on- and on-off-centre types that are more broadly distributed across the conduction velocity classes.
Correlation with axonal calibre
Anatomical studies in fish of the patterns of tectal termination of optic axons suggest that ganglion cell axons occur in three conduction groups (Ito, Vanegas, Murakami & Morita, 1984). In goldfish, anterograde tracing showed fine-, medium- and coarse-calibre optic axons forming small, medium and large terminal arbors in the tectum (Stuermer, 1984; Schmidt et al. 1988). The implication of the present findings is that the majority of large axons and arbors have off-centres, with a small proportion having on-off- and on-centres. It may be significant that Schmidt et al. (1988) distinguished two kinds of large arbors; a highly branched arbor and a thinly branched arbor, the latter ramifying more superficially. Still more superficial are the small arbors, which we would expect to be predominantly on-centred. The medium arbors, which tend to ramify most deeply, would be expected to be both on-off- and on-centred. However, the limited evidence on the depth-distribution of response types recorded in the goldfish tectum is not in agreement with these expectations (Jacobson & Gaze, 1964), although the sources of such extracellular recordings in the tectum are often unclear (Guthrie, 1990).
The results of electrical stimulation experiments in various fish species suggest four to five separate groups of fibres in the optic nerve (Guthrie, 1990). Anatomical studies of the goldfish optic nerve show that nearly all the fibres are myelinated, their diameters being distributed in a unimodal size spectrum with a tail made up of a small proportion of large fibres (Murray, 1982). The few non-myelinated fibres originate in newly born ganglion cells at the retinal margin (Easter, Rusoff & Kish, 1981).
Correlation with retinal cell types
The most complete anatomical study of goldfish ganglion cells by Hitchcock & Easter (1986) distinguished four main types based on the sizes of soma and dendritic field, and the form of their dendritic trees. Axon calibre, although not measured in that particular study, appears to be correlated with soma size (Ito et al. 1984). A plausible assignment of Hitchcock & Easter's (1986) ganglion cell types to conduction velocity groups is that the axons of their largest, Type 1, would fall into group II; the intermediately sized Types 3 and 4 would fall into group III; the smallest, Type 2, would fall into group IV. Schmidt et al. (1988) suggested the same assignment of cell types to the coarse, medium and fine retinotectal axons that they saw in the tectum.
No straightforward correlation seems possible between our on-centre/off-centre classification and the morphological types of ganglion cells. Because all four morphological types of Hitchcock & Easter have subtypes that ramify in different sublaminae of the inner plexiform layer (IPL), and because of the association between IPL sublamina and response type (Famiglietti et al. 1977), one would expect each main type to include cells with on-, off- or on-off-centres. However, our finding that off-centres fell exclusively into group II suggests that ganglion cells with this response property are homogeneous with respect to axon calibre, and perhaps other morphological characteristics too. The ganglion cells with the other centre properties are likely to be heterogeneous and we shall not attempt to identify them anatomically.
We believe that our off-centre cells can be identified with the largest ganglion cells, the Type 1.2 of Hitchcock & Easter (1986). These are of the same morphological type that Cook et al. (1992) called outer α-like cells because they form a regular mosaic over the retina resembling mammalian α-cells (Wässle & Boycott, 1991), and because their dendrites stratify in the outer sublamina of the IPL. For the latter reason, these cells should have off-centre responses (Famiglietti et al. 1977). From a small sample of goldfish ganglion cells that Vallerga & Djamgoz (1991) recorded intracellularly, a subset responded with prominent depolarizations to the offset of long wavelength light. Subsequent staining of these cells revealed displaced somata with extensive dendrites monostratified in the outer IPL, all characteristics of Type 1.2, or outer α-like ganglion cells.
Receptive field sizes
There is also a correlation between size of soma and size of dendritic field (Kock, 1982), leading to the expectation that high conduction velocity would be associated with large receptive field centre size. The identification of the off-centre cells with the Type 1.2 is supported by their relatively large receptive field size. Whereas previous receptive field measurements in goldfish retinal ganglion cells hinted at off-centres being the largest (Macy & Easter, 1981; Schmidt & Edwards, 1983), our manipulation of background luminance helped to establish that, on average, off-centres are the largest, followed by on-, then on-off-centres (Fig. 6). Bilotta & Abramov (1989) found that red off-centre ganglion cells were most sensitive to low spatial frequencies compared with other centre response types, providing further evidence of the larger centres of these types.
It is possible to estimate the receptive field centre size from the dendritic field size, which, in the case of Type 1.2, Cook et al. (1992) calculate as subtending 16.3 deg. The functional receptive field centre should be widened by the receptive fields of cells feeding the ganglion cells. Multiplying the dendritic subtense by 1.5, the factor used by Wässle & Boycott (1991) for this purpose, predicts 24 deg for the receptive field diameter, which is the mean for our off-centre diameters (Fig. 5).
Because we used a coarse array of LED stimuli, spaced 5 deg apart, with some out-of-focus blur, receptive field diameters will be overestimated: in the case of the smallest fields by about 3 deg. Thus the receptive field centre diameters encountered in our study ranged from 5 to about 30 deg. A very similar range of receptive field centre diameters was required to explain the changes in the limit of spatial summation (Ricco area) determined psychophysically in goldfish under different conditions of light adaptation (Northmore, 1977). Ricco diameters matched the smallest receptive field centres (ca 5 deg) when light adapted, and the largest receptive field centres (ca 30 deg) when fully dark adapted. That the latter are off-centres (Fig. 5) explains why dark-adapted goldfish respond behaviourally to large, dim light patches at offset rather than onset (D. P. M. Northmore, unpublished observations). Because they catch more quanta from an extended source, these large off-centre ganglion cells have the lowest absolute radiance thresholds compared with other types, and account for the remarkably low absolute threshold of the goldfish (Northmore, 1977; Falzett, Nussdorf & Powers, 1988).
Maintained discharge
Off-centre ganglion cells were also clearly distinguished from the other types by their higher rate of maintained firing, a distinction that held over light adaptation conditions ranging from the scotopic to the photopic (Fig. 7). These cells have also been shown to fire at higher maintained rates than other types when fully dark adapted (Falzett et al. 1988). Although all centre types tended to reduce their maintained rate with increases in adapting luminance, the trend was most pronounced for off-centre cells, suggesting that they may carry information about ambient illumination.
Conclusions
The finding that of all ganglion cells, the off-centres have the highest axonal conduction velocity, leads to the conclusion that they are a class of α-like ganglion cells (Type 1.2). In the light of other findings in goldfish, these cells appear to form part of a low resolution system that signals dimming and the presence of negative contrast stimuli, and probably conveys luminance, rather than colour information (Wheeler, 1982; DeMarco & Powers, 1991). Their message is distributed in the tectum by coarse axons with large arbors (Schmidt et al. 1988), providing input to a post-tectal stage of visual processing in the torus longitudinalis. One function of the torus appears to be luminosity processing (Gibbs & Northmore, 1996) with spectrally broad-band characteristics (M. A. Gibbs & D. P. M. Northmore, in preparation).
Acknowledgments
Financial support was provided by grants from the National Eye Institute of the NIH, and the University of Delaware Research Foundation.
References
- Bilotta J, Abramov I. Orientation and direction tuning of goldfish ganglion cells. Visual Neuroscience. 1989;2:3–13. doi: 10.1017/s0952523800004260. [DOI] [PubMed] [Google Scholar]
- Charman WN, Tucker J. The optical system of the goldfish eye. Vision Research. 1973;13:1–8. doi: 10.1016/0042-6989(73)90160-0. [DOI] [PubMed] [Google Scholar]
- Cook JE, Becker DL, Kapila R. Independent mosaics of large inner- and outer-stratified ganglion cells in the goldfish retina. Journal of Comparative Neurology. 1992;318:355–366. doi: 10.1002/cne.903180402. [DOI] [PubMed] [Google Scholar]
- DeMarco PJ, Jr, Powers MK. Spectral sensitivity of ON and OFF responses from the optic nerve of goldfish. Visual Neuroscience. 1991;6:207–217. doi: 10.1017/s0952523800006222. [DOI] [PubMed] [Google Scholar]
- Easter SS, Jr, Rusoff AC, Kish PE. The growth and organization of the optic nerve and tract in juvenile and adult goldfish. Journal of Neuroscience. 1981;1:793–811. doi: 10.1523/JNEUROSCI.01-08-00793.1981. [DOI] [PMC free article] [PubMed] [Google Scholar]
- Falzett M, Nussdorf JD, Powers MK. Responsivity and absolute sensitivity of retinal ganglion cells in goldfish of different sizes, when measured under ‘psychophysical’ conditions. Vision Research. 1988;28:223–237. doi: 10.1016/0042-6989(88)90149-6. 10.1016/0042-6989(88)90149-6. [DOI] [PubMed] [Google Scholar]
- Famiglietti EV, Kaneko A, Tachibana M. Neuronal architecture of On and Off pathways to ganglion cells in carp retina. Science. 1977;198:1267–1269. doi: 10.1126/science.73223. [DOI] [PubMed] [Google Scholar]
- Gibbs MA, Northmore DPM. The role of torus longitudinalis in equilibrium orientation measured with the dorsal light reflex. Brain, Behavior and Evolution. 1996;48:115–120. doi: 10.1159/000113190. [DOI] [PubMed] [Google Scholar]
- Guthrie DM. The physiology of the teleostean optic tectum. In: Douglas RH, Djamgoz MBA, editors. The Visual System of Fish. London: Chapman and Hall; 1990. pp. 279–343. [Google Scholar]
- Guthrie DM, Banks JR. A correlative study of the physiology and morphology of the retinotectal pathway of the perch. Visual Neuroscience. 1990;4:367–377. doi: 10.1017/s0952523800004570. [DOI] [PubMed] [Google Scholar]
- Hartline HK. The response of single optic nerve fibres of the vertebrate eye to illumination of the retina. American Journal of Physiology. 1938;121:400–415. [Google Scholar]
- Hitchcock PF, Easter SS., Jr Retinal ganglion cells in goldfish: a qualitative classification into four morphological types, and a quantitative study of the development of one of them. Journal of Neuroscience. 1986;6:1037–1050. doi: 10.1523/JNEUROSCI.06-04-01037.1986. [DOI] [PMC free article] [PubMed] [Google Scholar]
- Ito H, Vanegas H, Murakami T, Morita Y. Diameters and terminal patterns of retinofugal axons in their target areas: an HRP study in two teleosts (Sebastiscus and Navodon) Journal of Comparative Neurology. 1984;230:179–197. doi: 10.1002/cne.902300204. [DOI] [PubMed] [Google Scholar]
- Jacobson M, Gaze RM. Types of visual response from single units in the optic tectum and the optic nerve in the goldfish. Quarterly Journal of Experimental Physiology. 1964;49:199–209. doi: 10.1113/expphysiol.1964.sp001720. [DOI] [PubMed] [Google Scholar]
- Kaplan E, Lee BB, Shapley RM. New views of primate retinal function. In: Osborne N, Chader G, editors. Progress in Retinal Research. New York: Pergamon Press; 1990. pp. 273–336. [Google Scholar]
- Kock J-H. Dendritic tree structure and dendritic hypertrophy during growth of the crucian carp eye. Journal of Comparative Neurology. 1982;209:275–286. doi: 10.1002/cne.902090306. [DOI] [PubMed] [Google Scholar]
- Levine MW, Shefner JM. X-like and not X-like cells in goldfish retina. Vision Research. 1979;19:95–97. doi: 10.1016/0042-6989(79)90127-5. 10.1016/0042-6989(79)90127-5. [DOI] [PubMed] [Google Scholar]
- Macy A, Easter SS., Jr Growth-related changes in the size of receptive field centers of retinal ganglion cells in goldfish. Vision Research. 1981;21:1497–1504. doi: 10.1016/0042-6989(81)90221-2. 10.1016/0042-6989(81)90221-2. [DOI] [PubMed] [Google Scholar]
- Murray M. A quantitative study of regenerative sprouting by optic axons in goldfish. Journal of Comparative Neurology. 1982;209:352–362. doi: 10.1002/cne.902090405. [DOI] [PubMed] [Google Scholar]
- Northcutt RG. Evolution of the optic tectum in ray-finned fishes. In: Davis RE, Northcutt RG, editors. Fish Neurobiology. Vol. 2. Ann Arbor: University of Michigan Press; 1983. pp. 1–42. [Google Scholar]
- Northmore DPM. Spatial summation and light adaptation in the goldfish visual system. Nature. 1977;268:450–451. doi: 10.1038/268450a0. [DOI] [PubMed] [Google Scholar]
- Northmore DPM. Visual and saccadic activity in the goldfish torus longitudinalis. Journal of Comparative Physiology. 1984;A 155:333–340. [Google Scholar]
- Northmore DPM. Neural activity in the regenerating optic nerve of the goldfish. Journal of Physiology. 1987;391:299–312. doi: 10.1113/jphysiol.1987.sp016739. [DOI] [PMC free article] [PubMed] [Google Scholar]
- Northmore DPM. Quantitative electrophysiological studies of regenerating visuotopic maps in goldfish. I. Early recovery of dimming sensitivity in tectum and torus longitudinalis. Neuroscience. 1989;32:739–747. doi: 10.1016/0306-4522(89)90294-7. 10.1016/0306-4522(89)90294-7. [DOI] [PubMed] [Google Scholar]
- Northmore DPM, Celenza MA. Recovery of contrast sensitivity during optic nerve regeneration in fish. Experimental Neurology. 1992;115:69–72. doi: 10.1016/0014-4886(92)90224-e. 10.1016/0014-4886(92)90224-E. [DOI] [PubMed] [Google Scholar]
- Raynauld J-P. Goldfish retina: sign of the rod input in opponent color ganglion cells. Science. 1972;177:84–85. doi: 10.1126/science.177.4043.84. [DOI] [PubMed] [Google Scholar]
- Schmidt JT. The laminar organization of optic nerve fibres in the tectum of goldfish. Proceedings of the Royal Society B. 1979;205:287–306. doi: 10.1098/rspb.1979.0066. [DOI] [PubMed] [Google Scholar]
- Schmidt JT, Edwards DL. Activity sharpens the map during the regeneration of the retinotectal projection in goldfish. Brain Research. 1983;269:29–39. doi: 10.1016/0006-8993(83)90959-9. 10.1016/0006-8993(83)90959-9. [DOI] [PubMed] [Google Scholar]
- Schmidt JT, Turcotte JC, Buzzard M, Tieman DG. Staining of regenerated optic arbors in goldfish tectum: progressive changes in immature arbors and a comparison of mature regenerated arbors with normal arbors. Journal of Comparative Neurology. 1988;269:565–591. doi: 10.1002/cne.902690408. [DOI] [PubMed] [Google Scholar]
- Sharma SC. Neural specificity revisited. In: Sharma SC, Fawcett JW, editors. Formation and Regeneration of Nerve Connections. Boston: Birkhauser; 1993. pp. 248–257. [Google Scholar]
- Spekreijse H, Wagner HG, Wolbarsht ML. Spectral and spatial coding of ganglion cell responses in goldfish retina. Journal of Neurophysiology. 1972;35:73–86. doi: 10.1152/jn.1972.35.1.73. [DOI] [PubMed] [Google Scholar]
- Stuermer CAO. Rules for retinotectal terminal arborizations in the goldfish optic tectum: a whole mount study. Journal of Comparative Neurology. 1984;229:214–232. doi: 10.1002/cne.902290207. [DOI] [PubMed] [Google Scholar]
- Vallerga S, Djamgoz MBA. Ganglion cells in the goldfish retina: correlation of light-evoked response and morphology. Vision Research. 1991;31:487–497. doi: 10.1016/0042-6989(91)90100-j. 10.1016/0042-6989(91)90100-J. [DOI] [PubMed] [Google Scholar]
- Vanegas H, Amat J, Essayag-Millan E. Electrophysiological evidence of tectal efferents to fish eye. Brain Research. 1973;54:309–313. doi: 10.1016/0006-8993(73)90052-8. 10.1016/0006-8993(73)90052-8. [DOI] [PubMed] [Google Scholar]
- Essen DC, Gallant JL. Neural mechanisms of form and motion processing in the primate visual system. Neuron. 1994;13:1–10. doi: 10.1016/0896-6273(94)90455-3. 10.1016/0896-6273(94)90455-3. [DOI] [PubMed] [Google Scholar]
- Wässle H, Boycott BB. Functional architecture of the mammalian retina. Physiological Reviews. 1991;71:447–480. doi: 10.1152/physrev.1991.71.2.447. [DOI] [PubMed] [Google Scholar]
- Wheeler TG. Color vision and retinal chromatic information processing in teleost: a review. Brain Research Reviews. 1982;4:177–235. doi: 10.1016/0165-0173(82)90017-0. 10.1016/0165-0173(82)90017-0. [DOI] [PubMed] [Google Scholar]
- Witkovsky P. Synapses made by myelinated fibres running to teleost and elasmobranch retinas. Journal of Comparative Neurology. 1971;142:205–222. doi: 10.1002/cne.901420206. [DOI] [PubMed] [Google Scholar]


