

Abstract
Recordings of mechanoelectrical transducer currents were combined with calcium imaging of hair bundles in turtle auditory hair cells located near the high-frequency end of the cochlea. The external face of the hair bundles was perfused with a range of Ca2+ concentrations to study the quantitative relationship between Ca2+ influx and transducer adaptation.
With Na+ as the monovalent ion, the peak amplitude of the transducer current decreased monotonically as the external [Ca2+] was raised from 25 μm to 20 mm. When Na+ was replaced with the impermeant Tris the transducer current increased with external [Ca2+]. These results indicate that Ca2+ can both permeate and block the transducer channels. The Ca2+ concentration for half-block of the monovalent current was 1 mm.
To quantify the Ca2+ influx, the fraction of transducer current carried by Ca2+ was measured using the change in bundle fluorescence in cells loaded with 1 mm Calcium Green-1. The fluorescence change was calibrated by substituting an impermeable monovalent ion to render Ca2+ the sole charge carrier.
In the presence of Na+, the fractional Ca2+ current was ∼10 % in 50 μm Ca2+, a concentration similar to that in endolymph, which bathes the hair bundles in vivo. The amount of Ca2+ entering was dependent on the identity of the monovalent ion, and was larger with K+, suggesting that the transducer channel is a multi-ion pore.
Over a range of ionic conditions, the rate of transducer adaptation was proportional to Ca2+ influx indicating that adaptation is driven by a rise in intracellular [Ca2+].
Shifts in the current-displacement function along the displacement axis in different external Ca2+ concentrations were predictable from variation in the resting Ca2+ influx. We suggest that changes in the resting open probability of the transducer channels adjust the entry of Ca2+ to keep its concentration constant at an internal site.
The results demonstrate that endolymph containing high K+, 50 μm Ca2+ and low Mg2+ concentrations, maximizes the transducer current while still allowing sufficient Ca2+ entry to drive adaptation. The hair cell mechanotransducer channel, in its permeation and block by Ca2+, shows behaviour similar to the voltage-gated Ca2+ channel and the cyclic nucleotide-gated channel.
Hair cells of the inner ear transduce mechanical deflections of their stereociliary bundles through the activation of non-selective cation channels permeable to both monovalent Na+ and K+ ions and to divalent Ca2+ (Corey & Hudspeth, 1979; Ohmori, 1985). A prominent feature of transduction is an adaptation which resets the operating range of the hair cell (Eatock, Corey & Hudspeth, 1987). Thus during a maintained bundle displacement, the transducer channels rapidly open then close again over a time course, depending on the conditions, of between 1 and 40 ms (Eatock et al. 1987; Crawford, Evans & Fettiplace, 1989; Ricci & Fettiplace, 1997). The trigger for adaptation is believed to be a rise in intracellular Ca2+ following influx through the open transducer channels (Assad, Hacohen & Corey, 1989; Crawford et al. 1989; Crawford, Evans & Fettiplace, 1991; Kimitsuki & Ohmori, 1992). Although there is abundant evidence that adaptation can be modulated by varying the external Ca2+ concentration, no quantitative data exists on the relationship between adaptation and Ca2+ influx.
Hair cells form a tight epithelium separating fluids of quite different composition. Their basolateral surface is enveloped in perilymph with a composition similar to extracellular fluids elsewhere in the body. However, the hair bundles, where the transducer channels are located (Jaramillo & Hudspeth, 1991; Denk, Holt, Shepherd & Corey, 1995), face an endolymph which more closely resembles an intracellular fluid in containing K+ as the major monovalent cation and a low [Ca2+]. In the cochlea, the free Ca2+ has been measured as ∼30 μm in mammals (Bosher & Warren, 1978; Ikeda, Kusakari, Takasaka & Saito, 1987; Salt, Inamura, Thalmann & Vorba, 1989) and 65 μm in turtles (Crawford et al. 1991). The significance of the endolymph composition is unclear, and the low Ca2+ is especially puzzling if Ca2+ entry is a crucial step in controlling transducer adaptation. To fully understand the role of Ca2+ and to predict how adaptation depends on the conditions, it is necessary to quantify the Ca2+ entry through the transducer channels.
To address this problem, we have used the approach of Schneggenburger, Zhou, Konnerth & Neher (1993) to measure the fraction of transducer current carried by Ca2+ in a range of external Ca2+ concentrations that modify adaptation. The technique involves loading the cells with a high concentration of Ca2+ indicator to capture most of the Ca2+ entering during a maximal stimulus. We have combined fluorescence measurements with whole-cell recording in an intact hair cell epithelium where large mechano-electrical transducer currents (greater than 1 nA) can be routinely obtained, and where the endolymphatic and perilymphatic compartments can be separately perfused (Ricci & Fettiplace, 1997). Our results indicate that Ca2+ contributes a significant fraction of the current, about 15 %, even in 50 μm external Ca2+. Interestingly, the fraction is augmented by substituting K+ for Na+ as the external monovalent ion, thus mimicking the composition of endolymph. Knowledge of the fraction of transducer current carried by Ca2+ has allowed us to define the relationship between Ca2+ entry and the parameters of transducer adaptation.
METHODS
Preparation
The preparation and method of hair cell stimulation in the intact basilar papilla were similar to those previously detailed (Crawford & Fettiplace, 1985; Ricci & Fettiplace, 1997). Turtles (Trachemys scripta elegans, carapace length, 100-125 mm) were decapitated and the cochlear duct and lagena dissected out. This procedure was approved by the Animal Care Committee at the University of Wisconsin. The cochlea was opened and the tectorial membrane was lifted off following ∼20 min digestion in saline (composition (mm): NaCl, 125; KCl, 4; CaCl2, 2.8; MgCl2, 2.2; glucose 8; NaHepes, 10, pH 7.6) containing up to 0.1 mg ml−1 of protease (Sigma type XXIV). The preparation was transferred to a Sylgard® well in the recording chamber and secured, hair bundles uppermost, with strands of dental floss tensioned on insect pins; the tension could be adjusted so that most of the papilla surface overlying the basilar membrane lay in one focal plane. The chamber was mounted on the stage of a Zeiss Axioskop FS microscope and viewed using Nomarski optics through a × 63 water-immersion objective (NA, 0.9), a × 1.6 optovar and a Hamamatsu C2400 CCD camera.
Hair bundles were stimulated with a rigid glass pipette (tip fire-polished to a diameter of about 1 μm) cemented to a piezo-electric bimorph (Crawford et al. 1989). The end of the glass probe was bent at an angle of ∼70 deg to the shank of the pipette and placed into the rake of the hair bundle to deflect the bundle towards or away from the kinocilium. The bimorph was driven differentially with voltage steps, filtered with an 8-pole Bessel at 3 kHz and amplified through a high-voltage driver of 20-fold gain to yield a fast stimulator with a 10-90 % rise time of about 100 μs. The glass probe was acid cleaned at the start of each experiment so that it would adhere to the hair bundle membrane. This ensured that the bundle faithfully followed both positive and negative movements of the probe. Experiments were performed at 22-24°C.
Electrode recording and solutions
Whole-cell currents were measured with a List EPC-7 amplifier attached to a borosilicate patch electrode. Before recording, a pipette was used to puncture the abneural side of the papilla at the level of the cell bodies. The penetration made only a small hole in the side of the papilla and left the apical surface of the hair cells unperturbed. The subsequent electrodes were advanced into the track made by the initial penetration, rupturing connections between intervening supporting cells to make contact with the basolateral aspect of a hair cell. In view of the variation in peak transducer current and sensitivity to external [Ca2+] with hair cell location (Ricci & Fettiplace, 1997), all recordings were made from cells in roughly the same region, between 0.6 and 0.8 of the distance along the cochlea from the lagena. At this location, near the high-frequency end of the cochlea, transducer adaptation, although slowed, was still prominent in 25 μm Ca2+ (Fig. 1). In order to block the large Ca2+-activated K+ currents, electrodes were filled with an intracellular solution based either on TrisCl (solution A) or CsCl (solution B). The fluorescence measurements were performed solely with solution B. The solution compositions were as follows (mm). Solution A: TrisCl, 120; Na2ATP, 3; MgCl2, 2; Cs4BAPTA, 1; Hepes, 10, pH 7.2. Solution B: CsCl, 125; Na2ATP, 3; MgCl2, 2; ascorbic acid, 2; CsHepes, 10, pH 7.2 and 1 mm of the K+ salt of the fluorescent indicator Calcium Green-1 dextran conjugate (3000 Da; Molecular Probes). Ascorbic acid was included as an antioxidant to reduce cell deterioration caused by dye fluorescence. BAPTA (1 mm) was used since it is equivalent to the cytoplasmic concentration of diffusible Ca2+ buffer occurring in vivo (Tucker & Fettiplace, 1996). After application of up to 50 % series resistance compensation, the electrode access resistance was 3-10 MΩ, which gave a recording time constant of 45-150 μs. In most experiments, transducer currents were measured at a holding potential which when corrected for the junction potential introduced by the internal solution was -90 mV. Currents were recorded on a Sony PCM instrumentation recorder at a bandwidth of 0-20 kHz. Unless otherwise indicated, values of transducer current parameters are given as means ± 1 s.d. Statistical significance was evaluated using the Student's two-tailed paired t test.
Figure 1. Effects of endolymphatic [Ca2+] on hair cell mechanotransducer currents.

A, averaged transducer currents to bundle deflections in control solution (Na+, 2.8 mm Ca2+; top), reduced [Ca2+] (Na+, 0.025 mm Ca2+; middle) and substitution of Tris for Na+ as the monovalent ion (Tris, 0.025 mm Ca2+, bottom). Stimulus amplitude and timing are shown above the current traces. Note current axis is magnified 10-fold for responses in Tris. B, averaged transducer currents in a different cell in control solution (Na+, 2.8 mm Ca2+; top), elevated [Ca2+] (Na+, 20 mm Ca2+; middle) and substitution of Tris for Na+ as the monovalent (Tris, 20 mm Ca2+; bottom). Holding potentials, -90 mV. Zero current on ordinates corresponds to transducer channel being completely turned off. Each trace is the average of between 5 and 25 responses.
The preparation was perfused with an oxygenated saline of composition (mm): NaCl, 128; KCl, 0.5; CaCl2, 2.8; MgCl2, 2.2; sodium pyruvate, 2; glucose 8; NaHepes, 10, pH 7.6. The upper surface of the hair cell epithelium facing the endolymphatic compartment was separately and continuously perfused by a large pipette, 100 μm internal diameter, introduced into the cochlear duct. The perfusion pipette was connected to a six-inlet manifold (Warner Instruments, Hamden, USA) fed from a Gilson peristaltic pump, a given inlet being selected by means of a remotely controlled miniature solenoid valve (Lee Products, Westbrook, USA). The perfusion rate was kept low to prevent inadvertent stimulation of the bundles and to localize the fluid stream around the cell being studied. The exchange time for the endolymph solution was ∼1 min and in practice 3-5 min were allowed after a solution change before making a new measurement. The artificial endolymph solutions had ionic compositions of (mm): XCl, 130; KCl, 0.5; glucose 8; Hepes, 10, pH 7.6 with the addition of various free Ca2+ concentrations. Depending on the experiment, the major monovalent cation, X, was Na+, K+, Tris+ or N-methyl-D-glucamine. The appropriate hydroxide, XOH, was used to neutralize the solution except with Tris, where tetramethylammonium hydroxide was used. The Ca2+ concentrations used in the artificial endolymph solution were (mm): 0.025, 0.08, 0.35, 1, 2.8, 5 and 20. In the two highest concentrations, the amount of monovalent ion was reduced (to 110 and 100 mm, respectively) to maintain a constant osmolarity. The [Ca2+] in all solutions was measured with a Ca2+ electrode (MI 100, Microelectrodes Inc, Londonderry, NH, USA). Evidence has been previously presented (Ricci & Fettiplace, 1997) to demonstrate that the artificial endolymph introduced into the cochlear duct did not in any significant amount gain access to the basolateral aspect of the hair cells and its effects were largely confined to the apical surface. Reasons for this separation include the dish shape of the cochlear duct, which acts as a partial barrier for spread of solution, and the small size of the hole made in the side of the papilla by the recording electrode. With the perfusion arrangement it was thus possible in most experiments to mimic the in vivo separation of endolymph and perilymph.
Fluorescence measurements
Ca2+ changes in the hair bundle were monitored with Calcium Green-1, the dextran conjugate (3000 Da) being used to circumvent artifacts caused by dye binding to cytoplasmic structures, which can alter the Ca2+ response (Blatter & Weir, 1990; Gray-Keller & Detwiler, 1994). Epifluorescence illumination was generated with a 100 W mercury lamp powered by a variable current supply (Attoarc, Carl Zeiss, Thornwood, NY, USA). The exciting light passed through a remotely controlled Uniblitz shutter, a KG1 heat filter, a 430 nm long-pass filter to exclude ultraviolet, a 450-490 nm excitation filter, a 510 nm dichroic beam splitter and the × 63 water-immersion objective. The fluorescence emission was long-pass filtered at 520 nm and imaged with an intensified CCD camera (Hamamatsu C2400). During the fluorescence measurements, the Nomarski analyser was removed from the light path. Images were stored on videocassette using a Sony S-VHS tape recorder (SVO 9500MD), and subsequent analysis was performed with the Image-1 software package (Universal Imaging, West Chester, PA, USA). To follow the time course of a fluorescence change, the average intensity was measured in each image over an approximately 5 μm-square region overlying the hair bundle. Since Calcium Green-1 is a single wavelength dye, changes in fluorescence, ΔF, were expressed relative to the background fluorescence, F.
To ensure reproducibility of the measurements, a fixed sequence of events was followed in the experimental protocol. After attaining a whole-cell recording, between 5 and 10 min were allowed for the electrode solution to equilibrate with the intracellular milieu and for the dye fluorescence to stabilize in the hair bundle. During this period, the cell was viewed by transmitted illumination through a 700 nm long-pass filter to avoid bleaching the dye. Patch electrodes used for fluorescence measurements all had uncompensated resistances of less than 10 MΩ to ensure rapid diffusion of dye into the cell. The stimulating probe was advanced onto the hair bundle while delivering small displacement steps until a response was detected with no deflection in the baseline current. Correct positioning of the probe was often difficult to achieve and it was easy to ‘over-push’ the bundle so that it was displaced positive from its resting position. In some experiments, the bundle fluorescence was monitored simultaneously, since it was found to be the most sensitive indicator of the probe's contact with the bundle: over-pushing the bundle resulted in a rise in the background fluorescence. The microscope was focused on the tip of the bundle which in fluorescence could be judged by the location of the stimulating probe (Fig. 3) and the shutter was then closed. To execute an experiment, the shutter was opened just prior to the stimulus, the bundle was displaced by a maximal step of normal duration 225 ms, and the fluorescence change was followed for about 5 s before closing the shutter. In the low-Ca2+ solutions, the step was often lengthened to improve the accuracy of the fluorescence measurement. Fluorescence changes and transducer currents were acquired in a series of endolymph solutions, several minutes elapsing between successive stimuli.
Figure 3. Experimental preparation and fluorescence responses.

A, top, papilla surface showing hair bundles in Nomarski optics. The patch pipette, deep to the plane of focus, was introduced through a small hole in the side of the papilla so that the apical surface remained intact. Stimulating probe (arrow) is situated on the hair bundle. Bottom, focus at the top of the bundle in fluorescent illumination, showing Ca2+ signal from hair bundle. Arrow indicates the stimulating probe. Scale bar, 10 μm. B, simultaneous recordings of transducer current (bottom) and hair bundle Ca2+ fluorescence (middle) for a 225 ms bundle deflection (top). Though the transducer current shows some adaptation, its initial amplitude is near maximal. Endolymph, Na+, 2.8 mm Ca2+. Holding potential, -90 mV.
The increase in fluorescence, ΔF/F, during bundle stimulation provides a measure of the amount of Ca2+ that has entered through the transducer channel. ΔF/F is assumed to be proportional to Ca2+ entry and can therefore be expressed in the following form:
| (1) |
where K is a constant and ICa, the current carried by Ca2+, is integrated over the stimulus duration. The fluorescence change observed with a mixed transducer current carried by Ca2+ and Na+ was calibrated to determine K by replacing Na+ with an impermeable monovalent ion so that Ca2+ became the sole charge carrier. This calibration method has been used to estimate the fractional Ca2+ current in neuronal nicotinic acetylcholine receptors (Vernino, Rogers, Radcliffe & Dani, 1994). The fraction, f, of the total transducer current IT, carried by Ca2+ is defined as:
| (2) |
where INa and ICa are the currents due to Na+ and Ca2+, respectively. The peak change in fluorescence, ΔF, associated with a given transducer current IT was first measured in endolymph containing Na+ and 2.8 mm Ca2+. Tris, which will be shown to be effectively an impermeant ion, was then substituted for Na+ producing a transducer current, ITris, and a fluorescence change ΔFTris. Values in the standard Na+ solution before and after the Tris substitution were usually averaged. The fractional Ca2+ current, f, was then calculated from:
| (3) |
where ΔΦ=ΔF/F, ΔΦTris= (ΔF/F)Tris and the time integrals of the current, ƒIdt, were determined for the duration of the stimulus. To check that the dye was not saturated, several stimulus durations were initially employed to verify that the fluorescence change grew linearly with stimulus duration. In such cases, ΔF/F was proportional to the current integral (Fig. 4). A second estimate of the fractional Ca2+ current, denoted as fc, was obtained from the ratio of the peak currents in Tris and in Na+:
| (4) |
The two estimates f (based on the fluorescence ratio) and fc (based on the current ratio) will differ if Tris is slightly permeable or if the Ca2+ flux through the channel is influenced by the nature of the monovalent ion.
Figure 4. Linearity of fluorescence change with stimulus duration.

The peak change in fluorescence, ΔF/F, is plotted against the time integral of the transducer current covering a range of stimulus durations from 50 to 550 ms. Each symbol denotes a different cell. All measurements were made in artificial endolymph containing Na+, 2.8 mm Ca2+. The line is a fit to all the points; r = 0.97.
RESULTS
Ca2+ permeates and blocks mechanotransducer channels
Before presenting the results of the fluorescence measurements, it is necessary to document the opposite effects of external [Ca2+] on the transducer current amplitude in the presence of a permeable monovalent cation (Na+ or K+) or an impermeable one (Tris). With Na+, the current was largest in 25 μm Ca2+ and decreased monotonically as the [Ca2+] was raised to 20 mm (Figs 1 and 2). The divalent ion therefore behaved as though it were blocking the transducer channels. To compare different cells, measurements were referred to the value in a standard artificial endolymph containing 140 mm Na+, 0.5 mm K+ and 2.8 mm Ca2+. In this solution, the current amplitude ranged between 400 and 1200 pA across cells (670 ± 187 pA; mean ±s.d., n = 117). Reducing the [Ca2+] to 25 μm increased the current 1.6-fold with respect to its value in the standard 2.8 mm.
Figure 2. Ca2+ permeates and blocks the transducer channel.

Collected measurements of maximum transducer current amplitudes versus external [Ca2+] with Na+ as the monovalent ion (•) and Tris as the monovalent ion (×). Left-hand ordinate gives current relative to control solution (Na+, 2.8 mm Ca2+); right-hand ordinate scaled by mean current in control (670 pA). Each point is the mean ± 1 s.d. For both Na+ and Tris, the number of measurements averaged at each [Ca2+] were: 7, 0.025 mm; 12, 0.08 mm; 7, 0.35 mm; 11, 1 mm; 9, 5 mm; 9, 20 mm.
When Tris was substituted for Na+ as the monovalent ion, the transducer current was substantially reduced in amplitude, indicating that Tris is much less permeable than Na+. Moreover the transducer current now increased monotonically as the [Ca2+] was elevated (Fig. 2), implying that Ca2+ could also carry a significant proportion of the current. The extent to which Tris is impermeable can be judged from the responses in 25 μm Ca2+, where the current in Tris is about 40 times less than in Na+. Some fraction of the current in Tris endolymph must still be carried by Ca2+ since vestiges of adaptation remain in the records (Fig. 1). Therefore the Na+ : Tris current ratio must be greater than 40 : 1. Comparison of the Ca2+ effects in Na+ and in Tris make it clear that the divalent ion can behave as both a blocking agent and a permeable ion. To tease out the relative contributions of the two effects requires knowledge of the fractional Ca2+ current, which will be determined from the fluorescence experiments described below.
Replacing Na+ with K+ in the artificial endolymph augmented the transducer current by about 20 %. The fractional increases in 80 μm and in 2.8 mm Ca2+ were 1.22 ± 0.12 (n = 6) and 1.21 ± 0.08 (n = 6), respectively, relative to the equivalent currents in Na+ endolymph containing these same two Ca2+ concentrations. Some but not all of the difference in current magnitude between K+ and Na+ reflects an increase in the contribution of Ca2+ to the total current, as will be discussed in the next section.
The fractional Ca2+ current
The aim of this section is to derive the fraction of the total transducer current carried by Ca2+ (the fractional Ca2+ current, f) in a range of external Ca2+ concentrations using a fluorimetric technique (Zhou & Neher, 1993; Schneggenburger et al. 1993). A measure of the Ca2+ influx into the hair bundle was obtained from the increase in fluorescence of the indicator dye, Calcium Green-1 dextran. The Ca2+ indicator was present at a concentration of 1 mm and replaced BAPTA as the diffusible buffer in the intracellular solution filling the whole-cell electrode. Sufficient time, 5-10 min, was allowed after the start of a recording for the pipette concentration to equilibrate with the cell interior and for the dye fluorescence to stabilize in the hair bundle. Bundle deflection producing a near-maximal transducer current evoked a rapid increase in fluorescence during the stimulus. At the end of the step the fluorescence decayed biphasically (Fig. 3B) with a fast time constant of 150 ms and a slower time constant of 990 ms in the example illustrated. In twenty-six measurements in 2.8 mm Ca2+, the fast time constant was 287 ± 140 ms and the slow time constant was 2.4 ± 1.8 s. Detection of a fast fluorescence response required the focal plane to be located close to the top of the bundle, the position of which was determined by focusing on the stimulating probe (Fig. 3A).
Figure 3 shows that the hair bundle fluorescence increased during the stimulus as Ca2+ accumulated intracellularly. The maximum change in fluorescence, ΔF/F, at the end of the stimulus reflects the amount of Ca2+ that has entered through the transducer channel and can be expressed as follows:
| (1) |
where K is a constant and ICa, the current carried by Ca2+, is integrated over the stimulus duration. Figure 4 gives the results in four cells of varying the stimulus duration, showing that ΔF/F increased in proportion to the current integral. This observation confirms that the dye was not saturated for the range of transducer currents examined. The abscissa in Fig. 4 is the integral of the total current which includes contributions from both Na+ and Ca2+. To determine K in eqn (1), and thus calibrate the fluorescence change ΔF/F in terms of a Ca2+ current, it is necessary to measure the Ca2+ fluorescence under conditions where the transducer current is carried solely by Ca2+. This was accomplished by replacing Na+ in the artificial endolymph with Tris (Fig. 5A). If Tris is completely impermeant, the transducer current in the Tris solution is a pure Ca2+ current which can be integrated to yield the total Ca2+ entry. Knowing the fluorescence change and the Ca2+ entry in Tris, it is possible to evaluate the Ca2+ current from the fluorescence change in Na+. This can be expressed as a fractional Ca2+ current, f (see Methods), defined as the ratio of the Ca2+ current, ICa, to the total current, (ICa+INa).
Figure 5. Determination of the contribution of calcium to the transducer current.

A, transducer currents and hair bundle fluorescence changes (ΔF/F) in endolymph containing Na+ and 2.8 mm Ca2+ (control and wash) and during replacement of the Na+ with Tris. Since the transducer current in Tris is carried entirely by Ca2+, the ratio of the current integral to the peak ΔF/F in Tris can be used to convert the ΔF/F in Na+ into a Ca2+ influx. B, transducer currents and hair bundle fluorescence changes in a separate cell in endolymph containing 2.8 mm Ca2+ (control and wash) and 0.025 mm Ca2+. Stimulus durations were 325 ms (control), 825 ms (low Ca2+) and 450 ms (wash). Each trace in A and B is a single response.
The mean value of f for standard endolymph containing Na+ and 2.8 mm Ca2+ was 0.58 ± 0.09 (n = 8). In two additional experiments where the concentration of Calcium Green-1 was reduced from 1 to 0.5 mm, a similar value for f was determined (0.55) suggesting that the 1 mm dye was sufficient to capture the Ca2+ entering. An error in the value of f would arise if Tris is slightly permeable, in which case the Ca2+ current in Tris would be less than the total current. The maximum error can be assessed from the current measurements given in Fig. 2. If all the transducer current in 25 μm Ca2+ were carried by Tris, (which is unlikely due to the persistence of adaptation), Tris would contribute approximately one-seventh of the current measured in Tris and 2.8 mm Ca2+, and the true value of f would be 0.50, which lies within the standard deviation of the measurements. In three experiments, calibration of the fluorescence was performed using N-methylglucamine as another impermeant substitute for Na+, and gave a value for f in 2.8 mm Ca2+ of 0.50 ± 0.03. We conclude that within the error of the measurements, Tris is sufficiently impermeable to be used as a monovalent substitute for calibrating the fluorescence.
For subsequent experiments f was determined in a range of Na+ endolymph solutions where [Ca2+] varied from 25 μm to 20 mm. The standard endolymph, Na+ and 2.8 mm Ca2+, was used as the reference, and the test sandwiched between two standards (Fig. 5B). For the lowest [Ca2+], where the fluorescence changes were smaller, the stimulus was lengthened to improve the accuracy of measurement. The results (Fig. 6A) show that the fractional Ca2+ current increased with external Ca2+ though the relationship was shallow and, surprisingly, even at the lowest [Ca2+] of 25 μm, f had a value of 0.11. The values of f inferred from the fluorescence ratios are all larger than the current ratios, fc, calculated from the Tris substitution (Fig. 6A); fc was obtained as the ratio of the current in Tris to the current in Na+ from the values at each [Ca2+] in Fig. 2. Fluorescence measurements were also made with K+ as the monovalent cation. The values of f obtained were 0.23 ± 0.04 (n = 4) in K+ and 80 μm Ca2+, and 0.68 ± 0.09 (n = 7) in K+ and 2.8 mm Ca2+. At both endolymph Ca2+ concentrations the fractional Ca2+ current in K+ was larger than in Na+. We have shown above that the total current, which is the sum of the currents carried by the monovalent and divalent cations, was about 20 % larger in K+ than in Na+. Combining the changes in total current with the values of f, the Ca2+ entry with 80 μm external Ca2+ was 0.65 in Tris and 1.62 in K+, both expressed relative to Na+= 1. Thus the Ca2+ flux through the mechanotransducer channel depends on the identity of the monovalent cation. Two important conclusions can be drawn from these results. Firstly, the interaction between the monovalent and divalent ions argues that the transducer channel is a multi-ion pore accommodating both Ca2+ and a monovalent ion. Secondly, the largest Ca2+ entry occurs with K+, which is the ion present in normal endolymph.
Figure 6. Fractions of the transducer current carried by Ca2+ and Na+ in different Ca2+ concentrations.
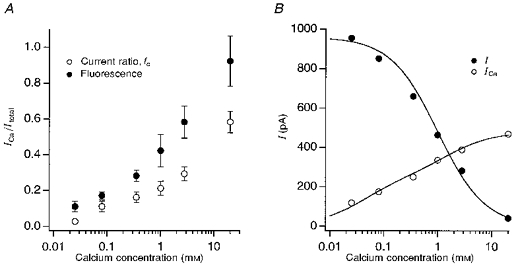
A, fractional Ca2+ current (f = ICa/Itotal) determined from the fluorimetric measurements with Na+ as the monovalent ion (•) and from the ratios of the current in Tris to current in Na+ (^, from data in Fig. 2). Fluorimetric measurements are means ± 1 s.d. of 3 experiments at each [Ca2+] except for 0.025 mm Ca2+, where the number of averages was 6, and 2.8 mm Ca2+ where it was 8. B, amounts of the transducer current carried by Na+ (•) and by Ca2+ (^) in endolymph containing different [Ca2+]. Mean transducer currents in Fig. 2 were decomposed using the fractional Ca2+ currents plotted as •in A. The dependence of the Na+ current, INa, on external Ca2+ was fitted with a single inhibitory site model: INa= 960 Ki/(Ca2++Ki) with inhibition constant Ki = 1 mm. The Ca2+ component, ICa, was fitted with a two-binding site model: ICa = 250 Ca2+/(Ca2+ + K1) + 230 Ca2+/(Ca2+ + K2), with binding constants K1 and K2 of 0.04 and 1.5 mm, respectively.
Knowledge of f as a function of [Ca2+] allows the transducer currents in Fig. 2 to be parsed out into the respective Ca2+ and Na+ contributions (Fig. 6B), which were calculated as described in the Methods (eqn (2)). The decline of the Na+ current with increasing [Ca2+] can be well described by a single inhibitory site model with half-inhibition at 1 mm Ca2+. As the contribution of Na+ decreases, that of Ca2+ increases monotonically. The dependence of the Ca2+ current on external concentration has been fitted with two binding sites with affinity constants of 40 μm and 1.5 mm. This description may be oversimplified, but it implies an interaction between multiple ions in the pore. Thus it is envisaged that at low (> 10 μm) [Ca2+], the transducer channel may contain both a Na+ and a Ca2+ ion. Competition and electrostatic repulsion between the two ions enhances the flow of Ca2+ through the channel. This mode of channel permeation resembles that described for the L-type Ca2+ channel (Almers & McCleskey, 1984; Kuo & Hess, 1993).
Ca2+ entry and transducer adaptation
Transducer adaptation, the decline in the current during a sustained stimulus, is believed to be triggered by Ca2+ influx through the transducer channels. The main evidence for this hypothesis comes from the observation that adaptation is slowed or abolished under circumstances where Ca2+ entry is minimized (Assad et al. 1989; Crawford et al. 1989, 1991). The time constant of adaptation should therefore reflect the size of the Ca2+ influx in various external ionic conditions. The rate of adaptation (the reciprocal of the time constant) is posited to increase with the increment in intracellular Ca2+ assuming that subsequent steps in the process do not become limiting. The time constant was measured from the responses to small displacement steps where the decay of the current could be approximated by a single exponential (Crawford et al. 1989). Provided the initial current amplitude was less than half the total current with a saturating stimulus, the inferred time constant was roughly independent of the step size. For responses greater than half-maximal, adaptation slowed considerably (Fig. 1), suggesting that other steps in adaptation become rate limiting.
The transducer currents in Fig. 7A show that adaptation was slowed when the [Ca2+] was reduced from 2.8 mm to 25 μm, and was accelerated when K+ was substituted for Na+ as the monovalent ion. The influence of the external [Ca2+] is expected and is in accord with previous results obtained over a more limited Ca2+ range (e.g. Crawford et al. 1989; Assad et al. 1989). Consistent with the fluorescence measurements is the finding that the identity of the monovalent ion affected the time course of adaptation. As an illustration, in 2.8 mm Ca2+ the mean time constant with Na+ was 1.03 ± 0.05 ms (n = 50), with K+ it was 0.76 ± 0.07 ms (n = 6) and with Tris it was 1.33 ± 0.12 ms (n = 13), respectively. These differences are significant (P < 0.02) and may reflect differences in the fractional Ca2+ current measured for each monovalent. A more quantitative test of this notion is shown in Fig. 7B, where the rate of adaptation has been plotted against the transducer Ca2+ current, calculated as the product of the fractional Ca2+ current, f, and the maximum current. The collected results for the three cations Na+, K+ and Tris in a series of Ca2+ concentrations all fall approximately on a common line describing an increase in adaptation rate proportional to Ca2+ entry.
Figure 7. Variation of the time constant of adaptation with Ca2+ entry.
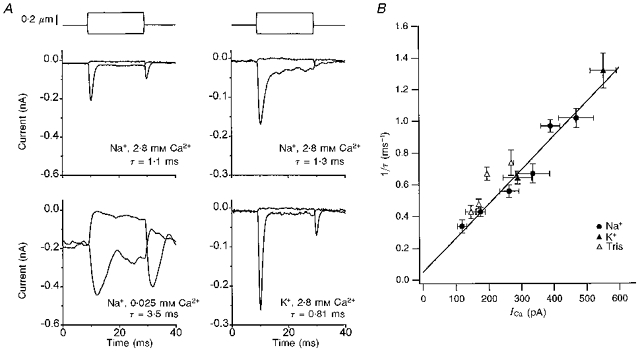
A, effects on the transducer current of reducing endolymphatic [Ca2+] from 2.8 to 0.025 mm in one cell (left), and of replacing Na+ with K+ in a different cell (right). For all 4 examples, averages of 25 responses are superimposed for positive and negative displacement steps, timing shown above the currents. Note that reducing [Ca2+] slows adaptation whereas K+ substitution speeds it up. The adaptation time constants (τ) were obtained from fits to the current decay at the onset of the positive step and the offset of the negative step. All examples are small (less than half-maximal) responses. Maximum currents were: top, 0.65 nA, 2.8 mm Ca2+; 1.05 nA, 0.025 mm Ca2+; bottom, 0.48 nA, Na+, 0.56 nA, K+. B, plot of reciprocal of adaptation time constant against the Ca2+ current, evaluated as the product of the maximum total current and the fractional Ca2+ current, f, in the appropriate ionic condition. Each point is the mean (± 1 s.e.m.) for measurements with the monovalent ion as Na+ (•), K+ (▴) and Tris (▵). The line is a least-squares fit to plotted points, slope, 2.2 ms−1 nA−1; r = 0.97.
Mg2+ like Ca2+ has a very low concentration in endolymph (∼10 μm; Bosher & Warren, 1968). Consequently, Mg2+ was not normally included in the artificial endolymph solutions. Addition of 2.2 mm Mg2+ to the standard solution reduced the transducer current to 0.88 ± 0.05 (n = 22) of that in the control. A similar reduction (0.90 ± 0.05, n = 9) was obtained by increasing the Ca2+ from 2.8 to 5 mm, suggesting that the blocking efficacy of Mg2+ may be comparable to that of Ca2+ (Crawford et al. 1991). The addition of Mg2+ also produced a statistically significant prolongation (P < 0.001) in the time constant of adaptation from 1.03 ± 0.05 ms (n = 50) to 1.43 ± 0.11 ms (n = 26). By contrast, addition of an equivalent amount of Ca2+ slightly accelerated adaptation. These observations would be consistent with Mg2+ slowing adaptation by a reduction in Ca2+ entry.
The amplitude of the transducer current, and hence Ca2+ entry, will depend on membrane potential, increasing with hyperpolarization. In some experiments, we examined the effects of holding potential on the adaptation time constant. The transducer stimulus was superimposed on a voltage step that changed the potential from -90 mV to values ranging from -10 to -150 mV. Adaptation slowed and became less pronounced with depolarization as reported previously (Crawford et al. 1989), and accelerated for hyperpolarization (Fig. 8A). The fractional Ca2+ current, f, was also measured at -150 mV and found to be 0.51 ± 0.09 (n = 5), which is not substantially different from the value of 0.58 ± 0.09 at -90 mV. A constant f at negative holding potentials was reported for a glutamate receptor channel by Schneggenburger et al. (1993). If the fractional Ca2+ current remains approximately constant with changes in membrane potential then the total Ca2+ entry should grow in proportion to the size of the transducer current. Figure 8B shows examples of three cells in which the adaptation rate is seen to increase roughly linearly with the amplitude of the transducer current. For the cell with the fastest adaptation, there was departure from linearity at the most hyperpolarized potentials, but this deviation was not evident in the other two cells that were polarized to the same range of potentials. One explanation for the non-linearity is that subsequent steps in the adaptation process become rate limiting when the rise in internal [Ca2+] is very rapid.
Figure 8. Effects of holding potential on the adaptation time constant.

A, transducer currents at holding potentials of -50, -90 and -140 mV. Bundle displacement was with an amplitude of 0.2 μm, timing is shown above the currents, each of which are averages of 10 responses. B, reciprocal of the adaptation time constant is plotted against the amplitude of the transducer current for 3 cells. For each cell, the current amplitude was varied by changing the holding potential over a range from -10 to -140 mV. Endolymph solution: Na+, 2.8 mm Ca2+ (□, •) and Na+, 0.35 mm Ca2+ (▴). Lines drawn by eye.
Shifts in the current-displacement relationship
Another manifestation of adaptation is the resetting of the transducer operating range relative to the resting position of the bundle. With reduction in external [Ca2+], the activation curve shifts along the displacement axis thus increasing the fraction of total current on at rest (Corey & Hudspeth, 1983; Crawford et al. 1991; Ricci & Fettiplace, 1997). An example of this phenomenon is shown in Fig. 9A. In 2.8 mm external Ca2+, 3 % of the current was activated at rest, equivalent to a standing current of 23 pA. When the [Ca2+] was lowered to 25 μm, the peak current grew from 780 to 1400 pA but in addition, the fraction of current on at rest increased to 180 pA or 13 % of the total. In six cells, the proportion of current activated at rest increased from 3.6 ± 1.5 % in 2.8 mm Ca2+ to 16.4 ± 10.5 % in 25 μm Ca2+. In a further ten cells, the proportion of current activated at rest increased from 3.1 ± 1.1 % in 2.8 mm Ca2+ to 6.4 ± 2.3 % in 80 μm Ca2+. It should be noted that these shifts in low [Ca2+] are smaller than previously reported (Crawford et al. 1991) which may result from several experimental factors. The larger current size and the lower buffer concentration may both render transducer adaptation less sensitive to reducing external Ca2+ (Ricci & Fettiplace, 1997). Thus for small transducer currents, or with high concentrations (5-10 mm) of intracellular Ca2+ buffer, lowering external Ca2+ produces much larger shifts of the current-displacement relation. BAPTA at 1 mm was chosen as the buffer in these experiments since it is equivalent to the concentration of diffusible Ca2+ buffer occurring in vivo (Tucker & Fettiplace, 1996). In addition special care was taken in placing the stimulating probe so as not to perturb the bundle from its resting position. The leakage current on attaining the whole-cell recording, which provides an upper limit to the standing transducer current on at rest, was never more than 50 pA in 2.8 mm Ca2+. The leak corresponds to 5 % of the total for a cell with a maximum current of 1 nA.
Figure 9. Shifts in the current-displacement relation depend on resting Ca2+ entry.

A, current-displacement relationships, obtained for a cell with endolymphs of Na+, 2.8 mm Ca2+ (▵) and Na+, 0.025 mm Ca2+ (×). Smooth curves are double-Boltzmann fits relating transducer current I to bundle displacement x calculated from: I/Imax = [1 + exp(a2x2 - a2x){1 + exp(a1x1 - a1x)}]−1 with: Imax = 0.78 nA, a1 = 35 μm−1, a2 = 15 μm−1, x1 =x2 = 0.08 μm (▵); Imax = 1.4 nA, a1 = 60 μm−1, a2 = 15 μm−1, x1 =x2= 0.01 μm (×). In B, the ordinate is the ratio of the transducer current activated at rest in a test solution, Ir(Ca), to that activated at rest in the control solution, Ir(2.8), which contains Na+ and 2.8 mm Ca2+. Abscissa is the ratio of the fractional Ca2+ current in the control, f(2.8), to that in the test solution, f(Ca). •, Na+ with 2.8, 1, 0.35, 0.08 and 0.025 mm Ca2+; ▴, K+ with 0.08 mm Ca2+; ▵, mean of all values in Tris with 2.8, 1, 0.35 or 0.08 mm Ca2+ (for explanation, see text). For other solutions, Ir(Ca) could not be accurately measured. Line is least-squares fit with slope 1.22, r = 0.98.
To analyse the shifts in the current-displacement relation, we shall assume that, on lowering the external [Ca2+], the activation relation shifts negative-opening transducer channels until the same amount of Ca2+ is entering the channels at rest as in the control solution. This is equivalent to assuming that the feedback variable controlling the position of the current-displacement relation is the internal [Ca2+], and that this is proportional to Ca2+ entry. Thus in Fig. 9A, the current on at rest, Ir, increased ∼8-fold from 23 to 180 pA in order to compensate for the smaller fractional Ca2+ current in 25 μm Ca2+ (f [0.025]) than in 2.8 mm (f[2.8]). From Fig. 6A, the ratio f [2.8]/f [0.025] is 5.3. This calculation was repeated for other values of extracellular [Ca2+] and for K+, 80 μm Ca2+. The results are collected in Fig. 9B, where the ratio of the current on at rest in the test solution and in 2.8 mm Ca2+, Ir(Ca)/Ir(2.8) is plotted against the ratio f [2.8]/f [Ca2+]. There is a good correlation between the two ratios (r = 0.98) and the slope of the fitted line is close to unity suggesting that, irrespective of the external [Ca2+], the current-displacement relation shifts to equalize the Ca2+ load. Shifts in the current-displacement relation were also evaluated for measurements in Tris. Since the currents in Tris are assumed to be carried entirely by Ca2+ (f = 1), the ratio of the current on at rest in Tris relative to Na+, 2.8 mm Ca2+ solution should be independent of Ca2+ in the Tris solution. The current ratio showed no systematic trend with [Ca2+] from 0.08 to 2.8 mm (ANOVA test, P > 0.05), which is consistent with the assumption that Tris is impermeable. Combining the Tris results in different Ca2+ concentrations gave a mean current ratio of 0.57 ± 0.27 (n = 29), close to the f [2.8] value of 0.58.
DISCUSSION
Comparison with other hair cell measurements
There is existing evidence to show that the hair cell mechanoelectrical transducer channel has a significant permeability to Ca2+ ions (Corey & Hudspeth, 1979; Ohmori, 1985; Jorgensen & Kroese, 1995), but our work is the first to quantify the fraction of transducer current carried by Ca2+ in single hair cells under conditions that might approximate those occurring in vivo. Using the increase in fluorescence in hair cells loaded with a high concentration of Ca2+ indicator (Schneggenburger et al. 1993), we have found that Ca2+ carries a surprisingly large fraction of the current even when its extracellular concentration is very low. We estimate (Fig. 6) that in an external solution containing 50 μm Ca2+ and Na+, Ca2+ carries about one-tenth of the current; with K+ as the monovalent ion, the fraction may be 35 % larger. Ca2+ entry through the transducer channels is important physiologically since it initiates adaptation, a process that maximizes the transducer sensitivity for small displacements around the resting position of the hair bundle (Eatock et al. 1987; Crawford et al. 1989). We have previously shown that the rate of adaptation and the position of the current-displacement relation depend on both the concentration of internal Ca2+ buffer and the location of the hair cell in the cochlea (Ricci & Fettiplace, 1997). Data presented here further demonstrate that for cells from a given location recorded with a fixed buffer concentration (1 mm BAPTA), the rate of adaptation and the position of the current-displacement relation were linear functions of Ca2+ entry. These results are expected if adaptation is driven by the [Ca2+] at some intracellular site near the channel.
Many of the previous conclusions about the role of Ca2+ in hair cell transduction have been inferred from extracellular microphonic measurements in an epithelial preparation of the frog saccule (e.g. Corey & Hudspeth, 1979; Corey & Hudspeth, 1983; Eatock et al. 1987; Jorgensen & Kroese, 1995). The preparation is unphysiological since the cells are depolarized by exposure of their basal surface to high [K+] which is likely to result in, among other things, an elevated internal [Ca2+]. Furthermore, the approach has produced conflicting results. For example, Corey & Hudspeth (1983) report that the transducer current amplitude was increased in low (100 μm) apical Ca2+, which agrees with our results on single hair cells, whereas Jorgensen & Kroese (1995) claim that the current was depressed in 90 μm Ca2+. Jorgensen & Kroese (1995) also conclude, based on reversal potential measurements, that the transducer channels are 200 times more permeable to Ca2+ than to K+. The extent to which the fractional Ca2+ current is consistent with such a high permeability ratio can, to a first approximation, be estimated from the constant field Goldman-Hodgkin-Katz (GHK) equation. Using the approach described in Schneggenburger et al. (1993), the GHK equation can be simplified assuming that the internal [Ca2+]≡0 and that the internal and external monovalents, M, have the same permeability. The latter assumption will be approximately correct for the fluorescence measurements where the internal ion was Cs+ and the external ion was Na+ or K+. The fractional Ca2+ current, f, can then be related to the extracellular Ca2+ concentration [Ca2+]o by:
| (5) |
where [M] is the monovalent concentration (140 mm), V is the membrane potential (-90 mV), PCa is the permeability of Ca2+ relative to K+ and R, T and F have their normal thermodynamic meanings. Using a PCa of 100, the values calculated for f are 0.89 in 2.8 mm Ca2+ and 0.19 in 0.08 mm Ca2+. The equivalent experimental values were 0.68 and 0.23. These results are in general agreement with the high selectivity for Ca2+ over K+ reported by Jorgensen & Kroese (1995). However, it is clear that the predictions of the constant field equation were imperfect, and it was not possible to find one value of PCa that accurately described the entire range of measurements. This discrepancy, coupled with the observation that the fractional Ca2+ current was dependent on the identity of the monovalent (Na+ or K+) argues for ionic interactions within the pore.
Ca2+ permeation and block
Ca2+ permeation has been investigated using microfluorometric techniques in several other ionic channels including the nicotinic acetylcholine channel (Zhou & Neher, 1993; Vernino et al. 1994), two types of glutamate receptor channel (Schneggenburger et al. 1993) and the cyclic nucleotide-gated (CNG) channel (Frings, Seifert, Godde & Kaupp, 1995). The CNG channel, which is deployed in sensory receptor cells of both vision and olfaction, may be a suitable comparison for the hair cell transducer channel since Ca2+ fluxes through the CNG channels are also intimately involved with shaping the transducer current. The resulting change in intracellular Ca2+ can serve as a signal for adaptation in both photoreceptors (Pugh & Lamb, 1990) and olfactory neurons (Kurahashi & Menini, 1997). Expressed CNG channels from different sources (rods, cones or olfactory neurons) possess distinct Ca2+ permeation properties (Frings et al. 1995) and only the bovine olfactory CNG channel has a high Ca2+ permeability comparable with the hair cell channel. At 1 mm external Ca2+ the fractional Ca2+ current is 0.45 in the olfactory CNG channel compared with 0.42 in the mechanotransducer channel. Ca2+ also blocks the monovalent current in olfactory CNG channels but the half-blocking concentration is 0.1 mm at a membrane potential similar to that used in the present hair cell experiments. Clearly such a high affinity of block would not be useful in the hair cell channel since it would significantly diminish the transducer current.
Ca2+ permeation and block in the hair cell mechanotransducer channel show similarities in behaviour to both voltage-dependent L-type Ca2+ channels (Almers & McCleskey, 1984) and to the CNG channels (Frings et al. 1995), which may reflect a common underlying mechanism. All three channel types allow monovalent cations to permeate at low [Ca2+]; at high [Ca2+] all the channels carry close to a pure Ca2+ current; at intermediate [Ca2+], extracellular Ca2+ blocks permeability to the monovalent ion. The three channel types differ, however, in the range of concentrations over which Ca2+ inhibits the monovalent flux: < 1 μm, Ca2+ channel; ∼0.1 mm, CNG channel; ∼1 mm, mechanotransducer channel. This range will ultimately determine the relative proportions of monovalent and divalent ions that flow through the channel under physiological circumstances, which is likely to be matched to the normal function of the channel.
The role of endolymph
Our description of the Ca2+ permeability properties of the transducer channel may help to provide an explanation for the unusual composition of endolymph, the fluid to which the hair bundles are exposed. In the mammalian cochlea, which has been most studied, the endolymphatic cation concentrations are: K+, 160 mm; Na+ < 1 mm; Mg2+, 10 μm; Ca2+, 20-40 μm (Bosher & Warren, 1978; Bosher, 1979; Ikeda et al. 1987; Salt et al. 1989). Similar values have been measured in the auditory organs of reptiles like the turtle (Johnstone, Schmidt & Johnstone, 1963; Crawford et al. 1991). The composition is remarkable for an extracellular solution in having K+ rather than Na+ as the major cation, and very low Ca2+ and Mg2+ concentrations. A common view is that using K+ rather than Na+ reduces the metabolic load on the hair cell by not requiring the cell to extrude Na+ ions constantly entering through the transducer channels (Sellick & Johnstone, 1975). Instead, K+ carries the transducer current flowing down its electrical gradient from the endolymph and exits into the perilymph down its concentration gradient. This provides no explanation for the Ca2+ concentration, which although low is still far from equilibrium (Bosher & Warren, 1978). In fact the Ca2+ concentration is set appropriately to maximize the transducer current (Figs 2 and 6). This conclusion may be illustrated by comparing the magnitudes of the transducer current and Ca2+ influx in normal extracellular solution (Na+, 2.8 mm Ca2+, 2.2 mm Mg2+) and in a solution like endolymph (K+, 25 μm Ca2+, 0 Mg2+). The current magnitude can be estimated to increase ∼2.2-fold due to the reduction in Ca2+, removal of Mg2+ and substitution of K+ for Na+. Despite the low external [Ca2+], a significant Ca2+ influx is retained which we can estimate as approximately 15-20 % of the total current with K+ as the monovalent ion. If K+ were replaced by Na+, the total current would be smaller as would the fraction of current carried by Ca2+.
Adaptation has been suggested to contribute a high-pass filter which sharpens the hair cell tuning curve in the turtle (Ricci & Fettiplace, 1997). Since mammals detect higher frequencies than lower vertebrates, a faster adaptation time constant may be required for the high-pass filter to operate in the higher frequency range of mammals. One other feature of the mammalian cochlea is the presence of an endolymphatic potential, the endolymph being ∼80 mV positive to the perilymph (e.g. Bosher, 1979). The endolymphatic potential sums with the resting potential of the hair cell (-40 to -70 mV; Dallos, 1986; Russell, Cody & Richardson, 1986) to produce a voltage drop across the transducer membrane of 120-150 mV. An additional role of the endolymphatic potential, apart from amplifying the transducer current, may be to increase the Ca2+ entry and hence the rate of adaptation in order to extend the frequency range of the high-pass filter.
The Ca2+ load per stereocilium
The analysis of the shifts in the current-displacement relation in different artificial endolymphs suggests that the transducer activation relation is translated along the displacement axis to equalize the Ca2+ load (Fig. 9). The average load at rest can be estimated most accurately from the data in standard artificial endolymph containing 2.8 mm Ca2+ as the proportion of current on at rest (0.035 × 670 pA) multiplied by the fractional Ca2+ current (f[2.8]= 0.58). This amounts to 13.6 pA of Ca2+ current, or 0.15 pA per stereocilium for a bundle composed of ninety stereocilia (Hackney, Fettiplace & Furness, 1993). A standing current of this magnitude would elevate the stereociliary [Ca2+] by ∼1 mm s−1 assuming a volume of ∼0.5 fl. (The lengths of the stereocilia in a typical bundle vary from 2-6 μm, so an intermediate length of 4 μm and a diameter of 0.4 μm was used to calculate this volume.) The large Ca2+ load experienced by the hair bundle must pose a significant metabolic problem for the hair cell, and may largely account for the cell's reputed vulnerability to hypoxia or overstimulation, especially in the mammalian cochlea (e.g. Evans & Klinke, 1982). Indeed, overloading of the stereocilia by Ca2+, leading to mitochondrial swelling and cytoskeletal disorganization, may underlie prolonged reductions in auditory sensitivity classified under the heading of temporary threshold shifts (for review see Saunders, Dear & Schneider, 1985).
In view of the large Ca2+ influx associated with transduction, it seems likely that a parallel extrusion process operates within the stereocilia. Ca2+ removal from hair cells is thought to occur via a plasma membrane Ca2+-ATPase (Tucker & Fettiplace, 1995) which has been shown to be present in the stereocilia (Crouch & Schulte, 1995). Assuming that each Ca2+-ATPase has a maximum pumping rate of 50 ions s−1 (Garrahan & Rega, 1990), clearance of the 0.15 pA standing Ca2+ current requires a minimum of 9000 pumps per stereocilium or 1800 pumps μm−2. This calculation sets a lower limit on the number of pumps since the maximal pumping rate will be achieved only within the neighbourhood of the transducer channel where the [Ca2+] exceeds ∼1 μm.
Acknowledgments
This work was supported by a research grant (5R01 DC 01362) to R. F. from the National Institutes on Deafness and Other Communication Disorders (National Institutes of Health). We thank Mike Wu and Genie Jones for helpful discussions and Jon Art and Larry Trussell for commenting on the manuscript.
References
- Almers W, McCleskey EW. Non-selective cation conductance in calcium channels of frog muscle: calcium selectivity in a single-file pore. Journal of Physiology. 1984;353:585–608. doi: 10.1113/jphysiol.1984.sp015352. [DOI] [PMC free article] [PubMed] [Google Scholar]
- Assad JA, Hacohen N, Corey DP. Voltage dependence of adaptation and active bundle movements in bullfrog saccular hair cells. Proceedings of the National Academy of Sciences of the USA. 1989;86:2918–2922. doi: 10.1073/pnas.86.8.2918. [DOI] [PMC free article] [PubMed] [Google Scholar]
- Blatter LA, Weir WG. Intracellular diffusion, binding and compartmentalization of the fluorescent calcium indicators indo-1 and fura-2. Biophysical Journal. 1990;58:1491–1499. doi: 10.1016/S0006-3495(90)82494-2. [DOI] [PMC free article] [PubMed] [Google Scholar]
- Bosher SK. The nature of the negative endocochlear potential produced by anoxia and ethacrynic acid in rat and guinea pig cochlea. Journal of Physiology. 1979;293:329–345. doi: 10.1113/jphysiol.1979.sp012892. [DOI] [PMC free article] [PubMed] [Google Scholar]
- Bosher SK, Warren RL. Very low calcium content of cochlear endolymph, an extracellular fluid. Nature. 1978;273:377–378. doi: 10.1038/273377a0. [DOI] [PubMed] [Google Scholar]
- Corey DP, Hudspeth AJ. Ionic basis of the receptor potential in a vertebrate hair cell. Nature. 1979;281:675–677. doi: 10.1038/281675a0. [DOI] [PubMed] [Google Scholar]
- Corey DP, Hudspeth AJ. Kinetics of the receptor current in bullfrog saccular hair cells. Journal of Neuroscience. 1983;3:962–976. doi: 10.1523/JNEUROSCI.03-05-00962.1983. [DOI] [PMC free article] [PubMed] [Google Scholar]
- Crawford AC, Evans MG, Fettiplace R. Activation and adaptation of transducer currents in turtle hair cells. Journal of Physiology. 1989;419:405–434. doi: 10.1113/jphysiol.1989.sp017878. [DOI] [PMC free article] [PubMed] [Google Scholar]
- Crawford AC, Evans MG, Fettiplace R. The actions of calcium on the mechanoelectrical transducer current of turtle hair cells. Journal of Physiology. 1991;434:369–398. doi: 10.1113/jphysiol.1991.sp018475. [DOI] [PMC free article] [PubMed] [Google Scholar]
- Crawford AC, Fettiplace R. The mechanical properties of ciliary bundles of turtle cochlear hair cells. Journal of Physiology. 1985;364:359–379. doi: 10.1113/jphysiol.1985.sp015750. [DOI] [PMC free article] [PubMed] [Google Scholar]
- Crouch JJ, Schulte BA. Expression of plasma membrane Ca-ATPase in the adult and developing gerbil cochlea. Hearing Research. 1995;92:112–119. doi: 10.1016/0378-5955(95)00201-4. [DOI] [PubMed] [Google Scholar]
- Dallos P. Neurobiology of cochlear inner and outer hair cells. Hearing Research. 1986;22:185–198. doi: 10.1016/0378-5955(86)90095-x. 10.1016/0378-5955(86)90095-X. [DOI] [PubMed] [Google Scholar]
- Denk W, Holt JR, Shepherd GMG, Corey DP. Calcium imaging of single stereocilia in hair cells: localization of transduction channels at both ends of tip links. Neuron. 1995;15:1311–1321. doi: 10.1016/0896-6273(95)90010-1. 10.1016/0896-6273(95)90010-1. [DOI] [PubMed] [Google Scholar]
- Eatock RA, Corey DP, Hudspeth AJ. Adaptation of mechanoelectrical transduction in hair cells of the bullfrog's sacculus. Journal of Neuroscience. 1987;7:2821–2836. doi: 10.1523/JNEUROSCI.07-09-02821.1987. [DOI] [PMC free article] [PubMed] [Google Scholar]
- Evans EF, Klinke R. The effects of intracochlear cyanide and tetrodotoxin on the properties of single cochlear nerve fibres in the cat. Journal of Physiology. 1982;331:385–407. doi: 10.1113/jphysiol.1982.sp014378. [DOI] [PMC free article] [PubMed] [Google Scholar]
- Frings S, Seifert R, Godde M, Kaupp UB. Profoundly different calcium permeation and blockage determine the specific function of cyclic nucleotide-gated channels. Neuron. 1995;15:169–179. doi: 10.1016/0896-6273(95)90074-8. [DOI] [PubMed] [Google Scholar]
- Garrahan PJ, Rega AF. Plasma membrane calcium pump. In: Bronner F, editor. Intracellular Calcium Regulation. New York: Wiley-Liss; 1990. pp. 271–303. [Google Scholar]
- Gray-Keller MP, Detwiler PB. The calcium feedback signal in the phototransduction cascade in vertebrate rods. Neuron. 1994;13:849–861. doi: 10.1016/0896-6273(94)90251-8. [DOI] [PubMed] [Google Scholar]
- Hackney CM, Fettiplace R, Furness DN. The functional morphology of stereociliary bundles on turtle cochlear hair cells. Hearing Research. 1993;69:163–175. doi: 10.1016/0378-5955(93)90104-9. [DOI] [PubMed] [Google Scholar]
- Ikeda K, Kusakari J, Takasaka T, Saito Y. The Ca2+ activity of cochlear endolymph of the guinea pig and the effect of inhibitors. Hearing Research. 1987;26:117–125. doi: 10.1016/0378-5955(87)90040-2. [DOI] [PubMed] [Google Scholar]
- Jaramillo F, Hudspeth AJ. Localization of the hair cell's transduction channels at the hair bundle's top by iontophoretic application of a channel blocker. Neuron. 1991;7:409–420. doi: 10.1016/0896-6273(91)90293-9. [DOI] [PubMed] [Google Scholar]
- Johnstone CG, Schmidt RS, Johnstone BM. Sodium and potassium in vertebrate cochlear endolymph as determined by flame micro-spectrophotometry. Comparative Biochemistry and Physiology. 1963;9:335–341. doi: 10.1016/0010-406x(63)90008-2. [DOI] [PubMed] [Google Scholar]
- Jorgensen F, Kroese AB. Calcium selectivity of the transducer channel in hair cells of the frog sacculus. Acta Physiologica Scandinavica. 1995;155:363–376. doi: 10.1111/j.1748-1716.1995.tb09986.x. [DOI] [PubMed] [Google Scholar]
- Kimitsuki T, Ohmori H. The effect of caged calcium release on the adaptation of the transduction current in chick hair cells. Journal of Physiology. 1992;458:27–40. doi: 10.1113/jphysiol.1992.sp019404. [DOI] [PMC free article] [PubMed] [Google Scholar]
- Kuo C-C, Hess P. Ion permeation through the L-type Ca2+ channel in rat phaeochromocytoma cells: two sets of ion binding sites in the pore. Journal of Physiology. 1993;466:629–655. [PMC free article] [PubMed] [Google Scholar]
- Kurahashi T, Menini A. Mechanism of odorant adaptation in the olfactory receptor cell. Nature. 1997;385:725–729. doi: 10.1038/385725a0. [DOI] [PubMed] [Google Scholar]
- Ohmori H. Mechanoelectrical transduction currents in isolated vestibular hair cells of the chick. Journal of Physiology. 1985;359:189–217. doi: 10.1113/jphysiol.1985.sp015581. [DOI] [PMC free article] [PubMed] [Google Scholar]
- Pugh E, Lamb TD. Cyclic GMP and calcium: the internal messengers of activation and adaptation in vertebrate photoreceptors. Vision Research. 1990;30:1923–1948. doi: 10.1016/0042-6989(90)90013-b. [DOI] [PubMed] [Google Scholar]
- Ricci AJ, Fettiplace R. The effects of calcium buffering and cyclic AMP on mechanoelectrical transduction in turtle hair cells. Journal of Physiology. 1997;501:111–124. doi: 10.1111/j.1469-7793.1997.111bo.x. [DOI] [PMC free article] [PubMed] [Google Scholar]
- Russell IJ, Cody AR, Richardson GP. The responses of inner and outer hair cells in the basal turn of the guinea-pig cochlea and in the mouse cochlea grown in vitro. Hearing Research. 1986;22:199–216. doi: 10.1016/0378-5955(86)90096-1. [DOI] [PubMed] [Google Scholar]
- Salt AN, Inamura N, Thalmann R, Vorba A. Calcium gradients in inner ear endolymph. American Journal of Otolaryngology. 1989;10:371–375. doi: 10.1016/0196-0709(89)90030-6. [DOI] [PubMed] [Google Scholar]
- Saunders JC, Dear SP, Schneider ME. The anatomical consequences of acoustic injury: a review and tutorial. Journal of the Acoustical Society of America. 1985;78:833–860. doi: 10.1121/1.392915. [DOI] [PubMed] [Google Scholar]
- Schneggenburger R, Zhou Z, Konnerth A, Neher E. Fractional contribution of calcium to the cation current through glutamate receptor channel. Neuron. 1993;11:133–143. doi: 10.1016/0896-6273(93)90277-x. [DOI] [PubMed] [Google Scholar]
- Sellick PM, Johnstone BM. Production and role of inner ear fluid. Progress in Neurobiology. 1975;5:337–362. doi: 10.1016/0301-0082(75)90015-5. [DOI] [PubMed] [Google Scholar]
- Tucker T, Fettiplace R. Confocal imaging of calcium microdomains and calcium extrusion in turtle hair cells. Neuron. 1995;15:1323–1335. doi: 10.1016/0896-6273(95)90011-x. [DOI] [PubMed] [Google Scholar]
- Tucker T, Fettiplace R. Monitoring calcium in turtle hair cells with a calcium-activated potassium channel. Journal of Physiology. 1996;494:613–626. doi: 10.1113/jphysiol.1996.sp021519. [DOI] [PMC free article] [PubMed] [Google Scholar]
- Vernino S, Rogers M, Radcliffe KA, Dani JA. Quantitative measurement of calcium flux through muscle and neuronal nicotinic acetylcholine receptors. Journal of Neuroscience. 1994;14:5514–5524. doi: 10.1523/JNEUROSCI.14-09-05514.1994. [DOI] [PMC free article] [PubMed] [Google Scholar]
- Zhou Z, Neher E. Calcium permeability of nicotinic acetylcholine receptor channels in bovine adrenal chromaffin cells. Pflügers Archiv. 1993;425:511–517. doi: 10.1007/BF00374879. [DOI] [PubMed] [Google Scholar]