

Abstract
The discharge patterns of 166 lateral cerebellar neurones were studied in cats at rest and during visually guided stepping on a horizontal circular ladder. A hundred and twelve cells were tested against one or both of two visual stimuli: a brief full-field flash of light delivered during eating or rest, and a rung which moved up as the cat approached. Forty-five cells (40%) gave a short latency response to one or both of these stimuli. These visually responsive neurones were found in hemispheral cortex (rather than paravermal) and the lateral cerebellar nucleus (rather than nucleus interpositus).
Thirty-seven cells (of 103 tested, 36%) responded to flash. The cortical visual response (mean onset latency 38 ms) was usually an increase in Purkinje cell discharge rate, of around 50 impulses s−1 and representing 1 or 2 additional spikes per trial (1.6 on average). The nuclear response to flash (mean onset latency 27 ms) was usually an increased discharge rate which was shorter lived and converted rapidly to a depression of discharge or return to control levels, so that there were on average only an additional 0.6 spikes per trial. A straightforward explanation of the difference between the cortical and nuclear response would be that the increased inhibitory Purkinje cell output cuts short the nuclear response.
A higher proportion of cells responded to rung movement, sixteen of twenty-five tested (64%). Again most responded with increased discharge, which had longer latency than the flash response (first change in dentate output ca 60 ms after start of movement) and longer duration. Peak frequency changes were twice the size of those in response to flash, at 100 impulses s−1 on average and additional spikes per trial were correspondingly 3–4 times higher. Both cortical and nuclear responses were context dependent, being larger when the rung moved when the cat was closer than further away.
A quarter of cells (20 of 84 tested, 24%) modulated their activity in advance of saccades, increasing their discharge rate. Four-fifths of these were non-reciprocally directionally selective. Saccade-related neurones were usually susceptible to other influences, i.e. their activity was not wholly explicable in terms of saccade parameters.
Substantial numbers of visually responsive neurones also discharged in relation to stepping movements while other visually responsive neurones discharged in advance of saccadic eye movements. And more than half the cells tested were active in relation both to eye movements and to stepping movements. These combinations of properties qualify even individual cerebellar neurones to participate in the co-ordination of visually guided eye and limb movements.
The experiments described in this report were intended to investigate the role of the cerebellar hemisphere in the visual guidance of locomotor movements. Cats were trained to perform a type of skilled, visually guided stepping in the expectation that visual contributions to its control would be conspicuous. Single unit recordings were made in the lateral cerebellum (hemispheral cortex and dentate nucleus) because sequences of visually guided, voluntary movements involving a complete limb or the whole body are strikingly affected by damage to it (Holmes, 1939). Cerebellar patients attempting to point accurately to a series of locations make particularly obvious errors towards the end of each movement; the speed of an affected limb, rather than reducing smoothly to zero, is often unchecked until the target is reached or has been passed (hypermetria), and then attempts are made to correct this error by making a series of discrete secondary movements which may nevertheless fail to arrest the finger accurately on the target, appearing rather to ‘hunt’ jerkily around it. This visually guided hunting indicates that the strongly feed-forward visuomotor control system is severely compromised by cerebellar injury. This is probably because a major (perhaps the main) pathway that links visual to motor control centres passes through the lateral cerebellum (Robinson, Cohen, May, Sestokas & Glickstein, 1984; Glickstein, May & Mercier, 1985; Glickstein, Gerrits, Kralj-Hans, Mercier, Stein & Voogd, 1994; and reviewed in Stein & Glickstein, 1992).
Single unit recordings from the cerebellar hemisphere and dentate nucleus have therefore been obtained in an attempt to identify neuronal activity that might reveal the usual cerebellar contribution and so help explain why the cerebellum is so crucial to visuomotor control. The implications of the observed discharge patterns for a current conceptual framework in which the cerebellum functions as a ‘Smith Predictor’ (Miall & Wolpert, 1995) are discussed. Some results have been reported briefly elsewhere (Marple-Horvat, Criado & Armstrong, 1992, 1993; Marple-Horvat, 1995, 1996).
METHODS
Task and recording procedures
A horizontal circular ladder was used to study the discharge patterns of individual neurones in cats at rest and during visually guided stepping. A detailed description of the ladder has been provided elsewhere (see Amos, Armstrong & Marple-Horvat, 1987). It incorporates a mechanism for provoking visually guided step modification (see Marple-Horvat, Amos, Armstrong & Criado, 1992); two motor driven, pre-displaceable rungs (PDRs) are included, one per half-circuit, which can be made to move as the cat approaches, triggered by the interruption by either forelimb of an infra-red (IR) beam aimed across the walkway just above a rung and detected by a sensor on the other side (Fig. 1A).
Figure 1. Operation of the pre-displaceable rung (PDR).
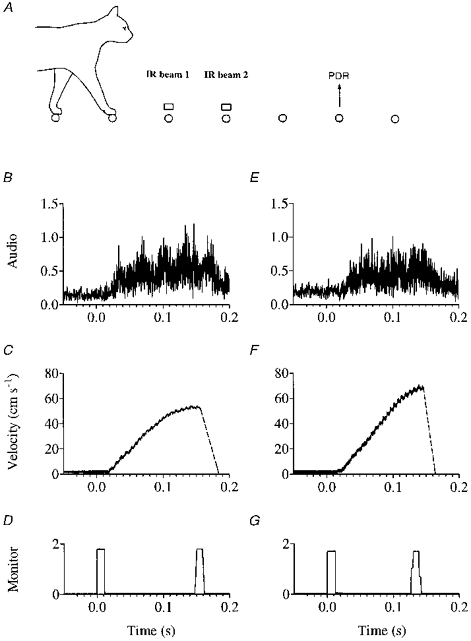
A, two special pre-displaceable rungs (PDRs) could be made to move upwards as the cat approached, triggered by interruption (by either forelimb) of one of two selected infra-red (IR) beams aimed across the walkway. Shown beneath for each PDR are averaged data obtained from five sequential movements: B and E, audio profiles (amplitude in arbitrary units) obtained by full wave rectification of a digital recording of the sound generated by each mechanism; C and F, velocity profiles for each rung; D and G, (2V) monitor pulses whose leading edges mark the time at which power to the motors was turned on and off.
One of two such beams located two and three rungs away from the PDR was manually selected, whereupon interruption of the beam immediately triggered rung movement, so that the cat was either two or three steps away from the PDR when it moved. Interruption of the IR beam chosen to trigger rung movement generated a monitor pulse whose height identified the beam as first (2V) or second (1V); this was used to trigger the motor drive circuitry and to turn on a small red light set into the PDR. The rung stopped moving when it reached a small optosensor which switched off power to the motor and generated a second monitor pulse at the end of its upwards movement; because of the gearing involved, when the motor stopped abruptly so did the rung. Figure 1B-G shows for each PDR averaged data obtained from five sequential rung movements. Although every effort was made to match the two mechanisms, one was a little faster than the other (130 and 150 ms to move 6 cm up).
The rung was driven to a new position either 3 cm (taking around 80 or 100 ms) or 6 cm up from the level of the walkway, necessitating a locomotor modification by the cat to step up by the same amount on arrival. Typically, with rung movement triggered by interruption of the second IR beam, two steps away from the PDR, arrival at the displaced rung occurred 0.5–1 s after the end of its movement, so that there was a sizeable interval between the rung's movement (and the visual stimulus which this provided) and any subsequent modification of stepping (such as altered limb trajectories) to step onto (and then off) the displaced rung. The importance of the mechanism is that it provides a visual stimulus relevant to and requiring adjustment of the cat's visually guided stepping. Its effects upon neuronal discharges were compared with the effect of a briefer but more intense visual stimulus that was behaviourally irrelevant in the sense that it required no movement response. This was provided by a full-field flash of light (from a photic stimulator, duration 8 μs) delivered at irregular intervals by back-projection onto an opaque Perspex window 16 cm in diameter set into a rest platform, on which morsels of fish reward were deposited by the experimenter. Since the cat typically spent 10–20 s on the rest platform, trials of flash stimulation accumulated much more rapidly than encounters with the PDRs, and correspondingly larger numbers of cells were tested. Flash stimulation, in addition to providing a useful comparison, therefore represented a quick and easy way of probing for visual responsiveness of the lateral cerebellar neurones (cf. Marple-Horvat & Stein, 1990). No startle movements in response to the flash were seen.
A digital recording was made of the sound of the PDR in operation. No sound could be detected during the first 20 ms after triggering the drive electronics and the audio signal did not rise appreciably above background noise until about 30 ms (at which time the rung had moved 0.9 mm). It is therefore extremely unlikely that any auditory cue was available to the cat before (or at the same time as) movement was detectable by sight, particularly since a visual signal of rung movement onset was provided via the PDR light which turned on the instant that the drive electronics was triggered and power was fed to the motor. Moreover, we were unable to detect any sound associated with flash stimulation (using a microphone placed at a similar location to the ears of the cat as it stood on the rest platform) because the photic stimulator was enclosed in a muffled box, and the manual switch to trigger each flash was remote from the cat (about 2 m away, with an intervening partition). Flash stimulation was therefore, as far as we can tell, silent. Note also that, due to incomplete de-bouncing, a single switch press occasionally delivered two flashes very close together and flash responsive cells always responded to these paired visual stimuli with paired responses, despite the fact that only a single auditory stimulus would have been available.
The cats were trained to sit quietly at a second rest platform while a careful search was made to localize for the cell under investigation a peripheral receptive field for somatic afferent inputs generated by manually delivered stimuli such as brushing of hairs, skin taps, palpation of muscles and passive movement of joints.
Surgery and terminal experiment
Four cats were prepared for chronic single unit recording. Surgical procedures have been described in full in several preceding reports (Armstrong & Edgley, 1984; Marple-Horvat, Amos, Armstrong & Criado, 1993). In brief, at an initial aseptic operation under full general anaesthesia (sodium pentobarbitone, 40 mg kg−1) a titanium chamber was placed over a craniotomy which exposed part of the left cerebellar hemisphere, including lobulus simplex and crus I of the ansiform lobule. A burr hole permitted a bipolar stimulating electrode to be advanced under stereotaxic guidance into contralateral (right) brachium conjunctivum (Horsley-Clarke co-ordinates AP +2, DV +6, ML R2). Keyhole slots were drilled to gain access to the frontal sinuses and electro-oculography (EOG) electrodes positioned on the bony orbital surface. Leads were routed subcutaneously down each forelimb to permit recording of triceps brachii EMG and a ‘contact’ signal present on the rungs and rest platforms. A T-bolt provided additional anchorage to the skull and served as an indifferent connection. The frontal sinuses were filled with dental acrylic, and a headpiece fashioned so as to incorporate the cerebellar chamber, and terminal connectors for EOG, EMG and contact signals, stimulating electrode, earth and indifferent. Analgesic (Temgesic, 30 μg) was provided throughout a 24 h recovery period.
Following a period of productive single unit recording (between 5 and 9 weeks) each cat was killed (general anaesthesia induced by i.p. sodium pentobarbitone, 40 mg kg−1, followed by intracardiac injection of a further 180 mg). The cerebellum was removed and fixed in neutral buffered formalin and frozen-sectioned in the sagittal (3 cases) or coronal (1 case) plane; section thickness was 50 or 100 μm and sections were collected serially, mounted and stained with thionin. In each case an area of thickening of the pia mater was found centred ca 7 mm from the mid-line and overlying lobules VI and VII behind the fissura prima. Microelectrode tracks were seen (as thin lines of gliosis) extending from this area to the region of the deep nuclei. Most tracks appeared to intersect, at depths of around 7 mm, with the dorsal border of nucleus lateralis at middle to medial medio-lateral levels, but a smaller number entered nucleus interpositus posterior.
Identification of cortical and nuclear discharges
Neuronal recordings were categorized as cortical or nuclear using several pieces of information: (1) presence of complex spikes in the single unit recording or nearby (without an intervening white matter gap); (2) depth beneath cerebellar surface at which the recording was obtained - depths of less than 5 mm were considered too superficial to be nuclear; (3) presence of a substantial white matter gap dorsal to the recording site (followed by absence of complex spikes in neuronal activity); (4) antidromic excitation (i.e. antidromic spike) of nuclear neurones using a bipolar stimulating electrode in brachium conjunctivum, or presence of a substantial antidromic field when tested after loss of unit. Antidromic field or spike supported classification as nuclear of 5/10 flash responsive cells, 3/6 PDR responders and 3/4 saccade-related cells. Division into cortical and nuclear using these several sources of information (some clearly more conclusive than others) rarely presented any difficulty.
In addition to Purkinje cells for which complex spikes were evident, twenty visually responsive cortical cells were categorized as Purkinje cells using features of their interspike interval (ISI) distribution (cf. Armstrong & Rawson, 1979) assessed both at the time of recording the raw spike train (triggering the oscilloscope off spikes to see the minimum interspike interval, which was noted) and following generation of ISI histograms. For eighteen of these cells the minimum interspike interval was less than 5 ms (peak frequency exceeded 200 impulses s−1). The ISI histogram peaked at an interval less than 25 ms. The distribution of interspike intervals was fairly wide, indicating that the discharge was irregular, and always skewed with a more or less pronounced long tail to longer intervals (positively skewed). Mean discharge rate for these cells with the cat sitting eating was 38 impulses s−1.
Analysis
A hundred and sixty-six lateral cerebellar neurones were included in this study. The discharge patterns of 120 of these were analysed in relation to the step cycle so as to characterize step-related rhythmicity and permit its subtraction from other factors affecting neuronal activity. Real time discharge histograms (bin width, 5 ms) were constructed around the moment of footfall (stance onset) and/or onset of triceps brachii EMG activity (typically 40 ms earlier) for steps onto normal rungs around the ladder. To facilitate comparison with previous studies, neuronal activity was also represented at the lower resolution of tenths or twentieths of a step cycle (ca 70 and 35 ms, respectively); activity was considered to be rhythmically modulated in relation to stepping if the discharge rate in any tenth or twentieth fell outside the range mean ± 10% and mean ± 14.1%, respectively (these being equivalent criteria for depth of modulation at these two temporal resolutions).
Peri-event discharge histograms were also constructed around: (1) onset of rung movement, (2) footfall onto the displaced rung, (3) delivery of a flash stimulus, and (4) spontaneous saccades made while the cat was on the rest platform (i.e. not walking). In all cases bin width was 5 ms. Large numbers of flash stimuli and saccades were rapidly accumulated, PDR encounters more slowly. If there was no apparent modulation of neuronal discharge, the cell was not considered to have been adequately tested (and was designated as ‘not tested’) unless twenty or more trials were completed. When no response was evident in the average of twenty or more trials, the cell was categorized as ‘not responsive’. When there was an apparent modulation, this was tested statistically regardless of the number of trials included since the statistic alone was conclusive confirmation of a positive result. The criterion for significant modulation was set at a discharge frequency (in at least two successive 5 ms bins) more than 2 standard deviations above or below the mean level of discharge in a 200 ms (40 bins) ‘control’ period immediately prior to the visual event or saccade onset. Onset latency was calculated to the leading edge of the first significant bin.
A hundred and twelve cells were adequately tested for visual responsiveness (the remaining 54 were only recorded for long enough to test for locomotor or saccade-related activity). A significant modulation of activity by a visual stimulus was described in terms of latency to onset and peak, and duration (leading edge of first significant bin to trailing edge of last significant bin), peak frequency change from mean level in control period, and additional or lost spikes per trial (for facilitation and depression of firing rate). If the firing of a neurone was rhythmically modulated in relation to the step cycle, these values were computed for the visual stimulus of rung movement, encountered whilst stepping, both with and without prior subtraction of step-related rhythmicity (see Marple-Horvat et al. 1993).
Once these statistical measures had been obtained for individual discharge histograms/neurones, pooled statistics for neuronal responses of the same type were calculated (e.g. mean onset latency of all twenty-seven cortical flash responsive neurones; or mean additional spikes per trial for all twenty cortical cells that responded to flash with increased discharge). As an alternative to this combining of individual statistics, the individual histograms could themselves be combined to produce a single response profile reflecting the activity of all the neurones in the group (e.g. the combined cortical response to flash); all the statistics that had been obtained from the individual histograms (onset/offset latency, etc.) could also be calculated for the combined profile.
Both of these procedures were an attempt to obtain an overview from the individual single unit histograms, and produced complementary descriptions. However, differences can arise from the two ways of proceeding. In particular, taking for example the twenty cortical cells that showed facilitatory responses to flash, the twenty individual values of peak frequency change obtained for these twenty individual cells are unaffected by any differences in timing of the additional activity between cells; whereas even small timing differences (say 10 ms) result in a ‘blurred’, broadened and reduced peak frequency in the combined response profile, i.e. a lower estimate of frequency change for the same twenty cells when this statistic is calculated from the combined profile. Such discrepancies (where they arise) are accounted for in the text.
Saccade-related modulation was described in terms of interval between onset of modulation and saccade onset, interval between peak modulation and saccade onset, and interval between end of modulation and end of saccade; also duration of modulation and of saccade, peak frequency change and increase in the number of spikes per saccade - all of these being measured in the average discharge histograms and average saccade profile (i.e. mean values). Some cells were subjected to additional trial by trial regression analysis of spikes per saccade vs. saccade amplitude or duration. Because of the difficulty of obtaining accurate calibration in freely moving animals (absence of head restraint) saccade amplitude was estimated from saccade duration using the linear amplitude- duration relationship identified by Blakemore & Donaghy (1980) for head-free saccades ranging from 10 to 15 deg in amplitude (60 and 70 ms duration, respectively). The large numbers of saccades included in the analysis of saccade-related neurones were identified automatically as described in Marple-Horvat, Gilbey & Hollands (1996), with visual inspection and editing to insert occasional saccades missed by the automated procedure.
RESULTS
Distribution of visually responsive neurones
Extracellular recordings were obtained from a total of 166 lateral cerebellar neurones. A hundred and twelve of these (72 cortical and 40 nuclear) were tested against one or both of the two visual stimuli, the full field flash of light or rung movement, and forty-five (40%) gave a short latency response to one or both stimuli. The approximate medio-lateral and rostro-caudal stereotaxic locations of visually responsive (filled circles) and unresponsive (open circles) cells are shown in Fig. 2A, calculated from the known co-ordinates of microelectrode penetration at the cerebellar surface, the orientation of the track and the depth at which the recording was obtained. Depth data for the responsive cells are shown separately in Fig. 2B. Of the seventy-two cortical cells, thirty-two were visually responsive (44%), as were thirteen of the forty nuclear cells (33%), a slightly lower proportion. Since these recordings were made in a freely moving animal, to avoid the possibility of mechanical stimulation of neurones by the microelectrode tip we did not attempt to maximize spike heights. Nine of the thirty-two visually responsive cortical neurones (28%) were identified by their spontaneous complex spikes as Purkinje cells. A further twenty (63%) were categorized as Purkinje cells on the basis of their interspike interval histograms (see Methods), and three (9%) cortical recordings could not be categorized. None of the recordings possessed the low frequency regular discharge pattern and distinctively broad action potentials that are typical of Golgi cells (Edgley & Lidierth, 1987).
Figure 2. Distribution of visually responsive and unresponsive cells.
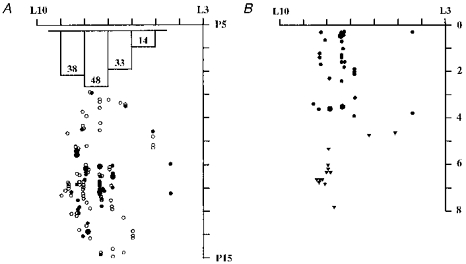
A, surface map of the stereotaxic locations of visually responsive (•) and unresponsive cells (○). The trend towards an increased proportion of visually responsive cells with increasing laterality is illustrated by the inset histogram: numbers indicate percentage visually responsive in each 1 mm wide strip between L5 and L9. Depth below the cerebellar surface at which each visually responsive unit was recorded is shown in B (mediolateral axis same as in A), with cortical cells indicated by • and nuclear cells by ▾. Large circles indicate 2 cells at the same location. Axes are labelled in Horsley-Clarke co-ordinates (ML and AP) and millimetres below the cerebellar surface (B).
The main finding is that about four-fifths of visually responsive neurones were more than 7 mm away from the mid-line, which means that the cortical cells were hemispheral (rather than paravermal) and the nuclear cells were within the lateral cerebellar nucleus (rather than the interpositus nucleus). The mediolateral distributions of responsive and unresponsive neurones, though overlapping, were different, with an increasing proportion of visually responsive cells seen with increasing laterality up to 8 mm, and the reverse trend for non-responsive cells. This is illustrated in Fig. 2A (inset), which shows the percentage of tested cells that proved responsive, calculated for each 1 mm sagittal cerebellar ‘slice’ that was sampled.
The depth of each visually responsive cell below the cerebellar surface is shown in Fig. 2B, which reveals that the deepest cortical unit was only 4 mm below the surface and most (23/32; 70%) were only 2.5 mm deep or less. At such depths it is most improbable that the microelectrodes could have deviated significantly. All visually responsive nuclear neurones were deeper than any of the cortical units. Eight of the ten flash responsive nuclear cells were recorded within the top 1 mm of dentate, as were three of six cells responsive to rung movement.
The implications of the locations at which visually responsive cells were encountered are dealt with in Discussion.
Visual responses to flash
Though our primary interest was in responses to visual stimuli that were behaviourally significant in a locomotor context, nevertheless responsiveness to flash was routinely tested for three reasons. Firstly it permitted comparison with earlier studies in which it was used (see Discussion); secondly it yielded estimates of the number and proportion of cells likely to be PDR responsive if tested for that; and thirdly, as a pulse input, it could reveal the individual and collective impulse response of cerebellar neurones.
A hundred and three cells, seventy cortical and thirty-three nuclear, were tested against flash. Of these, thirty-seven (36%) modified their discharge, among which twenty-seven were cortical (39% of those tested) and ten were nuclear (30% of nuclear cells tested).
A clear, strong complex spike (CS) response to flash illumination was never identified (not a particularly surprising result in view of the fact that none of the visually responsive olivary cells are known to project to the cortical regions we explored), and only on one occasion was any complex spike modulation (a weak though statistically significant increase in firing probability) detected. It occurred in conjunction with a clear simple spike modulation (a depression of the simple spike train). Note, however, that the paucity of CS responses was largely attributable to the difficulty of reliably separating complex and simple spikes over sufficiently long periods.
When recording both simple and complex spikes together, we could seldom distinguish between the two with absolute reliability for long enough to test for visual responsiveness. Since even a few contaminating visually evoked simple spikes could be very misleading, we erred on the side of caution.
Response types
There was some variation in the responses of the twenty-seven different neurones making up our cortical sample, which fell into one of two broad categories. Nineteen (70%) simply increased their discharge, and one other gave a biphasic response in which the main modulation was an increase. Six cells (22%) showed a straightforward depression of their discharge, and one other a complex response in which the main feature was suppression. The mean onset latency, time to peak modulation, and duration of these visual responses are given in Table 1. Figure 3A-E shows four representative cortical responses one of which - the simple spike depression in D - was accompanied by the weak increase in complex spike discharge rate referred to above and shown in E.
Table 1.
Cortical and nuclear response characteristics to flash and PDR stimuli and statistical comparison using Student's unpaired t test
| Onset latency (ms) | Peak latency (ms) | Duration (ms) | Duration increase (ms) | Peak frequency change (impulses s−1) | Spikes per encounter | |
|---|---|---|---|---|---|---|
| Flash cortical | 38 ± 16 | 51 ± 18 | 50 ± 37 | 37 ± 25 | 53 ± 26 | 1.6 ± 1.8 |
| Flash nuclear | 27 ± 21 | 34 ± 22 | 37 ± 37 | 16 ± 7 | 49 ± 21 | 0.6 ± 0.5 |
| PDR cortical | 54 ± 37 | 80 ± 36 | 56 ± 36 | 62 ± 39 | 125 ± 61 | 4.9 ± 3.7 |
| PDR nuclear | 61 ± 15 | 73 ± 8 | 53 ± 32 | 33 ± 17 | 103 ± 37 | 2.5 ± 1.4 |
| Response comparison | Onset | Peak | Duration | Duration increase | Peak frequency increase | Additional spikes |
|---|---|---|---|---|---|---|
| Flash cortical vs. flash nuclear | 0.1 | 0.05* | n.s. | 0.05* | n.s. | n.s. |
| Flash cortical vs. PDR cortical | 0.1 | 0.01** | n.s. | 0.1 | 0.001*** | 0.01** |
| Flash nuclear vs. PDR nuclear | 0.01** | 0.01** | n.s. | 0.05* | 0.05* | 0.05* |
| PDR cortical vs. PDR nuclear | n.s. | n.s. | n.s. | n.s. | n.s. | n.s. |
Summary of results of statistical comparisons. Level of significance is shown (P < tabulated value) and indicated; n.s., not significantly different; unaccompanied values are weakly or marginally significant
significant
highly significant
very highly significant. Note that column headed ‘duration’ is from first to last significant bin, so for a biphasic response would span both an initial excitation and a late depression. Column headed ‘duration increase’ refers to the width of just the initial excitation (when present).
Figure 3. Representative examples of cortical (left) and nuclear (right) responses to flash.

Two Purkinje cells exhibited a monophasic increase in firing rate (A and B), one a biphasic response (C) and one a straightforward suppression of its simple spike discharge (D) in conjunction with a weak increased complex spike discharge rate (E). Note that A and B represent by far the most common response profile. The average discharge histograms are composed of the following number of trials: 49, 58, 132, 532 and 509 for A-E, respectively. In each case bin width is 5 ms, and the flash was delivered at time zero. Four dentate neurones exhibited short latency accelerated discharge rate. This modulation was powerful in some cases (F and G) and weaker in other cases (H and I) but was always short-lived, and by about 50 ms post-stimulus discharge rate had returned to pre-stimulus level (G) or had been converted into a depression of activity below this level (F and H-J). In one instance (J) only this later depression is visible (without a preceding increase). The average discharge histograms are composed of the following number of trials: 112, 43, 58, 67 and 40 for F-J, respectively. Bin width is 5 ms, and flash was delivered at time zero.
Nuclear responses (n = 10) were similar in that the initial modulation was usually an increase in firing rate (8 cells), powerful in some cases (Fig. 3F and G) and weaker in others (H and I). Importantly, this was always short lived and was rapidly converted to a depression of discharge (3 cells) or return to pre-stimulus levels (5 cells). There were two instances of straightforward depression (see Fig. 3J). For both nuclear and cortical cells, therefore, the majority of cells (74% cortical, 80% nuclear) had as their main, only or initial feature an increased frequency of discharge. But whereas a minority (26%) of cortical neurones had as their main or only feature a depression of their discharge rate, half of the nuclear cells were either purely depressed (2 cells) or depressed following a brief excitation (3 cells).
Response durations
Onset latencies, latency of maximum modulation, and response durations are given in Table 1. Both onset and peak latencies were significantly shorter for nuclear cells than for cortical; so too was duration of any nuclear excitation (see Table 1). Note that the three nuclear cells which had as their only or main feature a depression of discharge rate contributed the three longest onset latencies, whereas the five cells that gave a purely excitatory response contributed the five shortest latencies (which results in the mean onset latency for all nuclear cells - 27 ms - being longer than the first visible increase at 10–15 ms in their ‘pooled’ activity profile - see below). This temporal separation suggests that excitatory and depressive influences did not arrive at nuclear cells via a common route. No such division was found for cortical cells. Furthermore, comparison of just the initial excitation, when present, highlights a second difference between cortical and nuclear response, with nuclear excitation lasting less than half as long.
Pooling
It has previously been noted (see Marple-Horvat & Stein, 1990; Marple-Horvat, 1995) in relation to neurones in the monkey cerebellum that the common features present among the visual responses of individual cerebellar cortical cells often result in the combined discharge pattern, produced by pooling or averaging individual histograms, representing a response that is as clear as, or even better than, that of any individual neurone to the flash stimulus. Thus the pooled response of the twenty-seven cortical recordings in Fig. 4A has a signal-to-noise ratio that is better than all except the very best of the individual histograms from which it is composed. The same is also true of the ten nuclear responses, shown pooled below the combined cortical response in Fig. 4B. The clear difference between the combined cortical and combined nuclear response profiles is significant: to aid comparison, vertical dashed lines indicating onset, peak and offset of the cortical response are shown over both profiles. It is evident that following the initial excitation (presumably generated by mossy fibre collaterals; Shinoda, Sugiuchi, Futami & Izawa, 1992) the onset of the depressive phase of the change in nuclear cell output coincides with the time of maximum cortical output. Because the corticonuclear projection is inhibitory (Ito, Yoshida, Obata, Kawai & Udo, 1970), an economical explanation of the different response profiles is that the increased inhibitory Purkinje cell output cuts short the excitatory nuclear response so that the extra nuclear spikes are fewer. Indeed, using the combined nuclear response (rather than extra or lost spikes calculated for each of the ten cells individually using the ten individual histograms), the excitatory phase yields a mean of an extra 0.45 spikes per stimulus, and the inhibitory phase a loss of 0.2 spikes so that overall the net change in nuclear output amounts to only an additional 0.25 spikes per trial.
Figure 4. Combined cortical and combined nuclear responses to flash.

The pooled discharge histogram of all (27) cortical cells whose activity was affected by flash stimulation is shown in A, and the pooled discharge histogram of all (10) nuclear cells in B. The onset of depression of nuclear cell output coincides with the maximum excitation of cortical output.
It is harder to account for the 20 ms lead in nuclear excitation over cortical. It might admittedly arise from some ‘non-correspondence’ between the nuclear and cortical samples; evidence for correspondence is considered in Discussion.
Peak frequency change for cortical cells whose discharge rate increased (mean of 20 cells) was not significantly different from the corresponding figure for nuclear cells (mean of 7). The number of additional spikes evoked by each flash - 1.6 for cortical and 0.6 for nuclear cells on average - also failed to reach significance, despite the former being more than twice the latter.
The brevity of these responses combined with the highly significant peak frequency changes (mean z score of 7.5 for cortical cells that increased their discharge, and 5.9 for nuclear cells) means that at the level of individual neurones (before any combination that might occur due to convergence in the corticonuclear projection) they are a clear signal of the visual event clearly defined in time. The most temporally accurate representation of such an instantaneous (8 μs) stimulus would be provided by a single additional (or lost) spike following each flash with a highly consistent latency, sharply time locked to that stimulus. This might suggest why the mean of sample statistic for extra spikes in both cortical and nuclear responses is not far from unity.
Visual responses to rung movement during stepping
Sixteen of the twenty-five cells tested (64%) responded to rung movement. Ten of these were cortical, of thirteen tested (77%); six were nuclear, of twelve tested (50%). We identified in one recording a complex spike response. This was the same cell that showed a simple spike modulation together with a weak complex spike response to flash; it was recorded 7.9 mm from the mid-line (and 3.6 mm below the cerebellar surface in the 3rd P cell layer encountered). It presumably therefore lay in one of the D zones. This was the only cell with clearly separable complex and simple spikes that was recorded for more than twenty encounters with the predisplaceable rung (over a period of 38 min).
Response characteristics
Responses to rung movement fell into the same two categories as responses to flash, and in similar proportions. Of the ten cortical cells, eight responded with increased discharge, and two examples are shown in Fig. 5A and B. Two exhibited depression of activity and there were no biphasic modulations. Figure 5C shows the single complex spike response to rung movement that we observed (which was weak but statistically significant; 13 evoked complex spikes in 58 encounters, 0.22 spikes per trial). Four nuclear cells increased their discharge (see for example the cell of Fig. 5D), one showed a biphasic response in which the main feature was complete suppression (see Fig. 5E), and one other reduced its discharge rate.
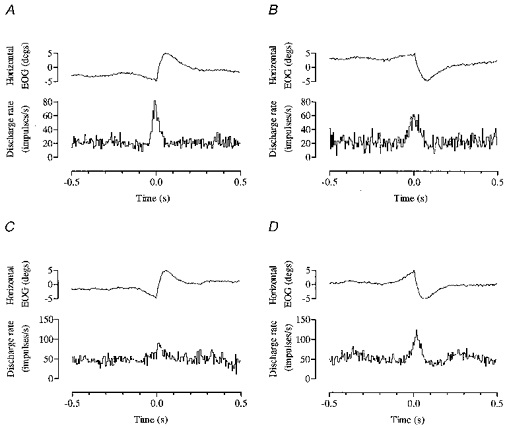
Figure 5. Cortical and nuclear visual responses to rung movement.

Cortical cells typically responded to rung movement with increased firing rate (A and B; note that A is a difference histogram from which step-related rhythmicity has been subtracted so as to show the isolated response to rung movement). One Purkinje cell increased its complex spike discharge rate (C). Nuclear cells responded similarly (D) though we also saw an example of complete suppression of activity following an early increase (E). The bar above each histogram indicates the interval over which the rung was moving (both rungs) and the stippled extension the additional duration of rung movement for the slower of the two mechanisms. A and E were 3 cm, and B-D 6 cm displacements. Number of trials: 6, 23, 58, 27 and 17 for A-E, respectively.
In terms of their timing (onset and peak latencies, and duration) and amplitude measures cortical and nuclear responses to rung movement are statistically indistinguishable (which was not the case for the cortical and nuclear responses to flash - see above).
Comparison with flash responses
The response to rung movement had (on average) a longer onset and peak latency than the flash response, for both cortical and nuclear cells. Nevertheless, dentate output began to change around 60 ms after the start of movement. All response statistics and the results of statistical comparison with flash responses are to be found in Table 1.
The very early (10–15 ms bin) onset of (brief) excitation of nuclear cells by flash is not seen in the nuclear response to rung movement. This probably reflects the fact that all of the power in the flash stimulus is concentrated into a near instantaneous (8 μs) pulse which is signalled along the fastest pathways; whereas rung movement develops gradually with the power of this stimulus spread throughout its duration with bias towards its later stages when the rung is moving fastest (only the cue light coming on represents an initial ‘instantaneous’ component to the stimulus - and it was very much less intense than the flash).
Responses to rung movement were on average of longer duration than those to flash, though differences in duration of the complete modulation (i.e. including all phases of a polyphasic response) were not statistically significant. Duration of the initial excitation alone was significantly different. Both the cortical and nuclear excitations provoked by rung movement significantly outlasted the corresponding excitations elicited by flash (Table 1, column 4), presumably because rung movement constituted a longer excitatory stimulus, taking 80–100 or 130–150 ms for 3 or 6 cm displacement, respectively. The difference in duration between response to flash and to rung movement is greater for nuclear than cortical neurones (because the nuclear excitation by flash is briefer; see previous Results section).
The responses to rung movement were larger, on average, than the responses to flash; peak frequency change was more than twice as large for both cortical and nuclear cells whose discharge rate increased (Table 1, column 5). The number of extra spikes per encounter was three times larger for cortical cells, and four times larger for nuclear cells (Table 1, column 6). The same was true of responses that were a depression of ongoing activity. For both cortical and nuclear cells, reduction in firing rate was more severe, and more spikes were lost per encounter with the PDR than the flash.
In summary then, the evoked excitatory response to rung movement lasted longer than the response to flash, and there was more of it. Rung movement was therefore the more potent excitatory stimulus, despite the fact that the flash was more intense - much brighter and full field. Furthermore the proportion of cells tested and responsive to rung movement was higher at 64%, compared with 36% responsive to flash. These findings may reflect the fact that rung movement was a longer duration stimulus, but a second factor in favour of the rung as stimulus is probably that it was behaviourally relevant, requiring altered stepping (see Discussion).
Responses and the step cycle
An important observation is that the response to rung movement was indifferent to its timing in relation to the step cycle of either forelimb, despite the fact that many of the cells that gave a short latency response to rung movement had an identifiable mechanosensitive receptive field (see Methods) on the ipsilateral forelimb, and were rhythmic in relation to stepping. Thus, the response was always the same (9/9 cells tested; 5 cortical, 4 nuclear) regardless of which forelimb interrupted the infra-red beam, i.e. whether a particular forelimb was in late swing or mid stance (half a step cycle or 180 deg phase difference).
Figure 6A and B shows average discharge histograms for PDR encounters in which rung movement was triggered (at time zero) by the left and right forelimb, respectively. There is no evident difference between the responses to rung movement, and this is borne out by statistics which compare the responses to the discharge in the 200 ms period immediately preceding rung movement; peak frequency change is 179 and 194 impulses s−1, for left and right encounters, and additional spikes were 9.4 and 8.2 spikes per trial. The step-related rhythmicity of this cortical cell has not been subtracted in Fig. 6A and B, but is rather ill-defined because of the fairly low numbers of steps involved (13 and 9, respectively). We have therefore superimposed (dotted) values obtained by averaging all control steps around the ladder which show the underlying trend of step-related rhythmicity more clearly.
Figure 6. Indifference of the response to rung movement to the phase of the step cycle in which it occurred.
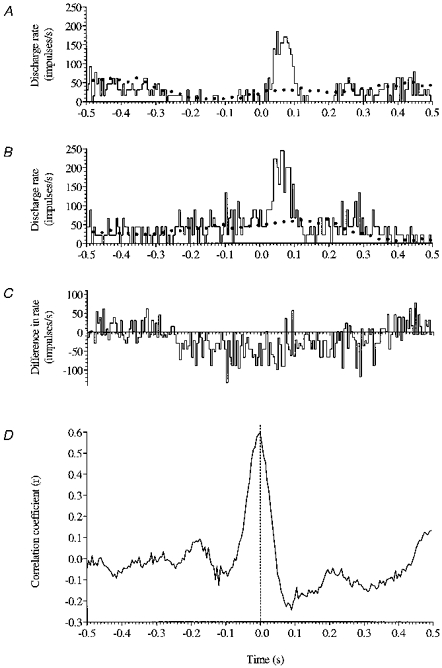
A and B show equivalent short latency responses to rung movement (commencing at time zero) when it was triggered by either limb (i.e. 180 deg apart in the step cycle), and this is confirmed by subtraction of B from A to produce the difference histogram C in which the similar PDR responses have cancelled out. The cross correlogram D which peaks at time zero indicates that the PDR responses in A and B are aligned (i.e. no difference in latency). Dotted lines in A and B indicate usual step-related rhythmicity.
Figure 6C is the difference histogram produced by subtracting Fig. 6B from A in which it is apparent that the highly similar PDR responses visible in A and B have effectively cancelled, leaving only the cyclical drift that arises from subtraction of the out-of-phase step-related rhythmicity; no feature in the interval 0–200 ms from start of rung movement is statistically significant compared with the immediately preceding control period. Finally, cross correlation of Fig. 6A and B produces the cross correlogram Fig. 6D whose peak at time zero indicates that the dominant features of Fig. 6A and B, the PDR response in each case, are aligned. In both amount and timing, PDR responses generated 180 deg out of phase as regards the step cycle of a particular forelimb are therefore equivalent.
How widespread are responses to rung movement?
Four times as many cells were tested against flash as against rung movement (103 and 25, respectively, because of speed in accumulating trials). Eighty-seven cells were tested only against flash, nine only against the PDR and sixteen against both. The subsample of sixteen that were tested against both is particularly informative. All of these cells that were responsive to flash (n = 8) were also responsive to rung movement. An additional four cells were responsive to rung movement alone - and the PDR responses of these four were similar to those of the eight that also responded to flash. So only two-thirds (8/12) of cells responsive to rung movement were also driven by flash. Of the eight cells that were tested against and responsive to both, five responded in the same way (with excitation) to flash and rung movement, and six gave a larger response to rung movement. Latency to rung movement was longer for six cells, by 26 ms on average (of all 8).
The findings for this subset of sixteen cells - whose flash responses were typical in nature, and which could only be differentiated from the rest in that they were recorded for longer - therefore confirm the general finding that rung movement was the more potent stimulus. Furthermore, since all cells responsive to flash and tested against both also proved to be responsive to rung movement, the prediction is firstly that all thirty-seven cells we found to be responsive to flash would have responded to rung movement if adequately tested; and secondly that at least 36% of cells (the percentage responsive to flash) would respond to rung movement. Indeed, because only 2/3 of rung responders were also flash responders it is predicted that 3/2 × 36 = 54% of cells in all would be rung responsive, a prediction that is in good agreement with the 16/25 = 64% rung responsive cells among those actually PDR tested.
Context dependency of visual responsiveness
Rung movement was not in itself an intense visual stimulus; it swept vertically through only 9 or 6 deg of visual field when two or three steps away, respectively (and the 20 cm wide rung subtended 28 or 19 deg of horizontal visual field at these distances) but it did demand a subsequent behavioural response to modify ongoing stepping. And crucially, we could make the rung move when the cat was either two or three steps away (as explained in Methods), which represents a different context during stepping. In this way we could investigate any context dependency in the short latency visual responses to its movement. In all cells for which sufficient trials were available (see Methods) to permit adequate comparison (3/3) response latencies were very similar whether the cat was two or three steps away from the rung; but, by contrast, there was a marked difference in response size. Figures 7 and 8 illustrate the best two examples, one cortical and one nuclear.
Figure 7. A cortical example of context dependency in visual responsiveness.

A, the response of the cell to rung movement when the cat was two steps away; B, the response of the same cell when the cat was further away (three steps). The difference between the two (A - B) is plotted in C. Discharge histograms A and B are composed of 23 and 15 trials, respectively.
Figure 8. Context dependency in a dentate neurone, which again yielded a significantly larger response to rung movement when the cat was closer than further away.

A and B are composed of 27 and 23 trials respectively. Bin width is 5 ms. Bars indicate duration of rung movement, which commenced at time zero. C is the difference histogram (A - B).
Figure 7A shows the response of the cortical cell to rung movement when the cat was only two steps (40 cm) away. Latency to onset and peak modulation were 30 and 45 ms, respectively. Duration of the response was 80 ms. Peak frequency change was 176 impulses s−1, representing an eightfold increase over the mean discharge rate during stepping, and the cell fired an additional 9.1 spikes per encounter on average. The response of the same cell to rung movement when the cat was further away, three steps (60 cm), is shown in Fig. 7B. Latency to modulation onset and peak, and duration of the response were all very similar; but strength of modulation was markedly reduced with a peak frequency change of 134 impulses s−1 (a sixfold increase in discharge rate) and an additional 6.2 spikes per encounter. Figure 7C is the difference histogram obtained by subtracting Fig. 7B from A to highlight the difference between the two, and shows a surplus in the period 25–95 ms from start of rung movement, reflecting the larger response to rung movement when the cat was closer, amounting to 3 more spikes per encounter. The usual statistics applied to the difference histogram showed that the difference plot exceeded the mean + 2 s.d. criterion over the period 40–85 ms from the start of rung movement.
This cell also responded with a similar latency (45 ms to peak) but less strongly, with a peak frequency change of 81 impulses s−1 and much more briefly (duration 45 ms, amounting to 1.9 additional spikes per trial) to flash stimulation.
Figure 8A-C shows the corresponding histograms for a dentate neurone that similarly yielded a significantly larger response to rung movement when the cat was closer (Fig. 8A) than further (Fig. 8B) away, Fig. 8C being the difference. Peak frequency change was greater at 161 impulses s−1 when closer than when further away (123 impulses s−1). This time the difference amounted to 1.2 spikes per encounter (4.5 additional spikes when two steps away vs. 3.3 spikes when three steps away).
Differences in the arrival step at the displaced rung
From our contact signal, which yielded the time of the stance and swing phases, and triceps EMG, which exemplified extensor muscle activity in the step cycle, we could identify clear but sometimes subtle differences between the arrival step and others around the ladder. Thus the swing up to a raised rung took typically around 50 ms (25%) longer than for other steps; and stance on the elevated rung as the cat's body and the other forelimb passed over it was usually around 100 ms (again ca 25%) longer. The initial rise in triceps EMG seen in the E1 phase of the step (late swing) as the extending limb brings the paw into contact with support was usually reduced, perhaps because triceps was less actively contracting and more passively extending to permit the greater flexion at the elbow required to place the paw on the elevated rung. This reduction in triceps EMG sometimes continued in early stance (the first 100 ms or so), whereas sometimes there was no significant difference at this time; but without exception greater activity developed beyond this point, so that in mid stance greater extensor effort was evident when negotiating the raised rung; and the increase in stance duration meant that triceps activity continued in arrival steps beyond the point at which the limb was moving into swing on control steps, when triceps activity would cease. A late surplus in triceps EMG was always seen for this reason. These several differences in the arrival step as compared to others around the ladder are illustrated in Fig. 9.
Figure 9. Differences in the step onto the displaced rung compared to others around the ladder.

A and B, triceps EMG activity averaged over the ‘arrival’ step onto the PDR and normal steps around the ladder, respectively, the difference between these (A - B) being illustrated in C. D, another example (on a different day) of difference in triceps activity. The discharge of a neurone during the step onto the displaced rung (E, centre) is different from its usual discharge related to control steps (shown in G). H is a difference histogram produced by subtracting G from E. Note that contact signal F shows that the swing phase of the step onto the displaced rung (indicated by low level of the contact signal), and the subsequent stance phase (high level signal) are both usually longer than for control steps - compare the contact signal F for the arrival step (continuous line) which remains high longer than the overlaid contact signal for other steps around the ladder (dashed line). Note the plateau voltage used to identify contact with a rung was 3 times higher for the PDR to distinguish it from others around the ladder, and hence the central portion of the contact signal in F which was generated by the PDR (continuous line) is 3 times higher than the overlaid (dashed) contact signal derived from other rungs.
Given so many differences in the two biological signals we were monitoring (footfall timings and triceps EMG), it is clear that many aspects of the arrival step were either overtly or subtly different from ‘control’ steps with which comparison could be made. Any neurone whose activity was powerfully modulated in tight relationship to the phases of the step cycle would consequently show clear differences in its activity (reflecting these differences in step cycle timing and muscle activity patterns) in control compared with arrival steps.
An example is illustrated in Fig. 9E-H. The activity of this cell was strongly rhythmic during stepping; its discharge rate rose throughout swing to a maximum just before footfall, after which it declined in the first two-thirds of stance before falling back towards its minimum rate. Discharge during the arrival step on the displaced rung (Fig. 9E, centre) is visibly different from that in other (control) steps (Fig. 9G). Just as swing begins earlier for this step (see Fig. 9F), the rising phase of the cell's activity begins earlier than in control steps which results in the Fig. 9E-G difference plot of Fig. 9H, first in a surplus (in the first half of swing) and then a deficit because the peak late in swing is reduced and broadened. The longer stance on the raised rung is accompanied by neuronal activity which is also ‘stretched’ relative to control steps. This is perhaps the most obvious feature visible in Fig. 9E (compare centre and adjacent modulations), and results in a surplus in the difference plot (Fig. 9H). All of the arrival vs. control differences in the activity of this cell therefore reflect a maintained strong relationship to an altered step cycle.
Combined visual and motor-related activity in individual neurones
The context dependency described above and illustrated in Figs 7 and 8 amounts to a different response to the same event - the rung moved in exactly the same way regardless of the cat's whereabouts. Both the sensory context (visual angles subtended by the rung and its movement, which were greater when closer - see earlier under Context dependency of visual responsiveness) and the motor context (time available to modify the locomotor pattern) are different. Context dependency perhaps therefore represents an interaction between visual responsiveness and motor context, a sensori-motor property (see Discussion).
For eight of the sixteen cells that gave short latency visual responses to rung movement, enough encounters with the PDR were accumulated to permit comparison of the arrival step of the particular limb that was placed on the displaced rung with other control steps around the ladder. Four of these eight cells exhibited clear, strong rhythmicity in relation to the step cycle, and three of these four strongly rhythmic cells exhibited altered modulation related to the modified (arrival) step, and to subsequent adjustments involved in negotiating the displaced rung. The differences in their activity during the arrival step were explicable in terms of the behavioural differences outlined in the previous section; i.e. they were differences that would arise as a consequence of the neurones maintaining the same phase relationship to stepping in steps that were in certain respects different. The remaining rhythmic neurone had difference plots for discharge and behavioural measures that were not coherent (i.e. not clearly related to one another) but not flat.
Among the remaining four weakly or non-rhythmic cells, differences between arrival and other steps were visible in the discharge patterns of just two cells. The fact that the activity of these cells was not strongly rhythmic in relation to stepping perhaps suggests why the differences were less striking (or absent for the other two cells). Note that the arrival step swing and stance durations, and triceps activity, showed the same clear differences as identified (and described above) for the cases of strongly rhythmic neurones.
Since arrival at the rung was some time after it finished moving - about half a second at least - there was a clear gap between the early visual responses and the subsequent modification of limb trajectory and any accompanying motor-related modulation. Five of our recordings (of the 8 that could be tested) therefore showed both visual character and motor character at different times in this specific way. The activity of such cells correlated strongly with the visual stimulus and also with the change in motor output provoked by that stimulus, so that we consider such cells as having sensori-motor properties, indeed as being irreducibly sensorimotor. The cell of Fig. 10, for example, was powerfully modulated at short latency by rung movement (visual response in Fig. 10B) and its step-related rhythmicity, shown for control steps in Fig. 10D, was modified during ‘arrival’ steps, both in the first half of swing and during stance. This is shown by the arrival minus control difference histogram of Fig. 10F; comparison with the corresponding difference histogram for the triceps brachii EMG (Fig. 10E) shows that the modified neuronal and muscular activities span overlapping time frames encompassing the period over which the modified step was made.
Figure 10. Combined visual and motor-related activity in an individual neurone.
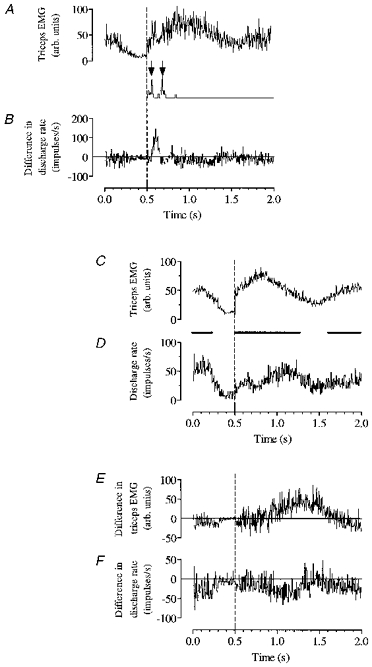
The early visual response to rung movement is shown top left (B) after subtraction of the cell's usual step-related rhythmicity (D). It is followed by a later difference from the usual step-related discharge (F) whose time course parallels the modified motor activity in forelimb extensors exemplified by altered triceps EMG (E) during negotiation of the raised rung. The difference in triceps EMG (E) has been produced by subtracting triceps EMG in control steps around the ladder (C) from triceps EMG in the step onto the PDR (not illustrated). All EMG and discharge histograms have been averaged around the onset of triceps EMG activity in the step (time 0.5 on all axes). C-F have been displaced rightwards relative to A and B by the appropriate amount to indicate the interval between footfall in the step that triggered rung movement, and footfall on the raised rung (ca 1 s in this case). The trace interposed between A and B indicates (arrowed) monitor pulses generated at start and end of rung movement. Bars between C and D indicate average stance duration.
More generally, thirty-one of the forty-five visually responsive neurones (either to flash or rung movement) were tested as regards locomotor rhythmicity, and among these were twenty-four (77%) whose discharges were rhythmically modulated (see Methods for criterion) in relation to the step cycle (note therefore that visual responses were not confined to locomotor-related cells). Also, among twenty-one visually responsive cells tested were four (19%) that also altered their discharge in advance of saccadic eye movements (see below); since they led or were coincident with the eye movement in at least one direction (sometimes lagging slightly in the reverse direction) and therefore modulated in at least one direction ahead of any visual reafference that would then arise, such modulations can be considered as oculomotor in that they relate to (and might help generate) movements of the eyes; an example is illustrated in Fig. 11A-D. These additional cells, both visually responsive and modulated in relation to motor activity of the eyes or limbs, are also sensori-motor, or more precisely visuo-motor.
Figure 11. Combined visual and saccade-related activity in an individual neurone.

The Purkinje cell illustrated was modulated by visual stimuli (flash and looming, A and B) and at the time of saccades (C and D; saccade onset at time zero). Continuous and stippled bar in B indicates minimum and maximum duration of looming stimulus.
In summary, we have identified a ‘grand total’ of thirty ‘visuomotor cells’, twenty-four of which were visually responsive and rhythmic during stepping (including 3 which showed different activity on arrival at the displaced rung), four of which were visually responsive and saccade related, and two of which were visually responsive and showed different activity on arrival at the PDR (without being rhythmic during stepping).
Visual responses to looming or sweeping visual stimuli
As many as possible of the 166 cerebellar neurones we recorded were investigated by close observation and passive manipulation of the cat (see Methods) to determine whether they had an identifiable somatic afferent peripheral receptive field (for example in the forelimbs) or were modulated in relation to behaviour other than walking or the visual stimuli routinely delivered.
Some were clearly affected by objects of interest (such as a hand holding a piece of fish) moved around in front of the cat. With care it was often possible to detect modulation of firing rate by such moving visual targets in the absence of any overt movement (of the eyes, head, limbs) by the animal (though we cannot exclude the possibility of isometric changes in muscle tension as a hidden form of motor activity).
An example is shown in Fig. 11B of a Purkinje cell whose ongoing discharge was much reduced by a looming visual stimulus. In this case a hand was repeatedly moved towards and away from the cat's face, at different start and finish distances. We saw several such examples of responsiveness to looming or sweeping stimuli in cells that we already knew to be modulated by flash or rung movement. The cell of Fig. 11B, for example, was modulated less strongly, again with a depression of its simple spike discharge, in response to flash (illustrated in Fig. 11A), and gave a complex spike response to rung movement.
Neuronal activity in advance of saccadic eye movements
Horizontal electro-oculograms were recorded from three of the four cats. Large numbers of spontaneous saccades were made as the cat searched for and ate fish pieces placed on the rest platforms, and their horizontal components were measured. Twenty cells of eighty-four recorded (24%) modulated their activity in advance of saccades. Sixteen of these were cortical (of 51 tested, 31%) and four were nuclear (of 33 tested, 12%). Two examples (1 cortical and 1 nuclear) are illustrated in Fig. 12.
Figure 12. Saccade-related neuronal activity.
Two cells (one cortical, one nuclear) illustrate increased discharge rates seen preceding and during saccadic eye movements. Both cells exhibit non-reciprocal directional selectivity, one modulated more powerfully for leftwards saccades (cell of A and B) and one for rightwards (cell of C and D). Onset of saccade is at time zero. Bin width is 5 ms.
With the exception of one Purkinje cell and one nuclear cell, all saccade-related modulations were an increase in discharge rate. Reciprocal directional selectivity was never found, but sixteen of the cells (80%) were non-reciprocally directionally selective. They exhibited a preference in terms of depth of modulation and additional spikes per saccade for one of the two directions measurable; nine preferred leftwards saccades (including 5 unaffected during rightwards saccades); and seven preferred rightwards saccades (including 5 that were unrelated to leftwards saccades). The remaining four cells (20%) modulated similarly for both directions, though one exhibited a timing difference. So although most individual neurones showed a preference for one of the two directions, the fact that roughly equal numbers preferred each direction means that the total amount of saccade-related neural output from cerebellar cortex as measurable in this sample (nuclear cells were too few for comment) is likely to be the same for both leftwards and rightwards saccades, albeit provided by two different subpopulations of neurones.
This was confirmed by pooling the discharge histograms of all cortical cells that modulated their activity during leftwards saccades, and separately pooling histograms relating to rightwards saccades. The resulting combined responses, shown in Fig. 13A and B were compared by subtraction (leftwards minus rightwards) to produce the difference plot (Fig. 13C). At no point do two adjacent bins exceed the 2 s.d. criterion for significance.
Figure 13. Combined saccade-related cortical activity.
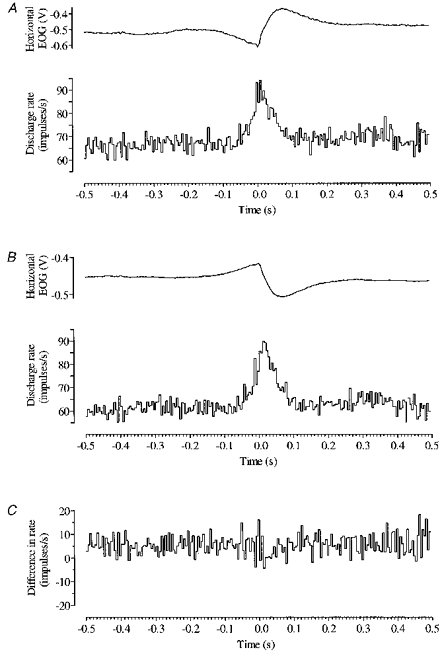
The pooled discharge histogram of all cortical cells whose activity modulated in relation to leftwards saccades is shown in A, and the pooled discharge histogram of all cortical cells modulating in relation to rightwards saccades in B. The difference between the two (A - B) is plotted in C. Each pooled histogram is accompanied (above) by the corresponding pooled saccade profile. Onset of saccade is at time zero. Bin width is 5 ms.
For each cell, average saccade profiles were compared with average discharge histograms to establish latency measures. The interval between onset of modulation and saccade onset (i.e. the ‘lead time’) was 15 ± 21 ms (mean ±s.d.) and 16 ± 25 ms for cortical cells related to leftwards and rightwards saccades, respectively. The pooled histograms yield lead times of 30 and 40 ms for combined cortical output (left and rightwards saccades, respectively).
Only four instances were observed where the first detectable modulation lagged behind the start of the saccade and for three of these the modulation led saccades in the opposite direction.
Note that the individual histograms are ‘noisier’ than the combined, which means that the rising phase of the individual modulations takes longer to exceed the criterion for significance. This accounts for the fact that the mean value for onset of modulation derived from individual histograms is later than the value obtained (using the same criterion) from the combined discharge.
Discharge frequency peaked on average 11 ± 22 ms after leftwards saccade onset and 12 ± 15 ms after rightwards saccade onset. The end of modulation was just after the end of the saccade so that duration of modulation exceeded duration of the saccade by an amount roughly equal to the rising phase of the modulation, the lead time. Peak frequency change was around 30 impulses s−1 (both directions), and there were on average 1.5 additional spikes per saccade in either direction.
One of the cells that gave the strongest modulation with saccadic eye movements was subjected to trial by trial regression analysis of spikes per saccade vs. saccade amplitude and duration. This antidromically identified dentate neurone yielded strong discrete bursts of activity superimposed upon a low background level of discharge for both leftwards and rightwards saccades, and its average discharge histogram in relation to (152) leftwards saccades appears in Fig. 12A. Nevertheless, regression analysis showed that the correlation of its discharge with the parameters of individual saccades was surprisingly weak (r = 0.45 for regression of saccade amplitude or duration on spike count). This implies that only around 20% of the variation in neural activity could be attributed to covariation with saccade parameters.
Since we were only measuring the horizontal component of any eye movements, it was possible that the cell did maintain a tight relationship to saccades that were purely horizontal but that this was being masked by inclusion of obliquely directed eye movements (i.e. that a technical limitation was preventing us from seeing that relationship). Since oblique saccades have lower horizontal velocity components we therefore rank ordered saccades according to horizontal velocity, and performed the same regression analysis on the subset of forty-eight whose velocity was greater than the mean value for all 152, on the grounds that these represent the closest to purely horizontal. Confirmation that this is probably the case was provided by the fact that the relationship between saccade amplitude and duration was much clearer for these saccades (r = 0.8, compared with r = 0.55 for all 152). Nevertheless, the relationship between neuronal activity and saccade parameters was not much improved, with r = 0.45 for spike count vs. amplitude and 0.55 for spike count vs. duration. We conclude that any strong relationship was not being obscured for the straightforward technical reason of only recording the horizontal EOG, but rather that such a strong relationship did not exist in the first place.
This cell seems typical of the saccade-related neurones in our sample, several others of which were susceptible to other influences that could sometimes be measured. Thus, eight cells (of 14 tested; 57%) also exhibited step-related rhythmicity, a combination of properties that qualifies these cells to participate directly in the co-ordination of eye and body movements. Furthermore, three Purkinje cells of fifty-four tested (6%) were found to be active in relation to visual events, stepping movements and saccades.
DISCUSSION
This is the first time that single unit recordings have been obtained from the lateral cerebellum in an animal performing visually guided stepping. It is the first demonstration and description in the cat lateral cerebellum of visual responses to irrelevant and relevant stimuli, of step-related rhythmicity and of saccade-related bursts, all of which have been found, often in combination, in both the hemispheral cortex and the lateral cerebellar nucleus.
Distribution of visually responsive neurones
Visually responsive neurones (40% of those tested) were found in hemispheral cortex (rather than paravermal) and the lateral cerebellar nucleus (rather than interpositus). This is entirely consistent with anatomical investigations of the projections from visually processing dorsomedial regions of cerebral cortex via the pontine nuclei to the lateral cerebellum (Robinson et al. 1984 (cat); Glickstein et al. 1985, 1994 (monkey); also reviewed in Stein & Glickstein, 1992) and with previous demonstrations of visually responsive neurones in the lateral cerebellar cortex (Noda & Mikami, 1986; Marple-Horvat & Stein, 1990) and dentate nucleus of the monkey (Chapman, Spidalieri & Lamarre, 1986; Mushiake & Strick, 1993).
Our visually responsive cortical recordings came mainly from crus I. Most were 2.5 mm deep or less, and such superficial recordings are perhaps easiest to ascribe to a particular cortical zone by reference to surface maps (for example, Fig. 6 of Voogd & Bigare, 1980). Such comparison suggests that these cells are drawn mainly from the D1 or D2 zone (with perhaps a minority from the more medial C3 zone), and that the Purkinje cells therefore project in the main to dentate nucleus. Visually responsive nuclear recordings were obtained mostly within the top 1 mm of dentate, which is compatible with (though not proof of) their being in the region targeted by the axons of the Purkinje cells recorded.
Additional evidence that the cortical recordings as a whole were not drawn from either the C3 or C2 zones lies in the population measures of step-related rhythmicity of the cells described in this present study. These measures were substantially different in most respects from those previously obtained in this laboratory for the C3 and C2 zones in cats performing identical ladder walking (study undertaken concurrently) or treadmill locomotion. A full description will be given in a paper in preparation, but in brief the following differences were observed. In the cells reported here, rhythmicity was less pervasive and less powerful; the phase of the step cycle in which cells achieved their peak discharge rate, and in which the highest proportion of cells were ‘active’ or firing above their mean level was different; and the discharge rate of the ‘average’ neurone varied differently across the step cycle. All of the above suggests that the present recordings were not drawn substantially from the C3 or C2 cortical zones.
Difference in cortical and nuclear response to flash
The cortical visual response to a flash of light was usually a short latency increase in Purkinje cell discharge rate, whereas the nuclear response was usually an increase converted rapidly to a depression of discharge or return to control levels, presumably because the increased inhibitory P cell output cuts short the nuclear response. Temporal separation of earlier excitation and later depression of nuclear discharge is also evident in the study of visually responsive dentate neurones in the monkey by Chapman et al. (1986) who found ‘equal percentages of excitatory and inhibitory responses … the earliest changes encountered being excitatory’. Their earliest excitatory response had a latency of less than 20 ms (as did ours) and earliest inhibitory response a latency of more than 40 ms (as did ours).
In signal processing terms the responses to flash stimuli represent impulse responses (see Lynn, 1982). The pooled profiles represent the cortical impulse response and the nuclear impulse response. Strictly speaking these illustrate the transformation effected by all neural elements from photoreceptor to cerebellar neurone inclusively, but since flash responses in pontine visual cells which provide the lateral cerebellar visual input were of only one type (Baker, Gibson, Glickstein & Stein; 1976), it is fair to assume that differences between the cortical and nuclear profiles reflect local differences in signal processing by the intracerebellar circuitry to which these inputs are fed in cortex or nucleus, and the functional relationship between cortex and nucleus defined by the corticonuclear and nucleocortical projections.
The cortical responses to flash are closely similar to those previously described in monkey hemispheral cerebellar cortex (Marple-Horvat & Stein, 1990) and by Baker et al. (1976) in cat visual pontine cells (earliest onset latencies less than 20 ms, median onset latency between 30 and 35 ms, both as in the present report). The abbreviated nuclear responses, including sometimes depression of activity, represent the next stage in signal processing and provide a useful insight into how the cerebellum might deal in general with powerful, brief stimuli that are familiar and treated by the animal as behaviourally irrelevant; their representation is curtailed and more than halved en passage. Indeed, the net result of the excitatory and depressive phases assessed from the pooled nuclear response was a change of only +0.25 spikes per stimulus.
Difference in visual response to flash and rung movement
In contrast to much that has been said above regarding responses to flash, the large size of the visual responses to rung movement should lead to a correlate in targets of dentate neurones that is readily detectable and presumably can be related to subsequent changes in movement.
A higher proportion of cells responded to rung movement, again the great majority with increased discharge, which was of longer latency than the flash response and of longer duration. Peak frequency changes were twice the size of those to flash, at 100 impulses s−1 on average and additional spikes per trial were correspondingly 3–4 times higher. This recalls what was found for pontine visual cells (in anaesthetized cats) which were more powerfully modulated by large moving dot patterns than by a full field flash of light (Baker et al. 1976). Of course, rung movement long outlasted flash, but response to rung movement did not on average outlast response to flash by the 80 or 130 ms (3 or 6 cm movement, respectively) which is the difference in duration of these two stimuli (for the slightly faster of the two rungs); and this argues against a straightforward relationship between stimulus duration and response duration. This perhaps in turn implies that cerebellar circuitry (both cortical and nuclear) is organized in favour of a phasic response to even a prolonged stimulus. Furthermore, the rung remained displaced, i.e. it was a ‘ramp and hold’ stimulus, so that although rung movement itself was of limited duration, the ‘hold’ wasn't. Others have commented on cerebellar phasic responses to ramp and hold stimuli of other modalities, e.g. muscle length (McKay & Murphy, 1979). The fact that all responses to rung movement were phasic, with no examples of maintained altered discharge rates when the rung held its new position, means that these cerebellar neurones were clearly not signalling rung position. It is conceivable that their discharges represent a rung velocity signal, a suggestion that is discussed further below.
Importantly, we can on two grounds discount the possibility that larger responses to rung movement arose by virtue of the cells being in a more excitable state at the time that rung movement occurred - when walking - than at the time flash stimuli were presented - on the rest platform.
Firstly, for the eight cells for which direct comparison can be made (i.e. those that gave both flash and PDR responses), background discharge rate in the (200 ms) control period preceding flash stimuli was 30 impulses s−1 (mean of 8 individual discharge levels), and preceding rung movement was 36 impulses s−1, a difference of only 6 impulses s−1. Excitability levels were therefore little higher when the rung moved.
Secondly, the same neurone gave the same sized response (as judged by additional spike counts or peak frequency change) when triggered by either left or right footfall - half a step cycle apart - at which times the step-related rhythmicity of the cell meant that the responses (which were indistinguishable) were superimposed on widely different levels of ongoing activity (for the example illustrated in Fig. 6, ongoing discharge rates of around 20 and 50 impulses s−1, respectively).
The findings of Mushiake & Strick (1993) that dentate neurones (in the monkey) were powerfully modulated by visual signals only when they were immediately used to guide movement would predict that only a weak or no flash representation would emerge as cerebellar output. That is indeed our finding (see previous section). Our observation of more powerful excitation by the behaviourally important stimulus of rung movement confirms a significant difference in cerebellar representation of stimuli that have immediate consequences for visually guided movement.
Our findings are also compatible with another hypothesis, namely that the cerebellum operates as a Smith Predictor (Miall, Weir, Wolpert & Stein, 1993). In this schema, absence of sensory consequences means that a representation of the flash should hardly appear as a cerebellar output (see also below).
The shorter latency of the flash response probably reflects ‘forcing’ by the intensity of the stimulus of transmission along the fastest pathways. Certainly Baker et al. (1976) found evidence of this in pontine flash responses; increasing flash intensity usually decreased the latency and increased the vigour of the responses.
Implications of context-dependent visual responsiveness for the co-ordinate framework within which lateral cerebellar neurones might operate
Both cortical and nuclear visual responses to rung movement are context dependent, being larger when the rung moves when the cat is closer than further away. This is despite the fact that the actual movement of the rung is the same in each case. In other words these different cerebellar discharges do not specify the same rung movement in extrinsic 3D space co-ordinates. Having already excluded (above) the possibility that these discharge patterns describe rung position, we can also say that they are not compatible with straightforward coding of rung velocity in 3D space.
The observed patterns of activity are compatible with specifying rung velocity in internal sensory (such as retinal) co-ordinates so that these neurones are working within a visual, egocentric (rather than extrinsic) framework, the larger visual angles subtended on the retina by the rung and its movement generating a greater cerebellar excitation when closer.
These context-dependent modulations could also represent immediacy of a required motor response since the size of the response to rung movement is inversely proportional to distance from the rung, or in direct proportion to its proximity - which should be readily translatable into ‘time to arrival’ when the cat has approached this familiar object at a similar speed many times before. Such an interpretation anticipates the motor or kinematic framework in which questions such as how far (spatially or temporally) the footfall target is from the paw to be placed on it, or how the limb should be moved to achieve footfall must be represented and answered.
A related observation is that both visual- (rung movement or flash generated) and motor (step cycle or saccade)-related activity was sometimes seen in individual neurones, which implies sensible combination of diverse inputs (sometimes present at the same time) and of the co-ordinate frameworks in which they are expressed. For example a signal relating to rotation of the eye in the orbit can be sensibly added to a signal representing rotation of the head at the neck to construct a signal expressing gaze change (in a seated animal).
Neuronal activity in advance of saccadic eye movements
A quarter of the cells modulated their activity in advance of saccades, increasing their discharge rate. Four-fifths of these were non-reciprocally directionally selective. Most of our saccade-related neurones were cortical, and their discharge patterns were similar to those seen previously in monkey hemispheral cortex (Marple-Horvat & Stein, 1990); our few nuclear recordings resemble a similar number of dentate neurones (in rhesus monkeys) that were found to be saccade related by Gardner & Fuchs (1975). Saccade-related neurones were usually susceptible to other influences; activity did not correlate well with saccade parameters in isolation, though our best correlation coefficients are not greatly inferior to the best reported by Fuchs, Robinson & Straube (1993) for a cerebellar region - fastigial nucleus (in monkey) - that was shown to be important for saccade generation, accuracy and consistency. Our records contained many examples of slow eye movements that were probably driven by cephalo-ocular reflexes, but visual inspection revealed no obvious connection with the neuronal discharges. In the absence of a monitoring signal for the cats’ head movements, we are unable to pursue this further than stating that it is our impression that cells were only reliably modulated in relation to saccadic eye movements.
It remains an intriguing possibility that these cells, rather than being eye movement-only, are akin to Purkinje cells that have been reported elsewhere (in flocculus) as encoding gaze velocity (Miles, Fuller, Braitman & Dow, 1980), in which case their discharges should modulate in relation to the sum of any eye movements made (saccadic or smooth pursuit) and any head movements. Paradoxically, our observation that slow eye movements that were probably compensatory for head movements were not accompanied by obvious modulations, rather than precluding this possibility in fact supports the argument since, as those authors point out, under these conditions the direction of gaze does not change (sum of head movements and eye movements is zero). The non-reciprocal nature of the modulations for opposite directions of saccades (always excitations) clearly, however, proscribes a linear coding by individual cells of velocities in opposite directions (one of which must generate negative values).
The finding by Mano, Ito & Shibutani (1991, 1996) that stronger modulations accompany ‘visually triggered’ than ‘spontaneous’ saccades appears to be an important distinction in that it is another example of ‘context dependency’ (it might also explain why a strong correlation between neuronal modulation and saccade parameters is not seen when dealing with a ‘mixed bag’ of eye movements that cannot be reliably sorted into these two categories for separate analysis).
In relation to the Smith Predictor hypothesis of cerebellar function discussed below, it is possible that these cells were coding the sensory consequences of impending saccades (i.e. the impending translation of the retinal image) rather than the saccades themselves, though under our experimental conditions (i.e. in this particular study) these two are in practical (as opposed to theoretical) terms indistinguishable.
Possible significance of visuomotor and other combinations of properties
Some visually responsive neurones also discharge in relation to stepping movements and others also discharge in advance of saccadic eye movements. And more than half the cells tested were active in relation to eye movements and stepping movements. The importance of these combinations of properties is that they qualify even individual cerebellar neurones to participate in the co-ordination of visually guided eye and body movements.
The possibility must be considered that recurring features/changes of the image of the ladder in the lower visual field as the cat walked could be contributing to the activation of the cells recorded, causing them to perhaps ‘masquerade’ as stepping-related neurones. However, we judge this unlikely because of the partial double dissociation of visual responsiveness and step-related rhythmicity existing in our data as a whole. Thus, among the twenty cells that were rhythmically active during ladder walking and tested against the PDR, only fourteen cells were visually responsive. There are no positive grounds for attributing the rhythmicity of the remaining six to visual responsiveness to the image of the ladder. Conversely, we identified forty-five visually responsive cells (16 of which were PDR responsive), thirty-one of which were also recorded during ladder walking. Among these there were seven (one of which gave the largest nuclear response to both flash and rung movement) which did not exhibit step-related rhythmicity so that visual responsiveness was by no means always accompanied by step-related firing.
The present study probably falls short of testing the limits of what the cerebellum can contribute to visually guided behaviour, and the different modulations produced by rung movement in different contexts do not have a unique interpretation. It is clear from the subtle relationships we have described between neuronal activity, visual stimuli in the task and the cat's visually guided behaviour that it will be important in future studies to use tasks that present sufficient challenge to the information processing capacity both of individual cells and of the neuronal assemblies to which they belong. Visual targets of varying location and velocity profiles should be used, in contexts requiring at different times either a behavioural response or not. Simple tasks are likely to reveal only simple processing ability and lead to an underestimate of the capabilities of cerebellar neurones and circuits.
Comparison with studies of the lateral cerebellum and visually guided movement in monkeys
Mushiake & Strick (1993) have recently studied the activity of dentate neurones in response to visual stimuli used either to prescribe a movement sequence to be remembered and executed after a delay or to guide a movement sequence ‘on-line’ as a tracking task. Three-quarters of dentate cells that were categorized as ‘task dependent’ modulated their activity during the reaction time period between a visual ‘go’ signal and lift off from a hold key only or more strongly in the tracking task.
Clear phasic increases in activity during the reaction time period were seen which might represent an initial visual response to the ‘go’ signal (provided by an LED). Onset and peak latencies illustrated are ca 60 and 120 ms, comparable with responses previously described in the monkey in response to visual stimuli, both in dentate nucleus (Chapman et al. 1986) and in the hemispheral cortex that projects to the dentate (Marple-Horvat & Stein, 1990). In both of these studies, neurones that responded to task visual cues again only did so if the animal subsequently made a movement (and not if the monkey moved prematurely, anticipating the target). Marple-Horvat & Stein also found, however, that a visual stimulus to which a movement response was not made - flash stimulation as used in the present study - could also drive lateral cerebellar neurones. But most responsive cells were cortical, and the flash is a much more intense stimulus than the LED which Mushiake & Strick found to be ineffective in driving dentate cells when not used to guide movement immediately. It seems likely, particularly in view of the de-emphasized nuclear response to flash seen in the present study (amounting to only 0.6 spikes per trial), that cat dentate neurones would also be unaffected by a weak visual stimulus (of the type used by Mushiake & Strick) not immediately used to guide movement, so that a species difference is not suggested.
It is not clear whether Mushiake & Strick would consider the phasic increases in excitation during the reaction time period as visual responses analogous to those we have described in this report (or in the other studies discussed above), though that is our suggested interpretation.
On a related issue, Strick's work would suggest that visually guided ladder stepping would modulate dentate cells much more than treadmill locomotion in which visual guidance is hardly required. This might explain why in treadmill-walking decerebrate cats (Schwartz, Ebner & Bloedel, 1987) dentate cells were on the whole not rhythmic, whereas two-thirds of our nuclear and cortical cells were rhythmic on the ladder (Criado, Marple-Horvat & Armstrong, 1993).
The cerebellum as a predictor of sensory consequences
The suggestion by Miall et al. (1993, 1995) that the cerebellum functions as a Smith Predictor, predicting sensory consequences of movements (rather than prescribing motor outputs) as a way of circumventing long feedback delays (for example a visuomotor loop time of ca 200 ms) is intriguing not least because a neural network model of such a controller can successfully learn and execute a tracking arm movement in a way that is reminiscent of human behaviour. Furthermore, Miall suggests that the symptoms of patients with interrupted lateral cerebellar output, who were unusually dependent on visual feedback of their own performance, indicate they have lost their internal dynamic model of the limb which is a central element of the Smith Predictor and which presumably therefore resides in the cerebellum.
Notwithstanding the interpretative difficulties associated with interruption of pathways, the central challenge of this, as with all models of cerebellar function is to reconcile its predictions to actual single unit recordings obtained in sufficient quantities under the right experimental conditions.
Miall proposes that a Smith Predictor in lateral cerebellum transforms a movement command or instruction to reach a desired goal, specified by posterior parietal cortex in visual, egocentric co-ordinates, into a motor control signal for motor cortex. We have already suggested that our observed responses to rung movement, in particular the different responses at two distances from the rung when it moved, indicate processing within an egocentric framework, in line with such a proposal. However (see above), we are ultimately unable to determine whether such activity patterns represent part of an internal cerebellar model of the way in which the rung moves (the dynamics of the target) or of the way the limb should move (the dynamics of the limb) to place the paw on that target - though the timing of the modulation, in parallel with the rung movement and about half a second ahead of any change in limb trajectory would seem to suggest the former.
Certainly, since the PDR had been encountered many times, a model of its movement could have been constructed in lateral cerebellum whose neurones would then predict the dynamics of rung movement. This may explain why on the whole, although modulation only commenced after an initial visual processing time, it usually finished ahead of rung movement rather than lagging at the end by the same processing time, and could also account for the observation that PDR responses did not outlast flash responses by the 130 ms or so difference in duration of the stimuli. Thus once rung movement has been detected, it may be that the remainder of the modulation is a prediction of the course of its movement rather than a visually sensed (and therefore delayed) representation. We are currently pursuing the possibility that lateral cerebellar neurones can predict the motion of moving targets (such as the PDR) using a visually guided reaching task to a mobile target.
Cerebellar involvement in cognition, and in co-ordination of eye and limb movements
Magnetic resonance imaging has recently been used to investigate whether the lateral cerebellum is involved in perceptual and cognitive levels of information processing in man (e.g. Kim, Ugurbil & Strick, 1994; Gao, Parsons, Bower, Xiong, Li & Fox, 1996), and the results of these studies have generally been interpreted as providing evidence that it is. In this connection, the significance or context of visual stimuli represented by some of the discharge patterns that we and Mushiake & Strick (1993) have observed (see also Chapman et al. 1986) might be considered as an aspect of discrimination. It has been suggested that the motor significance of cerebellar processing has been overemphasized historically, perhaps because more easily demonstrated, being overt; but the most striking description in the work of Gordon Holmes is probably that of the inability of cerebellar patients to make decent visually guided pointing movements, in which case ‘visual guidance’ is as central a concept as ‘movement’. The historical perspective (reviewed in Stein & Glickstein, 1992) in our view sets the cerebellum squarely and irreducibly as a sensorimotor organ, with the lateral cerebellum in cats and primates (including man) dealing predominantly with the dominant sense, which is vision.
The importance of monitoring eye movements when investigating lateral cerebellar function is probably indicated by the fact that around a quarter of lateral cerebellar neurones might be actively involved in saccade generation. In relation to understanding the role of the cerebellum in visually guided movements, eye movements are important in their own right since it is a common finding that a visual target for an arm movement (when reaching, pointing or catching) is first acquired by the eyes which make a saccade to obtain a foveal image.
Unfortunately we know nothing of the eye movements made by Holmes's cerebellar patients, some of whom presumably had abnormal eye movements since they are such a common cerebellar symptom (cf. Dow & Moruzzi 1958). Did those subjects’ difficulty in pointing accurately from one target to another relate to any difficulty in shifting their gaze accurately between locations? To pursue this point in the context of visually guided stepping, we have recently observed the normal co-ordination of eye and stepping movements in man (Hollands, Marple-Horvat, Henkes & Rowan, 1995; Hollands & Marple-Horvat, 1995, 1996). These studies suggest that the eye guidance system works just ahead of and assists the limb guidance system. Since our present neuronal recordings at least provide for this co-operation to take place in the lateral cerebellum, we have embarked upon a study of cerebellar patients (Crowdy, Hollands & Marple-Horvat, 1996), some of whom have abnormal eye movements, to see to what degree their problems of limb guidance during visually guided stepping are attributable to problems with their eye movements.
Acknowledgments
This study was supported by the Medical Research Council of Great Britain, The Wellcome Trust and a visiting fellowship for J. M. C. from the Spanish Ministry of Education and Science.
References
- Amos AJ, Armstrong DM, Marple-Horvat DE. A ladder paradigm for studying skilled and adaptive locomotion in the cat. Journal of Neuroscience Methods. 1987;20:323–340. doi: 10.1016/0165-0270(87)90064-1. 10.1016/0165-0270(87)90064-1. [DOI] [PubMed] [Google Scholar]
- Armstrong DM, Edgley SA. Discharges of nucleus interpositus neurones during locomotion in the cat. Journal of Physiology. 1984;351:411–432. doi: 10.1113/jphysiol.1984.sp015253. [DOI] [PMC free article] [PubMed] [Google Scholar]
- Armstrong DM, Rawson JA. Activity patterns of cerebellar cortical neurones and climbing fibre afferents in the awake cat. Journal of Physiology. 1979;289:425–448. doi: 10.1113/jphysiol.1979.sp012745. [DOI] [PMC free article] [PubMed] [Google Scholar]
- Baker J, Gibson A, Glickstein M, Stein J. Visual cells in the pontine nuclei of the cat. Journal of Physiology. 1976;255:415–433. doi: 10.1113/jphysiol.1976.sp011287. [DOI] [PMC free article] [PubMed] [Google Scholar]
- Blakemore C, Donaghy M. Co-ordination of head and eyes in the gaze changing behaviour of cats. Journal of Physiology. 1980;300:317–335. doi: 10.1113/jphysiol.1980.sp013164. [DOI] [PMC free article] [PubMed] [Google Scholar]
- Chapman CE, Spidalieri G, Lamarre Y. Activity of dentate neurones during arm movements triggered by visual, auditory and somaesthetic stimuli in the monkey. Journal of Neurophysiology. 1986;55:203–226. doi: 10.1152/jn.1986.55.2.203. [DOI] [PubMed] [Google Scholar]
- Criado JM, Marple-Horvat DE, Armstrong DM. Neuronal activity in lateral cerebellum of cats during visually guided stepping. XXXII Congress of the International Union of Physiological Sciences. 1993;171.2/P [Google Scholar]
- Crowdy KA, Hollands MA, Marple-Horvat DE. Deficits in visually guided stepping during a phenytoin-induced cerebellar syndrome. Society for Neuroscience Abstracts. 1996;22:2040. [Google Scholar]
- Dow RS, Moruzzi G. The Physiology and Pathology of the Cerebellum. Minneapolis, MN, USA: University of Minnesota Press; 1958. [Google Scholar]
- Edgley SA, Lidierth M. The discharges of cerebellar Golgi cells during locomotion in the cat. Journal of Physiology. 1987;392:315–332. doi: 10.1113/jphysiol.1987.sp016782. [DOI] [PMC free article] [PubMed] [Google Scholar]
- Fuchs AF, Robinson FR, Straube A. Role of the caudal fastigial nucleus in saccade generation. 1) Neuronal discharge patterns. Journal of Neurophysiology. 1993;70:1723–1740. doi: 10.1152/jn.1993.70.5.1723. [DOI] [PubMed] [Google Scholar]
- Gao J-H, Parsons LM, Bower J M, Xiong J, Li J, Fox PT. Cerebellum implicated in sensory acquisition and discrimination rather than motor control. Science. 1996;272:545–547. doi: 10.1126/science.272.5261.545. [DOI] [PubMed] [Google Scholar]
- Gardner EP, Fuchs AF. Single unit responses to natural vestibular stimuli and eye movements in deep cerebellar nuclei of the alert rhesus monkey. Journal of Neurophysiology. 1975;38:627–649. doi: 10.1152/jn.1975.38.3.627. [DOI] [PubMed] [Google Scholar]
- Glickstein M, Gerrits N, Kralj-Hans I, Mercier B, Stein JF, Voogd J. Visual pontocerebellar projections in the macaque. Journal of Comparative Neurology. 1994;349:51–72. doi: 10.1002/cne.903490105. [DOI] [PubMed] [Google Scholar]
- Glickstein M, May JG, Mercier BE. Corticopontine projection in the macaque: the distribution of labelled cortical cells after large injections of horseradish peroxidase in the pontine nuclei. Journal of Comparative Neurology. 1985;235:343–359. doi: 10.1002/cne.902350306. [DOI] [PubMed] [Google Scholar]
- Hollands MA, Marple-Horvat DE, Henkes S, Rowan AK. Human eye movements during visually guided stepping. Journal of Motor Behaviour. 1995;27:155–163. doi: 10.1080/00222895.1995.9941707. [DOI] [PubMed] [Google Scholar]
- Hollands MA, Marple-Horvat DE. Control strategies for visually guided stepping. Society for Neuroscience Abstracts. 1995;21:2084. [Google Scholar]
- Hollands MA, Marple-Horvat DE. Visually guided stepping under conditions of step cycle-related denial of visual information. Experimental Brain Research. 1996;109:343–356. doi: 10.1007/BF00231792. [DOI] [PubMed] [Google Scholar]
- Holmes G. The cerebellum of man. Brain. 1939;62:1–30. [Google Scholar]
- Ito M, Yoshida M, Obata K, Kawai N, Udo M. Inhibitory control of intracerebellar nuclei by the Purkinje cell axons. Experimental Brain Research. 1970;10:64–80. doi: 10.1007/BF00340519. [DOI] [PubMed] [Google Scholar]
- Kim S-G, Ugurbil K, Strick PL. Activation of a cerebellar output nucleus during cognitive processing. Science. 1994;265:949–951. doi: 10.1126/science.8052851. [DOI] [PubMed] [Google Scholar]
- Lynn PA. An Introduction to the Analysis and Processing of Signals. 2. London: Macmillan; 1982. pp. 136–143. [Google Scholar]
- McKay WA, Murphy JT. Cerebellar modulation of reflex gain. Progress in Neurobiology. 1979;13:361–417. doi: 10.1016/0301-0082(79)90004-2. [DOI] [PubMed] [Google Scholar]
- Mano N, Ito Y, Shibutani H. Saccade-related Purkinje cells in the cerebellar hemispheres of the monkey. Experimental Brain Research. 1991;84:465–470. doi: 10.1007/BF00230957. [DOI] [PubMed] [Google Scholar]
- Mano N, Ito Y, Shibutani H. Context dependent discharge characteristics of saccade-related Purkinje cells in the cerebellar hemispheres of the monkey. Progress in Brain Research. 1996;112:423–430. doi: 10.1016/s0079-6123(08)63347-6. [DOI] [PubMed] [Google Scholar]
- Marple-Horvat DE. Visual input to the lateral cerebellum. In: Ferrell WR, Proske U, editors. Neural Control of Movement. New York: Plenum Press; 1995. pp. 233–239. [Google Scholar]
- Marple-Horvat DE. The lateral cerebellum and visually guided stepping. Journal of Physiology. 1996;493.P:9S. doi: 10.1111/j.1469-7793.1999.0595p.x. [DOI] [PMC free article] [PubMed] [Google Scholar]
- Marple-Horvat DE, Amos AJ, Armstrong DM, Criado JM. A mechanism for provoking voluntary changes to ongoing locomotion in the cat. Journal of Physiology. 1992;452:150P. [Google Scholar]
- Marple-Horvat DE, Amos AJ, Armstrong DM, Criado JM. Changes in the discharge patterns of cat motor cortex neurones during unexpected perturbations of ongoing locomotion. Journal of Physiology. 1993;462:87–113. doi: 10.1113/jphysiol.1993.sp019545. [DOI] [PMC free article] [PubMed] [Google Scholar]
- Marple-Horvat DE, Criado JM, Armstrong DM. Neuronal activity in lateral cerebellar cortex (lobulus simplex) of cats, related to visual stimuli at rest and during locomotion. Society for Neuroscience Abstracts. 1992;18:1046. [Google Scholar]
- Marple-Horvat DE, Criado JM, Armstrong DM. Visually evoked neuronal activity in lateral cerebellar cortex (lobulus simplex) of cats, during rest and during locomotion. Journal of Physiology. 1993;459:135P. [Google Scholar]
- Marple-Horvat DE, Gilbey SL, Hollands MA. A method for automatic identification of saccades from eye movement recordings. Journal of Neuroscience Methods. 1996;67:191–195. [PubMed] [Google Scholar]
- Marple-Horvat DE, Stein JF. Neuronal activity in the lateral cerebellum of trained monkeys, related to visual stimuli or to eye movements. Journal of Physiology. 1990;428:595–614. doi: 10.1113/jphysiol.1990.sp018230. [DOI] [PMC free article] [PubMed] [Google Scholar]
- Miall RC, Weir DJ, Wolpert DM, Stein JF. Is the cerebellum a Smith Predictor? Journal of Motor Behaviour. 1993;25:203–216. doi: 10.1080/00222895.1993.9942050. [DOI] [PubMed] [Google Scholar]
- Miall RC, Wolpert DM. The cerebellum as a predictive model of the motor system: a Smith Predictor hypothesis. In: Ferrell WR, Proske U, editors. Neural Control of Movement. New York: Plenum Press; 1995. pp. 215–223. [Google Scholar]
- Miles FA, Fuller JH, Braitman DJ, Dow BM. Long-term adaptive changes in primate vestibuloocular reflex. III. Electrophysiological observations in flocculus of normal monkeys. Journal of Neurophysiology. 1980;43:1437–1477. doi: 10.1152/jn.1980.43.5.1437. [DOI] [PubMed] [Google Scholar]
- Mushiake H, Strick PL. Preferential activity of dentate neurones during limb movements guided by vision. Journal of Neurophysiology. 1993;70:2660–2664. doi: 10.1152/jn.1993.70.6.2660. [DOI] [PubMed] [Google Scholar]
- Noda H, Mikami A. Discharges of neurones in the dorsal paraflocculus of monkeys during eye movements and visual stimulation. Journal of Neurophysiology. 1986;56:1129–1146. doi: 10.1152/jn.1986.56.4.1129. [DOI] [PubMed] [Google Scholar]
- Robinson FR, Cohen JL, May J, Sestokas AK, Glickstein M. Cerebellar targets of visual pontine cells in the cat. Journal of Comparative Neurology. 1984;223:471–482. doi: 10.1002/cne.902230402. [DOI] [PubMed] [Google Scholar]
- Schwartz AB, Ebner TJ, Bloedel JR. Responses of interposed and dentate neurones to perturbations of the locomotor cycle. Experimental Brain Research. 1987;67:323–338. doi: 10.1007/BF00248553. [DOI] [PubMed] [Google Scholar]
- Shinoda Y, Sugiuchi Y, Futami T, Izawa R. Axon collaterals of mossy fibres from the pontine nucleus in the cerebellar dentate nucleus. Journal of Neurophysiology. 1992;67:547–560. doi: 10.1152/jn.1992.67.3.547. [DOI] [PubMed] [Google Scholar]
- Stein JF, Glickstein M. Role of the cerebellum in visual guidance of movement. Physiological Reviews. 1992;72:967–1017. doi: 10.1152/physrev.1992.72.4.967. [DOI] [PubMed] [Google Scholar]
- Voogd J, Bigare F. Topographical distribution of olivary and corticonuclear fibres in the cerebellum: a review. In: Courville J, De Montigny C, Lamarre Y, editors. The Inferior Olivary Nucleus: Anatomy and Physiology. New York: Raven Press; 1980. pp. 207–234. [Google Scholar]