

Abstract
Electrophysiological recordings of GABAergic IPSCs and responses to applications of exogenous GABA were made from cultured murine cerebellar granule cells. In both the presence and absence of tetrodotoxin, depolarization of the postsynaptic cell consistently produced a broadening of the IPSC. This voltage-dependent change in kinetics arose entirely from a slowing of the rate of current decay. The duration of miniature IPSCs was increased by a significant but lesser amount by the GABA uptake inhibitor nipecotic acid (300 μM).
Five millisecond applications of 1 mM GABA elicited rapidly activating, biexponentially deactivating currents in patches derived from granule cell bodies. Deactivation of these responses was slowed by membrane depolarization. This effect arose from an increased fractional participation of the slow component of deactivation. The benzodiazepine flunitrazepam (1 μM) slowed deactivation at a holding potential of −70 mV but not at +50 mV.
Longer-lasting applications of GABA produced substantial biexponential macroscopic desensitization. The rate of desensitization was faster at a holding potential of +50 mV than at −70 mV. The speeding of desensitization at depolarized membrane potentials arose from an increase in the fractional contribution of the fast component of desensitization.
When two 5 ms, 1 mM GABA applications were made at an interstimulus latency of 150 ms, the second response was consistently smaller than the first. The depression of the second response was significantly heightened when the membrane potential was depolarized from −70 to +50 mV.
The degree of desensitization produced was closely linked to receptor occupancy. The rate of current deactivation was also voltage dependent when non-saturating, and therefore less desensitizing, applications of GABA were analysed. In contrast, both the GABA EC50 (≈30 μM) and the current activation kinetics at near EC50 agonist concentrations appeared to be voltage independent.
As the major inhibitory neurotransmitter in the central nervous system (CNS), γ-aminobutyric acid (GABA) plays a crucial role in regulating neuronal excitability and the generation of rhythmic neuronal discharges (Mody, De Koninck, Otis & Soltesz, 1994; Toth, Freund & Miles, 1997). Both the kinetics and the amplitude of GABAergic synaptic responses are important factors in determining the ability of synaptic inhibition to counteract coincident synaptic excitation. It has become clear that at any individual synapse a number of factors can alter either or both of these two parameters, thus both shaping the synaptic response (Mathers, 1991; Mody et al. 1994; Jones & Westbrook, 1997) and leading to activity-dependent changes in inhibitory synaptic efficacy (McCarren & Alger, 1985; Thompson & Gähwiler, 1989a, b; Benardo, 1993; Alger & Pitler, 1995).
A primary source of kinetic diversity in GABAergic synaptic responses is the precise subunit make-up of the postsynaptic GABAA receptors. This can be demonstrated by making applications of GABA, designed to mimic the synaptic lifetime and concentration of this transmitter, to defined populations of expressed recombinant GABAA receptors (Verdoon, 1994; Gingrich, Roberts & Kass, 1995; Tia, Wang, Kotchabhakdi & Vicini, 1996a, b). In such experiments the predominant kinetic difference between various subunit combinations is in the rate of current deactivation: the major factor contributing to the decay of GABAergic synaptic responses (Busch & Sakmann, 1990; Mody et al. 1994; Jones & Westbrook, 1996). The rate of GABAA receptor deactivation can also be affected by a number of other factors including receptor desensitization (Jones & Westbrook, 1995, 1996; Tia et al. 1996a; Mellor & Randall, 1997a; Webb, Mellor, Grant & Randall, 1997), intracellular phosphatase activity (Jones & Westbrook, 1997), extracellular Zn2+ (Mellor & Randall, 1997b) and therapeutically useful drugs such as the benzodiazepines (Mellor & Randall, 1997a).
The sum total of GABAA receptors available for activation at the time of synaptic release is also an important factor in controlling the inhibitory contribution of any synapse. This parameter is defined by the actual number of GABAA receptors that become occupied with agonist following release, and by the fraction of non-desensitized receptors present within the total population (Jones & Westbrook, 1996). Although not unequivocally demonstrated, it seems likely that, when released, the contents of a single GABA-containing vesicle can transiently desensitize a proportion of postsynaptic GABAA receptors. Desensitization produced in this way may contribute to short-term plasticity of GABAergic transmission (Jones & Westbrook, 1996).
The efficacy of GABAergic synapses can also be modulated, in both the long and short term, by the postsynaptic membrane potential. In the long term, postsynaptic depolarization can produce lasting changes in the strength of inhibitory synaptic transmission (Llano, Leresche & Marty, 1991; Vincent, Armstrong & Marty, 1992; Alger & Pitler, 1995). In the short term, postsynaptic depolarization slows the decay of hippocampal IPSCs (Collingridge, Gage & Robertson, 1984; Segal & Barker, 1984; Barker & Harrison, 1988; Otis & Mody, 1992), thereby increasing inhibitory efficacy. The mechanisms underlying this latter effect are presently unclear: however, changes arising from increases in postsynaptic [Ca2+] have been reported to slow the decay of hippocampal IPSCs (Soltesz & Mody, 1995). Data from steady-state single channel recordings have been interpreted as demonstrating that GABAA receptors exhibit an apparent increased agonist affinity at depolarized membrane potentials (Weiss, 1988). However, in such single channel studies it is difficult to assess the role played by voltage-dependent changes in receptor desensitization.
As well as being important in controlling inhibitory synaptic responses, deactivation and desensitization of GABAA receptors have recently been demonstrated to be closely intertwined phenomena (Jones & Westbrook, 1995; Tia et al. 1996a; Mellor & Randall, 1997a). Specifically, desensitization of GABAA receptors not only leads to the classical depression in GABA response amplitude, but also contributes to the observed rate of deactivation in both native (Jones & Westbrook, 1995; Mellor & Randall, 1997a; Webb et al. 1997) and recombinant systems (Tia et al. 1996a, b).
Previous reports concerning the voltage dependence of GABAA receptor desensitization have indicated that it is slowed (Frosch, Lipton & Dichter, 1992; Hablitz, 1992) or abolished (Yoon, 1994) at positive membrane potentials. These studies, however, used quite slow agonist application methods which can produce artifacts when studying fast desensitization processes, such as those exhibited by GABAA receptors (Celentano & Wong, 1994; Jones & Westbrook, 1995; Tia et al. 1996a, b). In contrast, in a recent study of rat oligodendrocyte progenitor cells made in this laboratory, we observed a significant acceleration of desensitization at depolarized membrane potentials when using rapid agonist application methods (Webb et al. 1997). In the work presented here we have investigated how the voltage dependence of IPSC kinetics in murine cerebellar granule cells compares with the voltage dependence of deactivation and desensitization of responses to exogenous applications of GABA. Our findings demonstrate that, like agonists at the benzodiazepine site, membrane depolarization slows the deactivation and speeds the desensitization of GABA responses.
METHODS
Preparation of primary cultures
Cerebellar granule cells were prepared from postnatal day 5 C57BL/6 × 129/SV mice, as previously described (Mellor & Randall, 1997a). Animals were killed by decapitation, and the cerebellum dissociated by a combination of mild tryptic digestion and mechanical dissociation. The cells thus obtained were maintained in culture (37°C, 5% CO2) for up to 4 weeks in a medium consisting of minimal essential medium (Gibco) supplemented with 10% fetal calf serum (Hyclone), 100 mg l−1 transferrin (Calbiochem) and 25 mg l−1 insulin (Sigma). Cells used in experiments involving exogenous GABA application had their media further supplemented with 20 mM KCl. After 1 day in culture, the cells were fed with fresh medium further supplemented with 4 μM cytosine-D-arabinoside (ARA-C; Sigma) in order to suppress glial cell proliferation. Subsequently, the cells were fed with ARA-C-containing medium every fifth day. Cells were only used in experiments after 14 days or more in culture. By this time granule cells have obtained their fully mature in vitro complement of GABAA receptor subunits (J. R. Mellor, D. Merlo, W. Wisden & A. D. Randall, unpublished observations).
Prior to recording, a single coverslip-containing culture dish was removed from the incubator and the culture medium exchanged for a standard Tyrode solution consisting of (mM): 130 NaCl, 5 KCl, 2 CaCl2, 1 MgCl2, 30 glucose, 25 Hepes-NaOH; pH 7.3. The coverslip was broken into approximately six equal pieces which were transferred one at a time to a recording chamber mounted on the stage of an inverted microscope (Nikon Diaphot 200).
Data recording and analysis
Recordings in the whole-cell and outside-out patch modes were made at room temperature using an Axopatch 200A amplifier (Axon Instruments). For concentration jump experiments, we used 2–6 MΩ electrodes to form large nucleated patches that consisted of a large part of the somatic membrane. These ‘macropatches’ typically exhibited capacitances of 0.6–1.5 pF. In all experiments the pipette solution consisted of (mM): 110 CsCl, 10 NaCl, 5 MgCl2, 5 EGTA, 2 ATP, 0.2 GTP, 35 Hepes; pH 7.3, and the extracellular solution was the Tyrode solution described above.
Recordings of spontaneous IPCSs were made in the whole-cell mode in the continuous presence of the glutamate receptor antagonist CNQX (5 μM; Tocris Cookson). Due to the low concentration of extracellular glycine present in our extracellular solution, this antagonist eliminated both the non-NMDA and NMDA receptor-mediated components of the EPSC (data not shown; see also Randall, Diesseroth & Tsien, 1993). In some cells tetrodotoxin (TTX, 1 μM; Research Biochemicals) was additionally added to the extracellular solution in order to isolate single vesicle or miniature IPSCs (mIPSCs). Continuous records of membrane current were filtered at 50 KHz (4-pole Bessel characteristic filter) and stored on digital audio tape from where they were subsequently re-filtered at 5 kHz and sampled at 10 kHz to continuous computer files. Analysis of these files was performed with a program written within the AxoBasic programming environment (Axon Instruments). IPSC half-widths were only included in the events list generated by this program if they were uncontaminated by previously or subsequently arising synaptic currents.
Rapid applications of exogenous GABA to nucleated outside-out macropatches were made with a piezo-electrically driven solution exchanger (Burleigh) as described previously (Mellor & Randall, 1997a). Currents produced with rapid GABA applications were filtered at fc= 2 kHz and sampled directly to computer files at ≥ 2.5 times fc. Data are presented as means ± 1 s.e.m. Statistical analyses were carried out using standard 2-tailed Student's t tests or the large sample approximation of the Kolmogorov-Smirnov test (KS test). Results were deemed to be significant at P values ≤ 0.05.
Kinetic modelling
Modelling of macroscopic GABA-activated currents was carried out using the software SCoP (Simulation Resources, Berrian Springs, MI, USA). Two gating schemes permitting openings from both mono- and biliganded closed states (MacDonald & Twyman, 1992) were used to model GABA responses. The first was the scheme proposed by Jones & Westbrook (1995). The second scheme was a modification of the first, with two sequential, rather than two discrete, desensitized states. The opening and closing rates used in the model are the mean reciprocal open and closed dwell times from three low-activity single channel recordings.
RESULTS
Depolarization slows IPSC decay
Spontaneous GABAergic inhibitory postsynaptic currents (sIPSCs) were recorded from Cl−-loaded granule cells previously maintained in culture for 18–23 days. The GABAergic identity of these events was confirmed by their reversible elimination by the GABAA receptor antagonists picrotoxin (200 μM) and bicuculline methochloride (10 μM) (data not shown). Negative to the calculated Cl− equilibrium potential (ECl=−2 mV), sIPSCs were inward going. Depolarization to potentials positive to ECl produced outward-going IPSCs (Fig. 1A).
Figure 1. Broadening of GABAergic IPSCs at depolarized membrane potentials.
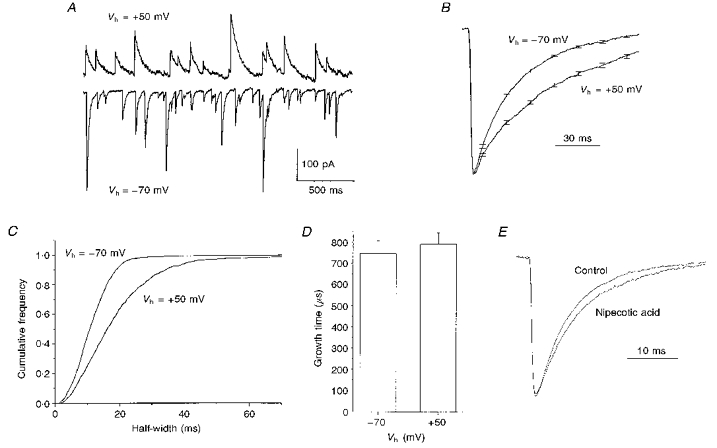
A, spontaneous GABAergic IPSCs recorded from a Cl−-loaded cultured cerebellar granule neurone. The holding potential (Vh) was either −70 mV (bottom) or +50 mV (top). B, mean IPSCs recorded from a typical cell at holding potentials of −70 mV (n = 31) or +50 mV (n = 32). Before averaging, each IPSC was normalized to its peak amplitude. Error bars from the averaging procedure are shown at occasional intervals. C, cumulative frequency plots of IPSC half-widths from a typical cell. In this example and for 5 other cells, the curves derived from data sets recorded at −70 and +50 mV were significantly different (P < 0.01, KS test). D, a graph plotting the mean 20–80% growth times for IPSCs recorded at −70 mV and +50 mV (n = 6). E, peak normalized mean traces from 5 cells recorded before (Control) and following application of 300 μM nipecotic acid. In each cell, 50–100 mIPSCs recorded under each condition were normalized and averaged.
Peak normalized mean sIPSCs recorded from a typical cell at holding potentials (Vh) of −70 mV and +50 mV are shown in Fig. 1B. The waveform recorded at +50 mV is considerably broader than that recorded at −70 mV. On average, the sIPSC half-width increased by 68 ± 5% upon depolarization of the holding potential from −70 to +50 mV (18.6 ± 2.7 ms at −70 mV, 31.6 ± 5.5 ms at +50 mV, n = 4, P < 0.018, Student's paired t test). No differences in sIPSC frequency were noted at the two postsynaptic holding potentials (3.8 ± 1.6 Hz at −70 mV versus3.2 ± 1.2 Hz at +50 mV, P > 0.5, Student's paired t test).
The sIPSC half-width distribution for a typical cell recorded at both −70 and +50 mV is illustrated in the cumulative frequency plots shown in Fig. 1C. The entire distribution of half-widths is shifted to the right at the more depolarized holding potential. This was a significant difference in this and all of the other three cells examined (P < 0.01, KS test). The mean 20–80% growth time of sIPSCs in cerebellar granule cells was completely unaltered by membrane depolarization (Fig. 1B and D), indicating that the voltage-dependent alterations in sIPSC kinetics arose entirely from changes in the decay phase of the response.
The decay kinetics of IPSCs can be determined by a number of factors including agonist unbinding (Busch & Sakmann, 1990; Mody et al. 1994; Jones & Westbrook, 1995), desensitization (Jones & Westbrook, 1995, 1996), phosphorylation (Jones & Westbrook, 1997) and, under certain circumstances, agonist clearance and rebinding (Dingledine & Korn, 1985; Thompson & Gähwiler, 1992; Roepstorff & Lambert, 1994). At a holding potential of −70 mV, miniature IPSCs (mIPSCs) in granule cells exhibited a shorter half-width than their counterparts recorded in the absence of TTX (5.7 ± 0.3 ms, mIPSC (n = 29), versus10.1 ± 1.7 ms, sIPSC (n = 14); P < 0.01, Student's unpaired t test). This difference only reflects changes in the decay time of the IPSC, and most likely reflects a significant proportion of multiquantal responses in the sIPSC population. Like sIPSCs, the decay kinetics of mIPSCs were also voltage dependent. The fractional increase in mIPSC half-width produced by depolarization from −70 to +50 mV was not significantly different to that observed in the absence of TTX (data not shown).
Multiquantal release, such as that seen in the absence of TTX, is thought to generate somewhat longer-lasting and more spatially diffuse GABA transients, thereby producing broader IPSCs (Collingridge et al. 1984; Dingledine & Korn, 1985; Mody et al. 1994; Roepstorff & Lambert, 1994). Relevant to this, the GABA uptake inhibitor nipecotic acid (300 μM; Sigma) produced a small (117 ± 3%), but statistically significant, increase in the half-width of mIPSCs in five granule cells (5.7 ± 0.4 ms, control, versus6.7 ± 0.5 ms in nipecotic acid, P < 0.009, Student's paired t test; Fig. 1E). Nipecotic acid produced no changes in mIPSC amplitude (33.8 ± 3.6 pA, control, versus 34.4 ± 5.5 pA, drug), frequency (2.9 ± 1.5 Hz, control, versus2.3 ± 1.0 Hz, drug) or 20–80% growth time (480 ± 20 μs control versus 460 ± 10 μs drug). Statistical analysis revealed that the changes in mIPSC half-width produced by nipecotic acid were significantly smaller than those produced by depolarization of the postsynaptic membrane from −70 to +50 mV.
Depolarization slows deactivation of responses to exogenously applied GABA
At membrane potentials between −70 and +50 mV, 5 ms applications of 1 mM GABA produced rapidly activating, biexponentially decaying currents in nucleated macropatches isolated from cerebellar granule neurone cell bodies (Fig. 2A). Smaller, but kinetically indistinguishable currents were produced in conventional outside-out patches. Although these currents outwardly resembled the granule cell mIPSC, kinetic comparisons revealed that they were consistently longer lasting (see Mellor & Randall, 1997a, for details). This kinetic discrepancy presumably reflects either differences in the GABAA receptor subunits present, or different protein- protein interactions or post-translational processing at synaptic and somatic loci.
Figure 2. Slowed deactivation of the GABA responses at depolarized membrane potentials.
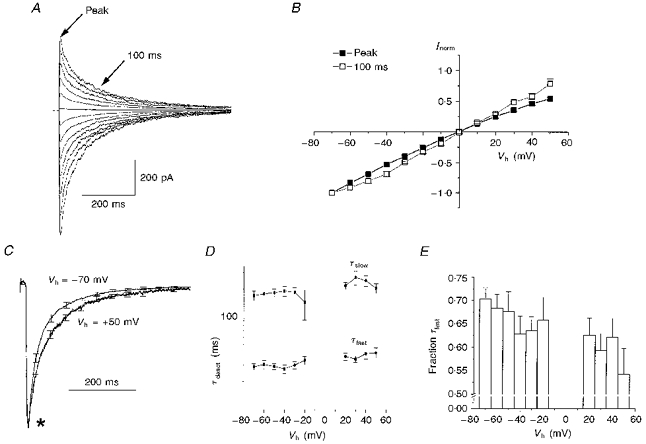
A, responses to 5 ms applications of 1 mM GABA recorded from a cell clamped at a range of holding potentials between −70 and +50 mV. The membrane potential was depolarized in 10 mV steps and an agonist application was made every 10 s. B, a graph plotting the mean peak current-voltage relationship (filled squares) from 14 cells, as described in A. For the purposes of comparison, the I-V relationship recorded 100 ms after the application of GABA is also shown (open squares). The arrows in A indicate from where in the GABA response the two I-V relationships were taken. Before averaging, the currents recorded at each potential were normalized to those recorded at −70 mV. Error bars are shown when larger than the plotted symbol. C, mean current responses to 5 ms applications of 1 mM GABA recorded at −70 mV and +50 mV. Data were obtained from 14 cells as described in A. Before inclusion in the overall mean, each current trace was normalized to its peak amplitude. Note that in the initial stages of deactivation the responses at −70 and +50 mV do not appear to deviate (asterisk). D, a graph plotting the membrane potential dependence of the fast (τfast) and slow (τslow) time constants of deactivation (τdeact). Data pooled from the means for the 14 cells described in C. Results from traces recorded at −10, 0 and +10 mV are not shown because the currents generated at these potentials were too small to allow reliable fitting. No statistically significant change was seen in either time constant over the range of potentials examined. E, a graph plotting the fraction of the total deactivation process mediated by the fast time constant of deactivation versus holding potential.
Like granule cell IPSCs, the responses to 5 ms applications of 1 mM GABA reversed polarity at holding potentials close to ECl (Fig. 2B, filled symbols). Analysis of the current- voltage relationship at different points within the time course of the GABA response (e.g. Fig. 2B, open symbols), and analysis of the decline in the mean chord conductance (between +50 and −70 mV) suggested that little or no change in ECl was inflicted by even the largest GABA responses produced in this preparation.
Figure 2C compares peak normalized mean current responses recorded at membrane potentials of −70 and +50 mV (n = 13). A clear broadening of the response was consistently seen at depolarized holding potentials. When the membrane potential was returned from +50 to −70 mV, the kinetics of deactivation immediately reverted to those seen prior to depolarization (data not shown). Notably, unlike later phases of the deactivation trajectory, the initial rate of deactivation appeared little altered by membrane depolarization (Fig. 2C, asterisk).
At each holding potential examined we fitted the deactivation trajectory with a biexponential function. The mean values of both the fast and slow time deactivation constants are plotted against holding potential in Fig. 2D. Statistical analysis revealed that there was no significant change in either time constant over the 120 mV potential range examined. In contrast, depolarization from −70 to +50 mV generated a statistically significant decrease in the mean fraction of the total decay associated with the faster time constant (from 0.70 ± 0.02 at −70 mV to 0.54 ± 0.06 at +50 mV, P < 0.007, Student's paired t test; Fig. 2E); a compensatory increase in the fraction of the total decay mediated by the slow time constant was also seen (data not shown).
Voltage-dependent macroscopic desensitization of GABAA receptors
In the light of other recent studies detailing the relationships between deactivation and desensitization (Jones & Westbrook, 1995; Tia et al. 1996a; Mellor & Randall, 1997a) we tested whether the desensitization kinetics of GABA responses were also voltage dependent. Figure 3A illustrates the mean current trajectories produced by 1500 ms applications of 1 mM GABA at holding potentials of −70 and +50 mV (n = 8). In this figure the responses recorded from each cell at −70 and +50 mV were normalized to the peak current amplitude recorded at −70 mV. Both inward- and outward-going currents exhibit marked desensitization. To facilitate comparison we re-normalized the currents to their own peak amplitude. This revealed that desensitization was faster at the more depolarized membrane potential. The rate of macroscopic desensitization was clearly altered right from the onset of the response (Fig. 3B, asterisk). On returning the membrane potential to −70 mV from +50 mV, the desensitization kinetics immediately reverted to their pre-depolarization rate (data not shown).
Figure 3. Depolarization enhances the rate of macroscopic desensitization.
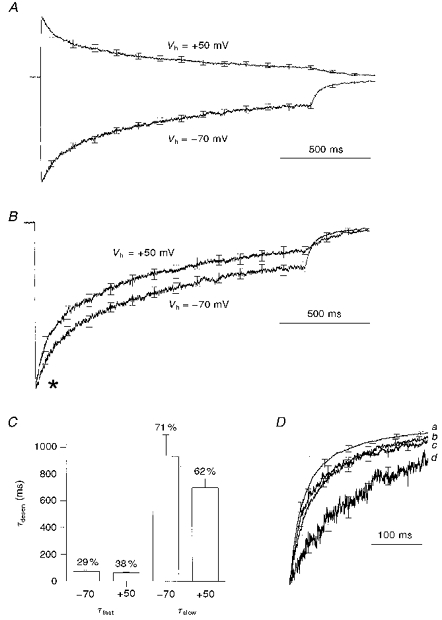
A, mean current responses to 1500 ms applications of 1 mM GABA at membrane potentials of −70 mV and +50 mV. Data pooled from 8 cells. Before averaging, data from each cell were normalized to the peak current amplitude recorded at −70 mV. B, the data from A re-displayed to indicate the differences in desensitization kinetics. Here, before averaging, the currents produced at each potential were normalized to the peak current recorded at that particular potential. Note that the rate of desensitization at +50 mV is clearly enhanced from the time macroscopic desensitization first becomes visible (asterisk). C, results from biexponential fitting to the macroscopic desensitization trajectories of the 8 cells averaged for A and B. The graph plots both the fast (τfast) and slow (τslow) time constants of desensitization (τdesen) at −70 and +50 mV. The small differences seen between the two potentials were not statistically significant. The percentage of the overall desensitization mediated by each component is indicated above the relevant bar. The contribution of the slow component decreases significantly (71 ± 2% to 62 ± 2%, Student's paired t test) on depolarizing from −70 to +50 mV. D, normalized mean deactivation trajectories from both long (1500 ms) and short (5 ms) applications of 1 mM GABA, recorded at holding potentials of −70 and +50 mV. The traces (a-d) correspond to the following applications of 1 mM GABA: a, 5 ms, −70 mV (n = 14); b, 5 ms, +50 mV (n = 14); c, 1500 ms, −70 mV (n = 8); d, 1500 ms, +50 mV (n = 8). Before being included in the appropriate mean, each trace was normalized to its current amplitude at the time of GABA removal.
At both −70 mV and +50 mV the macroscopic desensitization trajectories were well fitted by a biexponential decay. A comparison of the two exponential time constants and their respective contribution to the overall decay at −70 mV and +50 mV is shown in Fig. 3C. The small differences in the mean values of both the fast and slow desensitization time constants were not statistically significant. In contrast, at +50 mV there was a significant decrease in the percentage of the total decay mediated by the slower component of desensitization (71 ± 2%, −70 mV, versus 62 ± 2%, +50 mV; P < 0.02, Student's paired t test, n = 8).
In granule cells clamped at −70 mV the deactivation kinetics of GABA responses are dependent on the duration of the preceding agonist application (Mellor & Randall, 1997a). This also proved to be the case at positive membrane potentials (Fig. 3D). Comparison of the rates of deactivation after 1500 ms and 5 ms applications of GABA indicate there was a substantial slowing of deactivation at both −70 mV (compare a and c) and +50 mV (compare b and d). Interestingly, deactivation at −70 mV following a 1500 ms agonist application (c) occurs at a very similar rate to deactivation at +50 mV after a 5 ms agonist application (b).
Voltage-dependent desensitization with brief agonist pulses
Previous work has indicated that even brief exposures to GABA, similar to those believed to occur at central synapses, can produce significant desensitization of GABAA receptors (Jones & Westbrook, 1995; Tia et al. 1996a; Mellor & Randall, 1997a). This is best demonstrated with paired agonist applications where the desensitization produced during the first agonist challenge is assessed with an identical second agonist pulse applied sometime later. Using such protocols we investigated the voltage dependence of desensitization produced by brief, synaptically relevant, GABA transients. Figure 4A illustrates the mean normalized current waveforms from seven experiments in which paired 5 ms applications of 1 mM GABA were made at both −70 mV and + 50 mV. The interstimulus period was 150 ms. Re-normalization of these current traces revealed that the second current response peak was more depressed at +50 mV (Fig. 4B, arrows) than at −70 mV. A graph plotting the percentage depression of the second current peak relative to the first is shown in Fig. 4C. The difference observed is statistically significant and provides further evidence that desensitization is considerably accelerated at depolarized membrane potentials.
Figure 4. Depolarization enhances depression in paired agonist applications.
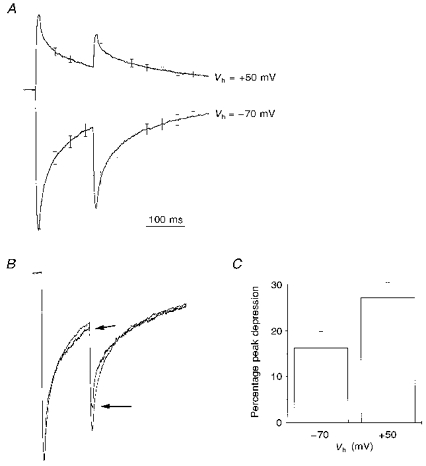
A, mean current traces from experiments in which two 5 ms pulses of 1 mM GABA were applied 150 ms apart. Data from 7 cells recorded at both −70 mV and +50 mV. Averaging was performed as described for Fig. 3A. B, the data from A replotted in order to compare the magnitude of paired pulse depression at −70 mV and +50 mV. The arrows indicate the data recorded at +50 mV. Data averaged as described for Fig. 3B. Error bars are omitted for clarity. C, a graph plotting the percentage depression of the second response with respect to the first for paired agonist applications performed at −70 mV and +50 mV. The depression is significantly greater at +50 mV than at −70 mV (16.2 ± 3.6%, −70 mV, versus27.1 ± 3.3%, +50 mV; P < 0.02, Student's paired t test).
Dose dependence of GABAA receptor desensitization in cerebellar granule cells
In our granule cells, at a holding potential of −70 mV, the EC50 for GABA, determined with rapid agonist application, lies between 30 and 50 μM (Mellor & Randall, 1997a). Most models of GABAA receptor gating predict that the fraction of desensitized channels should be a function of the fraction of receptors bearing ligand. We investigated the dose dependence of the desensitization process, using paired 120 ms applications of 10–1000 μM GABA. The time between the termination of the first agonist application and the start of the second agonist application was 150 ms. Current traces from a typical experiment are shown in Fig. 5A. Pooled data plotting the fractional depression seen in the second response versus agonist concentration are shown in Fig. 5B. The data have been fitted with a standard logistic equation of EC50, 38 μM and Hill coefficient, 1.6. The ‘EC50 for desensitization’, therefore, is very close to the mean EC50 value determined in conventional concentration- effect curves (i.e. peak current against GABA concentration; see Mellor & Randall, 1997a, for an example). This indicates that the fraction of the total receptor population that becomes desensitized closely follows the level of receptor occupancy. An extension of this is that, once bound with ligand, the probability that an individual receptor desensitizes is essentially independent of the agonist concentration.
Figure 5. Dose-dependence of GABAA receptor desensitization revealed with paired agonist applications.
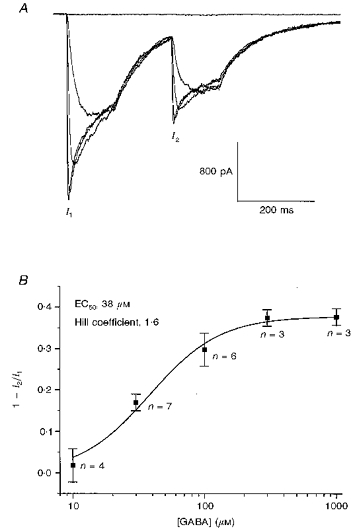
A, example of an experiment illustrating responses to paired 120 ms applications of 3, 30, 100, 300 and 1000 μM GABA. Amplitudes of the first (I1) and second (I2) GABA response are indictated. The time between the cessation of the first application and the start of the second application was 150 ms. B, a graph plotting pooled data from a number of experiments performed as described in A. The graph plots the fractional depression of the amplitude of the second GABA response with respect to the first. The data are fitted with a logistic function of EC50, 38 μM and Hill coefficient, 1.6. The number of observations pertaining to each data point are shown on the graph.
Interestingly, at very low doses of GABA (3 μM), paired agonist applications produced a 14 ± 4% potentiation in the amplitude of the second current (data not shown). This result presumably reflects the enhancing effects of residual bound ligand on the co-operative gating of the GABAA receptor by two agonist molecules (MacDonald & Twyman, 1992). It also may indicate that monoliganded GABAA receptors do not readily enter desensitized states.
Voltage-dependent deactivation with submaximally effective agonist applications
We examined whether deactivation remained voltage dependent at concentrations of GABA producing submaximal receptor activation. We chose to use 120 ms applications of 20 μM GABA: an agonist challenge that produced currents whose amplitude was ∼35% of those produced by maximally effective concentrations of GABA (i.e. ≥ 1 mM GABA). Although producing no visible macroscopic desensitization (Fig. 6A), the experiments shown in Fig. 5 predict that such an agonist challenge will desensitize around 10% of the total population of GABAA receptors. Responses recorded at a range of membrane potentials between −70 and +50 mV are shown in Fig. 6A. The current-voltage relationship pooled from twelve such recordings (Fig. 6A, inset) reveals that the reversal potential was not significantly different from that seen with 5 ms applications of 1 mM GABA (i.e. Fig. 2B).
Figure 6. Depolarization-induced slowing of deactivation with submaximally active GABA applications.

A, example of traces from a cell where 20 μM GABA was applied for 120 ms at holding potentials of between −70 and +50 mV. The membrane potential was incremented in 10 mV steps and an agonist application was made every 10 s. The inset shows the peak current-voltage relationship pooled from 12 such experiments; data at each potential were normalized to the current amplitude at −70 mV (error bars are partially obscured by the symbols). B, normalized mean activation trajectories (left) and deactivation trajectories (right) recorded at holding potentials of −70 and +50 mV. Data from 12 recordings, like that in A. Before being included in the overall mean, each sweep was normalized to the current amplitude observed at the point of GABA removal. Error bars from the averaging procedure are shown at occasional intervals. Note that the initial rates of deactivation at −70 and +50 mV appear very similar (asterisk).
The right-hand panel of Fig. 6B plots normalized, mean deactivation trajectories pooled from these twelve cells at holding potentials of −70 and +50 mV, and illustrates that voltage-dependent slowing of deactivation occurs in the absence of macroscopic desensitization. Repolarization of the membrane from +50 to −70 mV resulted in complete and instantaneous recovery of the pre-depolarization deactivation kinetics (data not shown). Like the responses elicited with 1 mM GABA (Fig. 2C), the kinetic differences between the data recorded at −70 and +50 mV were not readily apparent in the initial slope of the deactivation trajectory (Fig. 6B, asterisk).
As shown in Fig. 6B, no significant differences in the activation kinetics of responses to 20 μM GABA were found when traces recorded at −70 mV (τ= 46 ± 8 ms) and +50 mV (τ= 39 ± 6 ms) were compared (P > 0.18, Student's paired t test, n = 12). The absence of any differences in the initial slope of the activation trajectory suggests that depolarization does not favour ligand association. If a decrease in the rate of ligand unbinding was the source for slowed deactivation, one would expect the agonist affinity to appear voltage dependent. One argument against such a mechanism comes from the similarity of the I-V relationships recorded at saturating (Fig. 2B) and near EC50 agonist doses (Fig. 6A, inset). A voltage-dependent agonist affinity would, contrary to this, be expected to produce rectification in I-V relationships elicited with near EC50 concentrations of GABA.
To directly examine if agonist efficacy exhibited any measurable voltage dependence, we applied a near EC50 dose of GABA (30 μM) and a receptor-saturating dose (1 mM) of GABA to seven cells clamped at both −70 and +50 mV. Analysis of these experiments revealed that the fraction of maximum current recruited by 30 μM GABA was not significantly different at these two membrane potentials (51 ± 4% at −70 mV versus 54 ± 4% at +50 mV, P < 0.26, Student's paired t test; data not shown). These results indicate that, contrary to previous suggestions (Weiss, 1988), depolarization does not significantly alter the affinity of GABAA receptors.
Depolarization eliminates the effects of flunitrazepam on deactivation
The kinetic effects of membrane depolarization resemble the actions of benzodiazepine receptor agonists on the GABAA receptor (Mellor & Randall, 1997a). We were therefore interested to see if the membrane potential would in any way affect the actions of one such compound, flunitrazepam (Flu; Research Biochemicals). Figure 7 illustrates pooled data from four experiments in which 5 ms applications of 1 mM GABA were made at −70 and +50 mV, in both the presence and absence of Flu (1 μM). At −70 mV, Flu slowed deactivation, an effect particularly evident in later parts of the response (cf. Fig. 2C). In contrast, at +50 mV Flu produced no change in the GABA response whatsoever. Comparison of the control responses recorded in these same cells at −70 and +50 mV revealed that the slowing of deactivation produced by depolarization was of a similar magnitude to that produced by the benzodiazepine at −70 mV (compare Fig. 7A and B).
Figure 7. Membrane depolarization prevents the actions of Flu on GABAA receptor deactivation.
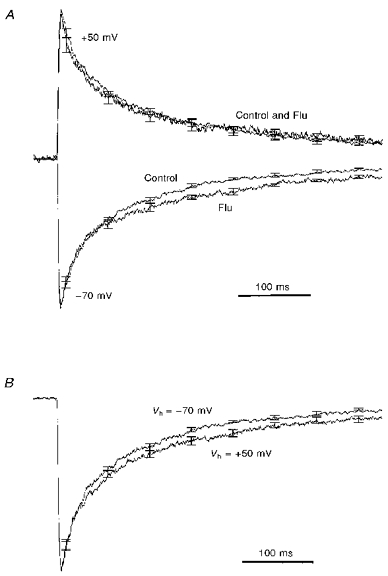
A, pooled, normalized current traces from 4 experiments in which responses to 5 ms applications of 1 mM GABA were recorded at −70 and +50 mV in the presence (Flu) and absence (Control) of 1 μM flunitrazepam (Flu). Note how the benzodiazepine slows deactivation at −70 mV but not +50 mV. Prior to inclusion in the overall mean, each trace was normalized to its peak current amplitude. B, a plot showing the effects of membrane potential on the deactivation of the control current traces shown in A. Note the very similar degree of slowing of deactivation produced by either depolarization to +50 mV or Flu application at −70 mV.
DISCUSSION
The kinetic relationships between excitatory and inhibitory synaptic inputs play an important part in determining the precise patterns of information transfer and storage in the CNS. Thus, understanding how the kinetics of synaptic currents are generated, and how they may be modified by physiological and pathological changes in the brain, are important goals in neurophysiology. The data presented in Fig. 1 demonstrate that the decay of IPSCs in cerebellar granule cells exhibits a significant voltage dependence: a finding in agreement with previous reports from other experimental systems (Collingridge et al. 1984; Segal & Barker, 1984; Barker & Harrison, 1988; Otis & Mody, 1992).
To address whether the channel kinetics of postsynaptic GABAA receptors were primarily responsible for the voltage-dependent kinetics of IPSCs, we used a ‘surrogate’ postsynaptic membrane consisting of an outside-out macropatch isolated from the cell body of a granule neurone. Although not without its limitations, this reductionist experimental approach eliminates contributions to kinetic effects arising from (i) changes in presynaptic function induced by postsynaptic depolarization (Alger & Pitler, 1995), (ii) changes in the synaptic lifetime of GABA (Dingledine & Korn, 1985; Thompson & Gähwiler, 1992; Roepstorff & Lambert, 1994), (iii) substantial changes in postsynaptic Ca2+ (Soltesz & Mody, 1995) and, presumably, (iv) changes in postsynaptic phosphorylation (Jones & Westbrook, 1997).
Using this system it was clear that membrane depolarization alone was capable of slowing the deactivation of responses to exogenously applied GABA. This was the case for both receptor-saturating agonist applications (Fig. 2) and sub-EC50 agonist applications (Fig. 6). Further observations indicated that membrane depolarization also enhanced the rate of both macroscopic and microscopic desensitization (Figs 3 and 4).
For a number of reasons it is unlikely that the kinetic effects of depolarization arise through the influence of intracellular Ca2+ concentration (Soltesz & Mody, 1995) or receptor phosphorylation (Jones & Westbrook, 1997). For instance although deprived of the contents of the cytoplasm, deactivation and desensitization both remained voltage dependent for as long as our recordings lasted (up to an hour in some cases). This was the case irrespective of whether nucleated or conventional outside-out patches were used. In addition, deactivation and desensitization kinetics rapidly follow membrane potential changes, whereas one would expect voltage-dependent changes due to phosphorylation to arise and decline quite slowly. A role for depolarization-gated Ca2+ entry can be rejected on a number of grounds including: (i) there is very little Ca2+ entry through Ca2+ channels at +50 mV, (ii) the kinetics of GABAA receptors remained voltage dependent long after any Ca2+ channel currents had completely run down or become inactivated, (iii) in all recordings the Ca2+ chelator EGTA (5 mM) was present on the intracellular side of the membrane.
Mechanistically, the voltage-dependent kinetics of the GABAA receptor imply that rate-limiting steps in both deactivation and desensitization must involve some transfer of charge within the membrane field (i.e. they are associated with a capacitive charge movement or gating current). Similar effects have been reported for other ligand-gated channels such as the nicotinic acetylcholine receptor (Magleby & Stevens, 1972; Auerbach, Sigurdson, Chen & Akk, 1996). To examine how the voltage dependence of GABAA receptor kinetics might be generated, we used kinetic modelling to simulate the gating behaviour of the GABAA receptor under a variety of conditions. To comply with our own single channel observations (J. R. Mellor & A. D. Randall, unpublished observations) and the biexponential desensitization kinetics (Fig. 3), models were assigned with two open states and two desensitized states. Using suitable rate constants, the gating scheme proposed by Jones & Westbrook (1995) and a related scheme with two sequential biliganded desensitized states, both provided good approximations of the activation, deactivation and desensitization behaviour of the GABAA receptor at −70 mV, over a wide range of agonist concentrations (data not shown).
By varying single transition rate constants in either model, however, we were never able to reproduce changes in simulated GABA response like those produced by membrane depolarization. In particular, manipulations that slowed deactivation had either no effect on, or in many cases slowed, desensitization (see also Jones & Westbrook, 1995). This suggests that neither of the gating schemes represents a useful approximation of the gating mechanics of the GABAA receptor, or that more than one transition rate constant exhibits significant voltage dependence. Although we cannot discount the former, the latter possibility seems plausible since individual states of the GABAA receptor all presumably represent distinct and stable molecular conformations, each with its own characteristic distribution of charge within the membrane field; as such, transitions between several states are likely to exhibit some degree of voltage dependence.
The pooled traces shown in Fig. 3D indicate that deactivativation occurs at a similar rate following a 1500 ms application of 1 mM GABA at −70 mV and a 5 ms application of 1 mM GABA at +50 mV, even though the degree of desensitization produced by the former protocol is greater than that produced by the latter (compare Fig. 3B with Fig. 4B). These observations are indicative that the voltage dependence of deactivation does not only reflect the fraction of channels resident in a desensitized state prior to agonist removal. In the absence of changes to the agonist unbinding rate constant, this observation may indicate that the recovery from desensitization is slowed at depolarized membrane potentials.
In a previous study (Mellor & Randall, 1997a) we demonstrated that the kinetic effects of benzodiazepines on GABAA receptors were to slow GABAA receptor deactivation and speed GABAA receptor desensitization. These effects are the same as those produced by membrane depolarization. The occlusion of the effects of Flu by membrane depolarization indicate that these two means to alter GABAA receptor kinetics are likely to share a common mechanism. Or put another way, the binding of benzodiazepine antagonists favours the same states as membrane depolarization. In the light of this observation, it will be interesting to assess the voltage dependence of deactivation and desensitization of benzodiazepine-insensitive GABAA receptors (e.g. those containing the α6-subunit).
The physiological relevance of the voltage dependence of GABAA receptor kinetics is currently unclear. It is, however, possible to put forward a number of plausible, and in many circumstances testable, hypotheses. Prolonged inhibitory currents at depolarized potentials will serve to counter coincident synaptic excitation more efficiently. This can be regarded as a classical negative feedback mechanism and may be of particular importance in suppressing the highly voltage-dependent, long-lived, NMDA receptor-mediated EPSP. Against this, it could be argued that because neurones spend only brief periods at strongly depolarized membrane potentials, the voltage-dependent kinetics of the GABAA receptor have little physiological relevance. In this light, it is worth pointing out that where monosynaptic excitation and bisynaptic feed-forward inhibition co-exist (such as in the hippocampus, cortex and cerebellum), back-propagating dendritic action potentials (Stuart & Sakmann, 1994) are likely to coincide with the transmitter lifetime at GABAergic synapses. Such dendritic action potentials are considerably broader than their somatic counterparts and thus may more readily serve to alter GABAA receptor kinetics. In this respect it would be enlightening to compare the kinetics of GABAergic IPSPs following sub- and supra-threshold synaptic stimulation.
Although both deactivation and desensitization rates are affected by the postsynaptic membrane potential, physiologically the latter may be the more important mechanism. Significant desensitization occurs with even brief exposures to GABA (Jones & Westbrook, 1995; Tia et al. 1996b; Mellor & Randall, 1997a), an effect that is enhanced by membrane depolarization (Fig. 4). In addition, recovery from desensitization (resensitization) of GABAA receptors is typically quite slow (Jones & Westbrook, 1995; Tia et al. 1996b; Mellor & Randall, 1997a). As such, GABAergic synaptic activation coincident with action potential firing could produce a much greater cumulative depression of inhibitory inputs than would be seen in non-coincident inputs. Such an effect may contribute to the collapse of inhibition and the subsequent generation of NMDA receptor-mediated synaptic potentials during periods of high frequency suprathreshold stimulation.
Acknowledgments
We would like to thank Dr Matt Jones (Oregon Health Sciences University) for his comments on the data shown herein and Dr Ceri Davies for advice on uptake inhibitors. J. R. M. is an MRC funded PhD student.
References
- Alger BE, Pitler TA. Retrograde signalling at GABAA receptor synapses in the mammalian CNS. Trends in Neurosciences. 1995;18:333–340. doi: 10.1016/0166-2236(95)93923-l. 10.1016/0166-2236(95)93923-L. [DOI] [PubMed] [Google Scholar]
- Auerbach A, Sigurdson W, Chen J, Akk G. Voltage dependence of mouse acetylcholine receptor gating: different charge movements in di-, mono- and unliganded receptors. Journal of Physiology. 1996;494:155–170. doi: 10.1113/jphysiol.1996.sp021482. [DOI] [PMC free article] [PubMed] [Google Scholar]
- Barker JL, Harrison NL. Outward rectification of inhibitory postsynaptic currents in cultured rat hippocampal neurones. Journal of Physiology. 1988;403:41–55. doi: 10.1113/jphysiol.1988.sp017237. [DOI] [PMC free article] [PubMed] [Google Scholar]
- Benardo LS. GABAA receptor-mediated mechanisms contribute to frequency-dependent depression of IPSPs in the hippocampus. Brain Research. 1993;607:81–88. doi: 10.1016/0006-8993(93)91491-a. [DOI] [PubMed] [Google Scholar]
- Busch C, Sakmann B. Synaptic transmission in hippocampal neurons: numerical reconstruction of quantal IPSCs. Cold Spring Harbor Symposia on Quantitative Biology. 1990;55:69–80. doi: 10.1101/sqb.1990.055.01.009. [DOI] [PubMed] [Google Scholar]
- Celentano JJ, Wong RK. Multiphasic desensitisation of the GABAA receptor in outside-out patches. Biophysical Journal. 1994;66:1039–1050. doi: 10.1016/S0006-3495(94)80885-9. [DOI] [PMC free article] [PubMed] [Google Scholar]
- Collingridge GL, Gage PW, Robertson B. Inhibitory post-synaptic currents in rat hippocampal CA1 neurones. Journal of Physiology. 1984;356:551–564. doi: 10.1113/jphysiol.1984.sp015482. [DOI] [PMC free article] [PubMed] [Google Scholar]
- Dingledine R, Korn SJ. γ-Aminobutyric acid uptake and the termination of inhibitory synaptic potentials in the rat hippocampal slice. Journal of Physiology. 1985;366:387–409. doi: 10.1113/jphysiol.1985.sp015804. [DOI] [PMC free article] [PubMed] [Google Scholar]
- Frosch MP, Lipton SA, Dichter MA. Desensitization of GABA-activated currents and channels in cultured cortical neurons. Journal of Neuroscience. 1992;12:3042–3053. doi: 10.1523/JNEUROSCI.12-08-03042.1992. [DOI] [PMC free article] [PubMed] [Google Scholar]
- Gingrich KJ, Roberts WA, Kass RS. Dependence of the GABAA receptor gating kinetics on the α-subunit isoform: implications for structure-function relations and synaptic transmission. Journal of Physiology. 1995;489:529–543. doi: 10.1113/jphysiol.1995.sp021070. [DOI] [PMC free article] [PubMed] [Google Scholar]
- Hablitz JJ. Voltage-dependence of GABAA-receptor desensitization in cultured chick cerebral neurons. Synapse. 1992;12:169–171. doi: 10.1002/syn.890120210. [DOI] [PubMed] [Google Scholar]
- Jones MV, Westbrook GL. Desensitized states prolong GABAA channel responses to brief agonist pulses. Neuron. 1995;15:181–191. doi: 10.1016/0896-6273(95)90075-6. 10.1016/0896-6273(95)90075-6. [DOI] [PubMed] [Google Scholar]
- Jones MV, Westbrook GL. The impact of receptor desensitization on fast synaptic transmission. Trends in Neurosciences. 1996;19:96–101. doi: 10.1016/s0166-2236(96)80037-3. 10.1016/S0166-2236(96)80037-3. [DOI] [PubMed] [Google Scholar]
- Jones MV, Westbrook GL. Shaping of inhibitory postsynaptic currents by endogenous calcineurin activity. Journal of Neuroscience. 1997;17:7626–7633. doi: 10.1523/JNEUROSCI.17-20-07626.1997. [DOI] [PMC free article] [PubMed] [Google Scholar]
- Llano I, Leresche N, Marty A. Calcium entry increases the sensitivity of cerebellar Purkinje cells to applied GABA and decreases inhibitory synaptic currents. Neuron. 1991;6:565–574. doi: 10.1016/0896-6273(91)90059-9. 10.1016/0896-6273(91)90059-9. [DOI] [PubMed] [Google Scholar]
- McCarren M, Alger BE. Use-dependent depression of IPSPs in rat hippocampal pyramidal cells in vitro. Journal of Neurophysiology. 1985;53:557–571. doi: 10.1152/jn.1985.53.2.557. [DOI] [PubMed] [Google Scholar]
- MacDonald RL, Twyman RE. Kinetic properties and regulation of GABAA receptor channels. In: Narahashi T, editor. Ion Channels. Vol. 3. New York: Plenum Press; 1992. pp. 315–343. [DOI] [PubMed] [Google Scholar]
- Magleby KL, Stevens CF. The effect of voltage on the time course of endplate currents. Journal of Physiology. 1972;223:173–197. [Google Scholar]
- Mathers DA. Activation and inactivation of the GABAA receptor: insights from comparison of native and recombinant subunit assemblies. Canadian Journal of Physiology and Pharmacology. 1991;69:1057–1063. doi: 10.1139/y91-157. [DOI] [PubMed] [Google Scholar]
- Mellor JR, Randall AD. Novel frequency-dependent actions of benzodiazepines at GABAA receptors in cultured murine cerebellar granule cells. Journal of Physiology. 1997a;503:353–369. doi: 10.1111/j.1469-7793.1997.353bh.x. [DOI] [PMC free article] [PubMed] [Google Scholar]
- Mellor JR, Randall AD. Zn2+ and benzodiazepines alter deactivation of GABA responses in cultured murine cerebellar granule cells. Journal of Physiology. 1997b;499:27P. doi: 10.1111/j.1469-7793.1998.377bw.x. [DOI] [PMC free article] [PubMed] [Google Scholar]
- Mody I, De Koninck Y, Otis TS, Soltesz I. Bridging the cleft at GABA synapses in the brain. Trends in Neurosciences. 1994;17:517–525. doi: 10.1016/0166-2236(94)90155-4. 10.1016/0166-2236(94)90155-4. [DOI] [PubMed] [Google Scholar]
- Otis TS, Mody I. Modulation of decay kinetics and frequency of GABAA receptor-mediated spontaneous inhibitory post-synaptic currents in hippocampal neurons. Neuroscience. 1992;49:13–32. doi: 10.1016/0306-4522(92)90073-b. 10.1016/0306-4522(92)90073-B. [DOI] [PubMed] [Google Scholar]
- Randall AD, Deisseroth K, Tsien RW. Excitatory and inhibitory synaptic connectivity between cultured rat cerebellar granule cells. Journal of Physiology. 1993;473:153P. [Google Scholar]
- Roepstorff A, Lambert JD. Factors contributing to the decay of the stimulus-evoked IPSC in rat hippocampal CA1 neurons. Journal of Neurophysiology. 1994;72:2911–2926. doi: 10.1152/jn.1994.72.6.2911. [DOI] [PubMed] [Google Scholar]
- Segal M, Barker JL. Rat hippocampal neurons in culture: voltage-clamp analysis of inhibitory synaptic connections. Journal of Neurophysiology. 1984;52:469–487. doi: 10.1152/jn.1984.52.3.469. [DOI] [PubMed] [Google Scholar]
- Soltesz I, Mody I. Ca2+-dependent plasticity of miniature inhibitory postsynaptic currents after amputation of dendrites in central neurons. Journal of Neurophysiology. 1995;73:1763–1773. doi: 10.1152/jn.1995.73.5.1763. [DOI] [PubMed] [Google Scholar]
- Stuart GJ, Sakmann B. Active propagation of somatic action potentials into neocortical pyramidal cell dendrites. Nature. 1994;367:69–72. doi: 10.1038/367069a0. 10.1038/367069a0. [DOI] [PubMed] [Google Scholar]
- Thompson SM, Gähwiler BH. Activity-dependent disinhibition. I. Repetitive stimulation reduces IPSP driving force and conductance in hippocampus in vitro. Journal of Neurophysiology. 1989a;61:501–511. doi: 10.1152/jn.1989.61.3.501. [DOI] [PubMed] [Google Scholar]
- Thompson SM, Gähwiler BH. Activity-dependent disinhibition. II. Effects of extracellular potassium, furosemide, and membrane potential on ECl− in hippocampal CA3 neurons. Journal of Neurophysiology. 1989b;61:512–523. doi: 10.1152/jn.1989.61.3.512. [DOI] [PubMed] [Google Scholar]
- Thompson SM, Gähwiler BH. Effects of the GABA uptake inhibitor tiagabine on inhibitory synaptic potentials in rat hippocampal slice cultures. Journal of Neurophysiology. 1992;67:1698–1701. doi: 10.1152/jn.1992.67.6.1698. [DOI] [PubMed] [Google Scholar]
- Tia S, Wang JF, Kotchabhakdi N, Vicini S. Developmental changes of inhibitory synaptic currents in cerebellar granule neurons: Role of the GABAA receptor α6 subunit. Journal of Neuroscience. 1996a;16:3630–3640. doi: 10.1523/JNEUROSCI.16-11-03630.1996. [DOI] [PMC free article] [PubMed] [Google Scholar]
- Tia S, Wang JF, Kotchabhakdi N, Vicini S. Distinct deactivation and desensitization kinetics of recombinant GABAA receptors. Neuropharmacology. 1996b;35:1375–1382. doi: 10.1016/s0028-3908(96)00018-4. 10.1016/S0028-3908(96)00018-4. [DOI] [PubMed] [Google Scholar]
- Toth K, Freund TF, Miles R. Disinhibition of rat hippocampal pyramidal cells by GABAergic afferents from the septum. Journal of Physiology. 1997;500:463–474. doi: 10.1113/jphysiol.1997.sp022033. [DOI] [PMC free article] [PubMed] [Google Scholar]
- Verdoon TA. Formation of a heteromeric γ-aminobutyric acid type A receptor containing two different α subunits. Molecular Pharmacology. 1994;25:475–480. [PubMed] [Google Scholar]
- Vincent P, Armstrong CM, Marty A. Inhibitory synaptic currents in rat cerebellar Purkinje cells: modulation by postsynaptic depolarization. Journal of Physiology. 1992;456:453–471. doi: 10.1113/jphysiol.1992.sp019346. [DOI] [PMC free article] [PubMed] [Google Scholar]
- Webb AV, Mellor JR, Grant A, Randall AD. Unusual low-affinity benzodiazepine insensitive GABAA receptors in cultured rat O-2A progenitor cells. Journal of Physiology. 1997;501P:20P. [Google Scholar]
- Weiss DS. Membrane potential modulates the activation of GABA-gated channels. Journal of Neurophysiology. 1988;59:514–527. doi: 10.1152/jn.1988.59.2.514. [DOI] [PubMed] [Google Scholar]
- Yoon KW. Voltage-dependent modulation of GABAA receptor channel desensitization in rat hippocampal neurons. Journal of Neurophysiology. 1994;71:2151–2160. doi: 10.1152/jn.1994.71.6.2151. [DOI] [PubMed] [Google Scholar]