

Abstract
Whole cell patch clamp recordings of neurons in slices of the suprachiasmatic nucleus (SCN) were made in order to assess their electrophysiological and morphological heterogeneity. This assessment was accomplished by (i) quantification of intrinsic membrane properties recorded in current clamp mode, (ii) studying frequency distributions of these properties, (iii) grouping of cells based on visual inspection of data records, and (iv) use of cluster analysis methods.
Marked heterogeneity was found in the resting membrane potential, input resistance, time constant, rate of frequency adaptation, size of rebound depolarization (low-threshold Ca2+ potential) and regularity of firing. The frequency distribution of these membrane properties deviated significantly from a normal distribution. Other parameters, including spike amplitude and width, amplitude and rising slope of the spike after-hyperpolarization (AHP) and amplitude of the spike train AHP, showed considerable variability as well but generally obeyed a normal distribution.
Visual inspection of the data led to partitioning of cells into three clusters, viz. cluster I characterized by monophasic spike AHPs and irregular firing in the frequency range from 1.5 to 5.0 Hz; cluster II with biphasic spike AHPs and regular firing in the same range; and cluster III with large rebound depolarizations and biphasic spike AHPs. In a post hoc analysis, these clusters also appeared to differ in other membrane properties. This grouping was confirmed by hierarchical tree clustering and multidimensional scaling.
The light microscopic properties of recorded neurons were studied by biocytin labelling. Neurons had monopolar, bipolar or multipolar branching patterns and were often varicose. Axons sometimes originated from distal dendritic segments and usually branched into multiple collaterals. Many cells with extra-SCN projections also possessed intranuclear axon collaterals. We found no morphological differences between clusters except that cluster III neurons possessed more axon collaterals than cluster I or II cells.
These results suggest that SCN neurons are heterogeneous in some basic as well as active membrane properties and can be partitioned into at least three clusters. Cluster I and II cells fire spontaneously in a regular and irregular mode, respectively, and sustain prolonged spike trains. In contrast, cluster III cells have low firing rates but may adopt a burst-like firing mode when receiving appropriate input. While all clusters transmit output to target cells within and outside SCN, cluster III cells in particular are suggested to affect excitability of large numbers of SCN neurons by their extensive local network of axon collaterals.
In mammals, circadian rhythms in physiological functions such as body temperature, locomotor activity, sleep/waking and corticosterone and melatonin release originate within the suprachiasmatic nucleus (SCN; Moore & Eichler, 1972; Stephan & Zucker, 1972; Ralph, Foster, Davis & Menaker, 1990). The biological clock located in the SCN is entrained to the external light-dark cycle by way of the retinohypothalamic tract. It distributes its circadian output to a number of hypothalamic areas such as the paraventricular and dorsomedial nuclei of the hypothalamus as well as to the paraventricular nucleus of the thalamus (Watts, 1991; Hermes, Coderre, Buijs & Renaud, 1996). To an important extent this output is transferred to target areas by way of circadian changes in spontaneous firing rate (SFR) of SCN cells (Inouye & Kawamura, 1979; Schwartz, Gross & Morton, 1987), although diffusible factors may also contribute (Silver, Lesauter, Tresco & Lehman, 1996). Recently, Welsh, Logothetis, Meister & Reppert (1995) found a strong cell-autonomous circadian rhythm in SFR in dissociated SCN cell cultures grown on multi-electrodes plates. Despite the finding that the percentage of cells exhibiting such rhythmicity was relatively high in these cultures (53 %), it is difficult to extrapolate these results to the SCN in situ. Furthermore, it remains a question whether autorhythmic SCN cells directly receive photic inputs and project to target structures, or whether there exist distinct classes of retinocipient and output cells in addition to autorhythmic cells.
As a prelude to answering these fundamental questions, we have assessed the electrophysiological heterogeneity of SCN neurons by whole cell patch clamp recording in slices. In conjunction with membrane properties, their morphological properties were studied by means of biocytin staining. Examining this heterogeneity may help to answer the question whether the SCN consists of distinct neuronal groups each of which makes a unique functional contribution to circadian timing. It may also advance our understanding of the functional roles of anatomically and biochemically distinct groups of SCN cells. Most SCN cells are thought to release GABA and one or more colocalizing peptides such as vasopressin, somatostatin or vasoactive intestinal polypeptide (VIP). Whereas VIP-containing neurons are thought to relay photic information to other SCN cells (Ibata et al. 1989), somatostatin- and vasopressin-containing neurons may be more intimately linked to autonomous clock function. In contrast to VIP, vasopressin exhibits a day- night rhythm in release from SCN slices (Earnest & Sladek, 1986) and, in the SCN in vivo, vasopressin and somatostatin peptide and mRNA content shows a circadian rhythm even under constant dark conditions (Inouye, 1996). It will be important to ultimately link this biochemical heterogeneity to the diversity of intrinsic membrane properties described here.
While several important pioneering studies have previously examined membrane properties of SCN neurons in slices (Wheal & Thomson, 1984; Kim & Dudek, 1993; Akasu, Shoji & Hasuo, 1993; Jiang, Yang, Liu & Allen, 1997a), the present approach provides new information for several reasons. Firstly, we employed the whole cell patch clamp technique instead of sharp microelectrodes which have thus far predominantly been used in SCN. Whole cell recording avoids the problem of electrode shunting (Pongracz, Firestein & Shepherd, 1991; Staley, Otis & Mody, 1992) and may thereby offer a more accurate view of properties mediated by ionic conductances that are small in amplitude. We should add that intracellular dialysis during the whole cell procedure may remove cytoplasmic modulators and may thus highlight non-modulated states of ionic conductances. Secondly, previous studies have either focused on a limited class of SCN neurons, viz. retinocipient neurons (Kim & Dudek, 1993), or did not approach the problem of heterogeneity by studying statistical distributions of parameters (Wheal & Thomson, 1984; Akasu et al. 1993; Jiang et al. 1997a). We have quantified a large number of parameters characterizing membrane properties in current clamp mode and used multivariate cluster analysis (Gordon, 1981; Everitt, 1993) to aid in assessing the possible existence of distinct classes of neurons. Thirdly, while the morphology of SCN cells has been recently linked to membrane properties recorded in voltage-clamp mode (Jiang et al. 1997a), the present study examines morphology in conjunction with current clamp recordings, which may offer a more integrated view on their electrophysiological behaviour.
METHODS
Patch clamp experiments under visual control
Male Wistar rats (180-300 g) were housed in a room kept under constant conditions (temperature, 22-24°C; humidity, 65-75 %; 12:12 h light-dark cycle) for at least 3 weeks prior to use. The methods for preparation of and recording from slices have been described extensively in Pennartz, Bierlaagh & Geurtsen (1997). Briefly, rats were perfused transcardially with 50 ml ice-cold artificial cerebrospinal fluid (ACSF) under Nembutal anaesthesia (60 mg kg−1 pentobarbitone i.p.; Sanofi Sante, The Netherlands) and decapitated with a guillotine, in accordance with national guidelines on animal experiments. Slices were always prepared during the day period. After the brain was removed from the skull and cooled in ice-cold, oxygenated ACSF, coronal hypothalamic slices (250 μm) containing the SCN were cut on a vibratome (Vibroslicer, Campden Instruments, London). After recovering for at least 45 min, they were either stored in a chamber gassed with 95 % O2-5 % CO2 and kept at room temperature (21-24°C) or transferred to a recording chamber. In this chamber, which was mounted on an upright microscope with fixed stage (Axioskop, Carl Zeiss), slices were submerged and fixed to the bottom using a U-shaped frame of flattened platinum wire. Individual neurons well below the surface of the slice were visualized using a water immersion objective (×40; working distance, 1.9 mm; numerical aperture, 0.75) with Hoffman modulation contrast. Superfusion speed was 1.5-2.5 ml min−1. The ACSF was continuously oxygenated and contained (mM): 124.0 NaCl, 3.5 KCl, 26.2 NaHCO3, 1.0 NaH2PO4, 1.3 MgSO4, 2.5 CaCl2, 10.0 D-Glucose (pH 7.3; 29-31°C).
Recording pipettes were filled with (mM): 135.0 potassium gluconate, 10.0 KCl, 10.0 Hepes, 0.5 EGTA, 5.0 biocytin, 2.0 Na2ATP (pH 7.3; osmolality, 270-275 mosmol kg−1). Positive pressure was used to keep pipette tips (4-8 MΩ) clean while descending to the soma of a visually selected neuron. Seal resistances varied between 3 and 30 GΩ. After membrane rupture by mouth suction, a stabilization period of about 10 min was taken into account before assessing membrane properties in current clamp mode.
Voltage traces were acquired and analysed using an Axopatch-1D or Axoclamp-2B amplifier, a Digidata 1200 interface, the pCLAMP 6.02 suite of programs and Axotape 2.0 (all from Axon Instruments). Following electrode capacitance compensation when using the Axopatch-1D amplifier, no systematic differences in action potential amplitude or shape were detected as compared with the Axoclamp-2B amplifier, arguing against gross distortions due to current absorption as described by Magistretti, Mantegazza, Guatteo & Wanke (1996). The sampling rate was 5 or 10 kHz. All voltage measurements were corrected for the liquid junction potential, which amounted to -13 mV as determined according to the method described by Neher (1992). Numerical values are expressed as means ±s.e.m.
‘Blind’ patch clamp experiments
The methods employed in this series of experiments were the same as described above except for the following. Rat brains were neither anaesthetized nor cooled by transcardial perfusion prior to decapitation. Slices were cut at a thickness of 500 μm instead of 250 μm. They were held submerged in a custom-built recording chamber. Recordings were all made at room temperature (20-23°C). Cell approach and sealing followed the method of Blanton, Lo Turco & Kriegstein (1989) and were guided by series resistance changes monitored with current responses to square voltage pulses.
Biocytin labelling and three-dimensional reconstruction
Following recording under visual control, the position of the neuron was marked in a sketch of the slice to facilitate identification of labelled neurons after the immunocytochemical procedure. Slices containing biocytin-filled neurons were fixed for at least 12 h in 4 % paraformaldehyde or 4 % formaldehyde dissolved in 0.1 M phosphate buffer (pH 7.4-7.6 at 4°C), stored for at least 24 h in Tris-buffered saline (TBS; pH 7.4-7.6; 0.05 M Tris and 0.15 M NaCl) with 0.05 % sodium azide. Following washout of sodium azide in TBS for 1 h, slices were incubated for 1 h in TBS containing 0.25 % gelatine, 0.5 % Triton X-100 and 1.2 mg ml−1 streptavidin-Cy3 (Jackson ImmunoResearch, West Grove, PA, USA). Slices were mounted on coated glass slides and covered with VectashieldTM (Vector Labs, Burlingame, CA, USA). A confocal scanning laser microscope (Zeiss-Kontron, Jena, Germany) was used to produce optical sections (1 μm) of fluorescently labelled cells. These sections were superimposed to reconstruct cell morphology in three dimensions. To examine the morphology of cells in living slice tissue, we filled pipettes with potassium gluconate-based solution (see above) containing 0.5 % sulphorhodamine B (Molecular Probes).
Quantification of membrane properties
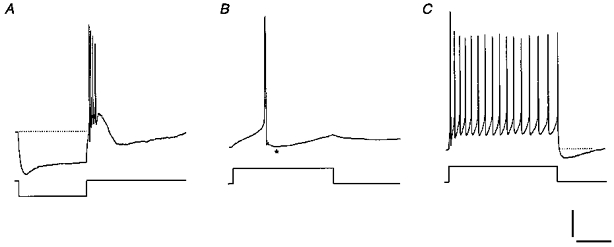
Resting membrane potential (Vrest) refers to the low-pass readout of the electrode amplifier and was corrected for offset potentials after terminating the recording. The input resistance and time constant were determined by fitting voltage responses to hyperpolarizing current pulses (1 s duration) with a monoexponential function in the linear part of the I-V relationship. Currents up to -30 pA (1 s) were usually sufficient to allow assessment of time-dependent inward rectification and rebound depolarization as well as rebound spikes. Calculation of the area of the rebound depolarization was limited to the first 150 ms after termination of the hyperpolarization (Fig. 1A) to avoid contaminating effects of ensuing, long-lasting after-hyperpolarizations (AHPs; Fig. 1A). The spike amplitude was quantified as the difference between peak voltage and Vrest and the spike width was determined at half-amplitude (Fig. 1B). The amplitude of the spike AHP was taken as being equal to the difference between spike threshold and the most negative voltage reached during the AHP (Fig. 1B). The slope of the spike AHP was determined across a period of 5 ms following completion of spike repolarization (Fig. 1C). These spike parameters refer to the properties of spontaneously generated spikes or, in the case of silent cells, of spikes elicited by injection of threshold current.
Figure 1. Quantification of membrane properties recorded in current clamp mode.
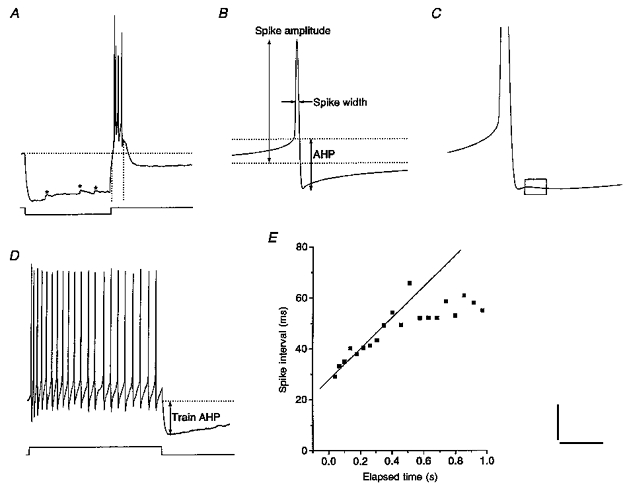
A, a current pulse of -40 pA revealed moderate time-dependent inward rectification. Upon release of negative current, the cell generated a large rebound depolarization carrying 4 spikes. This event was followed by a prolonged after-hyperpolarization. Asterisks mark spontaneous synaptic inputs. Horizontal dotted line indicates baseline and vertical dotted lines mark the 150 ms across which the area of the rebound depolarization was determined. B, the spike amplitude was measured with respect to baseline (lower dotted line). Upper dotted line indicates spike threshold level. The spike AHP was quantified as the difference between spike threshold and most negative voltage reached during the AHP. C, enlargement of spike and AHP in a different cell; rectangular box indicates the region across which the slope of the spike AHP was measured. Note the biphasic waveform of the AHP. D, a current pulse (+40 pA) evoked a spike train in another cell exhibiting moderate frequency adaptation. Spike train AHP was quantified by subtracting baseline level (dotted line) from the most negative voltage during the AHP. E, plot of spike interval versus time elapsed since onset of spike train. The regression line fitted to the initial part of the curve served as a measure for frequency adaptation. Records A-E are from different cells except D and E. Scale bars: A, 25 mV, 500 ms; B, 20 mV, 20 ms; C, 9 mV, 10 ms; D, 20 mV, 330 ms.
Frequency adaptation was quantified by measuring successive spike intervals in a train evoked by current pulses of +30 to +40 pA (1 s; Fig. 1D). These spike intervals were plotted against the time elapsed since train onset. The increase in spike interval during the initial part of the curve was estimated by linear regression (Fig. 1E). The slope of the regression line was taken as a measure of frequency adaptation. The amplitude of the spike train AHP was quantified by taking the difference between the Vrest and the most negative voltage reached during the slow AHP following the spike train (Fig. 1D). The presence of spontaneous postsynaptic potentials (which in the SCN primarily consist of GABAA receptor-mediated events) was qualitatively assessed by hyperpolarizing the cell to around -90 or -100 mV. Finally, patterns of spontaneous firing were studied by recording the membrane potential for at least 1 min (usually 2-3 min depending on the SFR). The coefficient of variation (CV) of spike intervals equals the standard deviation divided by the mean.
Cluster analysis
Grouping of cells by visual inspection of membrane properties was complemented with two multivariate statistical techniques, viz. hierarchical cluster analysis and multidimensional scaling (Statistica, Statsoft, Tulsa, OK, USA). Both techniques can aid in uncovering structure in data sets and can suggest a scheme for classification. They do not permit rigorous conclusions about groupings of objects, nor do they produce any measure of statistical significance for property differences between suggested groups. Thus, they should be regarded primarily as objective tools to corroborate groupings produced by visual inspection. In particular, when there is disagreement between subjective judgement and statistical analysis, they may serve to disqualify a proposed grouping (Erickson, Rodgers & Sarle, 1993). Conversely, when cluster analysis yields similar classification results as obtained on a subjective basis, the proposed grouping gains in reliability (Everitt, 1993).
Both hierarchical clustering and multidimensional scaling operate on a matrix that contains a measure for the dissimilarity between parameter values for all pairs of cells within the overall population. In hierarchical tree clustering, dissimilarities are expressed as distances in a space of as many dimensions as the number of parameters taken into account. In the present study we used Euclidean distances between objects. These distances were computed on the basis of standardized values to remove the effect of scaling differences between parameters. Values were standardized according to the following transformation: standardized value = (raw value - mean)/standard deviation. The plots in Figs 9B and 10C show aggregation schemes beginning with individual cells at the bottom and grouping them into hierarchically nested clusters with increasing linkage distance. When linkage distance is small, highly similar cells are joined into a small, low-level cluster, whereas high linkage distances yield large clusters of more dissimilar cells, often spanning multiple lower branches of the dendrogram. Thus, linkage distance provides a criterion for progressively joining together cells with increasing dissimilarity. In this study the linkage rule used for joining smaller into larger clusters was weighted pair-group averaging (i.e. the criterion for cluster linking was derived from the average distance between all pairs of objects in two different clusters, using the size of each cluster as a weighting factor). This rule was employed because of the large differences in size of the clusters that will be outlined below.
Figure 9. Cluster analysis based on CV and slope of the spike AHP.
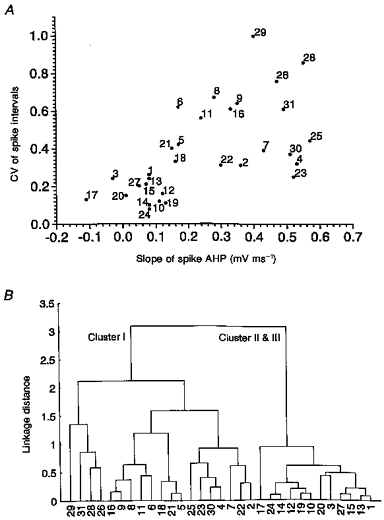
A, plot of CV of spike intervals versus the slope of the spike AHP for cells having spontaneous firing rates between 1.5 and 5.0 Hz. Except for an overall positive correlation, two clusters can be discerned having low CV and slope values, and high CV and slope values, respectively. B, dendrogram obtained by hierarchical tree clustering using the CV and slope of the spike AHP as variables. The numbers plotted along the abscissa label the same cells as indicated in A. The main right-hand branching (cells 1 to 17) corresponds to the group with low CV and slope values shown in A; this group mainly comprises cluster II and a few cluster III cells.
Figure 10. Cluster analysis based on the area of rebound depolarization, resting membrane potential and spontaneous firing rate.
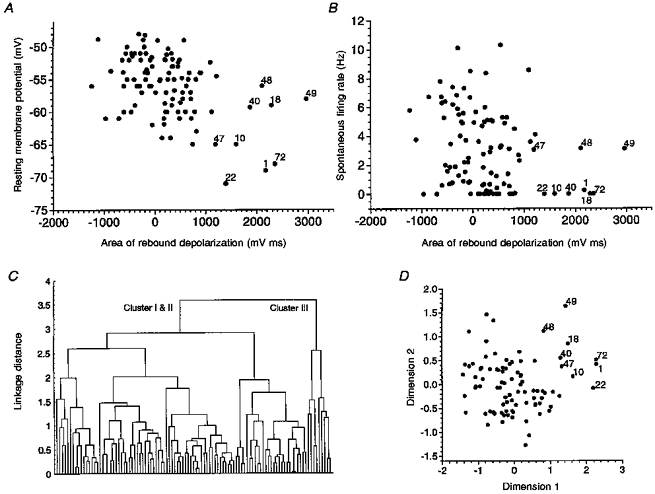
A, plot of resting membrane potential versus area of rebound depolarization. The points labelled by numerals correspond to cells belonging to cluster III according to visual data inspection. B, plot of spontaneous firing rate versus area of rebound depolarization. C, dendrogram obtained by hierarchical tree clustering using the area of rebound depolarization, resting membrane potential and spontaneous firing rate as variables. The main binary branching at linkage distance 3.6 segregates cluster I and II (left-hand branch) from cluster III (right-hand branch). Despite the large scattering of visually identified cluster III cells in A and B, all of these cells were placed in the right-hand cluster. D, multidimensional scaling solution for the distance matrix based on the same 3 variables. Cluster III neurons were grouped into the upper right corner of the scatter plot. Only a few members belonging to cluster I or II approached cluster III.
In multidimensional scaling, the distances between objects in a multidimensional space are used to rearrange the objects on a map of low dimensionality while attempting to preserve the distance relationships between objects. In other words, the algorithm attempts to find an optimal low-dimensional configuration of objects that reproduces the relative distances between objects as computed in the original high-dimensional space as well as possible. The resulting low-dimensional plot can suggest a grouping of objects and may indicate which parameter, or set of parameters, best explains the dissimilarity between neurons (Gordon, 1981; Everitt, 1993). As in hierarchical tree clustering, we used standardized parameter values to compute Euclidean distances between objects.
RESULTS
A total of sixteen parameters were assessed in 109 neurons recorded by visually controlled patch clamp at a temperature of 29-31°C. We will first describe the membrane properties of cells recorded under these conditions and then pay attention to the results obtained with blind patch clamping. While most parameters were quantified, a small number of other properties were qualitatively evaluated, viz. the occurrence of spontaneous synaptic inputs, post-hyperpolarization rebound spikes and time-dependent inward rectification. Cells having action potentials smaller than 60 mV were discarded.
Basic membrane properties
A quick inspection of Table 1 and Fig. 2 suffices to reveal the large variability in basic membrane properties. The Vrest ranged between -71 and -48 mV and was not normally distributed across this range (Fig. 2A; Table 1). The frequency distribution was skewed towards more negative Vrest values, raising the possibility of a subgroup of relatively hyperpolarized neurons. The distribution of input resistance also deviated significantly from normality (Fig. 2B) and was skewed towards higher input resistances. A similar distribution was found for the membrane time constant (Table 1).
Table 1.
Overview of membrane properties of all SCN neurons patch clamped under visual control
| Parameter | Mean ±s.e.m. | Range | n | P |
|---|---|---|---|---|
| Resting membrane potential (mV) | −56.0 ± 0.4 | −71 to −48 | 109 | < 0.002 |
| Input resistance (GΩ) | 1.29 ± 0.05 | 0.3 to 2.8 | 109 | < 0.01 |
| Time constant (ms) | 28.6 ± 1.1 | 8.0 to 56.5 | 109 | < 0.0001 |
| Action potential amplitude (mV) | 74.7 ± 1.2 | 60 to 118 | 109 | < 0.0001 |
| Action potential threshold (mV) | −40.6 ± 0.4 | −48 to −32 | 105 | n.s. |
| Action potential width (ms) | 1.51 ± 0.04 | 0.70 to 2.7 | 109 | n.s. |
| Amplitude of spike AHP (mV) | −21.3 ± 0.5 | −30.5 to −10.2 | 81 | n.s. |
| Slope of spike AHP (mV ms−1) | 0.18 ± 0.02 | −0.56 to 0.57 | 81 | n.s. |
| Rate of frequency adaptation (ms s−1) | 51.0 ± 16.4 | −9.7 to 1073 | 70 | < 0.0001 |
| Amplitude of spike train AHP (mV) | −7.1 ± 0.5 | −19.4 to 4.0 | 70 | n.s. |
| Size of rebound depolarization (mV ms) | 228 ± 71 | −1232 to 2966 | 108 | < 0.0001 |
| Spontaneous firing rate (Hz) | 3.02 ± 0.26 | 0 to 10.3 | 109 | < 0.0001 |
| Coefficient of variation for spike intervals | 0.41 ± 0.03 | 0.07 to 1.38 | 81 | < 0.0001 |
For methods of quantification, see text and Fig. 1. P values are according to the Shapiro-Wilks test for normality of distributions.
Figure 2. Frequency histograms of resting membrane potential (A) and input resistance (B).
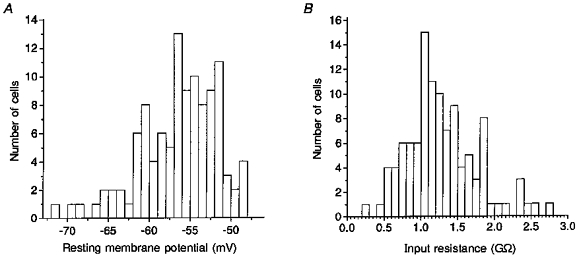
A small portion of the cells exhibited abnormally negative Vrest values (A). In B, a few cells with exceptionally high input resistance stood out in the distribution.
Firing properties
Action potentials were studied by recording spontaneous firing of SCN cells and by injection of positive current pulses. They were characterized by monophasic rising and falling slopes (Figs 1B, 3C and 4C). Although the frequency distribution of the action potential amplitude was not normal, this was at least partially due to the procedure for accepting cells (see above). The shape of the spike AHP varied considerably. Figures 3B and C and 4B and C show two examples of distinct AHP waveforms. Most spike AHPs were monophasic and approximately followed a monoexponential return to baseline, whereas a minority displayed biphasic AHPs, containing a fast repolarizing component and a component of medium duration (100-250 ms). Although we did not observe a significant deviation from normality when considering the frequency distribution of the AHP slope, this may be related to the low incidence rate of biphasic AHPs. The amplitude of the spike AHP, the spike threshold and width all followed a normal distribution.
Figure 3. Firing properties of an irregularly discharging cell (cluster I).
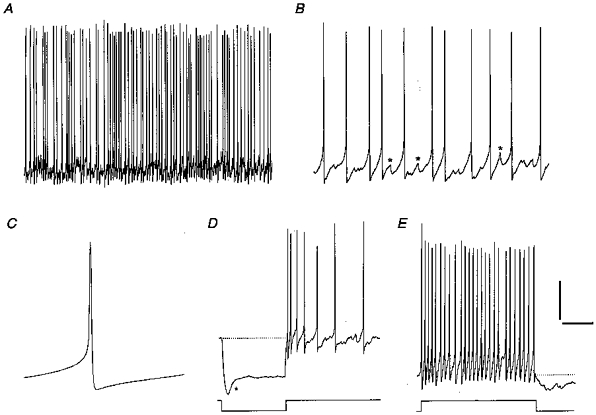
A and B, irregular firing displayed on two different time scales. Spontaneous events, including depolarizing ramps without spikes (asterisks), were interspersed between spikes. The SFR and CV of this cell were 4.9 Hz and 0.44, respectively. C, spike average from the same cell illustrating a monophasic AHP waveform. D, upon injection of hyperpolarizing current (-30 pA), the cell showed pronounced inward rectification (asterisk) but no rebound depolarization. Spontaneous synaptic input was sparse or absent in this neuron. E, spike train evoked by +30 pA showed little frequency adaptation and a ragged spike train AHP. Scale bars: A, 20 mV, 2.0 s; B, 20 mV, 250 ms; C, 20 mV, 30 ms; D, 30 mV, 500 ms; E, 20 mV, 250 ms.
Figure 4. Firing properties of a regularly discharging cell (cluster II).
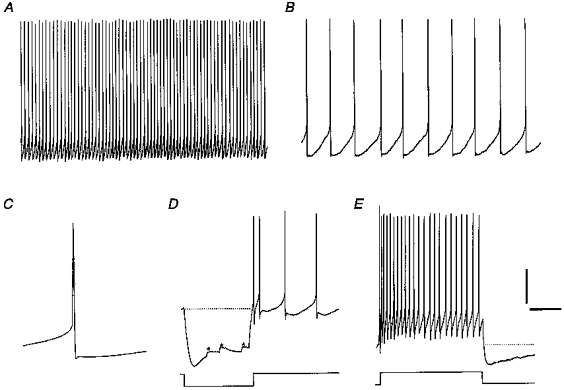
A and B, regular firing displayed on the same time scales as in Fig. 3A and B. The SFR and CV were 4.7 Hz and 0.08, respectively. C, spike average of the same cell illustrating a biphasic AHP waveform. Note the clear distinction between the fast, spike-repolarizing component and the slow component. D, upon injection of hyperpolarizing current (-30 pA), the cell showed inward rectification and some spontaneous synaptic input (asterisks) but no rebound depolarization. E, spike train evoked by +30 pA showed clear frequency adaptation and a pronounced spike train AHP. Scale bars: A, 20 mV, 2.0 s; B, 20 mV, 250 ms; C, 20 mV, 40 ms; D, 30 mV, 500 ms; E, 20 mV, 300 ms.
SFRs ranged from 0 to 10.3 Hz and were not normally distributed. To a large extent this deviation from normality was due to the large fraction of silent or nearly silent cells: 21 out of 109 cells (19 %) were silent while 38 neurons (35 %) fired at rates below 1 Hz. We asked whether the firing rate was related to a number of active properties, but found no clear correlation with H-current, rate of frequency adaptation or size of rebound depolarization (see below). The firing rate also failed to correlate with the occurrence of spontaneous synaptic input and we frequently encountered spontaneously discharging cells without detectable synaptic input. We studied the regularity in patterns of spontaneous firing by quantifying the coefficient of variation (CV) in spike intervals (cf. Groos & Hendriks, 1979). Firing patterns varied from highly regular (Fig. 4A and B) to highly irregular (Fig. 3A and B). The frequency histogram, which differed significantly from a normal distribution, was characterized by a high peak of regular cells (with 0.10 < CV < 0.20) and at least two smaller peaks of irregular cells (0.30 < CV < 0.70; Fig. 5A). Although some cells generated a few bursts during a recording period of several minutes, steadily bursting neurons were not found. Since Kim & Dudek (1993) reported that the regularity of firing of SCN neurons can be manipulated by injecting current intracellularly and altering the firing rate, we studied the relationship between SFR and regularity of firing (Fig. 5B). We confirmed Kim & Dudek's observation in that high firing rates (> 5.0 Hz) are usually accompanied by high regularity and, vice versa, low firing rates (< 1.5 Hz) occur in conjunction with irregularity. Roughly speaking, the plot of SFR versus CV resembled a hyperbolic curve. Nevertheless, we also noted that, within an intermediate range of firing rates (1.5 to 5.0 Hz; the exact choice of these borders is somewhat subjective), there was a large variability in CV that was not related in any obvious way to SFR (Figs 3, 4 and 5B and C). The frequency distribution of CVs within this restricted band of firing rates contained multiple peaks and was significantly different from normal (Fig. 5C; P < 0.01).
Figure 5. Frequency distribution of the coefficient of variation for spike intervals and its relationship to the spontaneous firing rate.
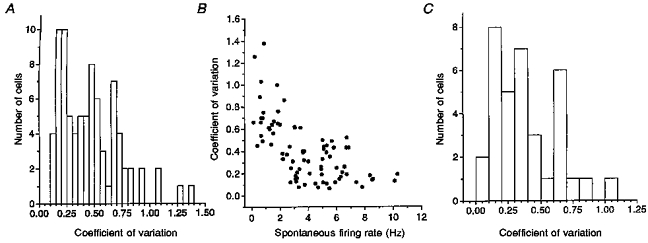
A, frequency distribution for all spontaneously firing neurons. Note the distinct peak around CV = 0.20 and at least two smaller peaks at higher CVs. B, with increasing spontaneous firing rate, there was an overall tendency for the CV to decline. Note, however, the large variability in CV for firing rates between about 1.5 and 5 Hz. C, frequency distribution for neurons firing at rates between 1.5 and 5.0 Hz. Peaks were found around CVs of 0.15, 0.35 and 0.65.
Injection of positive current pulses (5-40 pA; duration, 1.0 s) into the cell usually generated a sustained train of action potentials with a variable amount of adaptation and modest spike broadening and spike inactivation. While a majority of cells exhibited no or moderate frequency adaptation (Fig. 6A and B), a small subgroup displayed very pronounced adaptation (Fig. 6C). The deviation from normality in the distribution of this parameter (Fig. 6D; Table 1) was at least in part due to this subgroup. After termination of the current pulse, a spike train AHP usually appeared having a duration of 0.5-2.0 s. The magnitude of this AHP was generally high when the adaptation rate was moderate (Fig. 6B), whereas an extreme amount of adaptation (Fig. 6C) or lack of it (Fig. 6A) was accompanied by small train AHPs. Despite this variability its overall distribution was approximately normal.
Figure 6. Heterogeneity in frequency adaptation and spike train after-hyperpolarization in SCN cells.
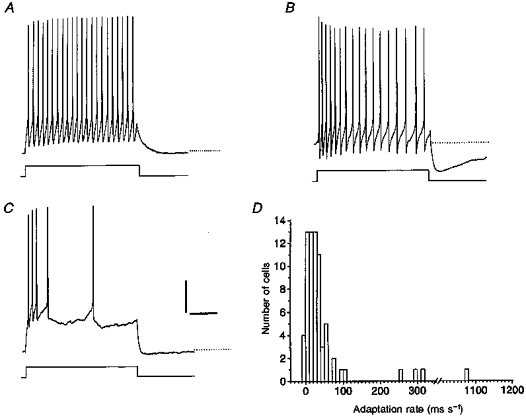
A, a current pulse of +40 pA evoked a spike train showing no frequency adaptation. Note the absence of a spike train AHP. Dotted line is a baseline extension. B, clear frequency adaptation was present upon injection of +40 pA in another cell. Note that a pronounced AHP followed this spike train. C, cell generating a spike train with very rapidly widening spike intervals during injection of +40 pA current. This train was not accompanied by a pronounced AHP. D, frequency distribution of the rate of frequency adaptation. Only cells without substantial spike inactivation during the train were taken into account. A few outliers with large amounts of adaptation were identified. Scale bars: 20 mV and 250 ms (A-C).
Time-dependent rectification and rebound depolarization
Injection of hyperpolarizing current pulses revealed two prominent active membrane properties of SCN neurons. Ninety-six out of 105 (91 %) cells exhibited time-dependent inward rectification as was evident from the depolarizing ‘sag’ appearing at voltages below about -70 mV (Figs 3D, 4D and 7B). This type of rectification results from activation of the H- (or Q-) current (IH; Akasu et al. 1993; De Jeu & Pennartz, 1997). Although it is possible to design current clamp-based measures for the degree of rectification, we should note that such measures are likely to depend strongly on the Vrest and input resistance due to the voltage dependence of IH. Furthermore, comparable amounts of time-dependent inward rectification were found in all cell clusters described below. For these reasons this parameter was not quantified in detail.
Figure 7. Heterogeneity in the magnitude of rebound depolarizations.

A, a current pulse of -21 pA evoked a hyperpolarization followed by a large rebound depolarization. Note the single rebound spike and the occurrence of wavelets (asterisk) after the spike. B, another cell generated a modest rebound depolarization following a current pulse (-21 pA) carrying one spike in addition to its normal spontaneous firing pattern. Note the biphasic spike AHP and time-dependent rectification. C, frequency distribution of the area of the rebound depolarization (see Fig. 1A). Note the small subgroup of cells having abnormally large rebound depolarizations.
Upon termination of the hyperpolarizing current pulse, 94 out of 105 (90 %) cells generated one or more rebound (or ‘anodal break’) spikes. These spikes arose on top of a rebound depolarization the size of which was highly variable, even when preceding hyperpolarizations were similar in magnitude. The area of the rebound depolarization showed a broad distribution deviating from normality (Fig. 7C). A small subgroup of neurons with exceptionally large rebound depolarizations (> 1400 mV ms) stood out in the frequency histogram. These large rebound depolarizations are most likely to have been caused by activation of a low-threshold calcium conductance (Llinás & Yarom, 1981; Greene, Haas & McCarley, 1986; Akasu et al. 1993). In most cells these large events were accompanied by a burst of spikes (Fig. 1A), whereas in a minority an initial spike was followed by small wavelets (Fig. 7A) reminiscent of low-threshold calcium potentials in inferior olivary neurons (Llinás & Yarom, 1981).
Grouping based on non-homogeneously distributed properties
We asked whether it is reasonable to divide the overall population into subgroups of cells each having a distinct set of membrane properties. Our approach was to examine the conjunction between different membrane characteristics with emphasis on properties having a non-homogeneous distribution. The reasoning behind this strategy was that distributions may deviate from normality because of the existence of different subpopulations and that a consideration of outliers in the distribution may lead to the identification of subgroups by taking into account other unusual characteristics of these cells. This type of analysis may lead to (i) identification of ‘cell types’, which can be thought of as rigidly defined groups of cells with a fixed set of distinguishing properties; (ii) identification of ‘cell clusters’, which according to cluster analysis methods (Gordon, 1981; Everitt, 1993) have distinct properties but need not be strictly segregated from each other; or (iii) absence of distinct groups despite the high degree of heterogeneity discerned in many properties.
We first reconsidered the regularity of spontaneous firing as a possible criterion to distinguish groups of cells (cf. Groos & Hendriks, 1979; Shibata, Liou, Ueki & Oomura, 1984; Cahill & Menaker, 1989). We examined the dynamic SFR range between 1.5 and 5.0 Hz more closely and observed a conjunction between the regularity of firing and the occurrence of biphasic spike AHPs (Fig. 4). Conversely, cells with monophasic AHPs displayed irregular firing behaviour (Fig. 3). Quantitatively, the steepness of the AHP slope (Fig. 1C) was positively correlated to the CV of spike intervals (correlation coefficient, 0.63; P < 0.0001 for n = 32; Fig. 9A). Visual inspection of data records suggested the existence of two groups of cells. Henceforth the group with irregular firing (Fig. 3) and monophasic AHPs (Figs 1B and 3C) will be denoted as ‘cluster I’ whereas the cells with regular firing (Fig. 4) and biphasic AHPs (Figs 1C and 4C) will be labelled ‘cluster II’ (except when these cells also exhibit a very large rebound depolarization - see below). As compared with other clusters, cluster I appeared to be more sensitive to rundown in spike amplitude while the whole cell recording was proceeding. However, this phenomenon was not found in all of these cells and a majority of them maintained spike amplitudes above 60 mV. Furthermore, cluster II had a significantly longer time constant (P < 0.01) and deeper spike train AHP (P < 0.01; Mann-Whitney U test; Table 2) than cluster I. Cluster I and II cells did not differ significantly in the other properties listed in Table 2. Since the two clusters exhibited comparable amounts of spontaneous synaptic input, this factor is unlikely to explain the difference in regularity. This was confirmed by adding the GABAA receptor antagonist bicuculline to four spontaneously firing cluster I cells, the regularity of which was not markedly affected by this substance (CV in control period, 0.42 ± 0.11; CV in bicuculline, 0.35 ± 0.05; SFRs in control and bicuculline, 4.0 ± 0.6 and 4.8 ± 1.7 Hz, respectively). However, spike intervals of cluster I cells were characterized by the frequent occurrence of spontaneous subthreshold events (Fig. 3B and D), comprising Na+-dependent depolarizing ramps (cf. Pennartz et al. 1997) and possibly fast prepotentials (cf. Kim & Dudek, 1992).
Table 2.
Overview of membrane properties per cluster of SCN neurons
| Statistical significance | ||||||
|---|---|---|---|---|---|---|
| Cluster I | Cluster II | Cluster III | I vs. II | I vs. III | II vs. III | |
| Distinguishing set of properties | Monophasic AHP | Biphasic AHP | Biphasic AHP | |||
| Irregular firing | Regular firing | Low-frequent or regular firing | ||||
| Small RD | Small RD | Large RD | ||||
| Number of cells | 52 | 21 | 9 | |||
| Resting membrane potential (mV) | −54.8 ± 0.5 | −55.3 ± 0.8 | −63.5 ± 1.8 | — | 0.0001 | 0.001 |
| Input resistance (GΩ) | 1.28 ± 0.06 | 1.41 ± 0.11 | 1.04 ± 0.08 | — | — | 0.05 |
| Time constant (ms) | 25.8 ± 1.4 | 33.8 ± 2.5 | 30.2 ± 3.7 | 0.01 | — | — |
| Action potential amplitude (mV) | 72.6 ± 1.6 | 73.9 ± 2.1 | 93.2 ± 4.7 | — | 0.001 | 0.001 |
| Action potential threshold (mV) | −40.2 ± 0.6 | −38.9 ± 1.2 | −42.8 ± 1.3 | — | — | — |
| Action potential width (ms) | 1.48 ± 0.05 | 1.43 ± 0.09 | 1.94 ± 0.18 | — | 0.05 | 0.05 |
| Amplitude of spike AHP (mV) | −21.9 ± 0.8 | −21.4 ± 1.2 | −17.5 ± 1.8 | — | — | — |
| Slope of spike AHP (mV ms−1) | 0.35 ± 0.04 | 0.01 ± 0.03 | −0.08 ± 0.15 | DP | 0.01 | — |
| Rate of frequency adaptation (ms s−1) | 29.8 ± 8.3 | 30.6 ± 5.7 | 374 ± 241 | — | 0.01 | 0.05 |
| Amplitude of spike train AHP (mV) | −6.7 ± 0.7 | −10.5 ± 0.9 | −3.3 ± 1.1 | 0.01 | — | 0.01 |
| Size of rebound depolarization (mV ms) | −4 ± 69 | 36 ± 115 | 1990 ± 181 | — | DP | DP |
| Spontaneous firing rate (Hz) | 2.9 ± 0.4 | 3.7 ± 0.6 | 1.1 ± 0.5 | — | 0.02 | 0.01 |
| CV of spike intervals | 0.41 ± 0.03 | 0.19 ± 0.04 | 0.31 ± 0.15 | DP | — | — |
| Percentage of cells with SPSPs | 88 | 76 | 78 | |||
| Percentage of cells with time- dependent rectification | 87 | 90 | 100 | |||
For cluster I and II, regularity of firing refers to the range of firing rates between 1.5 and 5.0 Hz. RD, rebound depolarization. Parameter values represent means ±s.e.m. Recording conditions were the same as in Table 1, i.e. visually controlled whole cell patch clamp at 29–31 °C. Values in the 3 right-most columns indicate levels of statistical significance according to the Mann-Whitney U test. Student's t test indicated similar or smaller P values than the Mann-Whitney U test. For all distinguishing properties (DPs), P values were below 0.0001. SPSP, spontaneous postsynaptic potential.
In seven cluster I and II cells firing at rates between 1.5 and 5 Hz, we examined whether their firing pattern could be converted from irregular to regular, or vice versa, by injection of positive or negative direct current. Cluster II cells lost their regularity when their firing rate dropped below approximately 1.5 Hz by continuous hyperpolarization. Conversely, cluster I cells became less irregular upon continuous depolarization, but only rarely became as regular as cluster II cells. We also examined whether cells with firing rates outside the range of 1.5-5.0 Hz could be classified as cluster I or II cells by injection of positive or negative direct current (n = 8). Indeed, when cells with monophasic AHPs were brought into the range of 1.5-5.0 Hz, they fired irregularly whereas those with biphasic AHPs fired regularly. At firing rates above 5 Hz, it was generally difficult to classify the spike AHP as mono- or biphasic since the AHP slope was steeper than at low rates and made a rapid transition into a depolarizing ramp (cf. Pennartz et al. 1997). In these cases, mild hyperpolarization allowed a distinction between mono- and biphasic AHPs to be made.
We next considered the small subgroup of cells having unusually large rebound depolarizations (Figs 1A, 7A and 8A). These cells (n = 9) were usually characterized by biphasic spike AHPs (Fig. 8B), a property shared with cluster II cells. Further features included a larger number of rebound spikes than found in cluster I and II, a relatively hyperpolarized Vrest, zero or low SFR, low input resistance, broad and high-amplitude spikes, moderate to strong frequency adaptation and a small spike train AHP (Table 2). The latter properties can be considered fairly characteristic for these ‘cluster III’ cells because their parameter values differed significantly from cluster I and/or II (Table 2). However, they cannot serve as distinguishing criteria because of their variability within cluster III and because cluster I or II cells occasionally displayed a similar property. The cells fired irregularly but, as noted above, this may be directly related to their low SFR. Other properties of cluster III did not significantly differ from either cluster I or II. We considered whether the low-threshold Ca2+ potential may be larger or more easily triggered because of the negative Vrest, which would result in less steady-state inactivation of T-type Ca2+ channels. However, a correlation between Ca2+ potentials and the preceding voltage during the hyperpolarizing pulse was not found.
Figure 8. Example of a cluster III neuron.
A, current pulse of -30 pA evoked a large rebound depolarization with 4 spikes and a subsequent AHP. B, in the same cell, a spike elicited by a current pulse of +25 pA was followed by a biphasic AHP (asterisk). C, spike train clearly displaying frequency adaptation was evoked by a current pulse of +40 pA. Scale bars: 20 mV for (A-C); A, 500 ms; B, 50 ms; and C, 320 ms.
In summary, the hallmarks of cluster I are (i) a monophasic spike AHP and (ii) irregular firing given a SFR between 1.5 and 5 Hz; cluster II is characterized by (i) a biphasic spike AHP and (ii) regular firing in the same range; and cluster III is characterized by (i) a biphasic spike AHP (as with cluster II) and (ii) the large low-threshold Ca2+ potential. For 82 out of 109 neurons, sufficient data were available to allow them to be categorized in one of the clusters.
It may be inappropriate to regard the three identified agglomerations of cells as rigidly segregated classes. One of the main arguments for stating this is that four neurons out of the overall population (n = 109) exhibited characteristics intermediate to two clusters. Two neurons showed irregular firing (CV > 0.40) but biphasic spike AHPs, thus presenting a mix of cluster I and II properties. Since both cells fired at rates above 5 Hz, their irregularity was not due to a low SFR. The other two cases were intermediates between cluster II and III since their rebound depolarizations were larger than usual but not as pronounced as in typical cluster III neurons. These cells also exhibited regular firing and slowly rising AHP slopes, both considered characteristic for cluster II. Finally, we examined whether the fractional sizes of the clusters changed across the day-night cycle but found no marked differences between the day (circadian time (CT) 5-8; n = 23 or CT 5-11; n = 40) and night (CT 12.5-19; n = 69) phase. This suggests that SCN cells, when traversing circadian time zones, do not massively switch from one cluster to another.
Multivariate cluster analysis
We will first focus on cluster analysis results pertaining to clusters I and II and then continue to examine cluster III. It was necessary to employ this two-step approach because the CV could not be quantified in a majority of cluster III neurons, viz. those that were silent. Figure 9A shows a plot of the slope of the spike AHP versus the CV of spike intervals for those cells having a SFR in the range of 1.5 to 5.0 Hz. Figure 9B was obtained when the parameter values were standardized and subjected to hierarchical tree clustering. Individual cells are represented as terminal branch points along the bottom of the dendrogram and labelled with the same indices as in Fig. 9A. When the linkage distance progressively increases, successive branch points represent clusters of increasing size and dissimilarity. The main binary branching is found at a linkage distance of 3.1; this branching segregates cluster I from a group mainly comprising cluster II cells and some cluster III cells that fired spontaneously. Thus, when using CV and AHP slope, cluster I can be isolated from clusters II and III.
As already mentioned, cluster III is distinguished by its large rebound depolarization. Since hierarchical tree clustering cannot be performed using only one parameter, we sought to determine whether this can be achieved by utilizing differences in other membrane properties (Table 2). Plots of rebound depolarization against another variable showing a significant difference between cluster III and cluster I or II suggested that particularly the Vrest and SFR could be useful for cluster analysis (Fig. 10A and B). When the data were subjected to hierarchical tree clustering using these two parameters plus the area of the rebound depolarization as variables, all nine cluster III cells were indeed isolated in the main binary partitioning (Fig. 10C). When the dissimilarity matrix based on rebound depolarization, Vrest and SFR was used for multidimensional scaling to a two-dimensional solution, cluster III cells stood out as a separate group although the distances between some of its members were rather large (Fig. 10D). Qualitatively similar results in hierarchical tree clustering and multidimensional scaling were obtained when a third of all cells were randomly deleted, confirming the reliability of the results (Everitt, 1993).
Topographic distribution of clusters throughout SCN
In order to assess whether the location of cells belonging to a particular cluster was restricted to certain subregions of SCN, we related their electrophysiological profile to their position as noted in a slice overview sketch. Cluster I cells appeared to be dispersed rather homogeneously throughout the SCN; their incidence rate was high along the anterior-posterior axis as well as in each of four quadrants in the coronal plane (dorsolateral, dorsomedial, ventrolateral and ventromedial SCN). The percentage of cluster II cells was unusually high at anterior levels, normal at mid-levels and low in the posterior SCN. In the coronal plane, cluster II cells were relatively concentrated in the lateral parts of the SCN (dorsal as well as ventral). All cluster III neurons were located at mid-level along the anterior-posterior axis; in the coronal plane their preferential location was in the ventral half of SCN (both lateral and medial). It should be recalled, however, that the latter cells were few in number, making it hard to exclude problems of undersampling.
Light microscopic morphology of cell clusters
Out of a total of eighty-two classified cells, twenty-nine cells were sufficiently labelled with biocytin to allow accurate morphological reconstruction using a confocal laser scanning microscope. The shape and extent of their dendritic arbors varied as they included monopolar (1 primary dendrite), bipolar (2 primary dendrites) and multipolar (more than 2 primary dendrites) branching patterns (cf. Van den Pol, 1980). The number of secondary dendritic branches ranged from zero to eight whereas tertiary dendrites were only rarely encountered. Dendrites were smooth or varicose and sometimes both types of dendrite were found in a single cell. In seven cells, we confirmed that a varicose appearance was not due to a fixation artifact by labelling SCN neurons in living slices with the fluorescent dye sulphorhodamine. Dendrites of living SCN neurons exhibited the same proportions and spatial arrangement as those recovered after fixation and biocytin staining. The somata of SCN neurons were round, ovoid, fusiform or polygonal in shape. Their minimal and maximal diameter ranged from 5 to 13 μm and from 10 to 17 μm, respectively. No dye coupling was observed except in one case, suggesting the absence of biocytin-permeable gap junctions. A minority of cells contained spines on their soma (28 %) or dendrites (45 %) and the spine density was generally rather low (for an exception see Fig. 12B). Spines were present on both soma and dendrites in 24 % of the neurons. Furthermore, spines were observed on smooth as well as varicose dendrites and were not restricted to particular dendritic branching patterns.
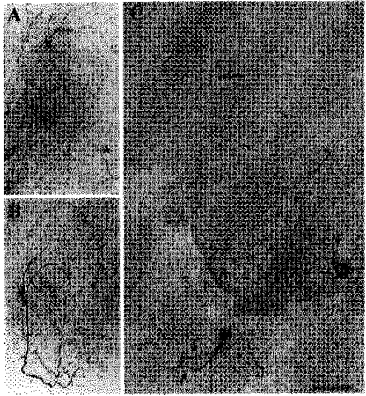
Figure 12. Morphology of cluster I neuron with somatic spines and axon collaterals originating from distal dendritic segments.
This dendritic configuration is referred to as ‘dendroaxon’. The cell was reconstructed as in Fig. 11. A, overview of the neuron with soma, dendrites and axon collaterals. B, partial reconstruction of the soma and proximal dendrites showing numerous spines or prolonged appendages on both soma and dendrites. C, enlargement of the box shown in A, revealing axon collaterals (marked by arrows) originating from a distal dendrite. Note the fine calibre of the axons. Scale bar: A, 40 μm; B, 14 μm; C, 20 μm.
Axons were distinguished by their fine calibre and varicose appearance. While a majority of axons originated from the soma, some departed from intermediate segments of dendrites or close to their tips (Fig. 12C). We labelled the latter configuration ‘dendroaxon’ to denote its unusual appearance. The estimated number of axon collaterals, including those projecting outside SCN, varied between one and thirteen. This range is probably an underestimate because collaterals that originally coursed outside the space comprising the slice were removed. Collaterals coursed through the direct surroundings of the recorded cell (Figs 11B and 12A) or traversed larger portions of the SCN in one hemisphere (Fig. 11A and C). Intranuclear axonal networks of SCN cells with many collaterals comprised tens to hundreds of axonal varicosities. In addition to forming these local circuits, thirteen out of twenty-nine (45 %) neurons projected to targets outside the (unilateral) SCN, viz. the paraventricular nucleus (PVN) of the hypothalamus and sub-PVN zone, contralateral SCN or other hypothalamic areas directly surrounding the SCN. In addition, a few neurons projected to a site dorsal to the PVN, possibly the paraventricular nucleus of the thalamus. Some neurons innervated multiple target areas by different collaterals, for instance the PVN and contralateral SCN. Furthermore, out of the thirteen neurons projecting outside the SCN, twelve cells also possessed intra-SCN collaterals. Thus, it is quite common for SCN cells to have both local circuits axons and extranuclear projections.
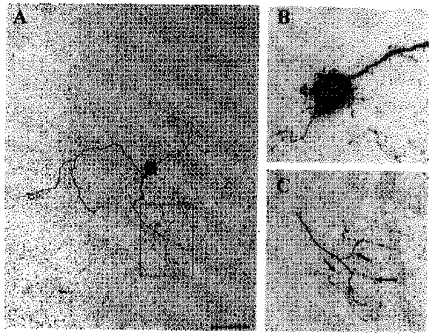
Figure 11. Light microscopic morphology of recorded neurons as revealed by biocytin labelling and three-dimensional reconstruction by a confocal laser scanning microscope.
A, cluster I neuron having an axon projecting to the area of the paraventricular nucleus of the hypothalamus (marked by arrow) and a few local axon collaterals in the SCN (marked by asterisks). B, cluster III neuron with a characteristic large axon collateral network within the SCN. The collaterals carried large numbers of varicosities and coursed through the ventral SCN. No projection axon was identified in this cell. C, cluster II neuron having an axon projecting to a site dorsal to the SCN (thin arrow). This cell presents a clear example of varicose dendrites (thick, short arrows) and also possesses a small number of axon collaterals (marked by asterisks). Scale bar: A, 130 μm; B, 65 μm; C, 75 μm.
The overall population of twenty-nine classified neurons contained twenty-one cluster I, four cluster II and four cluster III cells. Their light microscopic properties are summarized in Table 3. Cluster III cells possessed a significantly larger number of axon collaterals than cluster I and II neurons (P < 0.02; Mann-Whitney U test). Inspection of individual neurons showed that cluster I or II cells did occasionally have many (> 7) collaterals, but the variability within one cluster was much greater than for cluster III. Thus, the large number of axon collaterals in cluster III cells cannot be used as an additional distinguishing feature of this group. Furthermore, in cluster I and II cells spines were occasionally found on soma and/or dendrites whereas all cluster III cells only exhibited spines on the dendrites. No further morphological differences between the three clusters were discerned.
Table 3.
Light microscopic properties of SCN neurons listed per cell cluster
| Parameter | Cluster I | Cluster II | Cluster III |
|---|---|---|---|
| Number of cells | 21 | 4 | 4 |
| Soma minimum diameter | 10.1 ± 0.6 | 11.8 ± 0.4 | 11.6 ± 0.6 |
| Soma maximum diameter | 14.8 ± 0.8 | 15.4 ± 1.3 | 13.2 ± 1.8 |
| Number of primary dendrites | 1.8 ± 0.1 | 1.8 ± 0.5 | 2.5 ± 0.3 |
| Number of secondary dendrites | 1.2 ± 0.3 | 1.0 ± 0.6 | 1.5 ± 1.0 |
| Number of axon collaterals | 5.1 ± 0.9 | 6.5 ± 2.2 | 11.0 ± 1.2* |
| Percentage of cells with somatic spines | 29 | 50 | 0 |
| Percentage of cells with dendritic spines | 43 | 25 | 75 |
| Percentage of cells projecting outside SCN | 43 | 25 | 75 |
Values represent means ±s.e.m. Only cells patch clamped under visual control at 29–31 °C were included; intermediate cases were excluded. Projection axons were included in the number of axon collaterals. Asterisk indicates statistical significance in differences from cluster I (P < 0.02, Mann-Whitney U test).
Blind patch clamp experiments
Thus far we have not addressed the question as to whether the proposed tripartitioning of SCN neurons holds for a variety of preparation and recording conditions. While a full answer to this question faces a combinatorial explosion of variables, we chose to investigate this problem within a setting of conditions different from that used above, but constant throughout this additional series of experiments. These altered conditions included (i) decapitation of rats without anaesthesia; (ii) ‘blind’ patch clamping of SCN neurons, avoiding visual selection; (iii) preparation of thick (500 μm) slices, which might uncover conductances in distal dendrites not preserved in thin slices; and (iv) recording at room temperature (20-22°C).
The recordings (n = 77) gave rise to the same partitioning of neurons as suggested for visually controlled patch clamping. Most neurons could be identified as belonging to one of the three clusters identified above on account of the shape of the spike AHP, regularity of firing and rebound depolarization. Again, a slow decline in spike amplitude after establishing a whole cell configuration was frequently encountered in cluster I cells. The fractional sizes of the clusters deviated from the results presented in Table 2, as cluster I made up 35 %, cluster II 27 % and cluster III 29 % of all cells (9 % were intermediate cases). This deviation may be due to differences in the procedure for selecting cells or in the recording temperature.
DISCUSSION
The main aim of this descriptive study was to assess the electrophysiological and morphological heterogeneity of SCN neurons by whole cell patch clamping in current clamp mode. We found several arguments in favour of such heterogeneity. First, quantification of individual membrane properties showed that a majority of characteristics did not obey a normal distribution. This was found for the Vrest, input resistance, time constant, rate of frequency adaptation, size of rebound depolarization and CV. Other parameters showed heterogeneity as well but generally obeyed a normal distribution. Second, visual inspection of records from individual neurons showed that particular membrane properties were found in conjunction with each other. This resulted in the partitioning of SCN neurons into three groups: cluster I, characterized by monophasic spike AHPs and irregular spontaneous firing (with 1.5 < SFR < 5 Hz); cluster II, characterized by biphasic AHPs and regular spontaneous firing in the same range; and cluster III, characterized by large rebound depolarizations and biphasic spike AHPs. As regards clusters I and II, it should be emphasized that regularity and spike AHP may be causally related in that they may depend on one common underlying ionic conductance. For cluster III cells, however, it is reasonable to rule out a causal role for the negative Vrest in hyperpolarization-triggered rebound depolarizations. Third, the proposed tripartition was confirmed by two objective data reduction techniques, viz. hierarchical tree clustering and multidimensional scaling. Although it should be recognized that these techniques are not capable of demonstrating the existence of different classes, it is worth noting that they showed good correspondence amongst each other and with clustering by visual inspection. Fourth, after clusters had been identified according to their distinguishing set of features, further differences between them were found in a post hoc analysis (Table 2). Fifth, the three clusters were also identified in blind patch clamp experiments, albeit that their fractional sizes differed from the results with patch clamp under visual control.
The electrophysiological heterogeneity of SCN neurons is unlikely to be due to circadian rhythmicity since the fractional sizes of the three clusters did not markedly differ across subjective day and night. Furthermore, the diversity in membrane properties was found within one circadian time domain as much as between domains. While the results suggest a tripartition, we should note that even more groups may exist, although their relative size is unlikely to be large. In particular, we have indications for a fourth subpopulation characterized by a high input resistance, large time constant and nearly tonic spontaneous inhibition. Further support for this putative fourth group awaits more detailed quantitative analysis.
The nature of electrophysiological heterogeneity of SCN neurons
Should the overall population of SCN neurons be subdivided into rigid classes of cells with relatively invariant properties, into more loosely defined clusters or not be subdivided at all? We are in favour of adopting the concept of clustering in the SCN because, on the one hand, relatively constant sets of membrane properties were identified in different groups of cells, and on the other hand, the variability of properties within identified groups was rather large and sometimes cases intermediate between two groups were found. When comparing this proposal to e.g. cortical structures, the distinction between SCN clusters does not seem as clear-cut as that between pyramidal cells and interneurons and may be more similar to cell classification in the paraventricular nucleus of the hypothalamus (Tasker & Dudek, 1991; Hermes et al. 1996) or partitioning of pyramidal neurons in regular spiking, bursting and ‘chattering’ cells (Connors & Gutnick, 1990; Gray & McCormick, 1996). In recent years, the hypothesis that neocortical firing patterns form a continuous spectrum rather than strictly separated classes has gained support (Connors & Gutnick, 1990; Mainen & Sejnowski, 1996).
The concept of clustering can be supplemented with the hypothesis that membrane properties, in so far as they are causally independent, may have different probabilities of being associated with one another. For instance, SCN cells have a low overall probability of expressing a rebound depolarization above 1400 mV ms (i.e. 7 %) or a membrane potential below -62 mV (i.e. 10 %). However, when they do express a large rebound depolarization, as in cluster III, the probability of having a Vrest below -62 mV is 50 %. Thus, an alternative way of expressing the nature of electrophysiological heterogeneity in SCN is to state that individual membrane properties may have different association probabilities and that sets of association probabilities define a variety of electrophysiological fingerprints of SCN neurons.
Comparison to previous electrophysiological studies in SCN
Previous intracellular studies in SCN, mainly relying on the sharp electrode technique, revealed electrophysiological profiles crudely similar to the present results but also differing in some important respects. Our mean Vrest, action potential amplitude and AHP amplitude were quantitatively similar to the values reported in these previous studies (Wheal & Thomson, 1984; Kim & Dudek, 1993; Akasu et al. 1993; Jiang et al. 1997a). Frequency adaptation and spike train AHPs have also been found in previous studies, albeit that very strong frequency adaptation as in cluster III has not been described before. The moderate frequency adaptation and spike train AHP in cluster I and II cells resemble those in e.g. cortical cells and are likely to depend on a Ca2+-dependent K+ current (presumably mediated by SKCa channels; Storm, 1990; McLarnon, 1995; Sah, 1996). The ionic basis of the strong adaptation in a majority of cluster III cells is unknown, although it may involve activation of the low-threshold Ca2+ current in combination with an abnormally negative Vrest (cf. Greene et al. 1986). Spontaneous firing rates were generally similar to values reported previously (Kim & Dudek, 1993; Akasu et al. 1993; Jiang et al. 1997a; but see Wheal & Thomson, 1984).
The mean input resistance and time constant were several times higher than in previous sharp electrode studies (see also Jiang et al. 1997a). The most likely explanation for these differences is the existence of electrode shunting in sharp electrode recordings (cf. Pongracz et al. 1991; Staley et al. 1992). Shunting may have pronounced consequences in SCN cells because of their small size and high resistance. The same effect may also account for the larger heterogeneity in membrane properties in our population than in the study of Kim & Dudek (1993). The spike width and threshold in the current study were longer and less negative than previously reported, which may be explained in part by different methods of quantification. Finally, to our knowledge this study is the first to report the occurrence of biphasic spike AHPs in two subpopulations of cells. The slow component of this type of AHP may be generated by activation of M-current (Storm, 1990) or Ca2+-dependent K+ current (possibly SKCa; McLarnon, 1995; Sah, 1996). The fast spike AHP, which was found in all clusters, may result from the activation of a fast Ca2+-dependent K+ current (IC, mediated by BKCa channels; Storm, 1990; Sah, 1996), a fast outward rectifying K+ current and/or a transient K+ current (A-current; Bouskila & Dudek, 1995).
As concerns the regularity of spontaneous firing, our findings are in line with Kim & Dudek (1993) reporting that irregularly firing cells can be made to fire regularly upon depolarization and enhancement of firing rate. However, this result does not imply that regularity should therefore be discarded as a grouping criterion. Our results indicate that cells are highly heterogeneous in regularity and clusters can be distinguished according to CVs across an intermediate dynamic range of spontaneous firing (i.e. 1.5-5.0 Hz). Below this range, cells may fire irregularly because spike triggering may be highly dependent on stochastic events such as synaptic inputs or single-channel openings. Above 5.0 Hz, firing may well be governed by relatively fixed activation-inactivation sequences of large conductances, invariably leading to regular firing. We conjecture that cluster-specific conductances of modest magnitude may significantly affect firing patterns particularly in the intermediate range.
When comparing the current results to the classification of extracellularly recorded unit activity in regular, irregular and burst-like firing patterns (Groos & Hendriks, 1979; Shibata et al. 1984; Cahill & Menaker, 1989), it is tempting to identify our cluster I and II cells as the ‘regular’ and ‘irregular’ cells known from extracellular recordings. However, we argue that it is still premature to do this because (i) the influence of SFR on regularity has not always been taken into account in previous studies, and (ii) washout of cytoplasmic constituents in whole cell mode may induce alterations in ionic conductances affecting the regularity of firing. Furthermore, we should note that bursting neurons, constituting a small minority in SCN (Shibata et al. 1984; Cahill & Menaker, 1989), were not found in our whole cell study.
Functional implications of morphological properties of SCN neurons
The light microscopic morphology of our electrophysiologically characterized SCN cells is in general agreement with previous studies (Güldner & Wolf, 1974; Van den Pol, 1980; Jiang et al. 1997a). The presence of dendritic varicosities, spines or projection axons was not clearly correlated to the electrophysiological fingerprint of cell clusters. The number of local axon collaterals was highly variable throughout the overall population but was consistently high in cluster III neurons. This feature may constitute an additional characteristic for this cell cluster, although it is not unique since it was also present in a few cells belonging to other clusters. Furthermore, all cell clusters contained at least a few neurons projecting outside the SCN.
Recently Jiang et al. (1997a; see also Van den Pol, 1980) proposed a classification of SCN neurons in monopolar, radial, simple bipolar and curly bipolar cells. Because current clamp recordings were not taken into account in their partitioning, their and our groupings are based on different criteria but need not exclude each other. We have considered possible overlap between the two classifications, but found no consistent relation between the presently identified cell clusters and dendritic arborization patterns. It may be premature to decide which classification is most robust or meaningful as long as the statistical distributions of these morphological properties are unknown. Furthermore, our labelling study indicated that it can be quite difficult to classify morphological cell types unambiguously because of the variability and gradual nature of cytological features such as the curliness of bipolar cells. Another study by Jiang, Yang & Allen (1997b) differs from the present results in that they observed dye coupling in 30 % of neurobiotin-filled SCN neurons. This difference may be due to a poorer gap junction permeability of biocytin than of neurobiotin (cf. Mills & Massey, 1995).
Regardless of the clustering results, three morphological observations deserve mentioning in particular. First, a majority of cells possessed one or more varicose dendrites. The fact that varicosities were also seen in sulphorhodamine-labelled cells in living slices shows that they are not a fixation artifact and supports the hypothesis of dendritic transmitter release (Güldner & Wolf, 1974; Castel, Morris & Belenky, 1996). Second, axons were seen to originate not only from somata and initial dendritic segments (Van den Pol, 1980; Jiang et al. 1997a) but in some cases also from distal dendrites (‘dendroaxons’). Assuming that action potentials are generated at the axon origin (Hausser, Stuart, Racca & Sakmann, 1995), this finding suggests that local dendritic integration of synaptic input, interacting with intrinsic dendritic conductances, may be sufficient in triggering output signals from spatially restricted dendritic domains. Third, biocytin labelling allows the tracing of all axon collaterals originating from one single cell over prolonged distances, which is usually not possible in immunocytochemical or Golgi studies. Thus we observed that many cells possessed both intra- and extranuclear axon collaterals; the extra-SCN target areas included the PVN and sub-PVN zone, contralateral SCN and sites dorsal to the PVN. The fact that all three cell clusters contained cells having this configuration suggests that the main subpopulations of SCN neurons send output to target areas but also disseminate information within the SCN. Small populations of dedicated local circuit neurons may have been overlooked in our sampling procedure. Previous studies suggest that intra- and extranuclear axons may release GABA as well as a variety of peptides including vasopressin, vasoactive intestinal polypeptide and somatostatin (Card & Moore, 1984; Van den Pol & Tsujimoto, 1985; Buijs, Wortel & Hou, 1995). We have preliminary results suggesting that cluster I is at least in part composed of vasopressin-containing SCN neurons (C. M. A. Pennartz, N. Bos, A. M. S. Geurtsen, M. T. G. De Jeu, A. A. Sluiter, M. Mirmiran & R. M. Buijs, unpublished observations).
Concluding remarks
The electrophysiological and morphological characteristics of the clusters described here permit further thinking about their functional role in the context of circadian time keeping. Most cluster I and II cells fired spontaneously, which was not related to the presence of spontaneous postsynaptic potentials. Thus, a majority of neurons in these clusters are likely pacemaker cells in the sense that they sustain firing without being driven by synaptic input (cf. Thomson & West, 1990; Kim & Dudek, 1992; Bouskila & Dudek, 1993; Jiang et al. 1997a). Although an important role for regularly discharging, dorsomedial SCN cells in generating a circadian rhythm in SFR has been proposed (Shibata et al. 1984), we consider the participation of cluster I and II in this process still to be an open question because of the dependence of regularity on firing rate. We do predict, however, that cluster III cells are unlikely to contribute to this rhythm because they have zero or low-frequent firing rate regardless of circadian phase. In contrast to cluster I and II cells, discharges in these neurons seem to depend strongly on excitatory input or release from inhibition. Due to their peculiar adaptation and rebound bursting properties, cluster III cells seem to operate in a phasic mode of signal transmission, whereas clusters I and II follow tonic inputs more faithfully. Prolonged spike trains of cluster I and II neurons can be propagated to target structures outside SCN and along relatively small collateral networks within SCN. Cluster III cells not only project outside SCN but are likely to disseminate their burst-like output to tens or even hundreds of other SCN cells. Despite this novel perspective on SCN heterogeneity, further work will be necessary to assess which clusters participate in generating circadian rhythms. In particular, perforated-patch recordings may be instrumental in answering this question since whole-cell dialysis may result in a gradual loss of cell rhythmicity (C. M. A. Pennartz, M. {fontsize T. G. De Jeu & A. M. S. Geurtsen, unpublished observations). Other questions to be addressed in the future concern the supply of photic inputs to different clusters and their transmitter and peptide content.
Acknowledgments
We would like to thank Nico Bos, Ruud Buijs and Michel Hofman for helpful comments on the manuscript. This work was supported by a grant from the Institut de Recherches Internationales Servier (no. PHA-614-NLD) and by the Netherlands Organization for Scientific Research (grant no. 903-52-203).
References
- Akasu T, Shoji S, Hasuo H. Inward rectifier and low-threshold calcium currents contribute to the spontaneous firing mechanism in neurons of the rat suprachiasmatic nucleus. Pflügers Archiv. 1993;425:109–116. doi: 10.1007/BF00374510. [DOI] [PubMed] [Google Scholar]
- Blanton MG, Lo Turco JJ, Kriegstein AR. Whole cell recording from neurons in slices of reptilian and mammalian cerebral cortex. Journal of Neuroscience Methods. 1989;30:203–210. doi: 10.1016/0165-0270(89)90131-3. [DOI] [PubMed] [Google Scholar]
- Bouskila Y, Dudek FE. Neuronal synchronization without calcium-dependent synaptic transmission in the hypothalamus. Proceedings of the National Academy of Sciences of the USA. 1993;90:3207–3210. doi: 10.1073/pnas.90.8.3207. [DOI] [PMC free article] [PubMed] [Google Scholar]
- Bouskila Y, Dudek FE. A rapidly activating type of outward rectifier K+ current and A-current in rat suprachiasmatic nucleus neurones. The Journal of Physiology. 1995;488:339–350. doi: 10.1113/jphysiol.1995.sp020970. [DOI] [PMC free article] [PubMed] [Google Scholar]
- Buijs RM, Wortel J, Hou Y-X. Colocalization of gamma-aminobutyric acid with vasopressin, vasoactive intestinal peptide, and somatostatin in the rat suprachiasmatic nucleus. Journal of Comparative Neurology. 1995;358:343–352. doi: 10.1002/cne.903580304. [DOI] [PubMed] [Google Scholar]
- Cahill GM, Menaker M. Responses of the suprachiasmatic nucleus to retinohypothalamic tract volleys in a slice preparation of the mouse hypothalamus. Brain Research. 1989;479:65–75. doi: 10.1016/0006-8993(89)91336-x. [DOI] [PubMed] [Google Scholar]
- Card JP, Moore RY. The suprachiasmatic nucleus of the golden hamster: immunohistochemical analysis of cell and fiber distribution. Neuroscience. 1984;13:415–431. doi: 10.1016/0306-4522(84)90240-9. [DOI] [PubMed] [Google Scholar]
- Castel M, Morris J, Belenky M. Non-synaptic and dendritic exocytosis from dense-cored vesicles in the suprachiasmatic nucleus. NeuroReport. 1996;7:543–547. doi: 10.1097/00001756-199601310-00040. [DOI] [PubMed] [Google Scholar]
- Connors BW, Gutnick MJ. Intrinsic firing patterns of diverse neocortical neurons. Trends in Neurosciences. 1990;13:99–104. doi: 10.1016/0166-2236(90)90185-d. [DOI] [PubMed] [Google Scholar]
- De Jeu MTG, Pennartz CMA. Functional characterization of the H-current (IH) in SCN neurons in subjective day and night: a whole-cell patch-clamp study in acutely prepared brain slices. Brain Research. 1997;767:72–80. doi: 10.1016/s0006-8993(97)00632-x. [DOI] [PubMed] [Google Scholar]
- Earnest DJ, Sladek CD. Circadian rhythms of vasopressin release from individual rat suprachiasmatic explants in vitro. Brain Research. 1986;382:129–133. doi: 10.1016/0006-8993(86)90119-8. [DOI] [PubMed] [Google Scholar]
- Erickson RP, Rodgers JL, Sarle WS. Statistical analysis of neural organization. Journal of Neurophysiology. 1993;70:2289–2300. doi: 10.1152/jn.1993.70.6.2289. [DOI] [PubMed] [Google Scholar]
- Everitt BS. Cluster Analysis. London: Edward Arnold; 1993. [Google Scholar]
- Gordon AD. Classification. Methods for the Exploratory Analysis of Multivariate Data. London: Chapman & Hall; 1981. [Google Scholar]
- Gray CM, McCormick DA. Chattering cells: superficial pyramidal neurons contributing to the generation of synchronous oscillations in the visual cortex. Science. 1996;274:109–113. doi: 10.1126/science.274.5284.109. [DOI] [PubMed] [Google Scholar]
- Greene RW, Haas HL, McCarley RW. A low threshold calcium spike mediates firing pattern alterations in pontine reticular neurons. Science. 1986;234:738–740. doi: 10.1126/science.3775364. [DOI] [PubMed] [Google Scholar]
- Groos GA, Hendriks J. Regularly firing neurons in the rat suprachiasmatic nucleus. Experientia. 1979;35:1597–1598. doi: 10.1007/BF01953215. [DOI] [PubMed] [Google Scholar]
- Güldner F-H, Wolff JR. Dendro-dendritic synapses in the suprachiasmatic nucleus of the rat hypothalamus. Journal of Neurocytology. 1974;3:245–250. doi: 10.1007/BF01098391. [DOI] [PubMed] [Google Scholar]
- Hausser M, Stuart G, Racca C, Sakmann B. Axonal initiation and active dendritic propagation of action potentials in substantia nigra neurons. Neuron. 1995;15:637–647. doi: 10.1016/0896-6273(95)90152-3. [DOI] [PubMed] [Google Scholar]
- Hermes MLHJ, Coderre EM, Buijs RM, Renaud LP. GABA and glutamate mediate rapid neurotransmission from suprachiasmatic nucleus to hypothalamic paraventricular nucleus in rat. The Journal of Physiology. 1996;496:749–757. doi: 10.1113/jphysiol.1996.sp021724. [DOI] [PMC free article] [PubMed] [Google Scholar]
- Ibata Y, Takahashi Y, Okamura H, Kawakami F, Terubayashi H, Kubo T, Yanaihara N. Vasoactive intestinal polypeptide (VIP)-like immunoreactive neurons located in the rat suprachiasmatic nucleus receive a direct retinal projection. Neuroscience Letters. 1989;97:1–5. doi: 10.1016/0304-3940(89)90129-8. [DOI] [PubMed] [Google Scholar]
- Inouye S-IT. Circadian rhythms of neuropeptides in the suprachiasmatic nucleus. In: Buijs RM, Kalsbeek A, Romijn HJ, Pennartz C MA, Mirmiran M, editors. Hypothalamic Integration of Circadian Rhythms. Amsterdam: Elsevier; 1996. pp. 75–90. [DOI] [PubMed] [Google Scholar]
- Inouye S-IT, Kawamura H. Persistence of circadian rhythmicity in a mammalian hypothalamic ‘island’ containing the suprachiasmatic nucleus. Proceedings of the National Academy of Sciences of the USA. 1979;76:5962–5966. doi: 10.1073/pnas.76.11.5962. [DOI] [PMC free article] [PubMed] [Google Scholar]
- Jiang Z-G, Yang Y, Liu Z-P, Allen CN. Membrane properties and synaptic inputs of suprachiasmatic nucleus neurons in rat brain slices. The Journal of Physiology. 1997a;499:141–159. doi: 10.1113/jphysiol.1997.sp021917. [DOI] [PMC free article] [PubMed] [Google Scholar]
- Jiang Z-G, Yang Y-Q, Allen CN. Tracer and electrical coupling of rat suprachiasmatic nucleus neurons. Neuroscience. 1997b;77:1059–1066. doi: 10.1016/s0306-4522(96)00539-8. [DOI] [PubMed] [Google Scholar]
- Kim YI, Dudek FE. Intracellular electrophysiological study of suprachiasmatic nucleus neurons in rodents: inhibitory synaptic mechanisms. The Journal of Physiology. 1992;458:247–260. doi: 10.1113/jphysiol.1992.sp019416. [DOI] [PMC free article] [PubMed] [Google Scholar]
- Kim YI, Dudek FE. Membrane properties of rat suprachiasmatic nucleus neurons receiving optic nerve input. The Journal of Physiology. 1993;464:229–243. doi: 10.1113/jphysiol.1993.sp019632. [DOI] [PMC free article] [PubMed] [Google Scholar]
- Llinás R, Yarom Y. Electrophysiology of mammalian inferior olivary neurones in vitro. Different types of voltage-dependent ionic conductances. The Journal of Physiology. 1981;315:549–567. doi: 10.1113/jphysiol.1981.sp013763. [DOI] [PMC free article] [PubMed] [Google Scholar]
- McLarnon JG. Potassium currents in motoneurones. Progress in Neurobiology. 1995;47:513–531. doi: 10.1016/0301-0082(95)00032-1. [DOI] [PubMed] [Google Scholar]
- Magistretti J, Mantegazza M, Guatteo E, Wanke E. Action potentials recorded with patch-clamp amplifiers: are they genuine? Trends in Neurosciences. 1996;19:530–534. doi: 10.1016/s0166-2236(96)40004-2. [DOI] [PubMed] [Google Scholar]
- Mainen ZF, Sejnowski TJ. Influence of dendritic structure on firing pattern in model neocortical neurons. Nature. 1996;382:363–366. doi: 10.1038/382363a0. [DOI] [PubMed] [Google Scholar]
- Mills SL, Massey SC. Differential properties of two gap junctional pathways made by AII amacrine cells. Nature. 1995;377:734–737. doi: 10.1038/377734a0. [DOI] [PubMed] [Google Scholar]
- Moore RY, Eichler VB. Loss of a circadian adrenal corticosterone rhythm following suprachiasmatic lesions in the rat. Brain Research. 1972;42:201–206. doi: 10.1016/0006-8993(72)90054-6. [DOI] [PubMed] [Google Scholar]
- Neher E. Correction for liquid junction potentials in patch clamp experiments. Methods in Enzymology. 1992;207:123–131. doi: 10.1016/0076-6879(92)07008-c. [DOI] [PubMed] [Google Scholar]
- Pennartz CMA, Bierlaagh MA, Geurtsen AMS. Cellular mechanisms underlying spontaneous firing in rat suprachiasmatic nucleus: involvement of a slowly inactivating component of sodium current. Journal of Neurophysiology. 1997;78:1811–1825. doi: 10.1152/jn.1997.78.4.1811. [DOI] [PubMed] [Google Scholar]
- Pongracz F, Firestein S, Shepherd GM. Electrotonic structure of olfactory sensory neurons analyzed by intracellular and whole cell patch techniques. Journal of Neurophysiology. 1991;65:747–758. doi: 10.1152/jn.1991.65.3.747. [DOI] [PubMed] [Google Scholar]
- Ralph MR, Foster RG, Davis FC, Menaker M. Transplanted suprachiasmatic nucleus determines circadian period. Science. 1990;247:975–978. doi: 10.1126/science.2305266. [DOI] [PubMed] [Google Scholar]
- Sah P. Ca2+-activated K+ currents in neurones: types, physiological roles and modulation. Trends in Neurosciences. 1996;19:150–154. doi: 10.1016/s0166-2236(96)80026-9. [DOI] [PubMed] [Google Scholar]
- Schwartz WJ, Gross RA, Morton MT. The suprachiasmatic nuclei contain a tetrodotoxin-resistant circadian pacemaker. Proceedings of the National Academy of Sciences of the USA. 1987;84:1694–1698. doi: 10.1073/pnas.84.6.1694. [DOI] [PMC free article] [PubMed] [Google Scholar]
- Shibata S, Liou SY, Ueki S, Oomura Y. Influence of environmental light-dark cycle and enucleation on activity of suprachiasmatic neurons in slice preparations. Brain Research. 1984;302:75–81. doi: 10.1016/0006-8993(84)91286-1. [DOI] [PubMed] [Google Scholar]
- Silver R, Lesauter J, Tresco PA, Lehman MN. A diffusible coupling signal from the transplanted suprachiasmatic nucleus controlling circadian locomotor rhythms. Nature. 1996;382:810–813. doi: 10.1038/382810a0. [DOI] [PubMed] [Google Scholar]
- Staley KJ, Otis TS, Mody I. Membrane properties of dentate gyrus granule cells: comparison of sharp microelectrode and whole-cell recordings. Journal of Neurophysiology. 1992;67:1346–1358. doi: 10.1152/jn.1992.67.5.1346. [DOI] [PubMed] [Google Scholar]
- Stephan FK, Zucker I. Circadian rhythms in drinking behavior and locomotor activity of rats are eliminated by hypothalamic lesions. Proceedings of the National Academy of Sciences of the USA. 1972;69:1583–1586. doi: 10.1073/pnas.69.6.1583. [DOI] [PMC free article] [PubMed] [Google Scholar]
- Storm JF. Potassium currents in hippocampal pyramidal cells. Progress in Brain Research. 1990;83:161–187. doi: 10.1016/s0079-6123(08)61248-0. [DOI] [PubMed] [Google Scholar]
- Tasker JG, Dudek FE. Electrophysiological properties of neurones in the region of the paraventricular nucleus in slices of rat hypothalamus. The Journal of Physiology. 1991;434:271–293. doi: 10.1113/jphysiol.1991.sp018469. [DOI] [PMC free article] [PubMed] [Google Scholar]
- Thomson AM, West DC. Factors affecting slow regular firing in the suprachiasmatic nucleus in vitro. Journal of Biological Rhythms. 1990;5:59–75. doi: 10.1177/074873049000500106. [DOI] [PubMed] [Google Scholar]
- Van Den Pol AN. The hypothalamic suprachiasmatic nucleus of rat: intrinsic anatomy. Journal of Comparative Neurology. 1980;191:661–702. doi: 10.1002/cne.901910410. [DOI] [PubMed] [Google Scholar]
- Van Den Pol AN, Tsujimoto KL. Neurotransmitters of the hypothalamic suprachiasmatic nucleus: immunocytochemical analysis of 25 neuronal antigens. Neuroscience. 1985;15:1049–1086. doi: 10.1016/0306-4522(85)90254-4. [DOI] [PubMed] [Google Scholar]
- Watts AG. The efferent projections of the suprachiasmatic nucleus: anatomical insights into the control of circadian rhythms. In: Klein DC, Moore RY, Reppert SM, editors. The Suprachiasmatic Nucleus: The Mind's Clock. New York: Oxford University Press; 1991. pp. 77–106. [Google Scholar]
- Welsh DK, Logothetis DE, Meister M, Reppert SM. Individual neurons dissociated from rat suprachiasmatic nucleus express independently phased circadian firing rhythms. Neuron. 1995;14:697–706. doi: 10.1016/0896-6273(95)90214-7. [DOI] [PubMed] [Google Scholar]
- Wheal HV, Thomson AM. The electrical properties of neurones of the rat suprachiasmatic nucleus recorded intracellularly in vitro. Neuroscience. 1984;13:97–104. doi: 10.1016/0306-4522(84)90262-8. [DOI] [PubMed] [Google Scholar]