

Abstract
The γ-subunit in recombinant γ-aminobutyric acid (GABAA) receptors reduces the sensitivity of GABA-triggered Cl− currents to inhibition by Zn2+ and transforms the apparent mechanism of antagonism from non-competitive to competitive. To investigate underlying receptor function we studied Zn2+ effects on macroscopic and single-channel currents of recombinant α1β2 and α1β2γ2 receptors expressed heterologously in HEK-293 cells using the patch-clamp technique and rapid solution changes.
Zn2+ present for > 60 s (constant) inhibited peak, GABA (5 μM)-triggered currents of α1β2 receptors in a concentration-dependent manner (inhibition equation parameters: concentration at half-amplitude (IC50) = 0.94 μM; slope related to Hill coefficient, S= 0.7) that was unaffected by GABA concentration. The γ2 subunit (α1β2γ2 receptor) reduced Zn2+ sensitivity more than fiftyfold (IC50= 51 μM, S= 0.86); increased GABA concentration (100 μM) antagonized inhibition by reducing apparent affinity (IC50= 322 μM, S= 0.79). Zn2+ slowed macroscopic gating of α1β2 receptors by inducing a novel slow exponential component in the activation time course and suppressing a fast component of control desensitization. For α1β2γ2 receptors, Zn2+ accelerated a fast component of apparent desensitization.
Zn2+ preincubations lasting up to 10 s markedly increased current depression and activation slowing of α1β2 receptors, but had little effect on currents from α1β2γ2 receptors.
Steady-state fluctuation analysis of macroscopic α1β2γ2 currents (n= 5) resulted in control (2 μM GABA) power density spectra that were fitted by a sum of two Lorentzian functions (relaxation times: 37 ± 5.6 and 1.41 ± 0.15 ms, means ± s.e.m.). Zn2+ (200 μM) reduced the total power almost sixfold and accelerated the slow (23 ± 2.8 ms, P < 0.05) without altering the fast (1.40 ± 0.16 ms) relaxation time. The ratio (fast/slow) of Lorentzian areas was increased by Zn2+ (control, 3.39 ± 0.55; Zn2+, 4.9 ± 0.37, P < 0.05).
Zn2+ (500 μM) depression of previously activated current amplitudes (% control) for α1β2γ2 receptors was independent of GABA concentration (5 μM, 13.2 ± 0.72 %; 100 μM, 12.2 ± 2.9 %, P < 0.8, n= 5). Both onset and offset inhibition time courses were biexponential. Onset rates were enhanced by Zn2+ concentration. Inhibition onset was also biexponential for preactivated α1β2 receptors with current depression more than fourfold less sensitive (5 μM GABA, IC50= 3.8 μM, S= 0.84) relative to that in constant Zn2+.
The results lead us to propose a general model of Zn2+ inhibition of GABAA receptors in which Zn2+ binds to a single extracellular site, induces allosteric receptor inhibition involving two non-conducting states, site affinity is state-dependent, and the features of state dependence are determined by the γ-subunit.
γ-Aminobutyric acid (GABA) is the primary inhibitory neurotransmitter in the vertebrate central nervous system. GABA binding to GABAA receptors activates an integral Cl− channel that results in membrane hyperpolarization and suppressed neuronal excitability. GABAA receptors are putative heteropentamers composed of protein subunits from five distinct classes (α, β, γ, δ, and ε). The resultant structural diversity is significant, since the properties of heterologously expressed channels are critically dependent on subunit combination (Levitan et al. 1988; Verdoorn, Draguhn, Ymer, Seeburg & Sakmann, 1990; Sigel, Baur, Mohler & Malherbe, 1990).
Zn2+ is a trace metal that is differentially distributed in the central nervous system. Zn2+ modulates synaptic transmission (Westbrook & Mayer, 1987; Xie & Smart, 1991; Zhou & Hablitz, 1993) and specifically inhibits GABA-triggered Cl− fluxes of GABAA receptors (Westbrook & Mayer, 1987; Smart & Constanti, 1990; Legendre & Westbrook, 1991; Celentano, Gyenes, Gibbs & Farb, 1991; Smart, 1992). This may have meaningful functional consequences since Zn2+ is found in vertebrate synaptic vesicles (Haug, 1967; Perez-Clausell & Danscher, 1985), released by synaptic activation (Howell, Welch & Frederickson, 1984; Aniksztejn, Charlton & Ben-Ari, 1987) and may reach local concentrations of hundreds of micromoles per litre (Assaf & Chung, 1984; Frederickson & Moncrieff, 1994).
The sensitivity of native GABAA receptors to Zn2+ inhibition is diverse. Inhibition is observed in lobster muscle (Smart & Constanti, 1982) and cultured hippocampal neurons (Westbrook & Mayer, 1987; Mayer & Vyklicky, 1989), but not in dorsal horn interneurons (Curtis & Gynther, 1987). Studies of recombinant receptors indicate this diversity is determined by subunit composition where the presence of the γ-subunit leads to relative insensitivity (Draguhn, Verdoorn, Ewert, Seeburg & Sakmann, 1990; Smart, Moss, Xie & Huganir, 1991). The insensitivity of γ-subunit-containing receptors is further moderated by coexpression with δ-subunits (Saxena & Macdonald, 1994) or by variation in the α-subunit type (α1 vs.α2 or α3) (White & Gurley, 1995).
The mechanism of antagonism is also variable. Inhibition of GABA-triggered currents in native GABAA receptors appears competitive in dorsal root ganglion (Akaike, Yakushiji, Tokutomi & Carpenter, 1987; Yakushiji, Tokutomi, Akaike & Carpenter, 1987) and spinal cord (Celentano et al. 1991). However, the apparent mechanism is non-competitive in hippocampus and rat superior cervical ganglion (Westbrook & Mayer, 1987; Mayer & Vyklicky, 1989; Smart & Constanti, 1990; Legendre & Westbrook, 1991). Recombinant studies suggest the γ-subunit also influences the apparent mechanism of inhibition such that αβ receptors manifest non-competition (Draguhn et al. 1990; Smart et al. 1991) and αβγ receptors display competition (Chang, Amin & Weiss, 1995; for review, see Smart, Xie & Krishek, 1994).
It is likely that Zn2+ binds to a distinct extracellular site, allosterically triggering transition to a long-lived, non-conducting state (Celentano et al. 1991; Smart, 1992; White & Gurley, 1995). This reconciles a number of consistent observations made in native and recombinant receptors: weak voltage dependence (Westbrook & Mayer, 1987; Mayer & Vyklicky, 1989; Draguhn et al. 1990; Smart & Constanti, 1990; Legendre & Westbrook, 1991; Celentano et al. 1991), little or no change in single-channel properties (Draguhn et al. 1990; Legendre & Westbrook, 1991; Smart, 1992), and an extracellular site that is distinct from GABA, barbiturates, benzodiazepines, steroids and picrotoxin sites (Legendre & Westbrook, 1991; Celentano et al. 1991; Smart, 1992). However, this model of inhibition cannot account for the variety observed in the mechanism of antagonism. Therefore, either key features of a general model are missing, or none exist owing to differences in fundamental function resulting from changeable subunit composition. To explore this issue, we investigated the effects of Zn2+ on macroscopic and single-channel, GABA-triggered, Cl− currents of recombinant receptors composed of α1β2 and α1β2γ2 subunits; these receptors manifest apparent non-competitive and competitive inhibition, respectively. Receptors resulted from transient transfection with combinations of cDNAs encoding rat brain GABAA receptors subunits of HEK-293 cells. Rapid solution changes (Gingrich, Roberts & Kass, 1995) provided for the study of changes in macroscopic gating.
In this study, Zn2+ induced distinct effects on current magnitude and gating in GABAA receptors that differed in the γ2-subunit. We considered explicit gating models to account for the empirical observations. The results lead us to propose a general model of Zn2+ inhibition of GABAA receptors that includes a single extracellular site, receptor inhibition involving two allosteric kinetically distinct non-conducting states, and state-dependent affinity with features determined by the γ-subunit. A preliminary report of this work has appeared in abstract form (Burkat, Roberts & Gingrich, 1995).
METHODS
Cell culture and transient transfection
Transformed HEK-293 cells, purchased from ATCC (Bethesda, MD, USA) or generously provided by Dr Robert Kass, Department of Pharmacology, Columbia University (New York, NY, USA) were plated onto fibronectin (Sigma)-coated plastic coverslips (Nunc, Inc., Naperville, IL, USA) and cultured in minimum essential medium (MEM) supplemented with 10 % fetal calf serum, 1 % glutamine, 1 % penicillin, and 1 % streptomycin (all Gibco). Following incubation in 5 % CO2 for 48-72 h, cells were transiently transfected using a lipofection technique previously described (Gingrich et al. 1995) with cDNAs encoding rat brain α1, β2, and γ2 subunits inserted individually into the plasmid pCDM8 (Invitrogen, Carlsbad, CA, USA). Briefly, aliquots of the lipofection reagent (Lipofectamine, Gibco), and appropriate plasmids were mixed in a modified serum-free medium (Optimem, Gibco) and incubated for 10 min. Transfections were based on equal weights of total DNA. t-Antigen was coexpressed with α1 and β2 to enhance expression. Cells were washed and serum-containing medium was replaced with Optimem, followed by addition of liposome-plasmid-containing solution. After a 16-18 h incubation period (37°C, 5 % CO2), the cells were washed and returned to serum-containing MEM for further incubation. Cells were ready for electrophysiological studies approximately 48 h after transfection. To address the possibility that HEK-293 cells may constitutively express GABAA receptor subunits, we transfected our cell line with α1- or β2-subunits alone. No detectable GABA-triggered currents were elicited from single cells, ruling out the possibility of significant constitutive production of α, β, or γ subunits since αβ and αγ combinations express robustly (Verdoorn et al. 1990).
Electrophysiology
Coverslips with transfected cells were transferred to a modified culture dish mounted on the stage of an Olympus IMT-2 inverted microscope with Hoffman modulated optics. The cells were immersed in a modified Tyrode solution containing (mM): 135 NaCl, 5.4 KCl, 1 MgCl2, 5 Hepes (pH 7.3). The pipette solution consisted of (mM): 140 CsCl, 1 MgCl2, 11 EGTA, 10 Hepes (pH 7.3). Currents were recorded with whole-cell and outside-out configurations of the patch clamp (Hamill, Marty, Neher, Sakmann & Sigworth, 1981) using an Axopatch 200A (Axon Instruments) amplifier. Macroscopic currents (-60 mV) were filtered at 1 kHz (-3 dB, 4-pole Bessel) and sampled at 1-2 kHz. Single-channel currents from outside-out patches (-50 mV) were filtered at 1 kHz (-3 dB, 4-pole Bessel) and sampled at 5 kHz. Digitized data were collected and stored on IBM-compatible (Gateway 2000 4DX-2-66) computers running the Axobasic Environment (Axon Instruments) using software of our own design. We used single cells that were not electrically coupled to other cells as judged visually and by cell capacitance (10-20 pF, typical for individual HEK cells). Data were collected at room temperature (20-23°C). The chloride potential is 0 mV under these ionic conditions resulting in negative currents (outward Cl− movement) in our experiments. Zn2+ (0-1000 μM) was present in the bathing solution for more than 60 s before GABA application unless otherwise indicated.
Rapid solution changes
GABA (Sigma) and Zn2+ were applied transiently to the cells via an electro-mechanical solution changer. Control and test solutions were introduced into the lumen of dual- and triple-barrelled pipettes. A syringe pump (Harvard Instruments, Cambridge, MA, USA) determined the rate of solution perfusion. The pipette was mounted on a macro-block piezoelectric transducer (Polytec Optronics, Costa Mesa, CA, USA), which can move the pipette tip 50 μm in < 5 ms. The cell was continually perfused with control solution. Test solutions were applied by delivering the appropriate voltage pulse to the macro-block translator such that the pipette tip moved the distance between the stream centres. In this manner, test solutions containing combinations of GABA and Zn2+ could be pulsed on-off around a cell in < 30 ms or a cell-free patch in < 1 ms. The period of GABA application was sufficiently long to prevent accumulation of desensitized receptors (generally > 120 s). Following washout additional GABA-triggered currents were collected to exclude cells that suffered from rundown (> 10 % decline).
Fluctuation analysis of steady-state, GABA-gated currents
Steady-state, GABA-gated current noise was digitized on-line (1 kHz) after low-pass analog filtering at 500 Hz (-3db, 8-pole Bessel). Digitized records underwent digital high-pass filtering at 0.25 Hz (2-pole). Epochs of 500 ms (enabling 2 Hz resolution) were visually inspected and those with artifacts were rejected or edited accordingly. Mean spectral density of each current was calculated from fifteen to forty separate spectra. The net mean power spectrum for the GABA-gated noise was obtained by subtraction of the mean background spectrum in the absence of GABA. The manipulations of sampled data were performed using routines of our own design written in the MATLAB (Mathworks, Natick, MA, USA) environment. The net, one-sided GABA-gated spectra, were fitted with the sum of two Lorentzian components using a least-squares technique.
Data analysis
The time courses of composite activation and desensitization, inhibition onset or offset of macroscopic currents were fitted with a sum of up to three exponentials:
with Origin (MicroCal, Northampton, MA, USA) using a least-squares criterion, where ki values are estimated rates (per second). Fitting began after the initial sigmoidal foot when discernible. Multiexponential fitting allows an accurate description of current responses with rising and falling phases since both processes are addressed simultaneously and provides for analysis of dominant gating (Maconochie, Zempel & Steinbach, 1994). Inhibition concentration-response relationships were fitted with a normalized inhibition equation: I= IC50S/(IC50S+[Zn2+]S) using a least-squares technique, where I is current magnitude normalized to control, IC50 is the half-blocking concentration and S is the slope factor related to the Hill coefficient. Results are given as means ±s.e.m. Statistical tests were Student's unpaired t tests unless otherwise specified and significance was taken as P < 0.05.
Simulation of gating models and parameter estimation
Simulations of gating models utilized differential equations solved numerically using the Euler method and written in Excel (Microsoft). The sensitivity of the response to iteration time step was examined in all simulations and made sufficiently small to minimize error. The parameter estimation technique minimized a squared error performance criterion using the Levenberg- Marquardt method. The uniqueness of parameter sets was evaluated by systematically adjusting the initial parameter values before parameter estimation. In this way the performance surface was searched from different initial starting locations. A parameter set was considered unique if the final parameter values were insensitive to initial values. All programs were compiled and executed on an IBM-compatible 486 (Gateway 2000) computer.
RESULTS
The sensitivity and mechanism of antagonism of Zn2+ inhibition is influenced by the γ2-subunit
We first considered inhibition of peak current by Zn2+. Figure 1Aa shows currents (activation marked by downward current deflection) over a range of Zn2+ concentrations triggered by GABA (5 μM) in individual cells expressing α1β2 and α1β2γ2 subunits. The dissimilar macroscopic kinetics in control (Zn2+, 0 μM) document the incorporation of different subunits in these receptors (Verdoorn et al. 1990). Zn2+ inhibited peak currents of α1β2 receptors in a dose-dependent fashion. Figure 1Ac plots the concentration- response relationship of normalized current in grouped data and the fit of these data by an inhibition equation. Comparable inhibition of α1β2γ2 currents (Fig. 1Ab) required more than fiftyfold greater Zn2+ concentration marking strongly reduced sensitivity that is confirmed in grouped data (Fig. 1Ac) by a rightward shift of the fitted inhibition curve. This is in accordance with previous reports of the γ-subunit inducing relative insensitivity to Zn2+ (Draguhn et al. 1990; Smart et al. 1991). We next examined GABA antagonism of inhibition at a fixed Zn2+ concentration. Figure 1Ba shows currents triggered by two GABA concentrations (low, 5 μM; high, 100 μM) in control and nearly equipotent Zn2+ concentrations (at 5 μM GABA) in cells expressing the indicated receptors. Depression of α1β2 peak current by Zn2+ was unchanged by the increase in GABA concentration. This finding was reproduced in grouped data (Fig. 1Bb) where currents were reduced by roughly 80 % independent of GABA concentration, denoting a non-competitive mechanism consistent with previous reports (Draguhn et al. 1990; Smart et al. 1991).
Figure 1. Zn2+ inhibition of peak current.
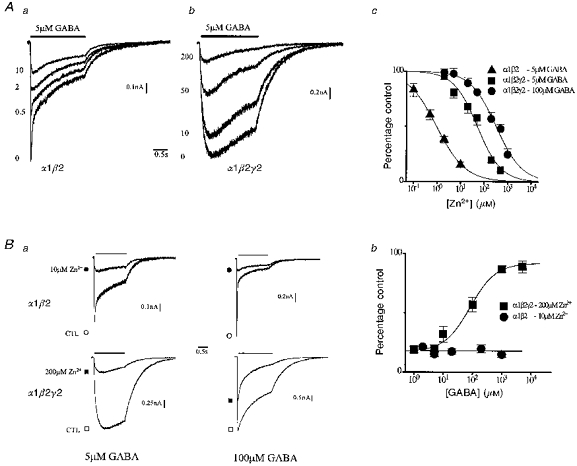
Aa and b, macroscopic currents triggered by GABA (5 μM, filled bar) in the presence of a range of Zn2+ concentrations (in μM; left of trace) for individual cells expressing α1β2 and α1β2γ2 subunits. Downward current deflection reflects receptor opening. GABA was applied using rapid solution changes. c, inhibition curves were constructed by plotting peak current as percentage of control versus Zn2+ concentration (generally n= 6). Smooth curves are least-squares fits of the inhibition equation (see Methods). Fitted parameters are: α1β2 (5 μM GABA), IC50= 0.94 μM, S= 0.70; α1β2γ2 (5 μM GABA), IC50= 51 μM, S= 0.86; α1β2γ2 (100 μM GABA), IC50= 322 μM, S= 0.79. Ba, currents triggered by application (bars) of different GABA concentrations in the absence (CTL, open symbols) and presence (filled symbols) of Zn2+ concentrations from individual cells expressing indicated receptors. b, peak current (percentage of control) concentration-response relationships for GABA at a fixed Zn2+ concentration (n= 5). Continuous lines were drawn by hand.
In contrast, Zn2+ inhibition of α1β2γ2 currents was partly surmounted by the same increase in GABA concentration indicating apparent competition, which was confirmed in grouped data (Fig. 1Bb). Notably, high GABA concentration (5000 μM) incompletely antagonized inhibition. To characterize the mechanism of antagonism further, we re-examined the Zn2+ inhibition relationship but at higher GABA concentration (100 μM). This change shifted the relationship rightward indicating an apparent reduction of Zn2+ affinity (Fig. 1Ac). In addition, inhibition of current plateau (data not shown) was independent of GABA concentration (1 μM, 17 ± 3.4 % of control; 1000 μM, 24 ± 4.6 %; P < 0.24, n= 5), which indicates non-competition of receptors contributing to current at equilibrium. These observations point to apparent ‘mixed antagonism’ (Smart & Constanti, 1986) of α1β2γ2 receptors, and extend previous findings of competition by Chang et al. (1995) in Xenopus oocytes. Also, the findings indicate, in the same expression system, that the γ2-subunit determines the apparent mechanism of antagonism for peak current.
Zn2+ induces distinct effects on macroscopic gating of α1β2 and α1β2γ2 receptors
We used rapid solution changes (< 30 ms), which permit kinetic analysis of gating manifest in macroscopic currents (Maconochie et al. 1994; Gingrich et al. 1995). Figure 1A shows that Zn2+ slowed α1β2 apparent desensitization in a dose-dependent fashion, while α1β2γ2 gating changed little except at high concentrations where desensitization appeared slightly accelerated. These divergent observations prompted us to investigate gating effects. Figure 2Aa shows α1β2 responses (5 μM GABA) from Fig. 1B replotted after normalizing by peak current. The control current (CTL) exhibited rapid activation resulting in an early current peak, followed by biphasic desensitization. To characterize the dominant gating, we fitted multiexponential functions to current time courses (Maconochie et al. 1994). The inset in Fig. 2Aa shows that the control response is well described by a triexponential function (smooth line) composed of a rising and two falling components that represent activation and desensitization, respectively. These components are recognizable as individual phases and are labelled with associated exponential time constants. Zn2+ markedly alters the time course by slowing activation and apparent desensitization. Closer inspection of the Zn2+ response, shifted for clarity, reveals a biphasic activation time course. Figure 2Ab plots normalized currents on a semilogarithmic scale to examine the kinetic nature of the activation time course. The left panel shows that control activation is well described by a single fast exponential function. The right panel shows that Zn2+ alters activation by introducing a new slow exponential component. The sum of these two exponential functions (smooth line) closely accounts for the activation time course. The entire Zn2+ response was well fitted by a triexponential function composed of the two activation components and a single slow desensitization component (not shown).
Figure 2. Zn2+ effects on macroscopic gating.
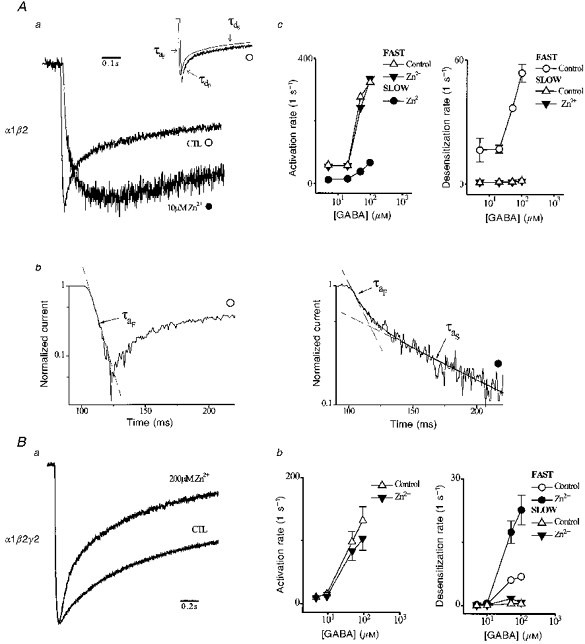
Aa, normalized α1β2 responses (5 μM GABA) replotted from Fig. 1B to illustrate the effects of Zn2+ on macroscopic current kinetics. Zn2+ response was rightward shifted to permit clear observation of activation time course. Inset, plot of control response and triexponential function fit (smooth line, shifted for clarity). Exponential components are indicated by their respective time constants (fast activation, τaF; fast, τdF, and slow, τdS densensitization). Time constants (τ) are the reciprocal of associated rates (k). Fitted parameters are: AaF= 1.2 nA, kaF= 108 s−1, AdF= -0.81 nA, kdF= 33.3 s−1, AdS= -0.33 nA, kdS= 2.48 s−1, B = -0.42 nA. Ac, GABA concentration dependence of activation and desensitization rates from fitted triexponential functions (generally n= 5 cells). Ab, semilogarithmic plots of currents normalized to peak current. Control (○) activation is described by a single fast exponential (dashed line, time constant, τaF). Zn2+ (•) adds a second slow exponential component to activation (time constant, τaS). The sum of these exponentials (continuous line) describes the activation time course. Ba, normalized α1β2γ2 responses (100 μM GABA) replotted from Fig. 1B to illustrate the effects of Zn2+ on macroscopic current kinetics. Bb, GABA concentration dependence of activation and desensitization rates from fitted triexponential functions (generally n= 5 cells).
To examine the interaction of inhibition and gating we plotted fitted kinetic parameters versus GABA concentration (Fig. 2Ac). Figure 2Ac plots rates of activation (fast and slow) and desensitization in grouped data. In control, activation and desensitization were enhanced by GABA (Maconochie et al. 1994). In control and Zn2+, the fast rates of activation and the slow components of desensitization were similarly dependent on GABA. The slow, Zn2+-induced rate of activation was more than fivefold less than the fast, and was augmented by GABA. The results are consistent with two discrete populations of resting receptors in Zn2+. One is probably Zn2+ free, which activates normally, and the other Zn2+ bound, which activates slowly. In turn, slowing of apparent desensitization may be explained by a reduction in the probability of states that experience desensitization. Alternatively, Zn2+ may rapidly interact with ligand-bound, closed receptors before opening during activation. However, this mechanism seems unlikely to account for non-competition. More complex mechanisms may be invoked to account for these results and cannot be excluded. At a simple level, the data are consistent with primary inhibition of resting α1β2 receptors.
Zn2+ induced different effects in α1β2γ2 currents. Figure 2Ba shows α1β2γ2 responses from Fig. 1B replotted after normalization, which demonstrates that Zn2+ accelerates apparent desensitization. We again fitted triexponential functions to the current time course. Unlike α1β2 receptors, both control and Zn2+ responses were well fitted by a triexponential function comprised of one activation and two desensitization components (not shown). Figure 2Bb plots, in grouped data, rates of fast activation and desensitization (fast and slow) versus GABA concentration. Activation rate was reduced slightly by Zn2+ at high GABA concentration. Zn2+ enhanced apparent desensitization by increasing the fast component nearly threefold at high GABA concentration with little change in the slow component. The findings are consistent with preferential inhibition of states visited after ligand exposure.
These differential effects on receptor gating support the argument for a state-dependent, inhibitory mechanism with features determined by the γ2-subunit. For α1β2γ2, Zn2+ preferentially inhibits states visited following ligand exposure. In contrast, resting α1β2 receptors are primarily inhibited and must ultimately proceed to desensitized states relatively unaffected by GABA, since inhibition appears non-competitive.
Role of resting, ligand-free receptors
To investigate the role of resting α1β2 receptors we examined the effects of Zn2+ preincubation on current magnitude and activation kinetics. Figure 3Aa shows a response family triggered by GABA from an individual cell expressing α1β2 receptors. Bracketing control responses in the absence of Zn2+ are shown on the far left and right and document preparation stability. Next, six responses with different Zn2+ preincubation periods (time between Zn2+ (open bar) and GABA (filled bar) applications) are plotted on the same baseline. The first test response was induced by coapplication of GABA and Zn2+, a preincubation period of zero. Peak current was reduced roughly one-third without alteration of activation kinetics (see Fig. 3Ab). Increasing preincubation time resulted in complex effects on current magnitude and kinetics, indicating notable interactions of Zn2+ with resting, ligand-free receptors. Inhibition of peak current increased markedly over the first second, and eventually reached a plateau by 5 s.
Figure 3. Effects of Zn2+ preincubation on current magnitude and kinetics.
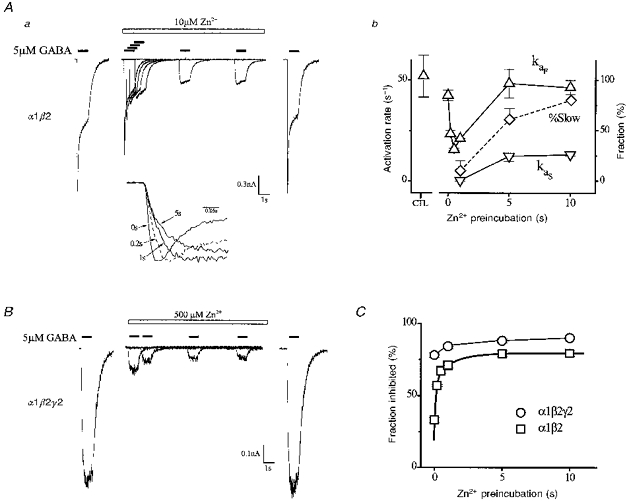
Aa, currents triggered by GABA (5 μM, filled bars) from a single cell expressing α1β2 receptors with differing periods of Zn2+ preincubation. An initial control response is displayed on the extreme left. Shown next on the same baseline are responses over a range of Zn2+ preincubation periods (time difference between Zn2+ (10 μM, open bar) and GABA applications). A final bracketing control response is shown on the extreme right. Inset shows four normalized responses aligned in time on an expanded time scale with indicated preincubation periods. Ab, plots of activation parameters derived from multiexponential fitting. Plotted parameters include fast (kaF) and slow (kaS) activation rates, and fraction of activation time course that is slow (% Slow). B, same protocol as in Aa applied to a single cell expressing α1β2γ2 receptors (5 μM GABA, 500 μM Zn2+). C, fractional inhibition of current magnitude versus Zn2+ preincubation in cells expressing α1β2 and α1β2γ2 receptors as indicated (n= 3-7 cells). Thick smooth curve is a biexponential function fit of α1β2 response (parameters: AF= -0.31, kF= 6.7 s−1, AS= -0.17, kS= 0.72 s−1, and B = 0.79).
The inset in Fig. 3A replots four responses with different preincubation periods after magnitude normalization and alignment in time to permit comparison of activation kinetics. This shows activation kinetics were progressively slowed by increasing the preincubation period. As before, the time course was characterized by triexponential function fitting. Figure 3Ab and C plots in grouped data, activation rates (fast and slow), the fraction of slow activation (% Slow), and fraction of inhibited receptors versus preincubation period. Both the number of inhibited receptors and activation kinetics varied with the preincubation period in a biphasic manner. The first phase occurred rapidly within 0.5 s, wherein the number of inhibited receptors increased considerably and monoexponential activation slowed twofold. The second phase occurred slowly over seconds. Activation kinetics became biexponential as the slow component grew in proportion. The first phase may reflect a growing number of Zn2+-bound resting receptors with slowed activation unresolvable in the activation time course. With an increasing preincubation period, the number or kinetics of Zn2+-bound receptors progresses until a distinct slower component and one attributable to control can be discerned; this may underlie the second phase. Preincubation periods of 10 s resulted in receptor inhibition and activation kinetics comparable with that observed in constant Zn2+ (see Fig. 1). We used the current inhibition response as an approximate single indicator of the overall onset kinetics of these complex effects in α1β2 receptors. The time course of current inhibition was well fitted by a biexponential function (Fig. 3C, thick line) with fast (6.7 s−1) and slow (0.72 s−1) rates. The data indicate that Zn2+ interactions with resting states play a primary role in α1β2 receptor inhibition and involve two kinetically distinct components.
We next examined the effects of Zn2+ preincubation on α1β2γ2 receptors using a nearly equipotent concentration (see Fig. 1). Figure 3B shows a response family elicited from an individual cell expressing α1β2γ2 receptors using the same preincubation protocol. A majority of current depression occurred with Zn2+ coapplication without changes in gating. Longer preincubations induced little change in current magnitude (Fig. 3C) and kinetics. These data suggest Zn2+ interacts principally with ligand-bound α1β2γ2 receptors.
Zn2+ affects microscopic gating of α1β2γ2 receptors
We tested for changes in single-channel properties of ligand-exposed α1β2γ2 receptors. To investigate microscopic gating we performed fluctuation analysis of steady-state, macroscopic currents (Neher & Stevens, 1977). The resulting power density spectra were fitted with the sum of two Lorentzian functions. Mean relaxation time constants derived from corner frequencies were 1.41 ± 0.15 and 37 ± 5.6 ms for control currents (Fig. 4A), consistent with previous reports (Verdoorn et al. 1990). The addition of 200 μM Zn2+ reduced total power about sixfold (Fig. 4B) and significantly reduced the slow time constant (23 ± 2.8 ms, P < 0.05, n= 6) without affecting the fast time constant (1.40 ± 0.16 ms). The relative contributions were calculated from the ratio of the areas under the two Lorentzian fuctions (Afast/Aslow). These were 3.4 ± 0.55 for currents triggered by GABA alone, consistent with results reported by Puia et al. (1990), and 4.9 ± 0.37 in Zn2+, which are significantly different (P < 0.05). Hence, the receptors contributing to the current remaining in Zn2+ sustained acceleration and suppression of the slow component of the open-closed gating properties. These results are in accord with those from cultured rat neurons (Smart, 1992). The change in the slow time constant indicates that Zn2+ induces closures with a rate in the order of 10 s−1 and is consistent with selective inhibition of ligand-exposed receptors. We also tested whether Zn2+ altered measured unitary conductance. The primary single-channel conductance was derived from single-channel currents triggered (GABA, 2 μM) in outside-out, cell-free patches. At -50 mV, primary channel conductance was unchanged (P < 0.22, n= 5 patches) from control (29.8 ± 0.21 pS) to 100 μM Zn2+ (30.2 ± 0.32 pS).
Figure 4. Zn2+ effects on macroscopic current fluctuations of α1β2γ2 receptor.
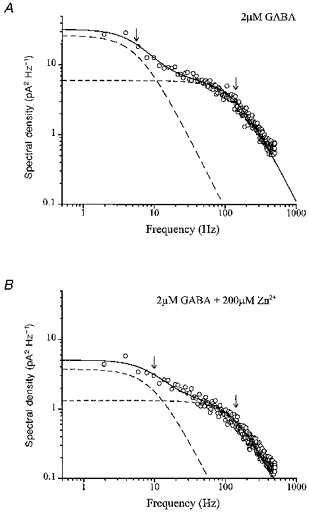
A, power density spectrum of steady-state macroscopic current activated by 2 μM GABA from a single cell expressing α1β2γ2 subunits. Smooth continuous curve represents the sum of two individual Lorentzian functions (dashed lines) with corner frequencies of 5.8 and 137 Hz (arrows). B, power density spectrum of steady-state macroscopic current activated by 2 μM GABA in the presence of 200 μM Zn2+ from the same cell. Corner frequencies are 9.6 and 136 Hz (arrows).
Zn2+ inhibition of α1β2γ2 currents previously activated by GABA is non-competitive
The results suggest that Zn2+ preferentially inhibits α1β2γ2 states visited following ligand exposure. A state-dependent mechanism accounts for mixed antagonism of peak current through interplay between the kinetics of inhibition and activation. Low GABA concentrations induce slow activation, allowing extensive receptor inhibition before opening, and substantial depression of peak current. High GABA concentrations accelerate activation, causing greater receptor opening before inhibition, and thereby lessening depression of peak current. Inhibition after current peak enhances apparent desensitization (Fig. 2B). We tested whether the sensitivity of previously activated receptors is independent of GABA concentration as predicted by this mechanism. Figure 5Aa shows currents triggered by low (5 μM, left) and high (100 μM, middle) GABA concentrations in the same cell expressing α1β2γ2 receptors. Scaling was adjusted to align current magnitudes at the start of inhibition. Application of 500 μM Zn2+ after preactivation by low GABA markedly inhibited current magnitude. The time course is biphasic and reaches a near-plateau during the 3 s application. Within 1 s of Zn2+ washout, control and test currents superimpose indicating that underlying native gating is unaffected. Remarkably, at high [GABA], the relative magnitude of current inhibition by the same Zn2+ concentration is similar (Fig. 5Aa, middle) marking non-competition. Lower Zn2+ concentration (50 μM) lessened inhibition in a dose-dependent fashion (Fig. 5Aa, middle). The magnitude of inhibition was computed from the difference between control and Zn2+ current responses at the end of the 3 s application and normalized by control. We found in grouped data, inhibition (% of control) at two Zn2+ concentrations was not influenced by GABA concentration (50 μM Zn2+: 5 μM GABA, 40 ± 8.7 %; 100 μM GABA, 47 ± 5.3 %, P < 0.4; and 500 μM Zn2+: 5 μM GABA, 13.0 ± 0.72 %; 100 μM GABA, 12.2 ± 2.9 %, P < 0.8, n= 5) demonstrating non-competition of preactivated α1β2γ2 receptors. Figure 5Aa, right panel, plots the inhibition concentration-response relationship at high [GABA] and the fit (continuous line) of the inhibition equation. This relationship is similar to that in constant Zn2+ triggered by 5 μM GABA (Fig. 1A). These results are in accord with apparent mixed antagonism arising from preferential inhibition of ligand-exposed α1β2γ2 receptors.
Figure 5. Zn2+ inhibition of currents previously activated by GABA.
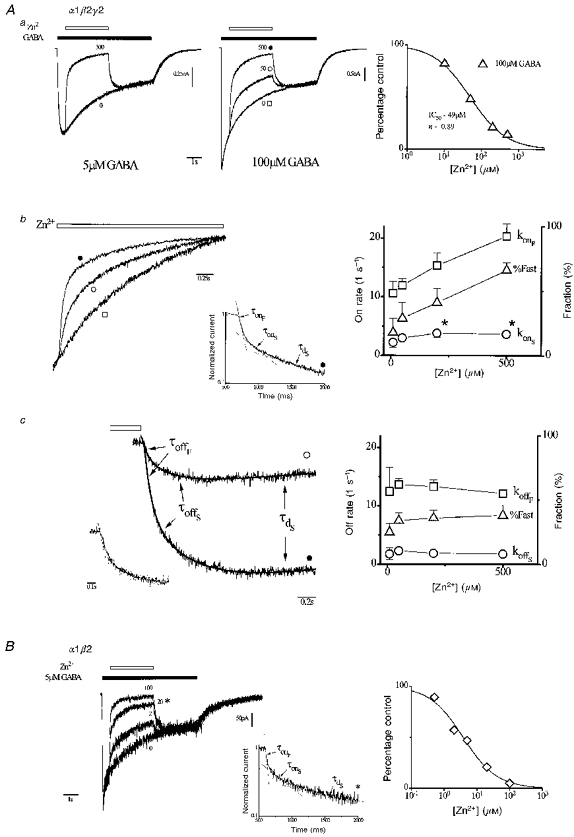
Aa, left panel, current response to Zn2+ application (500 μM, 3 s, open bar) from a cell expressing α1β2γ2 receptors preactivated by low [GABA] (5 μM, filled bar). Zn2+ concentrations (in μM) are given adjacent to responses. Inhibition is determined at the end of the Zn2+ application. Middle panel, same protocol and cell at higher GABA concentration (100 μM) and over a range of Zn2+ concentrations. Vertical scaling was adjusted to nearly normalize current magnitude at the start of Zn2+ application. Right panel, current in Zn2+, as percentage of control, versus Zn2+ concentration at indicated GABA concentration (n= 5). The smooth curve is a fit of the inhibition equation (IC50= 49 μM, S= 0.89). Ab, left, time courses of inhibition onset, normalized and replotted from Aa (symbols identify responses). Inset, onset time course normalized to unity and plotted on semilogarithmic axes (500 μM Zn2+). Time course is well fitted by a triexponential function (smooth line; parameters: AonF= 0.38, konF= 21 s−1, AonS= 0.15, konS= 6.5 s−1, AdS= 0.32, kdS= 1.01 s−1, B = 0.05). The periods dominated by each exponential component are indicated by dashed lines labelled with associated time constants (reciprocal of respective rates: fast (τonF) and slow (τonS) inhibition onset and slow desensitization (τdS)). Right, concentration-response relationships for onset parameters derived from triexponential fitting (fast (konF) and slow (konS) onset rates, and fraction of onset that is fast [ % Fast = 100AonF/(AonF+ AonS)]). Asterisks mark konSs that are significantly different (P < 0.05, paired t test) from low Zn2+ (10 μM). Ac, time courses of inhibition recovery or offset replotted from Aa (symbols identify traces), shifted in magnitude to align current magnitude at the end of the Zn2+ application (open bar). Smooth lines are triexponential function fits (parameters are: 50 μM Zn2+, AoffF= 0.19 nA, koffF= 15.4 s−1, AoffS= 0.36 nA, koffS= 2.9 s−1, AdS= -0.32 nA, kdS= 0.47 s−1, B = -1.26 nA; 500 μM Zn2+, AoffF= 0.60 nA, koffF= 12.2 s−1, AoffS= 0.63 nA, koffS= 1.58 s−1, AdS= -0.93 nA, kdS= 0.61 s−1, B = -1.20 nA). Exponential components are labelled by associated time constants (reciprocal of respective rates: fast (τoffF) and slow (τoffS) inhibition onset and slow desensitization (τdS)). Inset, normalized offset time courses replotted on an expanded timescale (interrupted line, 50 μM Zn2+; thick line, 500 μM Zn2+). Right, concentration-response relationships for offset parameters (fast (koffF) and slow (konS) offset rates, and fraction of offset that is fast (% Fast)) (generally n= 5). B, left, same protocol as in Aa applied to a cell expressing α1β2 receptors. Inset, onset time course normalized to unity and plotted on semilogarithmic axes (20 μM Zn2+). As with α1β2γ2 receptors, time course is triexponential where each exponential component is indicated and labelled as in Ab. Right, current magnitude (% of control) versus Zn2+ concentration (generally n= 5) and fitted by inhibition equation (smooth curve, IC50= 3.8 μM, S= 0.84).
We next examined Zn2+ sensitivity of preactivated α1β2 receptors. The same protocol was applied to a single cell expressing α1β2 receptors (Fig. 5B left). Zn2+ induced concentration-dependent current reductions with features roughly similar to α1β2γ2 receptors but at approximately tenfold lower concentration. Notably, the inhibition relationship fit of grouped data (Fig. 5B right) indicates fourfold less sensitivity compared with inhibition arising from Zn2+ presentation to resting α1β2 receptors (see Fig. 1A). The results suggest state-dependent Zn2+ inhibition of α1β2 receptors.
Inhibition of preactivated receptors involves two kinetically distinct non-conducting states
To analyse inhibition kinetics we replotted onset time courses for α1β2γ2 receptors from Fig. 5Aa after normalizing for the magnitude of inhibition (Fig. 5Ab, left). The control time course exhibits current decay reflecting desensitization. Zn2+ enhanced the rate of current decay due to receptor inhibition. The time course was well fitted by a triexponential function. The inset in Fig. 5Ab replots the Zn2+ response (500 μM) on a semilogarithmic scale after normalization for current magnitude. The three exponential components appear as linear phases of the response, which are marked by dashed straight lines and labelled with associated exponential time constants. The slowest component was considered desensitization since its time constant (τd) is comparable with that of control decay. The two faster components were presumed to reflect the onset of inhibition and are referred to as fast and slow inhibition onset (time constants, τonF and τonS, respectively). Therefore, inhibition of preactivated α1β2γ2 receptors involves two kinetically distinct components. We also examined the kinetics of inhibition onset for α1β2 receptors; The inset in Fig. 5Ba shows it is also biexponential.
We next characterized the kinetics of Zn2+ inhibition for α1β2γ2 receptors. Figure 5Ab, right panel, shows the concentration-response relationships for onset rates (konS and konF) and the fast fraction (% Fast). Onset rates differ in magnitude nearly tenfold and Zn2+ enhances both. Zn2+ also increased the contribution of the fast component. We next considered the time course of inhibition offset. Offset time courses were well fitted by a triexponential function as with inhibition onset. Figure 5Ac, left panel, shows offset time courses replotted from Fig. 5Aa (symbols identify traces), shifted to align currents at the end of the Zn2+ application (open bar). Continuous lines represent triexponential function fits with exponential phases labelled with the associated time constants. As for onset, the slow component is comparable with control desensitization (τd). The two faster components describe inhibition offset and are referred to as fast and slow offset (time constants, τoffF and τoffS, respectively). Inhibition recovery is represented by the sum of these two exponential components. The inset in Fig. 5Ac shows the early time course, which reflects primarily inhibition offset after normalizing for peak current on an expanded time scale. The low and high [Zn2+] responses nearly superimpose, indicating offset kinetics are affected little by Zn2+ concentration. Figure 5Ac, right panel, plots the associated offset rates (koffS and koffF) and the fast fraction (% Fast) versus Zn2+ concentration. These data confirm that offset kinetics are mostly independent of Zn2+ concentration. Similar qualitative observations of the inhibition time course can be made from the responses of comparable experiments by Mayer & Vyklicky (1989) in cultured hippocampal neurons (see their Fig. 4A and B).
DISCUSSION
We investigated Zn2+ effects on GABA-triggered, Cl− currents of recombinant GABAA receptors that differed in the γ2-subunit (α1β2 and α1β2γ2). We confirmed that receptors lacking the γ-subunit (α1β2) manifest relative sensitivity and an apparent non-competitive mechanism (Draguhn et al. 1990; Smart et al. 1991). We then verified that receptors including the γ-subunit (α1β2γ2) exhibit apparent competition (Chang et al. 1995) but because inhibition was incompletely surmounted by GABA we clarified the mechanism to be one of ‘mixed antagonism’ (Constanti, 1978). Rapid solution changes permitted analysis of the time course of macroscopic currents leading to the conclusion that Zn2+ distinctly modulates receptor gating. The findings suggested a state-dependent mechanism that selectively inhibits resting, α1β2 receptors while preferentially affecting α1β2γ2 states visited after ligand exposure. Subsequent studies involving selective Zn2+ delivery to resting or ligand-exposed receptors, and fluctuation analysis of α1β2γ2 receptors provided additional support for this mechanism. Overall, the results support the idea that state-dependent Zn2+ inhibition is determined by the γ-subunit.
Mechanism of Zn2+ inhibition
It is likely that Zn2+ binds to a distinct extracellular site to allosterically induce transitions to a long-lived, non-conducting state(s) (Celentano et al. 1991; Smart, 1992). Our results from fluctuation analysis (Fig. 4) and the time course of inhibition (Fig. 5) support Zn2+-mediated transitions to a non-conducting state(s) with slow closing rates (∼10 s−1). This rate is generally small compared with native gating (Macdonald, Rogers & Twyman, 1989) in accord with unchanged single-channel open times (Legendre & Westbrook, 1991; Smart, 1992). A new slow component in closed time histograms also supports distinct non-conducting states (Smart, 1992). Our analysis of the time course of macroscopic currents indicates two distinct non-conducting states (Figs 3 and 5). A single Zn2+ binding site is indicated by slope factors approaching 1 from our inhibition relationships and others (Mayer & Vyklicky, 1989; Celentano et al. 1991). Overall, a mechanism where Zn2+ binds to a single extracellular site and allosterically induces two kinetically distinct, non-conducting states reconciles these observations. This mechanism also accounts for mixed antagonism of α1β2γ2 receptors (see below). Findings by others (Draguhn et al. 1990; Legendre & Westbrook, 1991; Smart, 1992) and us indicate that unitary current is unchanged, discounting rapid pore block. However, a pore-blocking mechanism (Draguhn et al. 1990) with slow binding kinetics cannot be excluded, but seems unlikely for three reasons: (1) multiple binding sites or other complex mechanisms are required to account for our kinetic data; (2) a ring of positive charge at the extracellular pore mouth (Schofield et al. 1987) would probably impede the entry of cations into the pore; and (3) weak or absent voltage dependence (Westbrook & Mayer, 1987; Mayer & Vyklicky, 1989; Draguhn et al. 1990; Smart & Constanti, 1990; Legendre & Westbrook, 1991; Celentano et al. 1991) indicates that the membrane electric field exerts little influence on inhibition, which is unlikely when ions enter and occlude the pore.
Proposed gating model for Zn2+ inhibition of GABAA receptors
We were interested in developing an explicit gating model that describes Zn2+ inhibition of GABAA receptors for three reasons. First, it permits quantitative evaluation of prospective gating mechanisms. Second, it provides insight into the interactions of multiple processes (agonist and antagonist binding, inhibition and gating) that govern receptor opening. Third, deep quantitative understanding is essential to consider possible physiological effects on postsynaptic GABAergic currents.
We began with a mechanism whereby Zn2+ binds to an extracellular site to trigger allosterically transitions to two kinetically distinct, non-conducting states, in accord with the above discussion. This mechanism, in the context of mixed antagonism exhibited by α1β2γ2 receptors, is reminiscent of the ‘mixed antagonistic model’ proposed by Constanti (1978) and later refined by Smart & Constanti (1986) to account for picrotoxinin antagonism of GABA-triggered currents in crustacean muscle. Briefly in this model, agonist binds to two independent sites to trigger opening and antagonist binds to a single distinct site of each state with a unique dissociation constant. Antagonist-bound, conducting open receptors undergo a conformational change to a blocked, non-conducting state. The model describes state probabilities at equilibrium in terms of agonist and antagonist dissociation constants and a conformational constant specifying the ratio of conducting and blocked antagonist-bound open receptors. It elegantly accounts for non-competitive, uncompetitive and apparent competition (Smart & Constanti, 1986). The single antagonist binding site of this model is consistent with slope factors approaching 1 from our Zn2+ inhibition relationships and others (Mayer & Vyklicky, 1989; Celentano et al. 1991). We therefore adapted this formalism of open state inhibition to incorporate kinetics and two non-conducting states, yielding:
Scheme 1.
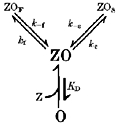
where the open receptor (O) binds a single Zn2+ ion (Z) described by a dissociation constant (KD) to achieve the bound open state (ZO). Through conformational changes, ZO passages to fast (ZOF) or slow (ZOS) non-conducting states governed by transition rate constants (kf, k-f, ks, k−s). We assumed that Zn2+ binding is rapid such that binding site occupation appears in continuous equilibrium relative to slower transitions involving ZOF and ZOS. Although speculative, other divalent ions may bind rapidly to ion channel proteins within milliseconds (Gurney, Tsien & Lester, 1987). We expanded gating Scheme 1 to a broader kinetic form that addresses activation, desensitization, and Zn2+ binding with all states resulting in:
Scheme 2.

The resting state (R) binds a single GABA molecule (G) governed by binding and unbinding rate constants (k1 and k-1), which leads to the conducting open state (O). This simple activation scheme reconciles the time course of empirical activation (see Fig. 2). O closes to the desensitized state (D) determined by transition rate constants (d1 and d-1). A single desensitized state approximates empirical desensitization. R, O or D bind a single Zn2+ ion leading to corresponding bound states (ZX, ZXF and ZXS where X = R, O or D) with the same transition rate constants (kf, k-f, ks, k-s). State-dependent binding arises from unique dissociation constants for R (KDR), and O or D (KDL). Transitions between Zn2+-bound, resting-open and open-desensitized pairs are implied, although not explicitly shown, and are governed by the same rate constants that govern transitions between corresponding Zn2+- free states since Zn2+ does not alter underlying native gating (see Fig. 5). Gating Scheme 2 is a first approximation of receptor function and is a simplification of complex GABAA receptor gating.
To begin quantitative evaluation of gating Scheme 2, we considered the time course of inhibition in α1β2γ2 receptors (Fig. 5Ab and Ac) pre-exposed to a fully activating GABA concentration (100 μM). The unspecified parameters (k1, k-1, d1, d-1, KDR, KDL, kf, k-f, ks, and k-s) were determined. Rate constants governing activation (k1= 100 s−1 and k-1= 2 s−1) and desensitization (d1= 0.4 s−1, d-1= 0.15 s−1) were defined to cause roughly full receptor activation and approximate empirical time courses (Figs 2B and 5Aa). Gating Scheme 2 dictates that inhibition offset is biexponential with rates identical to reverse rate constants. Therefore these were set nearly equal to experimental offset rates (k-f= 12 s−1 and k-s= 2 s−1). To approximate the intrinsic filtering of our measurement system we applied a first order filter (-3 dB, 10 Hz) to model currents. KDR was set to infinity, since Zn2+ interactions with resting receptors are probably small under these conditions. The remaining unspecified parameters (KDL, kf and ks) were estimated using target time courses comprised of inhibition onset and offset at two Zn2+ concentrations (50 and 500 μM) computed from mean parameters (Fig. 5Ab and Ac) and combined with model desensitization. The resultant estimated parameters (KDL= 328 μM, kf= 17.1 s−1 and ks= 7.3 s−1) completely specified gating Scheme 2.
Figure 6Aa shows the effects of Zn2+ application on preactivated responses of gating Scheme 2. Zn2+ reversibly inhibits current in a dose-dependent fashion. These responses and the concentration-response relationship (inset) are strikingly similar to our experimental results (see Fig. 5Aa-c). Zn2+ enhanced the speed of inhibition onset (Fig. 6Ab, left) with a biexponential time course (middle). Figure 6Ac, left panel, shows inhibition offset time courses replotted from Fig. 6Aa after shifting to align currents at the end of the Zn2+ application (open bar). The time courses are triexponential and the normalized early offset time course is unaffected by Zn2+. Figure 6Ab and c, right panels, plot model and experimental concentration-response relationships of fitted onset and offset parameters. Overall, gating Scheme 2 provides a remarkably close accounting of empirical Zn2+ inhibition of preactivated α1β2γ2 receptors. Therefore, this model describes the dominant gating governing inhibition of macroscopic currents.
Figure 6. Responses from gating models.
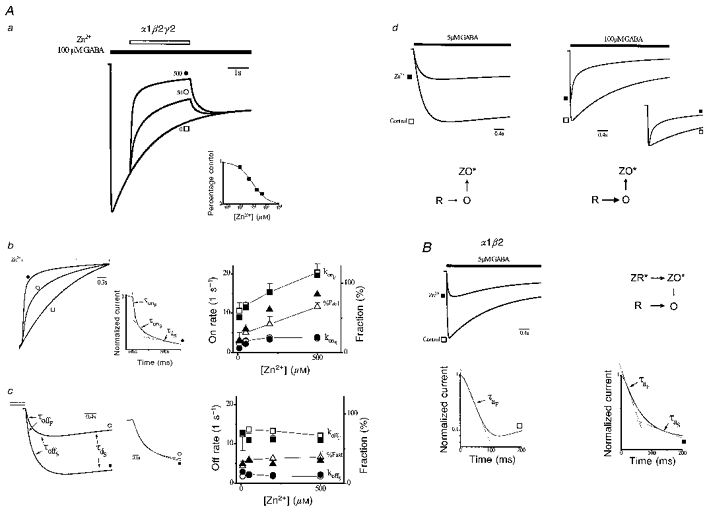
Aa, responses from α1β2γ2 gating model (see text) to Zn2+ application (open bar, concentrations adjacent to response in μM) of currents preactivated by GABA (filled bar). Inset, current in Zn2+, as percentage of control, versus Zn2+ concentration and the fit by the inhibition equation (smooth curve, IC50= 94 μM, S= 0.77). Ab, left, normalized time courses of inhibition onset replotted from Aa (symbols identify responses). Middle, onset time course normalized to unity and plotted on semilogarithmic axes (500 μM Zn2+). Time course is triexponential with each component indicated by dashed straight lines labelled with associated time constants (reciprocal of respective rates: fast (τonF) and slow (τonS) inhibition onset and slow desensitization (τdS)). Superimposed line is fitted by a triexponential function (parameters: AonF= 0.47, konF= 18 s−1, AonS= 0.16, konS= 2.5 s−1, AdS= 0.17, kdS= 0.22 s−1, B = 0.04). Right, concentration- response relationships for fitted parameters from gating model (filled symbols) and empirical responses replotted from Fig. 5Ab (open symbols). Ac, time courses of inhibition offset replotted from Aa, shifted in magnitude to align currents at the end of the Zn2+ application (open bar). Time courses are well fitted by a triexponential with each component labelled by the associated time constant (reciprocal of respective rates: fast (τoffF) and slow (τoffS) inhibition onset and slow desensitization (τdS)). Middle, normalized offset time courses replotted on an expanded time scale. Right, concentration-response relationships for offset parameters from gating model (filled symbols) and empirical responses replotted from Fig. 5Ac (open symbols). Ad, α1β2γ2 model responses triggered at low (5 μM) and high (100 μM) GABA concentrations (bar) in control (□) and in constant Zn2+ (300 μM, ▪) with vertical scaling adjusted to normalize for peak control currents. Dominant model gating pathways are shown below responses where rate magnitudes are related to the emboldening and length of transition arrows and ZX* represents Zn2+-bound states (ZX, ZXS and ZXF) associated with state X (X = R, O, or D). B, α1β2 model responses at 5 μM GABA (bar) in control (□) and in the presence of Zn2+ (10 μM, ▪) with dominant model gating pathways shown adjacently. Below, semilogarithmic plot of onset time courses from above normalized to peak current magnitude. In control, activation is described by a single fast exponential (dashed line, time constant, τaF). Zn2+ adds a second slow exponential component to activation (time constant, τaS). The sum of the fitted triexponentials (superimposed line; AonF= 0.31, konF= 19 s−1, AonS= 0.11, konS= 3.4 s−1, AdS= -0.31, kdS= 0.54 s−1, B = 0.87) describes the activation time course (see text).
We next examined gating Scheme 2 for our empirical observations of α1β2γ2 receptors in constant Zn2+ (Fig. 2B). The value of KDR was computed to be 8600 μM, which assumed that the magnitude of insurmountable inhibition (Fig. 1B) reflects inhibited resting receptors. Figure 6Ad, top left panel, shows responses of gating Scheme 2 triggered by low GABA concentration in control and in Zn2+. The control response activates and desensitizes slowly.
Zn2+ depresses peak current more than twofold without appreciably changing gating. The scheme in Fig. 6Ad shows the dominant gating pathways of the model in Zn2+. Slow activation (R → O) permits faster inhibition (O → ZO*), renders receptors non-conducting rapidly, and prevents accumulation of O states thereby depressing peak current. Figure 6Ad, top right panel, shows model responses for the same protocol but at high GABA concentration. Activation and desensitization are accelerated in control. Current inhibition is reduced marking antagonism, and desensitization is accelerated (inset). Accelerated activation causes rapid accumulation of O states before inhibition thereby increasing peak. Apparent desensitization is enhanced owing to increased receptor closing by inhibition following current peak. These results demonstrate that gating Scheme 2 qualitatively reproduces apparent competitive antagonism and gating effects of α1β2γ2 receptors.
Both the results and the structure of gating Scheme 2 support the argument that mixed antagonism of α1β2γ2 receptors results from the kinetic interplay of inhibition of ligand-exposed receptors and GABA-triggered activation. Furthermore, the temporal relationship of agonist and antagonist presentation may play a critical role in the apparent mechanism of antagonism. Antagonism can appear non-competitive when the antagonist is presented after agonist exposure or mixed when pre- or coapplied.
We next considered whether gating Scheme 2 could account for the distinct Zn2+ effects on α1β2 receptors. Gating Scheme 2 application to α1β2 receptors is justified because, as with α1β2γ2 receptors, inhibition is state dependent and involves two kinetically distinct states. α1β2 receptors exhibit faster activation, preferential inhibition of resting receptors, and overall greater sensitivity to Zn2+. Therefore, we revised only the activation rate constant (k1), and both dissociation constants (KDR and KDL). k1 was set to 50 s−1, consistent with empirical activation triggered by 5 μM GABA (Fig. 2A). The value of KDR was computed to be 3.5 μM based on the IC50 in constant Zn2+ (Fig. 1A) and the assumption that inhibition reflects blocked resting receptors. Comparable inhibition of preactivated α1β2 receptors requires about a tenfold reduction in Zn2+ concentration relative to α1β2γ2 (see Fig. 5). Therefore, we simply reduced KDL in the α1β2γ2 model (328 μM) tenfold for α1β2 (33 μM). Gating Scheme 2 with these three redefined parameters became the gating model for α1β2 receptors. In control, α1β2 gating model activation is rapid and accompanied by appreciable desensitization (Fig. 6B, top panel). Zn2+ reduces peak current and slows both activation and apparent desensitization kinetics. Activation time course is monoexponential in control. Zn2+ induces a second slower exponential (Fig. 6B, lower panel). Therefore, the α1β2 gating model qualitatively reproduces the effects of Zn2+ on α1β2 gating. The top panel of Fig. 6B shows the dominant gating in Zn2+ where the fast activation arises from resting unbound channels (R → O). The slow component results from two sequential transitions. Zn2+-bound receptors first undergo activation (ZR*→ ZO*) that is followed by slow Zn2+ unbinding and subsequent receptor conduction (ZO*→ O). Slowed desensitization arises from the resultant reduction in open state probability.
Gating Scheme 2 reproduces the kinetics and magnitude of Zn2+ inhibition of α1β2γ2 receptors previously activated by GABA. In constant Zn2+, it accounts for the primary effects on current magnitude and kinetics of both α1β2 and α1β2γ2 receptors. Gating Scheme 2 comprehensively accounts for our primary empirical findings and therefore can be considered as a general mechanism for Zn2+ inhibition of GABAA receptors when determination of state-dependent Zn2+ binding by the γ-subunit is included. This general mechanism serves to unify our understanding of Zn2+ inhibition of GABAA receptors by accounting for the diversity of observed Zn2+ effects.
Comparison with other studies
Our results in α1β2γ2 receptors are in accord with similar recombinant investigations and reports from ex vivo receptors from hippocampus and spinal cord that are probably αβγ receptors (Persohn, Malherbe & Richards, 1991; Wisden, Laurie, Monyer & Seeburg, 1992). Legendre & Westbrook (1991) investigated Zn2+ inhibition of GABA-triggered currents in rat cultured hippocampal neurons and found that inhibition of preactivated receptors appeared non-competitive. The activation time course was unchanged by Zn2+ coapplication at low GABA concentration (5 μM). At higher GABA concentrations, Zn2+ enhanced a fast component of apparent desensitization without affecting a slow component. Coapplication resembles our experiments in constant Zn2+ since Zn2+ is present at the time of GABA application. The authors concluded that Zn2+ rapidly acts on states leading up to channel opening (monoliganded and doubly liganded states). Celentano et al. (1991) reported that GABA incompletely surmounted inhibition of GABA-triggered currents caused by coapplied Zn2+ in cultured chick spinal cord neurons. White & Gurley (1995) have reported similar observations in αβγ receptors expressed in Xenopus oocytes where Zn2+ was applied before GABA. These results and those regarding non-competitive inhibition of preactivated receptors above are reconciled by our general mechanism for receptors containing a γ-subunit.
Our observation of apparent non-competition in α1β2 receptors agrees with previous reports in recombinant αβ receptors (Draguhn et al. 1990; Smart et al. 1990), rat superior cervical ganglion (Smart & Constanti, 1990) and lobster muscle (Smart & Constanti, 1982).
Yakushiji et al. (1987) investigated GABA-triggered currents in frog dorsal root ganglion (DRG) using rapid perfusion techniques. Zn2+ inhibition was completely antagonized by GABA in coapplication experiments suggesting a competitive mechanism that disagrees with our results in α1β2γ2 receptors and constant Zn2+. Our general mechanism suggests that for α1β2γ2 receptors, inhibition of peak current is due to kinetic interactions of inhibition and activation. Activation kinetics are divergent in frog DRG (Akaike et al. 1987) and mammalian receptors (Legendre & Westbrook, 1991; Maconochie et al. 1994; our Fig. 2), which manifest biexponential and monoexponential time courses, respectively. Therefore, although ligand-exposed receptors may bind Zn2+ preferentially, differences in the activation pathway in DRG at high GABA concentration may prevent appreciable receptor inhibition before current peak. At the same time, Zn2+ accelerated the fast phase of apparent desensitization, which is inconsistent with simple competitive antagonism but in accord with our results.
Zn2+ also inhibits currents from a novel class of GABA receptors (GABAC) identified in the retina (Feigenspan, Wassle & Bormann, 1993), which is probably a homomer of ρ-subunits that share 30-38 % sequence homology with GABAA receptor subunits. Native GABAC receptors as well as those resulting from ρ-subunit expression (Calvo, Vazquez & Miledi, 1994; Chang et al. 1995) exhibit mixed antagonism. Chang et al. (1995) proposed that this is due to either different affinities of agonist-free and agonist-bound receptors or two distinct sites, competitive and non-competitive. The former mechanism is consistent with our proposed general mechanism.
Possible structural underpinnings of Zn2+ binding site
What are the possible structural underpinnings of an extracellular Zn2+ binding site? Studies of Zn2+-interacting proteins have shown that binding can be co-ordinated by Cys, His, Glu and/or Asp residues in a ternary combination (Vallee & Auld, 1990). Recent work by Wang, Hackam, Guggino & Cutting (1995) has identified a histidine residue (H156) on the ρ1-subunit that is critical for Zn2+ inhibition of GABAC receptors. Figure 7 shows that this residue is distal to the cysteine loop on the extracellular amino domain of the ρ1-subunit. In this region there is high homology among GABAA receptor α, β, γ and ρ1-subunits. The α-subunit has a histidine in an adjacent location (His128). Perhaps His128 contributes to the Zn2+ binding pocket of GABAA receptors in a manner similar to His156 in GABAC. A permissive leucine (Leu123) or a nearby enhancing aspartate (Asp125) of the β-subunit could complete a high-affinity, binding pocket for resting αβ receptors. Reduced affinity of resting α1β2γ2 receptors could arise from the arginine (Arg149) of the γ-subunit that would be protonated (pKR, -12.48) at physiological pH and positively charged. This may reduce the affinity through electrostatic repulsion or interference with Zn2+ interactions with His128. These speculations will need to be verified with site-directed mutagenesis.
Figure 7. Amino acid sequences.

Above, cartoon of the general primary structure of GABAA receptor subunits showing amino and carboxy termini, and four transmembrane spanning regions (shaded). The extracellular amino domain contains a cysteine loop (C-C). Lines indicate approximate location of amino acid sequences shown below. Region of protein involved in co-ordinating Zn2+ binding is putatively extracellular. Below, comparison of amino acid sequences of GABAA receptor subunits with homologous residues in the neighborhood of a ρ1 histidine (156) on extracellular amino terminus that is critical to Zn2+ inhibition of GABAC receptors (Wang et al. 1995). Amino acids are in three letter code and numbers refer to the codons of the predicted amino acid sequence of the full-length cDNA where the canonical methionine is codon 1. Arrow marks the location of the critical histidine (emboldened) of ρ1. Box encloses adjoining location on GABAA subunits that contains a histidine (emboldened) residue on the α1-, a neutral leucine on β2-, and a positively charged arginine on the γ2-subunit.
A key observation of this study is the dependence of Zn2+ inhibition on receptor state. State dependence of binding pocket affinity can be envisaged based on conformational changes observed in the homologous nicotinic acetylcholine receptor (nAChR; Schofield et al. 1987). Electron crystallography of resting and activated nAChRs indicates ligand binding triggers up to 28 deg of counter-clockwise rotation of the extracellular domains (Unwin, 1995). This could cause relative rearrangement of amino domains, change the Zn2+ binding pocket, and lead to altered affinity. Such conformational changes may account for the state dependence of binding for both receptors.
With these results we conclude that Zn2+ inhibition of GABAA receptors is a subunit-dependent mechanism whereby Zn2+ selectively inhibits resting receptors in the absence of the γ-subunit and ligand-exposed receptors when present. We further propose a general model of inhibition in which Zn2+ binds rapidly to a single extracellular site that allosterically induces two non-conducting states, site affinity is state dependent, and the features of state dependence are determined by the γ-subunit. This general mechanism appears to unify the understanding of Zn2+ inhibition through its ability to account for a diversity of reported Zn2+ effects. The results also extend, in general, insight into the interactions of gating, agonist and antagonist binding of ligand-gated ion channels.
Acknowledgments
We thank Larry Wagner II for preparation of cultured cells and their transient transfection. This work was supported by a Whitaker Foundation research grant to K. J. G.
References
- Akaike N, Yakushiji T, Tokutomi N, Carpenter DO. Mulitiple mechanisms of antagonism of γ-aminobutyric-acid (GABA) responses. Cellular and Molecular Neurobiology. 1987;7:97–103. doi: 10.1007/BF00734993. [DOI] [PubMed] [Google Scholar]
- Aniksztejn L, Charlton G, Ben-Ari Y. Selective release of endogenous zinc from the hippocampal mossy fibers in situ. Brain Research. 1987;404:58–64. doi: 10.1016/0006-8993(87)91355-2. 10.1016/0006-8993(87)91355-2. [DOI] [PubMed] [Google Scholar]
- Assaf SY, Chung SH. Release of endogenous Zn2+ from brain tissue during activity. Nature. 1984;308:734–738. doi: 10.1038/308734a0. [DOI] [PubMed] [Google Scholar]
- Burkat PM, Roberts W, Gingrich KJ. Gamma subunit influences the mechanism of zinc inhibition in recombinant GABAA receptors. Journal of Neuroscience. 1995;21:A850. [Google Scholar]
- Calvo DJ, Vazquez AE, Miledi R. Cationic modulation of rho1 type gamma-aminobutyrate receptors expressed in Xenopus oocytes. Proceedings of the National Academy of Sciences of the USA. 1994;91:12725–12729. doi: 10.1073/pnas.91.26.12725. [DOI] [PMC free article] [PubMed] [Google Scholar]
- Celentano JJ, Gyenes M, Gibbs TT, Farb DH. Negative modulation of the γ-aminobutyric acid response by extracellular zinc. Molecular Pharmacology. 1991;40:766–773. [PubMed] [Google Scholar]
- Chang Y, Amin J, Weiss D S. Zinc is a mixed antagonist of homomeric ρ1 γ-aminobutryic acid-activated channels. Molecular Pharmacology. 1995;47:595–602. [PubMed] [Google Scholar]
- Constanti A. The ‘mixed’ effect of picrotoxin on the GABA dose/conductance relation recorded from lobster muscle. Neuropharmacology. 1978;17:159–167. doi: 10.1016/0028-3908(78)90095-3. [DOI] [PubMed] [Google Scholar]
- Curtis DR, Gynther BD. Divalent cations reduce depolarization of primary afferent termination by GABA. Brain Research. 1987;422:192–195. doi: 10.1016/0006-8993(87)90558-0. [DOI] [PubMed] [Google Scholar]
- Draguhn A, Verdoorn TA, Ewert M, Seeburg PH, Sakmann B. Functional and molecular distinction between recombinant rat GABAA receptor subtypes by Zn2+ Neuron. 1990;5:781–788. doi: 10.1016/0896-6273(90)90337-f. 10.1016/0896-6273(90)90337-F. [DOI] [PubMed] [Google Scholar]
- Feigenspan A, Wassle H, Bormann J. Pharmacology of GABA receptor Cl− channels in rat retinal bipolar cells. Nature. 1993;361:159–161. doi: 10.1038/361159a0. 10.1038/361159a0. [DOI] [PubMed] [Google Scholar]
- Frederickson CJ, Moncrieff DW. Zinc containing neurons. Biological Signals. 1994;3:127–130. doi: 10.1159/000109536. [DOI] [PubMed] [Google Scholar]
- Gingrich KJ, Roberts WA, Kass RS. Dependence of the GABAA receptor gating kinetics on the γ-subunit isoform: implications for structure-function relations and synaptic transmission. The Journal of Physiology. 1995;489:529–543. doi: 10.1113/jphysiol.1995.sp021070. [DOI] [PMC free article] [PubMed] [Google Scholar]
- Gurney AM, Tsien RY, Lester HA. Activation of a potassium current by rapid photochemically generated step increases of intracellular calcium in rat sympathetic neurons. Proceedings of the National Academy of Sciences of the USA. 1987;84:3496–3500. doi: 10.1073/pnas.84.10.3496. [DOI] [PMC free article] [PubMed] [Google Scholar]
- Hamill OP, Marty A, Neher E, Sakmann B, Sigworth F J. Improved patch-clamp techniques for high-resolution current recording from cells and cell-free membrane patches. Pflügers Archiv. 1981;391:85–100. doi: 10.1007/BF00656997. [DOI] [PubMed] [Google Scholar]
- Haug F-MS. Electron microscopical localization of the zinc in hippocampal mossy fibre synapses by a modified silver procedure. Histochemie. 1967;8:355–368. doi: 10.1007/BF00401978. [DOI] [PubMed] [Google Scholar]
- Howell GA, Welch MG, Frederickson CJ. Stimulation-induced uptake and release of zinc in hippocampal slices. Nature. 1984;308:736–738. doi: 10.1038/308736a0. [DOI] [PubMed] [Google Scholar]
- Legendre P, Westbrook GL. Noncompetitive inhibition of γ-aminobutyric acidA channels by Zn. Molecular Pharmacology. 1991;39:267–274. [PubMed] [Google Scholar]
- Levitan ES, Schofield PR, Burt DR, Rhee LM, Wisden W, Kohler MM, Fujita N, Rodriguez HF, Stephenson FA, Darlison MG, Barnard EA, Seeburg PH. Structural and functional basic for GABAA receptor heterogeneity. Nature. 1988;335:76–79. doi: 10.1038/335076a0. [DOI] [PubMed] [Google Scholar]
- Macdonald RL, Rogers CJ, Twyman RE. Kinetic properties of the GABAA receptor main-conductance state of mouse spinal cord neurons in culture. The Journal of Physiology. 1989;410:479–499. doi: 10.1113/jphysiol.1989.sp017545. [DOI] [PMC free article] [PubMed] [Google Scholar]
- Maconochie DJ, Zempel JM, Steinbach JH. How quickly can GABAA receptors open? Neuron. 1994;12:61–71. doi: 10.1016/0896-6273(94)90152-x. [DOI] [PubMed] [Google Scholar]
- Mayer ML, Vyklicky L., Jr The action of zinc on synaptic transmission and neuronal excitability in cultures of mouse hippocampus. The Journal of Physiology. 1989;415:351–365. doi: 10.1113/jphysiol.1989.sp017725. [DOI] [PMC free article] [PubMed] [Google Scholar]
- Neher E, Stevens CF. Conductance fluctuations and ionic pores in membranes. Annual Reviews Biophysics and Bioengineering. 1977;6:345–381. doi: 10.1146/annurev.bb.06.060177.002021. [DOI] [PubMed] [Google Scholar]
- Perez-Clausell J, Danscher G. Intravesicular localization of zinc in rat telencephalic boutons. A histochemical study. Brain Research. 1985;337:91–98. doi: 10.1016/0006-8993(85)91612-9. [DOI] [PubMed] [Google Scholar]
- Persohn E, Malherbe P, Richards JG. In situ hybridization histochemistry reveals a diversity of GABAA receptor subunit mRNA's in neurons of rat spinal cord and dorsal root ganglia. Journal of Neuroscience. 1991;42:497–507. doi: 10.1016/0306-4522(91)90392-2. [DOI] [PubMed] [Google Scholar]
- Puia G, Santi M, Vicini S, Pritchett D, Pardy R, Paul S, Seeburg P, Costa E. Neurosteroids act on recombinant human GABAA receptors. Neuron. 1990;4:759–765. doi: 10.1016/0896-6273(90)90202-q. [DOI] [PubMed] [Google Scholar]
- Saxena NC, Macdonald RL. Assembly of GABAA receptor subunits: role of the γ-subunit. Journal of Neuroscience. 1994;14:7077–7086. doi: 10.1523/JNEUROSCI.14-11-07077.1994. [DOI] [PMC free article] [PubMed] [Google Scholar]
- Schofield PR, Darlison MG, Fujita N, Burt DR, Stephenson FA, Rodriguez H, Rhee LM, Ramachandran J, Reale V, Glencorse TA, Seeburg PH, Barnard EA. Sequence and functional expression of the GABAA receptor shows a ligand-gated receptor super-family. Nature. 1987;328:221–227. doi: 10.1038/328221a0. [DOI] [PubMed] [Google Scholar]
- Sigel E, Baur R, Mohler H, Malherbe P. The effect of subunit composition of rat brain GABAA receptors on channel function. Neuron. 1990;5:703–711. doi: 10.1016/0896-6273(90)90224-4. [DOI] [PubMed] [Google Scholar]
- Smart TG. A novel modulatory binding site for zinc on the GABAA receptor complex in cultured rat neurones. The Journal of Physiology. 1992;447:587–625. doi: 10.1113/jphysiol.1992.sp019020. [DOI] [PMC free article] [PubMed] [Google Scholar]
- Smart TG, Constanti A. A novel effect of zinc on the lobster muscle GABA receptor. Proceedings of the Royal Society B. 1982;215:327–341. doi: 10.1098/rspb.1982.0045. [DOI] [PubMed] [Google Scholar]
- Smart TG, Constanti A. Studies on the mechanism of action of picrotoxinin and other convulsants at the crustacean muscle GABA receptor. Proceedings of the Royal Society B. 1986;227:191–216. doi: 10.1098/rspb.1986.0019. [DOI] [PubMed] [Google Scholar]
- Smart TG, Constanti A. Differential effects of zinc on the vertebrate GABA-receptor complex. British Journal of Pharmacology. 1990;99:643–654. doi: 10.1111/j.1476-5381.1990.tb12984.x. [DOI] [PMC free article] [PubMed] [Google Scholar]
- Smart TG, Moss SJ, Xie X, Huganir RL. GABAA receptors are differentially sensitive to zinc: dependence on subunit composition. British Journal of Pharmacology. 1991;103:1837–1839. doi: 10.1111/j.1476-5381.1991.tb12337.x. [DOI] [PMC free article] [PubMed] [Google Scholar]
- Smart TG, Xie X, Krishek BJ. Modulation of inhibitory and excitatory amino acid recpetor ion channels by zinc. Progress in Neurobiology. 1994;42:393–441. doi: 10.1016/0301-0082(94)90082-5. [DOI] [PubMed] [Google Scholar]
- Unwin N. Acetylcholine receptor imaged in the open state. Nature. 1995;373:37–43. doi: 10.1038/373037a0. [DOI] [PubMed] [Google Scholar]
- Vallee BL, Auld DS. Zinc coordination, function and structure of zinc enzymes and other proteins. Biochemistry. 1990;29:5647–5659. doi: 10.1021/bi00476a001. [DOI] [PubMed] [Google Scholar]
- Verdoorn TA, Draguhn A, Ymer S, Seeburg PH, Sakmann B. Functional properties of recombinant rat GABAA receptors depend on subunit composition. Neuron. 1990;4:919–928. doi: 10.1016/0896-6273(90)90145-6. [DOI] [PubMed] [Google Scholar]
- Wang TL, Hackam A, Guggino WB, Cutting GR. A single histidine residue is essential for zinc inhibtion of GABA rho 1 receptors. Journal of Neuroscience. 1995;15:76841–76891. doi: 10.1523/JNEUROSCI.15-11-07684.1995. [DOI] [PMC free article] [PubMed] [Google Scholar]
- Westbrook GL, Mayer ML. Micromolar concentrations of Zn2+ antagonize NMDA and GABA responses of hippocampal neurons. Nature. 1987;328:640–643. doi: 10.1038/328640a0. [DOI] [PubMed] [Google Scholar]
- White G, Gurley DA. γ-Subunits influence Zn block of γ2 containing GABAA receptor currents. NeuroReport. 1995;6:461–464. doi: 10.1097/00001756-199502000-00014. [DOI] [PubMed] [Google Scholar]
- Wisden W, Laurie DJ, Monyer H, Seeburg PH. The distribution of 13 GABAA receptor subunit mRNAs in the rat brain I. telencephalon, diencephalon, mesencephalon. Journal of Neuroscience. 1992;12:1040–1062. doi: 10.1523/JNEUROSCI.12-03-01040.1992. [DOI] [PMC free article] [PubMed] [Google Scholar]
- Xie X M, Smart TG. A physiological role for endogenous zinc in rat hippocampal synaptic neurotransmission. Nature. 1991;349:521–524. doi: 10.1038/349521a0. [DOI] [PubMed] [Google Scholar]
- Yakushiji T, Tokutomi N, Akaike N, Carpenter DO. Antagonists of GABA responses, studied using internally perfused frog dorsal root ganglion neurons. Neuroscience. 1987;22:1123–1133. doi: 10.1016/0306-4522(87)92987-3. [DOI] [PubMed] [Google Scholar]
- Zhou FM, Hablitz JJ. Zinc enhances GABAergic transmission in rat neocortical neurons. Journal of Neurophysiology. 1993;70:1264–1269. doi: 10.1152/jn.1993.70.3.1264. [DOI] [PubMed] [Google Scholar]