

Abstract
We compared γ-aminobutyric acid (GABA)-mediated responses of identified pyramidal cells and fast spiking interneurons in layer V of visual cortical slices from young rats (P11-14).
The frequency of spontaneous inhibitory postsynaptic currents (sIPSCs) was similar in pyramidal cells and interneurons (1.7 vs. 1.9 Hz). For events with 10-90 % rise times less than 0.9 ms, no significant differences were found in mean amplitude (61 vs. 65 pA), mean rise time (0.58 vs. 0.61 ms), or the first time constant of decay (τ1, 6.4 vs. 6.5 ms) between pyramidal cells and interneurons. The second decay time constant (τ2) was significantly longer in interneurons than in pyramidal cells (49 vs. 22 ms). The difference in sIPSC decay kinetics between two cell types also existed in adult rats (P36-42), suggesting the kinetic difference is not due to differential development of GABAA receptors in these cell types.
The decay kinetics of monosynaptic evoked IPSCs were also longer in interneurons. As in the case of sIPSCs, the difference was accounted for by the second decay time constant. τ1 and τ2 were, respectively, 13 and 64 ms for interneurons and 12 and 47 ms for pyramidal cells.
Cell-attached patch recordings revealed that the mean open time for single Cl− channels in response to 2 μM GABA was significantly longer in interneurons than pyramidal cells (5.0 vs. 2.8 ms). The chord conductance of these channels in interneurons (12 pS) was significantly smaller than in pyramidal cells (15 pS). Single channel currents reversed polarity when the pipette potential was approximately -10 mV for both cell types.
These results show that there is a functional diversity of GABAA receptors in electrophysiologically and morphologically identified cortical pyramidal cells and interneurons. This diversity might derive from the different molecular composition of the receptors in these two cell types.
In the mammalian CNS, fast synaptic inhibition is mostly mediated by the γ-aminobutyric acid type A (GABAA) receptor, which is the target of GABAergic interneurons. Neocortical GABAergic interneurons not only make synapses onto pyramidal cells, but also onto other GABA-containing interneurons (Somogyi & Soltesz, 1986; Kisvarday, Beaulieu & Eysel, 1993). The functional interpretation of these interneuron-interneuron synapses is that presynaptic interneurons can exert disinhibitory effects by inhibiting their GABAergic target cells (Kisvarday et al. 1993). Immunohistochemical studies have shown a heterogeneity of GABAA receptors in different brain regions and in distinct neuronal classes (Fritschy & Mohler, 1995). Diversity of GABAA receptors may provide the basis for flexibility in signal transduction and drug-induced allosteric modulation.
In rat neocortex, the composition and density of GABAA receptor subunits are different in pyramidal cells and interneurons (Fritschy & Mohler, 1995), perhaps indicating the presence of distinct receptor subtypes. A functional heterogeneity of native GABAA receptors has been demonstrated, for example, in the hippocampus (Schonrock & Bormann, 1993), cerebellum (Puia, Costa & Vicini, 1994) and thalamus (Zhang, Huguenard & Prince, 1997).
In this study, we tested the hypothesis that neocortical pyramidal cells and interneurons, which have different electrophysiological properties and roles in cortical circuits, also possess functionally different GABAA receptor-mediated inhibitory currents. Specifically, we compared the kinetics of spontaneous and evoked inhibitory postsynaptic currents (sIPSCs and evoked IPSCs), and GABA-activated single Cl− channel currents in two anatomically and physiologically defined cell types in layer V of rat visual cortex. In pyramidal neurons that showed spike frequency adaptation during depolarization, IPSCs were briefer than those recorded in stellate neurons that had fast spikes with a non-adapting pattern. Corresponding cell-specific differences were also obtained in GABAA receptor-activated single Cl− channel currents. The results indicate that GABAA receptors in these two cell types have different functional properties.
METHODS
Slice preparation and maintenance
All experiments were carried out according to a protocol approved by the Stanford Institutional Animal Care and Use Committee. Sprague-Dawley rats were used in this experiment. Young animals at ages P11-14 (P0 is day of birth) were decapitated immediately after being deeply anaesthetized with pentobarbitone (55 mg kg−1, i.p.). Brains were removed and immersed in ice-cold oxygenated (95 % O2-5 % CO2) ‘cutting solution’ containing (mM): 230 sucrose, 2.5 KCl, 0.5 CaCl2, 10 MgSO4, 1.25 NaH2PO4, 26 NaHCO3 and 10 D-glucose. Coronal slices (350 μm) containing the primary visual cortical area (approximately 1.5-3 mm from the occipital poles) (Zilles & Wree, 1985) were cut using a vibratome in the above solution. Slices were then placed onto nylon net and submerged in oxygenated artificial cerebrospinal fluid (ACSF), containing (mM): 126 NaCl, 2.5 KCl, 2 CaCl2, 2 MgSO4, 1.25 NaH2PO4, 26 NaHCO3 and 10 D-glucose. Slices were allowed to recover for at least 1 h at room temperature (20-22°C) and then transferred as needed to a submerged-type recording chamber, and perfused with oxygenated ACSF at a temperature of 31 ± 1°C. Adult animals (P36-42) were deeply anaesthetized as above and rapidly perfused through the left ventricle with an ice-cold oxygenated solution modified from the ‘cutting solution’ by substitution of 110 mM choline chloride for sucrose. After removal of the brain, coronal occipital neocortical slices (350 μm) containing the primary visual cortex (Zilles & Wree, 1985) were cut in the cold choline chloride-substituted solution, incubated in half choline chloride solution-half ACSF at room temperature for ∼30 min, and then transferred to normal ACSF for incubation as above prior to recordings.
Whole-cell and cell-attached recordings under video microscopy
Whole-cell patch recordings were made from visually identified pyramidal cells and interneurons in layer V of primary visual cortex. The recordings were performed using a fixed-stage, upright microscope (Zeiss Axioskop) equipped with a water immersion objective (× 63, 0.9 NA), infrared (IR) illumination, Nomarski optics and an IR-sensitive video camera. The pipette solution contained (mM): 65 KCl, 65 potassium gluconate, 1 MgCl2, 1 CaCl2, 10 Hepes, 10 EGTA, 3 ATP. pH was adjusted to pH 7.3 with 1 M KOH and osmolarity to 280-290 mosmol l−1 with distilled water. Calculated ECl was -15 mV based on Nernst equation, with activity coefficients for extracellular Cl− of 0.76 and intracellular Cl− of 0.80, taking into account the permeability of gluconate through Cl− channels (Barker & Harrison, 1988). We estimated that the liquid junction potential in these experiments was less than 5 mV. Biocytin (0.3-0.4 %, w/v) was also included in the internal solution so that the position and morphology of the recorded cells could be verified following the physiological experiment. Patch pipettes were prepared from borosilicate glass using a Flaming-Brown micropipette puller (Model P-80/PC, Sutter Instruments) with resistances of 3-4 MΩ when filled with pipette solution (see above).
Electrical signals were amplified using an EPC-7 (LIST) amplifier in current- or voltage-clamp mode. The electrophysiological properties of the cells, such as resting potential, input resistance and spike firing pattern were characterized under current-clamp conditions. To characterize action potential properties, a series of small depolarizing current steps (150 ms, 10 pA increments) were applied to the cell until it fired action potentials. The onset of the spike (left end of the horizontal line in Fig. 1C) was determined by the sharp inflection point on the differentiated voltage trace. The spike duration was defined by the duration from the onset to the point where action potential repolarized to the onset level (horizontal line in Fig. 1C). For spike analysis, the amplitude of the fast afterhyperpolarization (fAHP) was defined as the maximum voltage deflection following the action potential repolarization, relative to the membrane potential at the spike onset (the vertical line in Fig. 1C). The time from the spike onset to the fAHP peak was defined as the peak latency of the fAHP.
Figure 1. Whole-cell recordings from a pyramidal cell and interneuron in a visual cortex slice under video-assisted Nomarski microscopy.
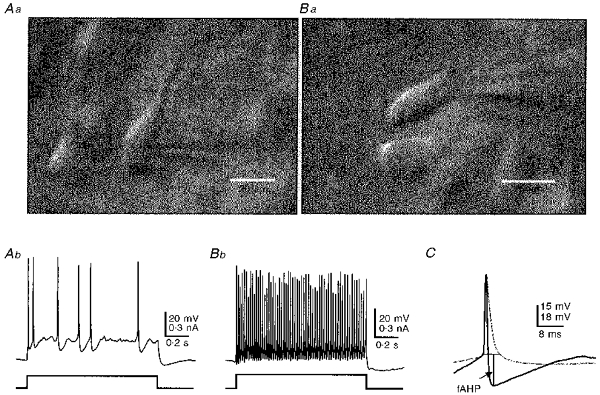
Aa, image of two layer-V pyramidal cells. Patch pipette is visible during whole-cell recording from the neuron on right. Pia mater is up in Aa and Ba. Calibrations are 20 μm in Aa and 15 μm in Ba. Action potentials evoked in the cell in Aa by a depolarizing current pulse at the resting potential of -62 mV, are shown in Ab. Note the spike frequency adaptation. Image of a layer V interneuron is shown in Ba (uppermost cell; patch pipette visible on right). Action potentials of the cell in Ba during a depolarizing current pulse from the resting potential of -60 mV are shown in Bb. Note the high frequency discharge without spike frequency accommodation. C, superimposed single action potentials of the pyramidal cell of A (light trace) and the interneuron of B (dark trace), aligned at action potential onsets. Note the short-duration action potential followed by a large, fast after-hyperpolarizing potential (fAHP) in the interneuron. Recordings in Ab, Bb and C had similar access resistance and were obtained with the same amplifier.
IPSCs were recorded at holding potentials (Vh) of -80 mV in the presence of 18 μM DNQX (6,7-dinitroquinoxoline-2,3-dione) and 50 μM (±)-APV, ((±)-2-amino-5-phosphonovaleric acid) to block iontropic glutamate receptors. Under these experimental conditions, IPSCs were inward currents, and evoked IPSCs were monosynaptic. Inhibitory currents were evoked with a bipolar extracellular stimulating electrode that was made from theta glass tubing (tip size 7-10 μm) filled with ACSF, and placed in layer V about 50 μm lateral to the soma of the recorded cell. The stimulus threshold was determined by applying a series of 100 μs square pulses whose intensity was increased from 10 to 80 μA until detectable responses were obtained. Once the threshold was determined, stimuli with double this duration (200 μs) were used to evoke IPSCs. Access resistance was monitored by measuring responses to small depolarizing voltage commands, and only data obtained from pipettes with access resistances of 9-13 MΩ without significant change during the experiment were included in this study.
GABA-activated single Cl− channel currents were recorded from visually identified pyramidal cells and interneurons using the cell-attached configuration of the patch-clamp technique and pipettes containing (mM): 67 CsCl, 66 KCl, 2 MgCl2, 10 Hepes, 10 EGTA, and 0.5 μM tetrodotoxin (TTX). The pipette solution contained 2 μM GABA, a concentration that consistently resulted in an adequate frequency of Cl− channel openings for quantitative analysis. The recording pipettes had resistances of 5-7 MΩ, and seals with resistances of < 2 GΩ were rejected. GABA single channel currents were recorded at a pipette potential of -100 mV in order to evaluate the channel open time, and at various potentials from -60 to -140 mV to estimate the channel conductance. The channel open times were measured from the initial 100 s of the recording at a pipette potential of -100 mV. This parameter was selected for analysis because open time distribution is not affected by GABAA receptor desensitization that might have occurred during recordings (Weiss, 1988).
To characterize and verify the firing properties and morphology of the visually identified interneurons that had been recorded with cell-attached pipettes, we subsequently ‘repatched’ the same cells with biocytin-filled whole-cell patch pipettes. In some experiments, we patched the same cell three times, first with a GABA-containing patch pipette for cell-attached recordings, then with a second cell-attached patch pipette containing 40 μM bicuculline and 40 μM picrotoxin without GABA, and finally with a whole-cell patch pipette filled with biocytin.
Data collection and analysis
An IBM PC-compatible computer equipped with pCLAMP (Axon Instruments) and Strathclyde Electrophysiology Software (Courtesy J. Dempster) was used to generate the stimulation pulses, and digitize and record responses on-line. Data were also digitized (44 kHz) by a Neurocorder DR-484 (Neuro Data Instruments) and stored on videotape for off-line analysis. The current signal was filtered at 1 kHz with a 8-pole Bessel filter (Frequency Devices), and sampled with the computer at 5 kHz for IPSC data or 10 kHz for single channel data. The following software packages were used for data analysis: Fetchan, Clampfit, and PStat (Axon Instruments), SCAN (J. Dempster), Origin (Microcal), and the locally written programs, Metatape and Detector.
sIPSCs were detected and analysed using Detector, Scan and Origin. The root-mean-square (r.m.s.) values of baseline noise for whole-cell voltage-clamp recordings ranged from 1.6 to 3.3 pA for different cells. The smallest detectable events had amplitudes of about 3 times the r.m.s. baseline noise. Such values were used as a detection threshold for analysing spontaneous events in each cell. Single channel currents were analysed with Fetchan. In single channel recordings, data were accepted for analysis only if none or rare multiple openings were evident. A 50 % threshold criterion was used to determine the durations of open and closed events. Open time (open duration) distribution histograms were constructed with PStat and exponentially fitted by using the Maximal Likelihood method. Closed times were not analysed because the uncertain number of Cl− channels in patches prevented us from estimating reliably the single channel closed time. For statistical comparisons, either Student's t test, Mann-Whitney ranked sum test, or ANOVA was used. The results are presented as means ±s.e.m.
Histology
Slices containing biocytin-filled cells were fixed in 4 % (w/v) paraformaldehyde in 0.1 M phosphate buffer overnight and then sectioned at about 85 μm. The fixed sections were processed with the Avidin-biotin-peroxidase method as described elsewhere in detail (Horikawa & Armstrong, 1988). Slices were also counterstained with Cresyl Violet to identify cortical layers. The morphology of filled cells was examined under the light microscope and neurons were drawn using a camera lucida. Cells were classified as interneurons or pyramidal cells using published criteria (Peters & Jones, 1984; Kawaguchi, 1993).
RESULTS
Pyramidal cells vs. fast spiking interneurons
The appearance of neurons under video-assisted Nomarski microscopy, their spike firing properties, and cell morphology determined retrospectively with biocytin staining, served as criteria to unambiguously distinguish interneurons from pyramidal cells. Pyramidal cells in layer V had very prominent apical dendrites oriented toward the pia, which could be clearly seen under the microscope (Fig. 1Aa), whereas interneurons lacked such apical dendrites and were oriented differently (Fig. 1Ba). Pyramidal cells usually exhibited spike frequency adaptation in response to a depolarizing current pulse in whole-cell current-clamp recordings, as shown in Fig. 1A b, whereas fast-spiking interneurons fired repetitive action potentials without adaptation during similar depolarization (Fig. 1B b). Furthermore, the fast-spiking interneurons had short-duration action potentials followed by large-amplitude fAHPs (Fig. 1C, dark trace). Grouped data from ten fast spiking interneurons and ten pyramidal cells revealed that the former had a significantly narrower spike width, larger amplitude fAHPs and a shorter fAHP peak latency, measured from the spike onset to the maximum negative deflection (Table 1). The data suggest that these two cell types are indeed distinct electrophysiologically as previously reported (McCormick, Connors, Lighthall & Prince, 1985; Kawaguchi, 1993). We are aware that patch-clamp amplifiers can introduce measurement errors in current-clamp mode, especially during the recording of rapid events like action potentials (Magistretti, Mantegazza, Guatteo & Wanke, 1996). As we used the same patch-clamp amplifier (EPC-7) for all recordings and the access resistance was similar for both cell types, the errors are likely to be similar, justifying comparisons of action potential and fAHP parameters between the two cells types. Furthermore, we observed similar differences in firing patterns, and spike and fAHP parameters between pyramidal cells and fast spiking interneurons using an AxoClamp-2B amplifier in bridge mode during other experiments (data not shown).
Table 1.
Action potential properties in fast spiking interneurons vs. pyramidal cells from P11–14 rats
| Parameters | Interneurons (n= 10) | Pyramidal cells (n= 10) | P value |
|---|---|---|---|
| Spike duration (ms) | 2.0 ± 0.2 | 6.6 ± 0.7 | < 0.0001 |
| fAHP amplitude (mV) | 19 ± 2 | 12 ± 1 | < 0.005 |
| fAHP peak latency (ms) | 4.8 ± 0.6 | 32 ± 4 | < 0.0001 |
fAHP: fast after-hyperpolarization.
Each visually identified interneuron and some pyramidal cells were filled with biocytin so that their identities could be verified. All neurons thought to be pyramidal cells on the basis of their appearance in living slices were found to be pyramidal in type when processed for biocytin. Most recovered interneurons agreed with the visual identification; however, some cells initially thought to be interneurons in living slices were later determined to be pyramidal cells after biocytin processing (8 of 62 presumed interneurons). An example of a recovered biocytin-filled fast-spiking multipolar interneuron is shown in Fig. 2. Most fast-spiking interneurons had a multipolar stellate morphology. Only cells that could be unambiguously identified on the basis of morphology and firing properties were accepted for further analysis. One feature of layer V fast-spiking interneurons is that their axonal arbors are mostly distributed within the layer (Fig. 2B; see also Kawaguchi, 1993).
Figure 2. Image of a biocytin-filled interneuron.
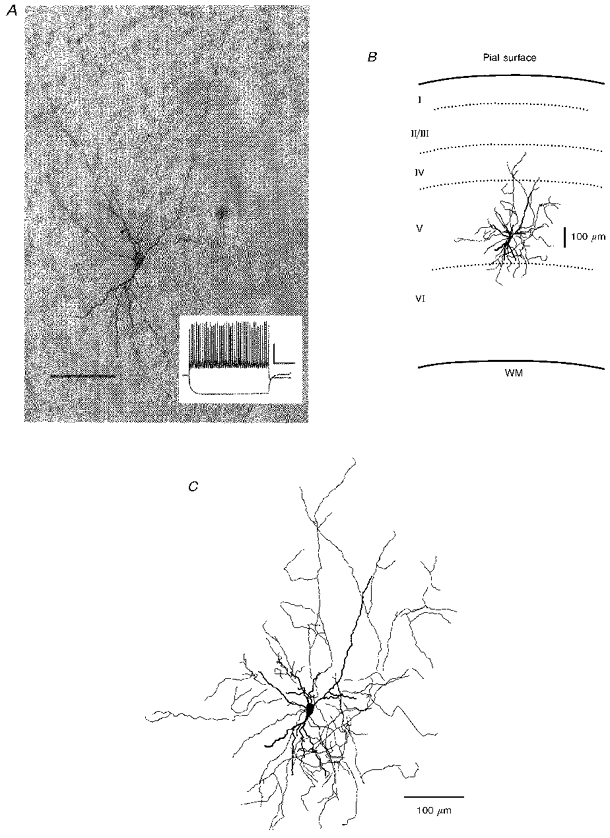
A, photomicrograph of a biocytin-filled fast spiking interneuron. Scale bar, 60 μm. Inset shows the firing pattern of this interneuron in response to a depolarizing current pulse, with calibration bars: 25 mV, 0.3 s. B, camera lucida drawing under low magnification, indicating the location of the cell in slice. Roman numbers indicate cortical laminae. Note that the axonal arborizations are mainly confined within layer V. WM, white matter. C, camera lucida drawing of the cell at higher magnification. Thick traces indicate the soma and dendrites, thin lines show the axon and its branches.
The data presented in the following sections were obtained from thirty-nine pyramidal cells and thirty-one interneurons.
Spontaneous IPSCs
Spontaneous inhibitory currents were recorded from both pyramidal cells and interneurons (Fig. 3A) using whole-cell voltage-clamp techniques, with a holding potential of -80 mV and a calculated ECl of -15 mV (see Methods). Iontropic glutamate receptors were blocked by including 18 μM DNQX and 50 μM APV in the perfusate. Under these experimental conditions, sIPSCs were inward currents and could be abolished by adding the GABAA receptor antagonist bicuculline (40 μM) to the perfusate (Fig. 3A). Typical single sIPSCs from a pyramidal cell and an interneuron are superimposed in Fig. 3Ba and Bb, respectively. Mean sIPSCs from the same pair of neurons are shown in Fig. 3C, and these traces are scaled to the same amplitude and superimposed in Fig. 3D. As can be seen in both the single traces and the mean waveforms, the IPSCs in the interneuron have a slower decay than those in the pyramidal cell (compare P and I traces of Fig. 3D).
Figure 3. Spontaneous IPSCs in pyramidal cell and interneuron.
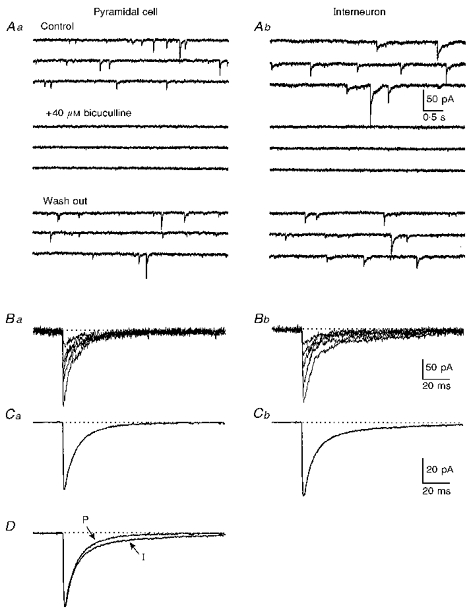
A, spontaneous IPSCs recorded from a pyramidal cell (Aa) and an interneuron (Ab) in control ACSF containing 18 μM DNQX and 50 μM APV (top three traces); after adding 40 μM bicuculline to the perfusate (middle three traces) and after washing out bicuculline for 15 min (lower three traces). B, multiple superimposed individual sIPSCs from another pyramidal cell (Ba) and interneuron (Bb). C, mean of 20 consecutive sIPSCs from the pyramidal cell (Ca) and interneuron (Cb) of Ba and Bb respectively. D, the traces of the pyramidal cell in Ca (P) and the interneuron in Cb (I) are scaled to the same amplitude and superimposed. Calibration in Ab for all the traces in A, that in Bb for traces in B, and that in Cb for those in C.
We compared sIPSCs recorded from eleven pyramidal cells and nine fast-spiking interneurons. The frequency of sIPSCs was 1.7 ± 0.3 Hz in pyramidal cells and 1.9 ± 0.6 Hz in interneurons. The rise time histogram distributions were positively skewed for both cell types, and the majority of events had rise times of less than 1 ms as shown in two examples in Fig. 4A. The peak amplitude of these inhibitory currents fluctuated widely in each recording for both cell types. Detectable sIPSCs (see Methods) had amplitudes ranging from less than 10 pA to greater than 500 pA in pyramidal cells with a mean value of 55 ± 10 pA, and from less than 10 pA to about 450 pA in interneurons (mean 57 ± 6 pA). The relationship between sIPSC amplitude and the rise time from the two cells in Fig. 4A is plotted in Fig. 4B. A large number of sIPSCs with fast rise time displayed a broad range of amplitude fluctuations, whereas most slow rising events had only small amplitudes. A similar profile of amplitude-rise time relationship has been found in spontaneous miniature EPSCs (mEPSCs) from cultured spinal cord motoneurons (Ulrich & Luscher, 1993), and in sEPSCs and mEPSCs from hippocampal CA3 pyramidal cells in slices (Xiang, 1995), implying that dendritic filtering does affect some synaptic events in neurons of these preparations. The other ten pyramidal cells and eight interneurons analysed in this study had similar positively skewed rise time distributions and a similar profile of amplitude-rise time relationship. These data suggested that, for a given cell, most sIPSCs originated from synapses that were located at a similar and close electrotonic distance from the recording site, while some other events originated on very distant processes and suffered more from electrotonic attenuation. The relationship between the mean sIPSC amplitude vs. 10-90 % rise time for different cells is plotted in Fig. 4C. A non-significant, slightly negative correlation was observed for both cell types (r= -0.31 for pyramidal cells and -0.20 for interneurons, P > 0.05). Furthermore, the amplitude-rise time distribution was similar between the two cell types (e.g. Fig. 4Ba vs. 4Bb), suggesting that electrotonic attenuation of inhibitory currents for the two cell types was similar.
Figure 4. Relationship between sIPSC amplitude and 10-90 % rise time.
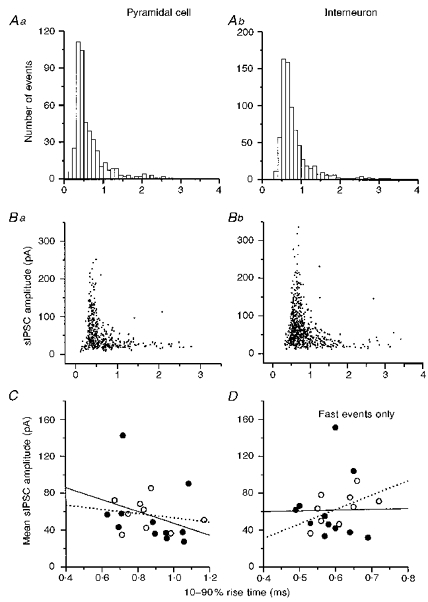
A, 10-90 % rise time distribution histograms of sIPSCs from a pyramidal cell (Aa, n= 457 events) and an interneuron (Ab, n= 731 events). Bin width, 0.1 ms. B, relationship of sIPSC amplitude to 10-90 % rise time from the same cells as in A. C, relationship between mean sIPSC amplitude and mean rise time for single pyramidal cells (•) and interneurons (○). Correlation coefficient is -0.31 for pyramidal cells (continuous regression line) and -0.20 for interneurons (dotted line) (P > 0.05). D, relationship between mean sIPSC amplitude and mean rise time for events with rise time < 0.9 ms. Correlation coefficient is 0.02 for pyramidal cells (•, continuous line) and 0.55 for interneurons (○, dotted line) (P > 0.05, for both).
In any case, to minimize the influence of voltage-clamp errors and variations of electrotonic filtering on kinetics of sIPSCs, we used only fast rising events with 10-90 % rise times less than 0.9 ms for subsequent analysis. For these selected sIPSCs, neither mean rise time (0.6 ms in both cell types), nor mean amplitude (61 vs. 65 pA in pyramidal cells and interneurons, respectively) was significantly different between the cell groups (Table 2). Based on the calculated ECl (see Methods), the mean synaptic conductance of these fast events was about 1 nS for both cell types. Moreover, there was no correlation between the mean sIPSC amplitude and 10-90 % rise time for such events in either pyramidal cells or interneurons (r= 0.016 and 0.55, respectively; P > 0.05 for both; Fig. 4D).
Table 2.
Comparisons of fast rising sIPSCs in interneurons vs. pyramidal cells from P11–14 rats
| Parameters | Interneurons (n= 9) | Pyramidal cells (n= 11) | P value |
|---|---|---|---|
| 10–90 % rise time (ms) | 0.61 ± 0.02 | 0.58 ± 0.02 | > 0.7 |
| Mean amplitude (pA) | 65 ± 6 | 61 ± 11 | > 0.2 |
| Half-width (ms) | 7.8 ± 0.7 | 7.7 ± 0.5 | > 0.8 |
| 90 % decay time (ms) | 45 ± 6 | 27 ± 3 | < 0.01* |
| τ1 (ms) | 6.5 ± 0.6 | 6.4 ± 0.4 | > 0.8 |
| τ2 (ms) | 49 ± 4 | 22 ± 3 | < 0.0001* |
| Q (pC) | 1.0 ± 0.1 | 0.82 ± 0.23 | < 0.05* |
| Q1 (pC) | 0.28 ± 0.01 | 0.27 ± 0.05 | > 0.05 |
| Q2 (pC) | 0.72 ± 0.05 | 0.54 ± 0.19 | < 0.05* |
τ1 and τ2, first and second time constants of sIPSC decay
Q, total charge corresponding to mean sIPSCs
Q1 and Q2, charges corresponding to the first and second decay components.
indicates significance at P < 0.05 level.
The decay phase of individual sIPSCs as well as mean sIPSCs in most pyramidal cells analysed in the present study could be fitted reasonably well by a single exponential function, with the mean value of 11 ± 1 ms, as shown in Fig. 5A1 and 5A3. In many cases, the sum of two exponential functions could provide an even better fit (Fig. 5A2 and 5A4). However, decay of sIPSCs in interneurons could not be well-described by a single exponential function for either individual events (Fig. 5B1) or mean traces (Fig. 5B3); rather they required two time constants for a satisfactory fit (Fig. 5B2 and 5B4). Grouped data for sIPSC decay, fitted to two exponentials, are summarized in Fig. 5C. The fast time constant, τ1, was about 6.4 ms in pyramidal cells and 6.5 ms in interneurons (Fig. 5C1), values that were not significantly different (Table 2), whereas the slow time constant, τ2, was significantly longer in interneurons than pyramidal cells (49 vs. 22 ms, P < 0.0001, Fig. 5C2 and Table 2). The half-width of sIPSCs was not significantly different between the two cell types, whereas the 90 % decay time was significantly longer in interneurons than pyramidal cells (Table 2).
Figure 5. Exponential fits for sIPSC decay time course in immature cortex (P11-14).
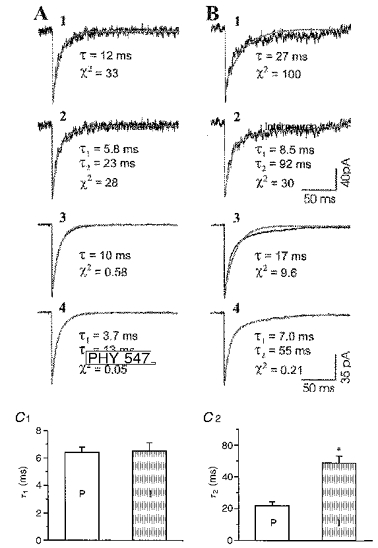
A and B, typical examples of individual (A1, 2; B 1, 2) and mean (A3, 4; B 3, 4) sIPSCs from a pyramidal cell (A) and an interneuron (B) fit by single (A1, 3; B 1, 3) and double (A2,4; B 2, 4) exponential functions. Exponential curves are indicated by light traces in A and B. A3 and A4 mean traces from 388 sIPSCs. B 3 and B 4 mean traces from 345 sIPSCs. τ and χ2values for the exponential fits are shown beneath the traces. Calibrations in B 2 are also for A1, A2 and B 1. Calibrations in B 4 are also for A3, A4 and B 3. C, bar graphs comparing the fast time constant (C 1) and slow time constant (C 2) between pyramidal cells (P, n= 11) and interneurons (I, n= 9). The error bars indicate the standard error of mean. *P < 0.0001 between τ2 for pyramidal cells (P) and interneurons (I).
The charge movement during sIPSCs, which can be used as a measure for efficacy of inhibition, was also calculated. The mean value of charge corresponding to sIPSCs was significantly greater in interneurons than in pyramidal cells (1.0 vs. 0.8 pC, P < 0.05, Table 2). Furthermore, the difference could be mainly attributed to the slower late decay component of inhibitory currents in interneurons. The charge carried by the late component (Q2) was significantly greater in interneurons than in pyramidal cells; however, charge in the early component (Q1) was similar in both cell groups (Table 2).
Since GABAergic inhibition is relatively immature in the early postnatal period in rat (Luhmann & Prince, 1991) and developmental changes in GABAA receptors are known to occur (Fritschy, Paysan, Enna & Mohler, 1994), these differences in the kinetics of inhibitory currents might have been due to a differential development of receptors on interneurons versus pyramidal neurons. To evaluate this possibility we performed similar experiments on adult rats (P36-42). The differences in decay kinetics of sIPSCs between the two cell types persisted in adults animals, and were qualitatively similar to those obtained from neurons of immature slices. Specifically, a single exponential function could provide a fairly good description for the decay phase of sIPSCs from pyramidal cells (τD= 5.0 ± 1.6 ms, n= 4) (see Fig. 6C1 and C3), but not for τD in interneurons (Fig. 6D1 and D3), which required two time constants for a good fit (Fig. 6D2 and D4). The difference in sIPSC kinetics between the two cell types was mainly attributable to the longer slow decay component (τ2) in interneurons (19 ± 6 ms, n= 4) than in pyramidal cells (5.6 ± 0.3 ms, n= 4; Fig. 6E2). The pyramidal cells and interneurons in adult animals had similar sIPSC 10-90 % rise times (0.63 ± 0.01 vs. 0.57 ± 0.05 ms), peak amplitude (59 ± 5 vs. 52 ± 14 pA), and fast decay time constant (τ1) (4.6 ± 0.6 vs. 4.3 ± 0.7 ms).
Figure 6. Exponential fits for decay time course of sIPSCs from mature brain slices.
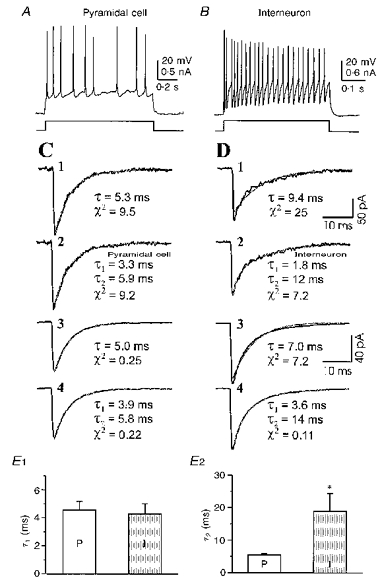
A and B, action potentials evoked by depolarizing current pulses in a pyramidal cell (A) and an interneuron (B), demonstrating distinct firing properties of these two cell types. C and D, typical examples of individual (C 1, 2; D1, 2) and mean (C 3, 4; D 3, 4) sIPSCs from the pyramidal cell (C) and interneuron (D) fitted by single (C 1, 3; D1, 3) and double (C 2, 4; D 2, 4) exponential functions. Exponential curves are indicated by light traces in C and D. C 3 and C 4 mean traces from 133 sIPSCs for the pyramidal cell. D 3 and D4 mean traces from 270 sIPSCs for the interneuron. τ and χ2values for the exponential fits are shown beneath the traces. Calibrations in D 1 are also for C 1, C 2 and D 2. Calibrations in D 3 also for C 3, C 4 and D 4. E, bar graphs comparing the fast time constant (E 1) and slow time constant (E 2) between pyramidal cells (P, n= 4) and interneurons (I, n= 4). The error bars indicates the standard error of mean. *P < 0.03 between τ2 for pyramidal cells (P) and interneurons (I).
Evoked IPSCs
Pharmacologically isolated monosynaptic evoked IPSCs (see Methods) were studied in nine pyramidal cells and six fast spiking interneurons, to determine whether the differences in kinetics described above for sIPSCs were present. Figure 7A shows examples of mean traces of evoked IPSCs recorded from a pyramidal cell (Aa) and an interneuron (Ab). In Fig. 7Ac, the two traces are scaled to the same amplitude and superimposed, to illustrate the difference in decay kinetics. The properties of evoked IPSCs in interneurons and pyramidal cells are summarized in Table 3. The mean 10-90 % rise times were the same in the two cell types (about 1.8 ms; Fig. 7B), but decay time of evoked IPSCs was longer in interneurons and, as in the case of sIPSCs, the difference was accounted for by the second time constant of decay. Specifically, τ1 and τ2 were 13 and 64 ms, respectively, in interneurons, and 12 and 47 ms, respectively, in pyramidal cells (Fig. 7Ca and Cb), and the only significant difference was in τ2 (P < 0.005). Half-width and 90 % decay time were significantly longer in interneurons than in pyramidal cells (see Table 3). The mean amplitude of evoked IPSCs tended to be larger in pyramidal cells (330 pA) than that in interneurons (200 pA), but this difference was not significant.
Figure 7. Comparison of evoked IPSCs in pyramidal cells and interneurons.
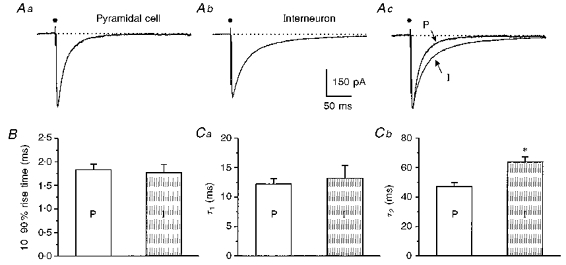
Mean (n= 15) evoked IPSCs recorded from a pyramidal cell (Aa) and an interneuron (Ab). Ac, traces of Aa and Ab scaled to the same amplitude and superimposed. Arrows point to currents from the pyramidal cell (P) and the interneuron (I). Note the difference in decay time courses. . indicates the stimulus artifact. B, bar graph comparing 10-90 % rise times of pyramidal cells (P, n= 9) and interneurons (I, n= 6). C, comparisons of τ1(Ca) and τ2(Cb) for the same groups of pyramidal cells and interneurons. *P < 0.005 between τ2 for pyramidal cells (P) and interneurons (I).
Table 3.
Comparisons of evoked monosynaptic IPSCs in interneurons vs. pyramidal cells from P11–14 rats
| Parameters | Interneurons (n= 6) | Pyramidal cells (n= 9) | P value |
|---|---|---|---|
| 10–90 % rise time (ms) | 1.8 ± 0.2 | 1.8 ± 0.1 | > 0.7 |
| Half-width (ms) | 24 ± 2 | 16 ± 1 | < 0.01* |
| 90 % decay time (ms) | 120 ± 13 | 58 ± 5 | < 0.0005 * |
| τ1 (ms) | 13 ± 2 | 12 ± 1 | > 0.6 |
| τ2 (ms) | 64 ± 4 | 47 ± 3 | < 0.005 * |
| Mean amplitude (pA) | 200 ± 46 | 330 ± 56 | > 0.1 |
τ1 and τ2, first and second time constants of evoked IPSC decay.
indicates significance at P < 0.05 level.
The difference in evoked inhibitory currents between interneurons and pyramidal cells, especially their different decay kinetics, was thus consistent with that found in spontaneous IPSCs, supporting the conclusion that GABAA receptors in interneurons have different functional properties than in pyramidal cells. To support this hypothesis further, we recorded GABA-activated single Cl− channel currents from these two cell types.
GABA-induced single Cl− channel currents
At a pipette potential of -100 mV, the GABA-activated single Cl− channels in pyramidal cells tended to open briefly (Fig. 8Aa), whereas, those in interneurons had longer open times (Fig. 8Ab). To determine whether these single channel currents were specifically GABA activated, we obtained sequential cell-attached recordings from two pyramidal cells and two interneurons. Each neuron was first patched with a pipette containing GABA and channel activities such as those of Fig. 8A were recorded. Then the first pipette was removed and recordings were made with a second patch electrode containing 40 μM bicuculline and 40 μM picrotoxin without GABA. Under these conditions, similar channel currents were absent and only rare spontaneous channel activity was recorded (Fig. 8B). Four other pyramidal cells and two interneurons were initially recorded with cell-attached pipettes containing the antagonists, without GABA, and in no case were channel activities similar to those of Fig. 8A seen. All the interneurons were subsequently characterized electrophysiologically with whole-cell current-clamp recordings (see Methods). The mean open time for single Cl− channels in response to 2 μM GABA was significantly longer in interneurons (n= 6) than pyramidal cells (n= 7; 5.0 ± 0.6 vs. 2.8 ± 0.5 ms, P < 0.02, Fig. 8C). The open time distribution required a double exponential function for a satisfactory fit as shown in the examples of Fig. 8Da and Db. The group data are summarized in Fig. 8E. Both time constants were significantly longer in interneurons compared with pyramidal cells (1.6 ± 0.3 vs. 0.92 ± 0.12 ms for τ1, Fig. 8Ea; and 10 ± 1 vs. 6.5 ± 1.1 ms for τ2, Fig. 8Eb; P < 0.05 and P < 0.03, respectively).
Figure 8. Comparison of GABA-induced Cl− channel currents in a pyramidal cell and interneuron.
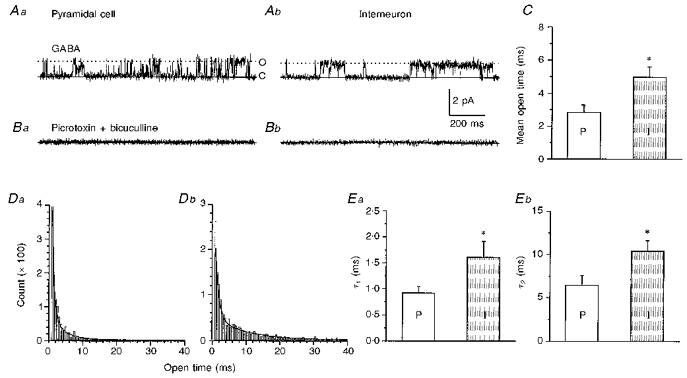
A, Cl− single channel currents recorded from a pyramidal cell (Aa) and interneuron (Ab) with cell-attached recording pipette containing 2 μM GABA. Closed states are indicated by ‘C’ and continuous lines and open states by ‘O’ and dotted lines. B, cell-attached recordings from the same cells as in A (Ba, pyramidal cell and Bb, interneuron) obtained after ‘repatching’ neurons with pipettes containing 40 μM picrotoxin and 40 μM bicuculline. C, bar graph of GABA channel mean open time from pyramidal cells (n= 7) and interneurons (n= 6). *P < 0.02 between τ2 for pyramidal cells (P) and interneurons (I). D, histograms of open time distribution from a pyramidal cell (Da) and an interneuron (Db). Each of the histograms can be fitted by sum of two exponential curves, time constants of τ1= 0.78 ms; τ2= 4.3 ms for Da; τ1= 1.1 ms; τ2= 12 ms for Db. E, bar graphs of grouped data for τ1, P < 0.05 (Ea) and τ2, P < 0.03 (Eb) in pyramidal cells (n= 7) and interneurons (n= 6).
The conductance of GABA-activated Cl− channels was estimated by varying the pipette potential from -60 to -140 mV. Figure 9A shows examples of single Cl− channel activities induced by 2 μM GABA in a pyramidal cell (Aa) and an interneuron (Ab) at various holding potentials. In addition to the main open and closed states indicated by ‘O’ and ‘C’ on the figure, the GABA-activated single Cl− channels also exhibited some open sub-states as indicated by arrowheads and dashed lines in Fig. 9Ab. These sub-states were not further analysed. To measure the main open-state current, we constructed all-point histograms, fitted the main peaks of the histogram with a multiple Gaussian function as shown in Fig. 9B, and measured the current difference between two Gaussian peaks corresponding to channel main open state and baseline noise to estimate the value of single channel current for a given recording. The mean value of the main open-state channel current was then calculated for all patches and plotted against the holding potential. The chord conductance was obtained by fitting linear regression lines to the current-voltage relationship (Fig. 9C). The single Cl− channel conductance was 15 pS in pyramidal cells and 12 pS in interneurons, a difference that was statistically significant (P < 0.0001). By extrapolating the regression line, we estimated that Cl− single channel currents reversed polarity when the cell-attached pipette potential was approximately -10 mV for both cell types (Fig. 9C). In other words, GABA at low micromolar levels could activate Cl−channels and depolarize the membrane potential by ∼10 mV in cortical interneurons and pyramidal cells at post-natal age of 11-14 days. Based on the Nernst equation, the expected ECl with a pipette solution containing 137 mM Cl− (see Methods) is approximately -60 mV, assuming an intracellular [Cl−] of 14 mM (Owens, Boyce, Davis & Kriegstein, 1996). Thus, the estimated resting potentials of these cells were around -70 mV.
Figure 9. Estimate of single Cl− channel conductance in pyramidal cell and interneuron using cell-attached recordings.
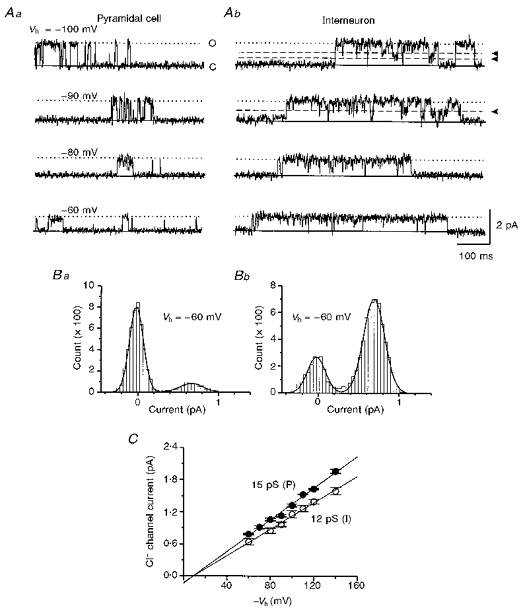
A, GABA-activated single Cl− channel currents from a pyramidal cell (Aa) and an interneuron (Ab) at different pipette holding potentials (Vh) as indicated on the left. ‘O’ and dotted lines denote the open states and ‘C’ and continuous lines the close states. Arrowheads and dashed lines in -100 and -90 mV traces of Ab indicate the open sub-state. B, two examples of all-point histograms from the pyramidal cell (Ba) and interneuron (Bb) of A at the pipette potential of -60 mV. Smooth curves are Gaussian fittings. C, relationship between mean Cl− channel current and the holding potential for patches from pyramidal cells (•) and interneurons (○). Each data point represents the mean current value obtained from 3 to 5 patches.
DISCUSSION
The present study demonstrates a functional diversity of GABAA receptor-mediated synaptic transmission in electrophysiologically and morphologically identified cortical pyramidal cells and interneurons. Specifically, inhibitory synaptic currents in interneurons had longer decay times compared with those in pyramidal cells. A double exponential function is required for a satisfactory fit of the sIPSC decay in interneurons, whereas a single exponential function could provide a fairly good fit to the decay of sIPSCs in pyramidal cells (Figs 5 and 6).
To our knowledge, no published data are available regarding the kinetics of sIPSCs in cortical layer V interneurons. Our results show that the mean synaptic conductance is approximately the same in both cell types (∼1 nS), based on the calculated ECl of about -15 mV. These conductance values are similar to those in cerebellar (Puia et al. 1994) and hippocampal dentate granule cells (Edwards, Konnerth & Sakmann, 1990) and thalamic relay neurons (Zhang et al. 1997), smaller than those in cerebellar Purkinje cells (Puia et al. 1994), and larger than those in layer V pyramidal cells in adult somatosensory cortex (0.5 nS; Salin & Prince, 1996). Although a single exponential could provide a reasonably good fit for the decay of sIPSCs in most pyramidal cells (τD=∼11 ms), double exponentials furnished a better fit for both cell types with time constants of about 6.4 and 22 ms for pyramidal cells and 6.5 and 49 ms for interneurons. Pyramidal cells had much shorter late decay time constants than those in cortical interneurons of this study, or hippocampal (Edwards et al. 1990) and cerebellar granule cells (Puia et al. 1994). However, interneurons had sIPSC decays similar to those in these other neuronal types. The layer V pyramidal cells in this study had a longer decay time constant (∼11 ms) when fitted with a single exponential than those of the same cell type in somatosensory cortex of mature animals (∼4 ms) at the similar holding potential of -80 mV (Salin & Prince, 1996). This discrepancy could be due to different recording temperatures in two experiments (∼31°C vs.∼35°C). We have found that warmer temperatures are associated with a higher frequency of sIPSCs and faster sIPSC decay times (Z. Xiang, J. R. Huguenard & D. A. Prince, unpublished observations). The possibility that these differences reflect developmental changes is discussed below.
Several possible factors could account for the difference in decay kinetics of sIPSCs in different cell types. One could be experimental artifact, due to differences in recording access resistance. This possibility was ruled out in the present study, because only recordings with access resistances between 9-13 MΩ without significant change during the experiment were included in the final analysis, and the 10-90 % rise time of sIPSCs was similar in pyramidal cells and interneurons. A second possible explanation, different electrotonic filtering effects on sIPSCs in pyramidal cells versus interneurons, can also be eliminated because the difference in decay time persisted when the analysis included only events with 10-90 % rise times less than 0.9 ms. These fast rising events presumably originated from synapses that were electrotonically close to the somatic recording site. Finally, electrotonic slowing would be expected to affect both decay time constants; however, the fast decay time constant of sIPSCs was approximately the same in the two cell types. As GABAA receptor subunit composition undergoes developmental changes in the central nervous system (Fritschy et al. 1994), another possibility is that the kinetic difference results from a differential degree of maturation in the two cell types. But we found that the sIPSC kinetic difference persisted in adult tissue (Fig. 6), suggesting that it does not solely reflect the differential development of GABAA receptors in interneurons and pyramidal cells. The sIPSC kinetics, however, do show developmental changes; sIPSCs in neurons from the young tissue have longer decay times than those from mature animals for both pyramidal cells and interneurons. This is evident when comparing the traces and τ values in Figs 5 and 6 (see also Hollrigel & Soltesz, 1997). The time course of maturation of GABAA receptors in cortical pyramidal cells and interneurons and the relationship of changes to shifts in the GABAA receptor subunit composition requires further study.
The most likely explanation for the difference in decay time course of the inhibitory synaptic currents is a diversity of GABAA receptor-mediated synaptic transmission in these two cell types. The decay of IPSCs is dependent on several processes, including neurotransmitter diffusion and clearance in synaptic cleft, and the kinetic properties of the postsynaptic channels. Experimental and theoretical considerations suggest that differences in transmitter diffusion and clearance are unlikely reasons for the difference in the decay kinetics. Such processes are very rapid relative to the time course of the synaptic current, and the rate-limiting step for synaptic current deactivation is the dissociation of neurotransmitter from the receptor (Lester, Clements, Westbrook & Jahr, 1990; Clements, 1996) or desensitization (Jones & Westbrook, 1995), rather than its diffusion and clearance. It has also been shown that blockade of GABA re-uptake does not change the decay time course of IPSCs evoked by weak stimuli in the hippocampus (Isaacson, Solis & Nicoll, 1993). Thus, the most likely reason for the kinetically distinct GABAA receptor-mediated synaptic currents in pyramidal cells and interneurons is a functional heterogeneity of postsynaptic GABAA receptors and/or channels, themselves. This proposal is analogous to that used to explain the kinetic difference between sIPSCs in cerebellar and hippocampal granule cells (Vincent, Armstrong, Marty, 1992), between GABAergic currents generated in cerebellar Purkinje and granule cell synapses (Puia et al. 1994), and between spontaneous inhibitory currents in thalamic relay cells and nucleus reticularis neurons (Zhang et al. 1997). Our single channel data support this possibility by showing that GABAA channels in interneurons have a longer mean open time than those in pyramidal cells.
There have been many studies on GABA-activated single Cl− channels but most have been done on cultured neurons. A broad range of channel conductances (8-42 pS) has been reported in a variety of tissues, using outside-out, inside-out, or cell-attached techniques, with the commonly reported main state conductance in the range of 20 to 30 pS (Hamill, Bormann & Sakmann, 1983; Macdonald, Rogers & Twyman, 1989; Schonrock & Bormann, 1993). Furthermore, the measured conductance values appear to depend on recording techniques. For example, cell-attached recordings seem to yield lower conductance values than outside-out patch recordings in mouse spinal cord (SC) neurons (17 vs. 30 pS) (Bormann, Hamill & Sakmann, 1987). Our results are consistent with the lower single channel conductance observed with cell-attached techniques, although the chord conductances of 15 pS for pyramidal cells and 12 pS for interneurons in this study were smaller than those reported using similar techniques in mouse SC neurons (17 pS; Bormann et al. 1987), and rat embryonic SC and olfactory bulb neurons (17 and 22 pS, respectively) (Serafini, Valeyev, Barker & Poulter, 1995).
Single Cl− channel open times also vary widely in different types of neurons. For example, open time frequency histograms could be fitted by one, two or three exponential functions with time constants ranging from 0.2 ms for τ1 to 35 ms for τ3 in various experimental preparations (Macdonald et al. 1989; Yang & Zorumski, 1989; Kilic, Moran & Cherubini, 1993; Serafini et al. 1995). In the present study, the open time frequency histograms could be well-fitted by two exponentials in both pyramidal cells and interneurons. Values for τ1 of 0.9 ms and τ2 of 6.5 ms in pyramidal cells were similar to those for chick SC neurons (τ1= 0.8; τ2= 7 ms; Yang & Zorumski, 1989), while durations of τ1 and τ2 in interneurons (1.6 and 10 ms, respectively) were longer than those in pyramidal cells.
The structural basis for the functional heterogeneity of GABAA receptor might be the diversity of subunit assembly. Although some GABAA receptor subunits such as α1, α2, β2, β3, γ2 and δ are common to interneurons and layer V pyramidal cells in neocortex, other subunits including α3 and α5 are abundant in pyramidal cells, but absent in interneurons (Fritschy & Mohler, 1995). A functional diversity of native GABAA receptors has also been demonstrated in other brain regions, such as the cerebellum, where sIPSCs and GABA-induced responses have slower decay time in granule cells than in Purkinje cells (Puia et al. 1994), and the thalamus, where IPSCs and GABA-activated single Cl− channel currents are longer lasting in GABAergic nucleus reticularis neurons than in relay cells (Kang, Huguenard & Prince, 1996; Zhang et al. 1997). Post-translational modifications, such as phosphorylation, could also regulate the channel kinetics (Macdonald & Olsen, 1994; Lin, Kapur & Macdonald, 1996).
In addition to the more prolonged decay time courses of both spontaneous and evoked IPSCs in interneurons compared with pyramidal cells, we noted that the rise times and decay of evoked IPSCs were much longer than those of sIPSCs for both cell groups, and that the difference in decay kinetics for evoked IPSCs between cell types was much more significant than that for sIPSCs. These findings might be due to asynchronous activation of multiple presynaptic terminals at different locations on the postsynaptic soma and dendrites, or asynchronous release of vesicles at terminals (Diamond & Jahr, 1995).
Galarreta & Hestrin (1996) found that the decay kinetics of miniature IPSCs (mIPSCs) in layer V interneurons were similar to, or even faster, than in pyramidal cells. The time constants of sIPSC decay in pyramidal cells in the present study are in agreement with those reported for mIPSCs by these authors. However, our data indicate that the decay time constants of sIPSCs for interneurons, particularly the late decay component, are longer than those reported for mIPSCs by Galarreta & Hestrin (1996). This discrepancy might be due to the difference in age of rats (P11-14 in these experiments vs. P14-18 in the other study), and/or the involvement of different synapses in action potential- dependent and action potential-independent IPSCs (sIPSCs vs. mIPSCs).
Our findings, together with those of other investigators, indicate that native GABAA receptors in the central nervous system are functionally diverse. This diversity derives from the molecular composition of the receptor. One important implication of the present results is that GABAergic postsynaptic inhibition on pyramidal neurons and interneurons might be differentially modulated by pharmacological agents active at the GABAA receptor, such as benzodiazepines. Benzodiazepine modulation of GABAA receptor-mediated responses is dependent on the structural composition of these receptors (Pritchett et al. 1989; Macdonald & Olsen, 1994). Recently, differential effects of benzodiazepines on sIPSCs with different kinetics in various cell types have been demonstrated in brain regions such as in cerebellum, where diazepam selectively prolongs the sIPSC decay in Purkinje but not granule cells (Puia et al. 1994), and in thalamus, where benzodiazepines have a more powerful modulatory action on GABAergic responses in nucleus reticularis neurons than in relay cells (Zhang, Huguenard & Prince, 1994). This raises the interesting possibility that benzodiazepines or other GABAergic drugs selective at the interneuronal GABAA receptor might enhance excitability of intracortical circuits through dis-inhibitory effects. On the contrary, agents that are antagonists at the interneuronal GABAA receptor, or selective agonists at the pyramidal cell receptor, would be most effective in enhancing inhibition in such circuits. Results along this line might have significant implications for treatment of neurological disorders such as cortical epilepsy, where disinhibition is hypothesized to be a possible underlying mechanism (Prince, 1997).
It is important to stress that our experiments focused only on fast-spiking interneurons of layer V. Given the extensive diversity of neocortical interneuronal subtypes (Peters & Jones, 1984; Kawaguchi, 1993), it is possible that the kinetics of GABAA receptor-mediated currents in other types of interneurons will be different from those described here. We can only speculate as to the functional significance of prolonged IPSCs in fast-spiking interneurons. These might provide a mechanism by which the high frequency, prolonged trains of action potentials in these cells (e.g. Fig. 1Bb) would be effectively controlled during the activation of inhibitory inputs. More prolonged currents would also allow temporal summation of inhibition at lower frequencies of inhibitory input onto interneurons, perhaps promoting a tonic disinhibition within cortical circuits.
Acknowledgments
We thank I. Parada for her excellent assistance during the course of the experiments. The work was supported by NIH grants NS 12151 and NS 07280 from the National Institute of Neurological Disorders and Stroke, and the Morris and Pimley research funds.
References
- Barker JL, Harrison NL. Outward rectification of inhibitory postsynaptic currents in cultured rat hippocampal neurones. The Journal of Physiology. 1988;403:41–55. doi: 10.1113/jphysiol.1988.sp017237. [DOI] [PMC free article] [PubMed] [Google Scholar]
- Bormann J, Hamill OP, Sakmann B. Mechanism of anion permeation through channels gated by glycine and γ-aminobutyric acid in mouse cultured spinal neurones. The Journal of Physiology. 1987;385:243–286. doi: 10.1113/jphysiol.1987.sp016493. [DOI] [PMC free article] [PubMed] [Google Scholar]
- Clements JD. Transmitter timecourse in the synaptic cleft: its role in central synaptic function. Trends in Neurosciences. 1996;19:163–171. doi: 10.1016/s0166-2236(96)10024-2. [DOI] [PubMed] [Google Scholar]
- Diamond JS, Jahr CE. Asynchronous release of synaptic vesicles determines the time course of the AMPA receptor-mediated EPSC. Neuron. 1995;15:1097–1107. doi: 10.1016/0896-6273(95)90098-5. 10.1016/0896-6273(95)90098-5. [DOI] [PubMed] [Google Scholar]
- Edwards FA, Konnerth A, Sakmann B. Quantal analysis of inhibitory synaptic transmission in the dentate gyrus of rat hippocampal slices: a patch-clamp study. The Journal of Physiology. 1990;430:213–249. doi: 10.1113/jphysiol.1990.sp018289. [DOI] [PMC free article] [PubMed] [Google Scholar]
- Fritschy JM, Mohler H. GABAA-receptor heterogeneity in the adult rat brain: differential regional and cellular distribution of seven major subunits. Journal of Comparative Neurology. 1995;359:154–194. doi: 10.1002/cne.903590111. [DOI] [PubMed] [Google Scholar]
- Fritschy JM, Paysan J, Enna A, Mohler H. Switch in the expression of rat GABAA-receptor subtypes during postnatal development: an immunohistochemical study. Journal of Neuroscience. 1994;14:5302–5324. doi: 10.1523/JNEUROSCI.14-09-05302.1994. [DOI] [PMC free article] [PubMed] [Google Scholar]
- Galarreta M, Hestrin S. Analysis of inhibitory synaptic currents in pyramidal and nonpyramidal neurons of the rat visual cortex. Society of Neuroscience Abstracts. 1996;22:789. 314.7. [Google Scholar]
- Hamill OP, Bormann J, Sakmann B. Activation of multiple-conductance state chloride channels in spinal neurones by glycine and GABA. Nature. 1983;305:805–808. doi: 10.1038/305805a0. [DOI] [PubMed] [Google Scholar]
- Hollrigel GS, Soltesz I. Slow kinetics of miniature IPSCs during early postnatal development in granule cells of the dentate gyrus. Journal of Neuroscience. 1997;17:5119–5128. doi: 10.1523/JNEUROSCI.17-13-05119.1997. [DOI] [PMC free article] [PubMed] [Google Scholar]
- Horikawa K, Armstrong WE. A versatile means of intracellular labeling: injection of biocytin and its detection with avidin conjugates. Journal of Neuroscience Methods. 1988;25:1–11. doi: 10.1016/0165-0270(88)90114-8. 10.1016/0165-0270(88)90114-8. [DOI] [PubMed] [Google Scholar]
- Isaacson JS, Solis JM, Nicoll RA. Local and diffuse synaptic actions of GABA in the hippocampus. Neuron. 1993;10:165–175. doi: 10.1016/0896-6273(93)90308-e. 10.1016/0896-6273(93)90308-E. [DOI] [PubMed] [Google Scholar]
- Jones MV, Westbrook GL. Desensitized states prolong GABAA channel responses to brief agonist pulses. Neuron. 1995;15:181–191. doi: 10.1016/0896-6273(95)90075-6. 10.1016/0896-6273(95)90075-6. [DOI] [PubMed] [Google Scholar]
- Kang J, Huguenard JR, Prince DA. Single channel properties of neuronal GABAA receptors in rat nucleus reticularis thalamic (nRt) and ventrobasal relay complex (VB) Society for Neuroscience Abstracts. 1996;22:97. 46.7. [Google Scholar]
- Kawaguchi Y. Groupings of nonpyramidal and pyramidal cells with specific physiological and morphological characteristics in rat frontal cortex. Journal of Neurophysiology. 1993;69:416–431. doi: 10.1152/jn.1993.69.2.416. [DOI] [PubMed] [Google Scholar]
- Kilic G, Moran O, Cherubini E. Currents activated by GABA and their modulation by Zn2+ in cerebellar granule cells in culture. European Journal of Neuroscience. 1993;5:65–72. doi: 10.1111/j.1460-9568.1993.tb00206.x. [DOI] [PubMed] [Google Scholar]
- Kisvarday ZF, Beaulieu C, Eysel UT. Network of GABAergic large basket cells in cat visual cortex (area 18): implication for lateral disinhibition. Journal of Comparative Neurology. 1993;327:398–415. doi: 10.1002/cne.903270307. [DOI] [PubMed] [Google Scholar]
- Lester RA, Clements JD, Westbrook GL, Jahr CE. Channel kinetics determine the time course of NMDA receptor-mediated synaptic currents. Nature. 1990;346:565–567. doi: 10.1038/346565a0. 10.1038/346565a0. [DOI] [PubMed] [Google Scholar]
- Lin Y-F, Kapur J, Macdonald RL. Regulation of GABAA receptor single-channel currents by protein kinase A in acutely associated rat hippocampal dentate granule cell. Society for Neuroscience Abstracts. 1996;22:1940. 762.3. [Google Scholar]
- Luhmann HJ, Prince DA. Postnatal maturation of the GABAergic system in rat neocortex. Journal of Neurophysiology. 1991;65:247–263. doi: 10.1152/jn.1991.65.2.247. [DOI] [PubMed] [Google Scholar]
- McCormick DA, Connors BW, Lighthall JW, Prince DA. Comparative electrophysiology of pyramidal and sparsely spiny stellate neurons of the neocortex. Journal of Neurophysiology. 1985;54:782–806. doi: 10.1152/jn.1985.54.4.782. [DOI] [PubMed] [Google Scholar]
- Macdonald RL, Olsen RW. GABAA receptor channels. Annual Review of Neuroscience. 1994;17:569–602. doi: 10.1146/annurev.ne.17.030194.003033. [DOI] [PubMed] [Google Scholar]
- Macdonald RL, Rogers CJ, Twyman RE. Kinetic properties of the GABAA receptor main conductance state of mouse spinal cord neurones in culture. The Journal of Physiology. 1989;410:479–499. doi: 10.1113/jphysiol.1989.sp017545. [DOI] [PMC free article] [PubMed] [Google Scholar]
- Magistretti J, Mantegazza M, Guatteo E, Wanke E. Action potentials recorded with patch-clamp amplifiers: are they genuine? Trends in Neurosciences. 1996;19:530–534. doi: 10.1016/s0166-2236(96)40004-2. 10.1016/S0166-2236(96)40004-2. [DOI] [PubMed] [Google Scholar]
- Owens DF, Boyce LH, Davis MB, Kriegstein AR. Excitatory GABA responses in embryonic and neonatal cortical slices demonstrated by gramicidin perforated-patch recordings and calcium imaging. Journal of Neuroscience. 1996;16:6414–6423. doi: 10.1523/JNEUROSCI.16-20-06414.1996. [DOI] [PMC free article] [PubMed] [Google Scholar]
- Peters A, Jones BE. Classification of cortical neurons. In: Peters A, Jones EG, editors. Cerebral Cortex. New York: Plenum; 1984. pp. 107–121. [Google Scholar]
- Prince DA. Epileptic neurons and circuits, 1996. In: Delgado-Escueta A, Wilson W, Olsen R, Porter R, editors. Basic Mechanisms of the epilepsies. Philadelphia: Lippincott-Raven; 1997. in the Press. [Google Scholar]
- Pritchett DB, Sontheimer H, Shivers BD, Ymer S, Kettenmann H, Schofield PR, Seeburg PH. Importance of a novel GABAA receptor subunit for benzodiazepine pharmacology. Nature. 1989;338:582–585. doi: 10.1038/338582a0. 10.1038/338582a0. [DOI] [PubMed] [Google Scholar]
- Puia G, Costa E, Vicini S. Functional diversity of GABA-activated Cl− currents in Purkinje versus granule neurons in rat cerebellar slices. Neuron. 1994;12:117–126. doi: 10.1016/0896-6273(94)90157-0. 10.1016/0896-6273(94)90157-0. [DOI] [PubMed] [Google Scholar]
- Salin PA, Prince DA. Spontaneous GABAA receptor-mediated inhibitory currents in adult rat somatosensory cortex. Journal of Neurophysiology. 1996;75:1573–1588. doi: 10.1152/jn.1996.75.4.1573. [DOI] [PubMed] [Google Scholar]
- Schonrock B, Bormann J. Functional heterogeneity of hippocampal GABAA receptors. European Journal of Neuroscience. 1993;5:1042–1049. doi: 10.1111/j.1460-9568.1993.tb00957.x. [DOI] [PubMed] [Google Scholar]
- Serafini R, Valeyev AY, Barker JL, Poulter MO. Depolarizing GABA-activated Cl− channels in embryonic rat spinal and olfactory bulb cells. The Journal of Physiology. 1995;488:371–386. doi: 10.1113/jphysiol.1995.sp020973. [DOI] [PMC free article] [PubMed] [Google Scholar]
- Somogyi P, Soltesz I. Immunogold demonstration of GABA in synaptic terminals of intracellularly recorded, horseradish peroxidase-filled basket cells and clutch cells in the cat's visual cortex. Neuroscience. 1986;19:1051–1065. doi: 10.1016/0306-4522(86)90122-3. 10.1016/0306-4522(86)90122-3. [DOI] [PubMed] [Google Scholar]
- Ulrich D, Luscher HR. Miniature excitatory synaptic currents corrected for dendritic cable properties reveal quantal size and variance. Journal of Neurophysiology. 1993;69:1769–1773. doi: 10.1152/jn.1993.69.5.1769. [DOI] [PubMed] [Google Scholar]
- Vincent P, Armstrong CM, Marty A. Inhibitory synaptic currents in rat cerebellar Purkinje cells: modulation by postsynaptic depolarization. The Journal of Physiology. 1992;456:453–471. doi: 10.1113/jphysiol.1992.sp019346. [DOI] [PMC free article] [PubMed] [Google Scholar]
- Weiss DS. Membrane potential modulates the activation of GABA-gated channels. Journal of Neurophysiology. 1988;59:514–527. doi: 10.1152/jn.1988.59.2.514. [DOI] [PubMed] [Google Scholar]
- Xiang Z. Neurophysiology of mossy-fiber synapses in rat hippocampus. 1995:102–133. Ph.D. Dissertation, Yale University, USA. [Google Scholar]
- Yang J, Zorumski CF. Trifluoperazine blocks GABA-gated chloride currents in cultured chick spinal cord neurons. Journal of Neurophysiology. 1989;61:363–373. doi: 10.1152/jn.1989.61.2.363. [DOI] [PubMed] [Google Scholar]
- Zhang SJ, Huguenard JR, Prince DA. Functional differences in GABAA-mediated inhibition in nucleus reticularis thalami and somatosensory relay nuclei of the rat. Society for Neuroscience Abstracts. 1994;20:119. 55.11. [Google Scholar]
- Zhang SJ, Huguenard JR, Prince DA. GABAA receptor-mediated Cl− currents in rat thalamic reticular and relay neurons. Journal of Neurophysiology. 1997;78:2280–2286. doi: 10.1152/jn.1997.78.5.2280. [DOI] [PubMed] [Google Scholar]
- Zilles K, Wree A. Cortex: Areal and laminar structure. In: Paxinos G, editor. The Rat Nervous System. Sydney: Academic Press; 1985. pp. 375–415. [Google Scholar]