

Abstract
This study was designed to establish the basis for altered membrane excitability during the inhibition of mitochondrial metabolism in central mammalian neurons. Perforated whole-cell patch clamp and fluorimetric techniques were combined to examine changes in membrane currents, intracellular calcium ([Ca2+]i) and mitochondrial potential (ΔΨm) in neurons dissociated from the CA1 subfield of the hippocampus of young rats.
On application of the mitochondrial inhibitor NaCN, or the uncoupler carbonyl cyanide p-trifluoromethoxyphenylhydrazone (FCCP), the membrane potential hyperpolarized and membrane conductance increased. Under voltage clamp, an outward current was seen. The reversal potential of the current at −83 mV and its dependence on extracellular [K+] confirmed that this was a K+ conductance.
Simultaneous recordings of [Ca2+]i and current showed a striking correlation between a rise in [Ca2+]i and the developed outward current. Flash photolysis of the caged Ca2+ chelator, diazo-2, reversed both the rise in [Ca2+]i and the outward current. The current was reduced by 80% by charybdotoxin, was attenuated by 10 mm TEA+ but was unaffected by apamin or by the KATP channel blocker tolbutamide (400 μm−1 mm). These data suggest strongly that the current is carried by Ca2+-dependent K+ channels.
Simultaneous recordings of membrane current, ΔΨm and [Ca2+]i revealed the sequence of events in response to impaired mitochondrial function (CN, FCCP or anoxia): ΔΨm depolarized, followed rapidly by an increase in [Ca2+]i followed in turn by the outward current. [Ca2+]i and membrane current recovered only after mitochondrial repolarization.
The rise in [Ca2+]i appeared to result from an increased Ca2+ influx through voltage-gated Ca2+ channels. It was dependent on extracellular Ca2+ and was much reduced by methoxyverapamil (D600). The rate of Mn2+ quench of fura-2 fluorescence was increased by the inhibitors, and the inhibitors induced a small inward current when K+ channels were blocked that preceded the rise in [Ca2+]i. However, the increase in [Ca2+]i showed no obvious dependence on membrane potential in cells clamped at a range of holding potentials from −90 to −45 mV.
Thus, removal of oxygen, uncoupling mitochondrial oxidative phosphorylation or inhibition of respiration, all lead to mitochondrial depolarization, an increased Ca2+ influx through (voltage-gated) channels, even at hyperpolarized membrane potentials, raising [Ca2+]i which in turn drives an increased K+ conductance that modulates membrane excitability.
The functional integrity of the central nervous system (CNS) is highly dependent on the supply of metabolic fuels - oxygen and glucose. Within seconds after the onset of hypoxia, hypoglycaemia, or ischaemia, functional changes lead to confusional states, altered levels of consciousness and even to convulsions. These changes are initially reversible, but later pass a point of no return, leading to irreversible injury and cell death. Our interest in the present study is in the fundamental cellular mechanisms that underlie the earliest changes in cell function with the onset of fuel deprivation, and in the mechanisms that couple changes in cell metabolism to changes in membrane excitability. The changes that take place during this initial period largely establish the conditions that lead later to irreversible injury.
Central to understanding the early changes in anoxia is the mechanism that couples changes in metabolism to changes in excitability at the cell membrane. There are many possibilities. Classes of plasmalemmal ion channels are sensitive to subplasmalemmal [ATP], to [Ca2+]i and the activity of several classes of ion channels alters with their phosphorylation state. In this study, we have set out to characterize some of the changes in cell physiology during these early phases of anoxia. As mitochondria represent the primary site of oxygen consumption and the final site of glucose-derived carbon utilization, it seems likely that changes in mitochondrial function lie at the heart of changes in the physiology of metabolically compromised cells. We have therefore used: (i) the perforated configuration of the whole-cell patch clamp technique in order to define alterations in membrane conductances and to clamp the membrane potential without interfering with cytosolic biochemistry; (ii) microfluorimetric techniques, which permit examination of at least some of the biochemical changes taking place in the cell, and (iii) flash photolysis, which allows manipulation of cellular biochemistry. The combination of these techniques allows us to examine directly the interplay between events in the cytosol and changes in activity at the cell membrane.
In the hippocampus, CA1 pyramidal cells hyperpolarize in response to hypoxia. A number of hypotheses have been presented suggesting the basic mechanism of the hyperpolarization, but none of these has full experimental support, and much of the experimental data remain inconclusive. While the hyperpolarization is clearly driven by an increased K+ conductance (e.g. Fujiwara, Higashi, Shimoji & Yoshimura, 1987; Krnjevic & Leblond, 1989), the class of conductance is uncertain, and this similarly reflects uncertainties regarding the underlying mechanisms responsible for activation of the conductance.
In the present paper, we have addressed this issue using a preparation of neurons freshly dissociated from the CA1 area of the hippocampus. The response properties of these cells are so well characterized from work in hippocampal slices, that they make a good model system to study in isolation. An important consideration is to determine whether the changes in cell physiology are integral to the cell or whether they primarily reflect changes in the microenvironment in the CNS, which changes in many complex ways during hypoxia - a fall in pHo, a rise in [K+]o and increased release of several neurotransmitters, most notably glutamate, but also GABA and other neuroactive compounds. To this end, we have isolated the cells and asked the following questions. (i) Does the hyperpolarizing response to hypoxia reflect an intrinsic property of the cells themselves, or is it a response to changes in the local microenvironment in the tissue? (ii) What is the charge carrier for conductance changes seen in cells under these conditions? (iii) Do the properties of the conductance match those of other known currents? (iv) How does the current correlate with other biochemical changes in the cell, most notably with changes in [Ca2+]i? (v) What are the relationships between the changes in [Ca2+]i and altered mitochondrial potential? And finally, (vi) what is/are the mechanism(s) underlying changes in [Ca2+]i.
Some of these data have been presented in preliminary form (Nowicky & Duchen, 1993, 1994, 1995; Nowicky, Peuchen, Clark & Duchen, 1993).
METHODS
Cell isolation
Sprague-Dawley rats, 14-25 days old, were killed by cervical dislocation and the brains quickly removed. Transverse hippocampal slices (400 μm thick) were prepared using a tissue chopper (Sorval). The slices were allowed to recover for 1 h in a submerged holding chamber at room temperature (18-22°C). The slices were isolated and digested in isolation media and continuously oxygenated by 100 % O2 or 95 % CO2-5 % O2 and treated with either thermolysin (0.3-0.5 mg ml−1, Sigma Type X) and pronase (0.3-0.5 mg ml−1, Sigma Type XIV, or Calbiochem) for 30 min each or proteinase K (0.27 mg ml−1) for 10 min and trypsin (1 mg ml−1, Sigma Type XI) for 35 min at 32°C. The digestion was stopped by washing the slices 3-4 times with isolation saline (for composition see below). The slices were then placed back in the holding chamber and maintained for 6-8 h. To prepare isolated cells, the CA1-CA2 subfield was microdissected from two slices and dissociated in 0.5 ml of the recording media by trituration with fire-polished Pasteur pipettes; 100-250 μl of the dissociated suspension was then plated onto a glass coverslip pre-treated with Cell-Tak (Fisons) to improve adhesion of cells.
Solutions
Two isolation solutions were used: saline A (bicarbonate buffered) consisting of (mM): 110 NaCl, 4 KCl, 25 glucose, 25 NaHCO3, 2.5 CaCl2, 1.25 KH2PO4, 1.25 MgSO4, oxygenated with 95 % CO2-5 % O2, adjusted to pH 7.4; or saline B consisting of (mM): 120 NaCl, 5 KCl, 2.5 CaCl2, 1.25 MgSO4, 10 glucose, 20 Pipes oxygenated with 100 % O2 adjusted to pH 7.4. Saline C was used for recording and consisted of (mM): 145 NaCl, 5 KCl (or 3 KCl plus 1.25 KH2PO4), 10 glucose, 7.5 Hepes, 1 NaHCO3, 2.5 CaCl2, 1.25 MgCl2, adjusted to pH 7.4. When using barium or cadmium the bicarbonate was excluded, and for calcium-free solutions CaCl2 was replaced with equimolar MgCl2 to maintain divalent concentrations, with the addition of 1 mM EGTA. The osmolarity of all extracellular solutions was 300-305 mosmol l−1. For the elevated extracellular K+ solution, equimolar KCl was substituted for NaCl.
For measurements of [Ca2+]i, cells were loaded with 5 μM fura-2 or fluo-3 (Molecular Probes) in the acetoxymethyl (AM) ester forms for 30 min at room temperature. In some experiments, cells were then loaded with rhodamine (Rh) 123 (10 μg ml−1) for 10 min and then washed. In experiments involving flash photolysis, cells were loaded with both fluo-3 AM (5 μM) and diazo-2 AM (20 μM; Molecular Probes) for 30 min. To examine Mn2+ quench of fura-2, calcium was omitted and 100 mM Mn2+ added to saline C.
Experimental procedures
The coverslips were placed in a homemade recording chamber on the stage of an inverted microscope (Nikon Diaphot, with a × 40 oil immersion lens; numerical aperture, 1.3). The cells were then washed and continuously superfused with saline C at room temperature at a flow rate of 1-2 ml min−1. In most experiments, 0.6 μM tetrodotoxin (TTX) was added to block Na+ currents. Drugs were dissolved in the same saline and applied by either pressure ejection from a patch pipette placed near the cell, or by bath perfusion.
Fluorescence measurements
Fluorescence was elicited by excitation of indicators using a 75 W xenon arc lamp in combination with a filter wheel (Cairn Research Instruments Ltd, UK) spinning at 12 Hz and containing bandpass filters centred on 340, 360, 380 and 490 nm. Epifluorescence measurements were made using a photomultiplier tube (Thorn EMI) and measured at 530 nm. The intracellular calcium concentrations are indicated as standard by changes in the fura-2 ratio signal after appropriate background subtraction. No correction has been made for autofluorescence as the signals under these conditions were barely measurable. Fluo-3 and Rh 123 fluorescence are expressed as normalized percentage change from baseline fluorescence. Flash photolysis of the diazo-2 was obtained by a single UV flash (350 nm) of 120-140 W s per flash to the epifluorescence light path from a flash lamp (Strobex 38; Duchen, Farquharson, Pearce & Biscoe, 1991). Switching between the excitation light required for standard fluorescence measurement and the flash lamp was achieved using a front silvered mirror which was rapidly switched into the light path by a stepper motor. This served to divert the light source to a flash lamp positioned at 90 deg to the epifluorescence source. The triggering of the step, movement of the mirror, the flash and repositioning of the mirror was all achieved within 100 ms, and was also coupled to triggering closed of a fast electronic shutter (Uniblitz) in front of the photomultiplier tubes to protect them from the over-illumination. In cells loaded with fluo-3 alone (without diazo-2) the flash caused negligible photobleaching.
Perforated patch recordings
Electrophysiological measurements were conducted under voltage or current clamp conditions using the amphotericin B perforated patch method of Rae, Cooper, Gates & Watsky (1991). The final concentration of amphotericin B was 260 μg ml−1. The micropipettes were made from thick-walled borosilicate glass (Clark 1.5 o.d.) with resistances of 4-6 MΩ. The internal filling solution consisted of (mM): 55 KCl, 70 K2SO4, 10 Hepes, 7 MgCl2, adjusted to pH 7.3. In some experiments perforation time was decreased by addition of Pluronic F27 to a final concentration of 0.08 %. Seals of 1-5 GΩ were readily obtained and perforation was usually achieved after 5-15 min with stabilization of access resistance (RA) to < 50 MΩ, which was generally stable for up to 1 h. Any offset was nulled prior to the seal formation, and no series resistance compensation was used. The amplitudes of the currents studied was generally < 200 pA, and our typical series resistance of 25-30 MΩ would give rise to a maximum voltage clamp error of 5-6 mV. Uncorrected resting potentials were typically -50 mV in current clamp mode, with overshooting spontaneous action potentials. Recordings were made using a List EPC 7 patch clamp amplifier, and data were digitized using the pCLAMP (Axon instruments) acquisition hardware and software on a PC. Simultaneous fluorescence and electrophysiological data were collected either using Labtech notebook software and the Labmaster (Scientific Solutions) TL-1 A/D board sampling at 10 Hz, or recorded to videotape for later off-line analysis.
Changing extracellular ionic concentration
The ionic activity of K+ in extracellular solutions made up with elevated [K+], was determined by measuring the osmolarity of solutions of potassium salts made up at a range of concentrations. The deviation from predicted osmolarity gave the correction factors for the non-dissociating fraction of the solution, and allowed the calculation of ionic activity. The activity of K+ in the internal recording solution used in these experiments was 126.5 mM (55 mM KCl, 70 mM K2S04 solution), and for the extracellular KCl solutions K+ activity was: 4 for the 5 mM, 37 for the 40 mM, 74 for the 80 mM, and 130 for the 140 mM. Anoxia was achieved by bubbling the superfusate with 100 % nitrogen with the addition of 500 mM Na2S2O4. Gas impermeant plastic and medical grade stainless steel were used to maintain a low PO2 in the perfusion line. PO2 was monitored close to the cell using a carbonfibre microelectrode held at a potential of -600 mV (Mojet, Mills & Duchen, 1995) and controlled by a home-built patch clamp amplifier.
Chemicals
All drugs and enzymes were obtained from Sigma or Calbiochem, and all fluorescent probes were obtained from Molecular Probes. Lipophilic drugs were made up as stock solutions at 1000-fold the desired concentration in DMSO and diluted to final a concentration with recording media, leaving a final DMSO concentration of 0.1 %. All drugs were prepared in their final dilutions in the standard saline and pH adjusted appropriately.
Analysis
All comparisons were made on averaged and normalized responses, and statistical significance was determined using ANOVA.
RESULTS
The data presented in this paper were obtained from over 100 cells. Visual identification and location of the subregion of hippocampus ensured that the majority of cells used were CA1 pyramidal neurons. Most cells had a prominent apical dendrite 50-100 μm in length, and many had smaller basal dendritic remnants.
When recording fura-2 fluorescence, most cells showed spontaneous transient activity which was suppressed by TTX, and in perforated patch clamp recordings in current clamp mode, most cells exhibited spontaneous action potentials (Fig. 1A) that were not readily clamped, and so the experiments described below were conducted in the presence of TTX (0.6 μM).
Figure 1. Effects of FCCP on the electrophysiological properties of CA1 hippocampal neurons.

A, under current clamp control, many cells exhibited spontaneous action potential activity. A brief application of 1 μM FCCP (filled bar) from a pressure pipette near the soma resulted in a small hyperpolarization and stopped the spontaneous activity (membrane potential, -68 mV). B, when action potentials were blocked using TTX, 1 μM FCCP (filled bar) produced a hyperpolarization lasting a few minutes associated with a decreased input resistance. C, under voltage clamp control (holding potential (Vh), -50 mV; steps to -40 mV), 1 μM FCCP application (filled bar) caused a reversible outward current and increased membrane conductance.
Effect of impaired mitochondrial metabolism on membrane properties
Responses to brief (2-3 min) application of 2 mM NaCN by bath perfusion or pressure ejection, application of 1 μM p-trifluoromethoxyphenylhydrazone (FCCP) or exposure to an anoxic saline had similar and reversible effects in terms of all variables measured. In general, as drug application is far easier to control than oxygen tension, 2 mM NaCN and 1 μM FCCP were used for the majority of experiments. In whole-cell (perforated mode) current clamp conditions, the plasma membrane potential hyperpolarized in response to both drugs, and spontaneous electrical activity was silenced (Fig. 1A). The membrane hyperpolarization was accompanied by a decrease in input resistance, most readily seen when spontaneous activity was blocked with TTX (Fig. 1B). In a small number of experiments, during the washout of the drug, a secondary hyperpolarization was observed (as previously described by Fujiwara et al. 1987; not shown). The responses were fully reversible. Metabolic inhibition with FCCP caused a hyperpolarization of 6.7 ± 3.4 mV (n= 7), while CN hyperpolarized the cells by 12.6 ± 2.5 mV (n= 8), and in those cells in which input resistance was measured, it fell by 37 ± 10 % in response to FCCP (n= 4) and by 27.6 ± 4.7 % in response to CN (overall mean, 31.7 ± 5.0 %; n= 9). In neither case was the difference between FCCP and CN significantly different (ANOVA).
Under voltage clamp conditions, the response to impaired mitochondrial metabolism was seen as an outward current most clearly at holding potentials more positive than -50 mV. Again, small hyperpolarizing or depolarizing voltage commands revealed an increased conductance associated with the current (Fig. 1C), showing that this does not represent, for example, suppression of an inward current.
Properties of the outward current following metabolic inhibition
The main charge carrier of the metabolic current
The voltage dependence of the current was examined using a series of voltage ramps from -40 to -120 mV at a rate of 150 mV s−1. These are shown in Fig. 2 for both NaCN (Fig. 2A and B) and FCCP (Fig. 2C and D). In each case, the resting membrane potential hyperpolarized - note the negative shift in zero current potential. The current-voltage relationship was practically linear over the ranges tested. The difference currents (Fig. 2B and D) were obtained from an average of the control responses and those obtained at the peak of the responses. The mean reversal potential for the current elicited by NaCN was -80.1 ± 2.4 mV (n= 12), and the peak outward current was 103.3 ± 17.4 pA (n= 20), while the mean reversal potential for the response to FCCP was -86.0 ± 2.1 mV (n= 8), and the peak outward current observed at -50 mV was 103 ± 20.2 pA (n= 21). I-V curves examined during anoxia showed an outward current which reversed at -87 ± 1.5 mV (n= 3). No significant difference was observed for the responses to FCCP or NaCN. The mean macroscopic conductance over the most linear range of the I-V relationships was between 2 and 3 nS.
Figure 2. Metabolic inhibition induces a K+ current.
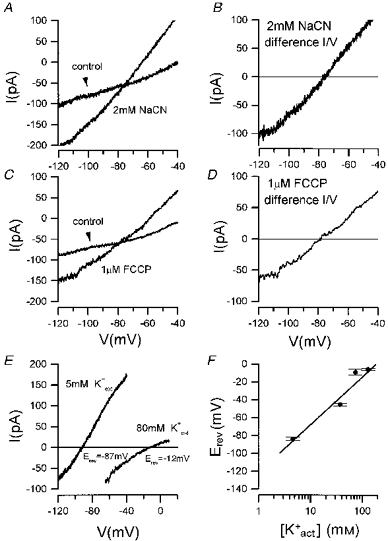
Under voltage clamp control, I-V responses were obtained from the responses to voltage ramps applied from -120 to -40 mV at 30 s intervals before and during the application of metabolic inhibitors. A,I-V responses before (control) and at the peak of the response to 2 mM NaCN. B, subtraction of the control response from that in the presence of CN, the difference I-V curve, shows the I-V relation of the CN induced current, which reversed (Erev) at -79 mV. In C and D, the same procedures were applied to examine the I-V relation of the current induced by FCCP (1 μM) giving a reversal potential in this example of -81 mV. E and F show the effect of varying extracellular K+ (K+ext) concentration on the reversal potential (Erev) of the FCCP induced current. E, the I-V relation of the FCCP induced current for a neuron in the presence of 5 mM and 80 mM extracellular K+ (the voltage ramp in this instance ran from -65 to +10 mV). The Erev shifted from -90 to -11 mV. F, log-linear plot of extracellular K+ activities ([K+act]) versus group mean Erev (±s.e.m.) indicates a linear relationship. The slope of the regression line determined for the mean Erev over this range of K+ activities was 56.05 mV (r= 0.975, s.d.= 9.91 mV, n= 4).
As the reversal potential was close to the calculated reversal potential for K+, it seems likely that the current was carried by K+. The other main candidate as charge carrier for such a conductance is chloride, but this is excluded as the Cl− current induced by GABA at a potential of -50 mV was inward (n= 6 cells) in these cells under these recording conditions, with a reversal potential of -28 mV, reflecting the slow equilibration of Cl− ions through the amphotericin channels (Horn & Marty, 1985). The role of K+ as charge carrier was explored further by systematically changing extracellular [K+]. A comparison of the shift in the reversal potential when the extracellular K+ was raised from 5 to 80 mM is shown in Fig. 2E. The reversal potentials shifted from -87 to -12 mV in the same cell. The pooled data are shown in Fig. 2F, in which the reversal potential of the current is plotted as a function of the extracellular K+ ionic activity. The slope of the best fit regression line was 56.05 mV for a 10-fold increase in the extracellular K+ concentration, close to the theoretical slope value of 58 mV, confirming that K+ was the main charge carrier of the outward current.
These data show that the increased K+ conductance (gK) documented in response to anoxia or metabolic inhibition in hippocampal cells within slice preparations, is intrinsic to the pyramidal cells, and unlikely to reflect responses to a change in the local microenvironment (e.g. due to release of putative transmitters, of pHo or of changes in ionic composition in the extracellular space). The two likely candidates for this conductance are a calcium-dependent K+ conductance (gK(Ca)) reflecting a rise in [Ca2+]i (e.g. see Duchen, 1990; Duchen, Valdeolmillos, O'Neill & Eisner, 1990; Kaplin, Snyder and Linden, 1996) or a K(ATP) conductance reflecting the opening of channels normally kept closed by ATP, which therefore open as [ATP] falls (for a review see Ashcroft, 1990). Published data attempting to differentiate between these in brain slice preparations have proven contradictory (e.g. Fujiwara et al. 1987; Krnjevic & Leblond, 1989; Knopfel, Spuler, Grafe, & Gahwiler, 1990; Harata, Wu, Ishibashi, Ono & Akaike, 1997).
Calcium dependence of the outward current
In order to assess the role of [Ca2+]i and its relationship to the current, we made simultaneous recordings of membrane current and [Ca2+]i (Fig. 3A). We have chosen to illustrate this using a record obtained with the single wavelength indicator fluo-3 as we have used this indicator for other reasons given below. In all cases [Ca2+]i invariably rose in response to anoxia, NaCN and FCCP, and in each case there was a remarkably clear and consistent temporal relationship between the [Ca2+]i response and the current which is equally apparent in several figures shown below. It is perhaps seen most clearly in Fig. 3B in which the current is plotted as a function of [Ca2+]i. It should be clear that the [Ca2+]i rose first, followed by the development of the current as [Ca2+]i rose above a threshold, and this relationship was seen in all cells studied.
Figure 3. Relationship between metabolic inhibitory current and [Ca2+]i.
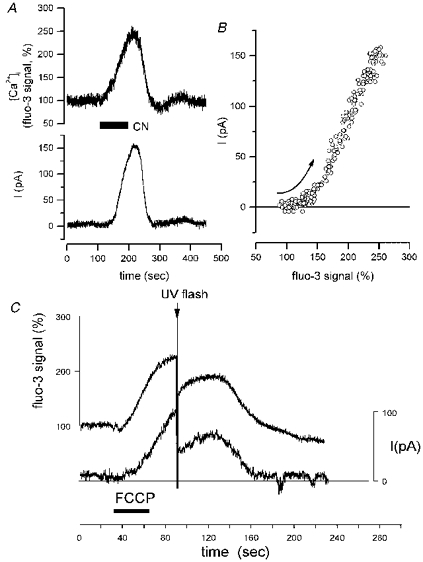
A, simultaneous recording of fluo-3 fluorescence signal (upper trace) and whole-cell current (lower trace) following application of 2 mM NaCN. The time course of the current clearly closely follows the change in [Ca2+]i. B, plot of the data from A showing the onset of the outward current (from 0 to 220 s) plotted as a function of fluo-3 fluorescence change shows that the [Ca2+]i rose slightly ahead of the current, which then followed an almost linear relationship to rising [Ca2+]i. C, this cell was co-loaded with fluo-3 and diazo-2. At the peak of the response to 1 μM FCCP, flash photolysis of the diazo-2 reduced both the [Ca2+]i and the current. (Vh for both experiments was -50 mV).
The close temporal relationship, while striking, does not necessarily confirm causality however: both current and [Ca2+]i could be reflecting some other process, such as ATP depletion. We therefore examined changes in the current upon manipulation of [Ca2+]i. Figure 3C shows the effect of activation of the calcium chelator diazo-2 by flash photolysis at the peak of the outward current. In these experiments, it was essential to use the longer wavelength indicator fluo-3 to monitor [Ca2+]i as UV illumination required to excite fura-2 fluorescence would also photolyse the cage. Flash photolysis of the caged buffer reduced the fluo-3 signal by 77.1 ± 7.5 % and the amplitude of the outward current by 69.4 ± 6.7 % (n= 12; Fig. 3C). The reduction of the fluo-3 signal did not simply reflect dye bleaching, as an equivalent flash caused barely measurable changes in the fluorescence signal in cells loaded only with fluo-3 without diazo-2 (mean reduction of 1.7 ± 0.6 %; n= 9). Flash release of diazo-2 under conditions in which the K+ conductance was not activated (n= 8) caused no measurable change in current.
Effect of pharmacological blockade
These experiments seem unequivocally to identify the current as carried by K(Ca) channels. Several classes of such channels have been described with distinct pharmacological profiles. BaCl2 (2 mM) which inhibits Ca2+-dependent K+ currents among other K+ currents, has been reported to reduce anoxia-induced outward current in brain slices (Zhu & Krnjevic, 1997) and also reduced the current induced by NaCN by 78.3 %± 12.2 (n= 3). The current was reduced by 73.3 ± 15 % by 10 mM TEA+ (Table 1), was not significantly reduced by 200 nM apamin, which blocks small conductance K(Ca) channels, but was much attenuated (80 ± 4.6 %) by 250 nM charybdotoxin (CTX). Figure 4A shows that CTX applied before the full development of the outward current had a negligible effect on the membrane current. However, application of CTX at the peak of the response reduced the current back towards resting current levels with a clear reduction in conductance, while, as expected, the toxin had no effect on [Ca2+]i.
Table 1.
Suppression of metabolic inhibitory current
| Treatment | Mean suppression (%) | N |
|---|---|---|
| 0 Ca2+−1 mM EGTA | 101.5 ± 4.5 | 4 |
| 250 nM charybdotoxin | 80.0 ± 4.6 | 9 |
| 2 mM BaCl2 | 78.3 ± 12.2 | 3 |
| diazo-2 flash photolysis | 69.4 ± 6.7 | 12 |
| 400 μM CdCl2 | 35.0 ± 15.2 | 3 |
| 10 mM TEA | 73.3 ± 15.7 | 5 |
| 200 nM apamin | 2.6 ± 2.1 | 4 |
| 400 μM and 1 mM tolbutamide | −11.2 ± 16.7 | 9 |
Figure 4. Pharmacology of the outward current.

A, action of charybdotoxin (CTX, 250 nM). Simultaneous recording of whole-cell current (Vh, -50 mV; conductance changes monitored with voltage steps to -70 mV) and [Ca2+]i (fura-2 fluorescence, lower trace). Application of 2 mM NaCN (open bar) raised [Ca2+]i and elicited an outward current. CTX applied by pressure ejection (indicated by filled bar) had little effect when applied prior to the development of the outward current, but markedly reduced the outward current when applied at its peak, reducing the conductance from 10 to 6 nS, while having no effect on [Ca2+]i.B, failure of 400 μM tolbutamide to block metabolic inhibitory outward current. Application of 2 mM NaCN (filled bars) produced a reversible outward peak current of 73 pA, and an increase in conductance seen in response to current ramps. Perfusion of 400 μM tolbutamide (open bar) had no effect on a subsequent response to CN.
As others have suggested that the anoxic hyperpolarization of hippocampal cells involves activation of KATP channels, it seemed important to test the action of the KATP channel antagonist tolbutamide as well as the above. This also serves to confirm the specificity of these findings, and to determine whether or not the current represented the activation of mixed classes of conductances. However, tolbutamide at 400 μM (n= 3; Fig. 4B and Table 1) had no significant effect on the current and even increasing the concentration to 1 mM still had no detectable effect on the current (n= 6).
Relationship between changes in mitochondrial potential and [Ca2+]i
As it seems clear that the primary electrophysiological effect of metabolic inhibition is the activation of a calcium-dependent K+ current, we have sought to define the basis for the rise in [Ca2+]i and its relationship to changing mitOchondrial function more clearly. In order to correlate changes in membrane properties with changes in mitochondrial function and [Ca2+]i, cells were dual loaded with the calcium indicator fura-2 and with Rh 123 to report mitochondrial potential (ΔΨm; e.g. see Duchen, 1992). The potential-dependent concentration of Rh 123 within mitochondria produces a quench of fluorescence which is relieved by redistribution of the dye as mitochondria depolarize: an increase in Rh 123 signal therefore signals mitochondrial depolarization. Simultaneous measurements of these fluorescence signals with membrane potential in current clamp or with membrane current under voltage clamp showed a characteristic sequential response of the three variables in response to inhibition of respiration with NaCN, or uncoupling with FCCP. Mitochondrial depolarization invariably preceded a rise in [Ca2+]i (Fig. 5) which was then followed, as shown above, by a change in membrane conductance.
Figure 5. Effects of FCCP (A), CN (B) and anoxia (C), on mitochondrial membrane potential and [Ca2+]i.
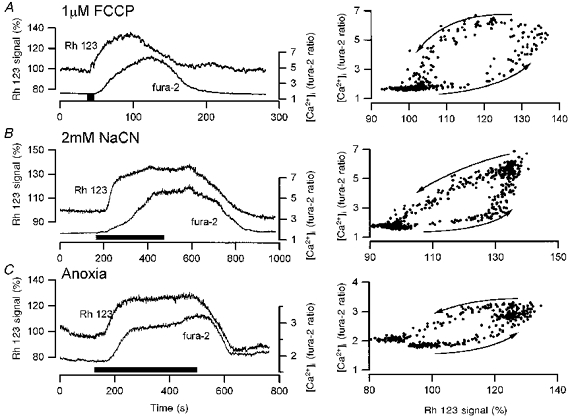
To the left, cells were dual loaded with 10 μg ml−1 Rh 123 and 5 μM fura-2 to allow examination of the temporal relationships between changing ΔΨm and [Ca2+]i, respectively. To the right in each case is shown a plot of the change in [Ca2+]i as a function of changing ΔΨm. Note that in each case, mitochondrial depolarization preceded the rise in [Ca2+]i and mitochondrial repolarization preceded recovery of [Ca2+]i.
If [Ca2+]i is plotted as a function of ΔΨm the temporal relationship perhaps becomes clearer, seen as a hysteresis. Thus, only when depolarization of ΔΨm reached a critical level did [Ca2+]i start to rise. The [Ca2+]i then continued to rise toward a plateau while the Rh 123 signal stayed constant. [Ca2+]i stayed high until ΔΨm was almost completely restored, and only then did the [Ca2+]i recover. The relationship between the rise in [Ca2+]i and the change in membrane current was shown above in Fig. 3: the [Ca2+]i rose first, and only above a threshold level did the membrane current begin to change. Similar relationships were defined under voltage clamp control in response to each of FCCP, NaCN and anoxia (Fig. 5). The magnitude of the mitochondrial depolarization was difficult to quantify but the mitochondrial reagents raised [Ca2+]i by about 400 to 500 nM.
Route(s) of calcium entry
These observations raise the issue of the origin of the rise in [Ca2+]i. Evidence has been presented suggesting a major role for internal calcium stores in generating the anoxic response in sensory neurons (Duchen et al. 1990) and in cerebellar Purkinje cells (Kaplin et al. 1996). However, in the present study, removal of extracellular calcium dramatically attenuated both the [Ca2+]i and current responses to both CN and FCCP. Thus, in unclamped cells (Fig. 6A) removal of extracellular calcium rapidly reduced cytosolic Ca2+ and in cells under voltage clamp at a holding potential of -50 mV (Fig. 6B), removal of extracellular Ca2+ reduced both the resting outward current and [Ca2+]i. Application of FCCP or CN in the absence of extracellular Ca2+produced only a very small or no change in [Ca2+]i (Fig. 6A) and no outward current (Fig. 6B). Overall, removal of extracellular calcium reduced the increase in [Ca2+]i to NaCN (n= 5) and to FCCP (n= 8) from an increase of 138.7 ± 28.0 % to just 32.4 ± 10.5 % (P= 0.002; Fig. 6A and B). This further confirms the Ca2+ dependence of the K+ current, but also suggests that the rise in [Ca2+]i reflects a Ca2+ influx rather than release from internal stores (cf. Duchen et al. 1990; Kaplin et al. 1996).
Figure 6. The change in [Ca2+]i and the outward current induced by mitochondrial inhibition are both dependent on extracellular calcium.

A,[Ca2+]i recorded from an unclamped cell using 5 μM fura-2. NaCN (2 mM) raised [Ca2+]i as expected. On switching to a calcium-free superfusate, the resting [Ca2+]i fell slightly, but subsequent application of 2 mM CN had almost no effect at all. B, simultaneous recording of fura-2 ratio (upper trace) and current (lower trace) under voltage clamp control. Application of 1 μM FCCP (filled bars) produced a rise in [Ca2+]i and an outward current as expected. On switching to a calcium-free saline including 1 mM EGTA (open bar) there was a reduction in both [Ca2+]i and in the resting current. Subsequent application of 1 μM FCCP produced neither an increase in fura-2 ratio nor an outward current.
As these data show that both current and [Ca2+]i responses were dependent on the presence of extracellular Ca2+, we therefore attempted to define the route of Ca2+ entry. As a potential route of entry is through voltage-gated Ca2+ channels, we tested the relatively non-selective Ca2+ channel blocker D600. A concentration of 400 μM D600, which effectively attenuated the response to K+-induced depolarization, was selected (Fig. 7A). The D600 occasionally reduced the resting [Ca2+]i, but the response to FCCP was significantly suppressed by co-application of D600 from an increase by 109.7 ± 12.5 % to just 28.74 ± 12.4 % (n= 11), (P= 0.029; Fig. 7B).
Figure 7. Impaired mitochondrial function is associated with increased calcium influx.
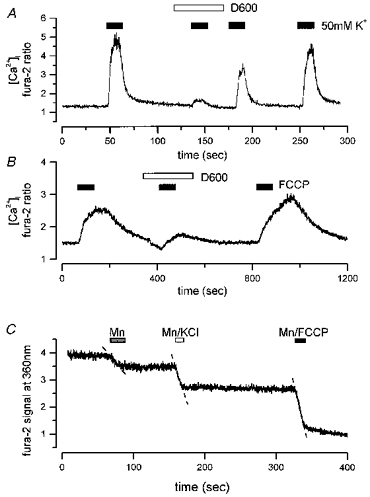
A, a concentration of 400 μM D600, which effectively blocked the rise in [Ca2+]i in response to 50 mM KCl, was applied briefly by pressure ejection close to the cell. The response to depolarization was almost completely abolished by the D600 and recovered gradually after washout. B, D600 also greatly reduced the rise in [Ca2+]i in response to application of 1 μM FCCP (filled bars). This response was also clearly reversible. C, Mn2+ quench of fluorescence signal (shown in arbitrary units) at the isosbestic point of fura-2 excitation close to 360 nm was monitored in a neuron upon application by pressure ejection of 100 μM MnCl2, then of 50 mM KCl-100 μM MnCl2, and 1 μM FCCP-100 μM MnCl2. All three applications quenched the F360 signal to some degree indicating calcium influx at rest, in response to K+ induced depolarization and in response to FCCP. Linear regression lines shown as dashed lines were fitted to determine the rate of quench. Basal rate of quench (Mn2+ alone) was 0.022 units s−1, for K+ induced depolarization it was 0.080 units s−1, for FCCP it was 0.10 units s−1. For each the correlation coefficient was 0.96 to ≈0.99.
Mn2+ quench
The dependence of the [Ca2+]i increase on extracellular calcium and an influx pathway through plasmalemmal channels could reflect the operation of two mechanisms that effectively alter the balance between influx and efflux pathways in the cell. A rise in [Ca2+]i could result from impaired extrusion in the face of a constant leak influx pathway following the inhibition of mitochondrial metabolism. Alternatively, metabolic inhibition could somehow modulate the activity of calcium channels, leading to an increase in influx. To differentiate between these, we examined the quench of fura-2 fluorescence by Mn2+ at 360 nm, the isosbestic excitation wavelength for fura-2. An increased influx would be reflected by an increased rate of quench, while impaired extrusion or sequestration would be seen as a constant rate of quench. Responses to saline solutions which were calcium free with the addition of 100 μM MnCl2 alone, 100 μM MnCl2 plus 50 mM KCl, or with 100 μM MnCl2 plus 1 μM FCCP were compared (Fig. 7C). Mn2+ could not be used with CN as the Mn2+ precipitated.
Application of Mn2+ alone caused a small but significant rate of quench, suggesting a constitutive leak pathway or spontaneous electrical activity (Fig. 7C). Thus it was necessary to conduct experiments so that the cells were always first exposed to Mn2+ alone, then either Mn2+ plus KCl or Mn2+ with FCCP. A linear regression line fitted to the initial slope in the presence of Mn2+ alone gave an index of the resting rate of influx with a slope of 0.013 ± 0.044 units s−1(n= 8). During a K+-induced depolarization in the presence of Mn2+, the linear regression gave a rate of quench of 0.10 ± 0.02 units s−1, (n= 4). FCCP caused a significant increase in the rate of Mn2+ quench, with a slope given by the linear regression equation of 0.052 ± 0.017 units s−1(n= 8), a significant difference (by ANOVA) of P= 0.01.
A calcium influx pathway?
These data thus strongly suggest that inhibition of mitochondrial metabolism is associated with an increased Ca2+ influx, possibly through voltage-gated calcium channels, although this may still be associated with impaired - or reset - extrusion mechanisms. Since we have established that the membrane potential hyperpolarizes during these manipulations, the activation of this pathway is clearly not achieved by a change in voltage. One possibility is that changes in cellular biochemistry associated with altered mitochondrial metabolism shift the activation curve of calcium channels in the negative direction, so that significant numbers of channels open at resting potentials.
When K+ channels were blocked using caesium and TEA+ in the pipette filling solutions, NaCN caused a small but consistent inward current under voltage clamp (mean -65.5 ± 14.7 pA, at a holding potential of -70 mV, n= 8). This correlated well with a slow rise in [Ca2+]i in voltage clamped cells. The mean delay between the onset of the inward current and the rise in [Ca2+]i was 8 ± 11 s (n= 5), i.e. the delay in the two variables was not significantly different (Fig. 8B).
Figure 8. Mitochondrial inhibition induces an inward current when K+ channels are blocked.
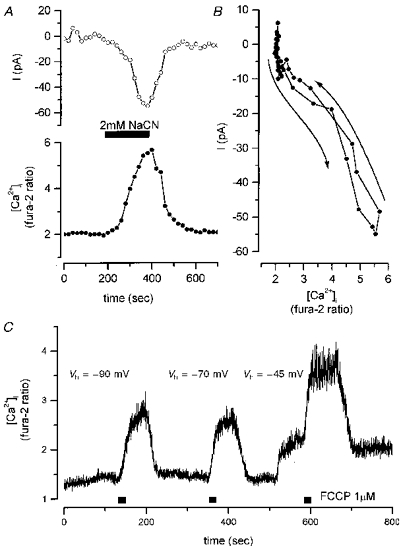
Whole-cell perforated voltage clamp recording (Vh, -70 mV) using CsS04-CsCl-TEA internal pipette filling solution to block K+ currents was combined with the measurement of [Ca2+]i using fura-2. A, the current was measured at 30 s intervals. Application of 2 mM NaCN resulted in both a rise [Ca2+]i and an inward current with a peak amplitude of -50 pA. B, the current is plotted as a function of the changing fura-2 ratio, showing that, in this case, the current slightly preceded the onset of the change in [Ca2+]i. C, the rise in [Ca2+]i in response to mitochondrial inhibition is independent of holding potential. 1 μM FCCP was applied to a cell loaded with fura-2 and with the potential clamped at -90, -70 and -45 mV as indicated. At all voltages tested, FCCP induced a remarkably similar increase in [Ca2+]i.
Effect of holding potential on the rise in [Ca2+]i
If the Ca2+ influx pathway represents a negative shift in the activation curve of voltage-gated calcium channels, then one would anticipate that the change in [Ca2+]i should show a significant voltage dependence, decreasing in amplitude with membrane hyperpolarization. If the influx pathway involves an alternative, voltage-insensitive pathway, then hyperpolarization of the membrane potential might be expected to increase the amplitude of the response as the driving force for Ca2+ influx is increased. Figure 8C shows the effects of varying the holding voltage on the amplitude of the change in [Ca2+]i following application of FCCP. In the event, the magnitude of the changes in [Ca2+]i were approximately the same for holding potentials of -90 to -45 mV. At potentials more positive than this, some activation of voltage-sensitive calcium channels is expected, and this was seen as an increase in the resting [Ca2+]i.
DISCUSSION
That many neurons, including CA1 pyramidal cells of the hippocampus, hyperpolarize during hypoxia or in response to metabolic inhibition has been known for many years (Eccles, Loyning & Oshima, 1966; Godfraind, Kawamura, Krnjevic & Pumain, 1971; Hansen, Hounsgaard & Jahnsen, 1982). It seems rather surprising then that the basic cellular mechanism remains uncertain. One possibility is that the cells respond to changes in the microenvironment within the complex structure of the CNS, to the release of adenosine, the release of glutamate acting at metabotropic glutamate receptors, to biochemical changes in the extracellular space and so on. Alternatively, the response may be intrinsic to the cells. In this study, we have removed the complexity of the local environment by isolating the cells in an attempt to identify those components of the cellular response that are fundamental to the cell itself, and have seen responses which are not notably different from those seen in vivo or in brain slices, strongly suggesting that the dominant response reflects intrinsic response properties of the hippocampal neurons themselves. Perhaps, realistically, in the final analysis the responses of the cells in the in vivo situation are likely to represent a composite of both intrinsic responses and responses to extracellular signals.
The nature of the K+ conductance
The functional response of the cells to mitochondrial inhibition, mitochondrial uncouplers and to anoxia is the development of an outward K+ conductance. Similar responses have been described to glucose deprivation (Knopfel et al. 1990; Nakashima, Ishibashi, Harata & Akaike, 1996). One obvious candidate for the conductance mediating this response has for some years been the ATP-dependent K+ channel (KATP channel; see Fujiwara et al. 1987). There is evidence for the expression of these channels in the hippocampus and more widely in the CNS (e.g. Bernardi, Fosset & Lazdunski, 1988; Zini, Tremblay, Pollard, Moreau & Ben-Ari, 1993). Nevertheless, the literature concerning possible roles for KATP channels in the hypoxic hyperpolarization of CA1 neurons is confusing: some studies have suggested that these channels must be involved, based largely on the sensitivity to sulphonylureas (Fujiwara et al. 1987; Grigg & Anderson, 1989; Godfraind & Krnjevic, 1993), while it is also apparent that in some studies sulphonylureas had no effects, which even lead to the proposal that there must be sulphonylurea-insensitive KATP channels (e.g. Knopfel et al. 1990). This becomes even more confusing as it has recently become clear that sulphonylureas may be ineffective as KATP channel antagonists following KATP channel opening by metabolic inhibitors (Findlay, 1993). As sulphonylureas also modulate a number of other currents in these neurons (Crepel, Krnjevic & Ben-Ari, 1993; Erdemli & Krnjevic, 1994), the pharmacology appears altogether unreliable. Clearly, in our hands, tolbutamide had no effect on the outward current induced by metabolic inhibition, even at high concentrations. Indeed, we have found no evidence for the functional expression of KATP channels in these cells in this study, while the experiments described here would seem to identify the conductance as unequivocally as possible as a K(Ca) conductance, especially as we have avoided a reliance on the specificity of the pharmacological tools.
We have shown that cyanide, FCCP and anoxia are all associated with a similar rise in [Ca2+]i and that an outward current with similar properties for each stimulus invariably follows closely on the increase in intracellular Ca2+. The temptation was simply to assume that the current must therefore be a Ca2+-dependent K+ current, but, while the association was striking, this still did not prove causality. For us, the most compelling experiments are those in which [Ca2+]i was reduced using flash photolysis of diazo-2 which showed a consistent reduction in both Ca2+ and current. If the current were not Ca2+ dependent, there is no reason why the current should have followed the Ca2+ so closely. Further evidence comes from the clear dependence on extracellular Ca2+ and from the striking reduction in the current by charybdotoxin.
Few direct measurements have been made to correlate changes in electrophysiology with changes in [Ca2+]i during anoxia or metabolic inhibition. Knopfel et al. (1990) used hippocampal explants to correlate changes in membrane currents to changes in [Ca2+]i in response to glucose deprivation, which is also associated with the development of an outward K+ current. These authors found that the outward current often preceded the rise in [Ca2+]i and therefore concluded that a rise in [Ca2+]i could not account for the current. This is clearly not the case in our model, and it seems possible that the relative complexity of the explant structure complicated the fluorescence measurements in those experiments. Certainly, in our own experiments the correlations between current and [Ca2+]i have proved remarkably consistent, with the rise in [Ca2+]i invariably preceding the current, and the current otherwise following remarkably closely on changes in [Ca2+]i. A similar finding has been published by Harata et al. (1997) while the present paper was in preparation, also showing a strong correlation between a rise in [Ca2+]i and outward current in CA1 neurons in response to hypoxia combined with glucose deprivation.
Basis for the rise in [Ca2+]i
Put together, the observations described above suggest that the principal driving force for the change in electrophysiology is the change in [Ca2+]i, and so we have continued our efforts to understand the basis for the rise in [Ca2+]i. This response has proved less easy to understand. Three mechanisms are suggested: (i) the release of Ca2+ from an internal pool - endoplasmic reticulum or mitochondria; (ii) impaired Ca2+ homeostasis in the face of a constant Ca2+ influx, failure of Ca2+-ATPases etc., leading to a net accumulation of Ca2+, and (iii) an increased Ca2+ influx. While it might once have been tempting to propose that a rise in [Ca2+]i related to mitochondrial depolarization is likely to reflect release of mitochondrial Ca2+, it seems clear that the bulk of the response in these cells under these conditions is related to an increased rate of influx, and not to release from an internally sequestered pool. Thus, the [Ca2+]i response or the K+ conductance (which can be used as an indirect assay of [Ca2+]i) were largely dependent on extracellular Ca2+, were reduced by cadmium and by D600 and were associated with an increased rate of Mn2+ quench. Also in support of this interpretation is the small inward current associated with the rise in [Ca2+]i seen in cells in which K+ currents were blocked. Thus, the key question seems to become what is it that drives the increased Ca2+ influx? This is where our current experimental work ends and where speculation must begin.
There are a number of possible avenues requiring exploration. One of the most obvious features of the experiments reported here is that the rise in [Ca2+]i persisted when the cell membrane potential was clamped, and in current clamp experiments while the membrane potential hyperpolarized. So clearly the rise in [Ca2+]i cannot be driven by potential-dependent activation of voltage-gated Ca2+ channels. It also seems clear that the rise in [Ca2+]i does not simply reflect a failure of ionic homeostasis as ATP levels run down, perhaps in the face of a constant leak of Ca2+. Firstly, one would expect such a phenomenon to be associated with an exponential or monotonic increase in [Ca2+]i (in the absence of any effective mechanism to limit the rise in [Ca2+]i), while what was routinely seen was an increase towards a new steady state. Furthermore, we have shown here that there was a clear increase in the rate of Mn2+ quench and therefore, presumably, an increase in the rate of Ca2+ influx. One possibility might be a shift in the voltage activation curve for Ca2+ channels in the hyperpolarizing direction. This was seen in sensory neurons in response to cyanide (Duchen, 1990), and could provide a mechanism for an increased influx so long as the membrane potential of the cell remains within the new range of activation of the current. While such a process may contribute to the responses seen here, it seems unlikely to account fully for the response, as we have seen only minimal voltage sensitivity of the rise in [Ca2+]i under voltage clamp. For example, the rise in [Ca2+]i was very similar at -90 mV to that at -70 mV (see Fig. 8), and it is most unlikely that the same Ca2+ influx would be seen at such disparate potentials through a voltage-gated channel, even allowing for some voltage clamp errors due to the relatively high resistance of the perforated patch configuration.
We and others have tended previously to stress the importance of internal Ca2+ stores as a source of a Ca2+ increase in models of hypoxia (Duchen et al. 1990; Kaplin et al. 1996; Belousov, Godfraind & Krnjevic, 1995). Thus, Krnjevic & Xu (1989) showed that dantrolene sodium, which is thought to inhibit release of ER Ca2+ from ryanodine-sensitive stores, blocked the anoxic hyperpolarization. More recent work from the same group. suggests that the effect of dantrolene may in fact be rather more complex, and that dantrolene may have the direct actions of a Ca2+-activated K+ conductance in CA1 cells (Krnjevic & Xu, 1996), and so these experiments become more difficult to interpret. Indeed, perhaps this highlights one of the major problems in the history of this field, which has depended so heavily on the application of pharmacological agents that have turned out to have non-specific or alternative and unwanted actions. Numerous other models have been proposed. It has been suggested that the response may reflect activation of metabotropic glutamate receptors, although this has been discounted by Erdemli & Krnjevic (1996). Most interestingly, Kaplin et al. (1996) have shown that a rise in cytosolic NADH generated by glycolysis during application of cyanide may promote the release of ER Ca2+ stores in cerebellar Purkinje cells. While those data were most convincing, it is also clear that in the present experiments the bulk of the response that we have described reflects Ca2+ influx. Indeed, in the absence of extracellular Ca2+, while we have seen responses, they have invariably been extremely small. We have looked for responses to ER Ca2+ release in the freshly dissociated cells, for example, to acetylcholine (which mobilizes internal Ca2+ through the activation of muscarinic receptors in these cells) and to thapsigargin, but these have always been extremely small and inconsistent. Perhaps the fact that cerebellar Purkinje cells are more richly endowed with IP3-sensitive Ca2+ stores than most other neurons contributed to the observations of Kaplin et al. (1996). A further argument against a role for cytosolic NADH in generating this response is that the rise in NADH is contingent on upregulation of glycolysis, and was abolished in the experiments of Kaplin et al. (1996) by removal of glucose. However, glucose deprivation (Nakashima et al. 1996) and the combination of anoxia and glucose deprivation (Harata et al. 1997) seem to have exactly the same effect as the effects of mitochondrial inhibitors described here, making this pathway unlikely as a significant contributor to the CA1 response.
Another model which has been proposed recently is that adenosine released in the CNS during anoxia may activate K+ conductances. There is some evidence for a role for adenosine, as some of the responses to anoxia, most notably changes in the efficacy of synaptic transmission, are blocked by adenosine receptor antagonists (Croning, Zetterstrom, Grahame-Smith & Newberry, 1995; Zhu & Krnjevic, 1997). However, the role of adenosine receptors in mediating the hypoxic hyperpolarization was less clear in these two studies, as Zhu & Krnjevic (1997) found that adenosine antagonists blocked the response while Croning et al. (1995) found that they did not. If adenosine release accounts for the responses that we have seen here, we would have to speculate that adenosine released from a cell would feedback on that cell promoting Ca2+ influx. There is little evidence linking adenosine receptor activation with Ca2+ influx pathways, but perhaps this possibility requires further examination.
In conclusion, we have shown that freshly dissociated hippocampal neurons respond to anoxia, to inhibition of mitochondrial respiration and to mitochondrial uncouplers with a depolarization of the mitochondrial potential, followed by an increase in Ca2+ influx and a rise in [Ca2+]i which then activates a Ca2+-dependent K+ current. The challenge then seems to be to define the mechanism that couples altered mitochondrial metabolism with a plasmalemmal Ca2+ influx pathway.
Acknowledgments
We would like to thank Action Research for financial support. We also thank D. Lilian Patterson for her unflagging help in the laboratory and Dr Mart H. Mojet for helpful discussion.
References
- Ashcroft FM. ATP regulated K channels. Cellular Signalling. 1990;2:197–214. doi: 10.1016/0898-6568(90)90048-f. 10.1016/0898-6568(90)90048-F. [DOI] [PubMed] [Google Scholar]
- Belousov AB, Godfraind JM, Krnjevic K. Internal Ca2+ stores involved in anoxic responses of rat hippocampal neurons. The Journal of Physiology. 1995;486:547–556. doi: 10.1113/jphysiol.1995.sp020833. [DOI] [PMC free article] [PubMed] [Google Scholar]
- Bernardi H, Fosset M, Lazdunski M. Characterisation, purification and affinity labelling of brain [H3]-glibenclamide binding protein, a putative neuronal ATP-gated K channel. Proceedings of the National Academy of Sciences of the USA. 1988;85:9816–9820. doi: 10.1073/pnas.85.24.9816. [DOI] [PMC free article] [PubMed] [Google Scholar]
- Crepel V, Krnjevic K, Ben-Ari Y. Sulphonylureas reduce the slowly inactivating D-type outward current in rat hippocampal neurons. The Journal of Physiology. 1993;466:39–54. [PMC free article] [PubMed] [Google Scholar]
- Croning MD, Zetterstrom TS, Grahame-Smith DG, Newberry NR. Action of adenosine receptor antagonists on hypoxia-induced effects in the rat hippocampus in vitro. British Journal of Pharmacology. 1995;116:2113–2119. doi: 10.1111/j.1476-5381.1995.tb16419.x. [DOI] [PMC free article] [PubMed] [Google Scholar]
- Duchen MR. Effects of metabolic blockade on the membrane properties of single neurones dissociated from mouse dorsal root ganglia. The Journal of Physiology. 1990;424:387–409. doi: 10.1113/jphysiol.1990.sp018073. [DOI] [PMC free article] [PubMed] [Google Scholar]
- Duchen MR. Ca2+-dependent changes in the mitochondrial energetics of single mouse sensory neurones. Biochemical Journal. 1992;283:41–50. doi: 10.1042/bj2830041. [DOI] [PMC free article] [PubMed] [Google Scholar]
- Duchen MR, Farquharson D, Pearce RJ, Biscoe TJ. An apparatus for simultaneous microfluorimetry and flash photolysis of caged compounds. The Journal of Physiology. 1991;438:142. P. [Google Scholar]
- Duchen MR, Valdeolmillos M, O'Neill SC, Eisner DA. Effects of metabolic blockade on the regulation of intracellular Ca2+ in dissociated mouse dorsal root ganglion neurones. The Journal of Physiology. 1990;424:411–426. doi: 10.1113/jphysiol.1990.sp018074. [DOI] [PMC free article] [PubMed] [Google Scholar]
- Eccles RM, Loyning Y, Oshima T. Effects of hypoxia on the monosynaptic reflex pathway in the cat spinal cord. Journal of Neurophysiology. 1966;29:315–322. doi: 10.1152/jn.1966.29.2.315. [DOI] [PubMed] [Google Scholar]
- Erdemli G, Krnjevic K. Tolbutamide suppresses slow and medium afterhyperpolarization in hippocampal slices. NeuroReport. 1994;5:2145–2148. doi: 10.1097/00001756-199410270-00039. [DOI] [PubMed] [Google Scholar]
- Findlay I. Sulphonylurea drugs no longer inhibit ATP-sensitive K+ channels during metabolic stress in cardiac muscle. Journal of Pharmacology and Experimental Therapeutics. 1993;266:456–467. [PubMed] [Google Scholar]
- Fujiwara N, Higashi H, Shimoji K, Yoshimura M. Effects of hypoxia on rat hippocampal neurons in vitro. The Journal of Physiology. 1987;384:131–151. doi: 10.1113/jphysiol.1987.sp016447. [DOI] [PMC free article] [PubMed] [Google Scholar]
- Godfraind JM, Kawamura H, Krnjevic K, Pumain R. Actions of dinitrophenol and some other metabolic inhibitors on cortical neurons. The Journal of Physiology. 1971;215:199–222. doi: 10.1113/jphysiol.1971.sp009465. [DOI] [PMC free article] [PubMed] [Google Scholar]
- Godfraind JM, Krnjevic K. Tolbutamide suppresses anoxic outward current of hippocampal neurons. Neuroscience Letters. 1993;162:101–104. doi: 10.1016/0304-3940(93)90570-b. 10.1016/0304-3940(93)90570-B. [DOI] [PubMed] [Google Scholar]
- Grigg JJ, Anderson EG. Glucose and sulphonylureas modify different phases of the membrane potential change during hypoxia in rat hippocampal slices. Brain Research. 1989;489:302–310. doi: 10.1016/0006-8993(89)90863-9. 10.1016/0006-8993(89)90863-9. [DOI] [PubMed] [Google Scholar]
- Hansen AJ, Hounsgaard J, Jahnsen H. Anoxia increases potassium conductance in nerve cells. Acta Physiologica Scandinavica. 1982;115:301–310. doi: 10.1111/j.1748-1716.1982.tb07082.x. [DOI] [PubMed] [Google Scholar]
- Harata N, Wu J, Ishibashi H, Ono K, Akaike N. Run-down of the GABAA response under experimental ischaemia in acutely dissociated CA1 pyramidal neurones of the rat. The Journal of Physiology. 1997;500:673–688. doi: 10.1113/jphysiol.1997.sp022052. [DOI] [PMC free article] [PubMed] [Google Scholar]
- Horn R, Marty A. Muscarinic activation of ionic currents measured by a new whole cell recording method. Journal of General Physiology. 1985;92:145–159. doi: 10.1085/jgp.92.2.145. 10.1085/jgp.92.2.145. [DOI] [PMC free article] [PubMed] [Google Scholar]
- Kaplin AI, Snyder SH, Linden DJ. Reduced nicotinamide adenine dinucleotide-selective stimulation of inositol 1,4,5-trisphosphate receptors mediates hypoxic mobilization of calcium. Journal of Neuroscience. 1996;16:2002–2011. doi: 10.1523/JNEUROSCI.16-06-02002.1996. [DOI] [PMC free article] [PubMed] [Google Scholar]
- Knopfel T, Spuler A, Grafe P, Gahwiler BH. Cytosolic calcium during glucose deprivation in hippocampal pyramidal cells of rats. Neuroscience Letters. 1990;117:295–299. doi: 10.1016/0304-3940(90)90680-8. 10.1016/0304-3940(90)90680-8. [DOI] [PubMed] [Google Scholar]
- Krnjevic K, Leblond J. Changes in membrane currents of hippocampal neurons evoked by brief anoxia. Journal of Neurophysiology. 1989;62:15–30. doi: 10.1152/jn.1989.62.1.15. [DOI] [PubMed] [Google Scholar]
- Krnjevic K, Xu Y. Dantrolene suppresses the hyperpolarization or outward current observed during anoxia in hippocampal neurons. Canadian Journal of Physiology and Pharmacology. 1989;67:1602–1604. doi: 10.1139/y89-258. [DOI] [PubMed] [Google Scholar]
- Krnjevic K, Xu Y. Dantrolene depolarizes hippocampal neurons in slices from rats. Canadian The Journal of Physiology and Pharmacology. 1996;74:241–250. 10.1139/cjpp-74-3-241. [PubMed] [Google Scholar]
- Mojet M, Mills E, Duchen MR. Changes in mitochondrial function, [Ca2+]i and catecholamine secretion in response to hypoxia in chromaffin cells dissociated from the newborn rat adrenal. The Journal of Physiology. 1995;487.P:59. doi: 10.1111/j.1469-7793.1997.175bf.x. P. [DOI] [PMC free article] [PubMed] [Google Scholar]
- Nakashima Y, Ishibashi H, Harata N, Akaike N. Effects of glucose deprivation on NMDA-induced inward current and intracellular Ca2+ in rat substantia nigra neurons. Journal of Neurophysiology. 1996;75:740–749. doi: 10.1152/jn.1996.75.2.740. [DOI] [PubMed] [Google Scholar]
- Nowicky AV, Duchen MR. Interactions between mitochondria and cytosolic free calcium in freshly dissociated hippocampal neurons. American Society for Neuroscience. 1993;19:1218. [Google Scholar]
- Nowicky AV, Duchen MR. Relationship between mitochondrial potential and intracellular calcium in dissociated rat hippocampal neurons. The Journal of Physiology. 1994;475.P:148. P. [Google Scholar]
- Nowicky AV, Duchen MR. Inhibition of mitochondrial function induces a calcium dependent potassium current in dissociated rat CA1 hippocampal neurons. The Journal of Physiology. 1995;487.P:60. P. [Google Scholar]
- Nowicky AV, Peuchen S, Clark JB, Duchen MR. Simultaneous measurements of intracellular calcium and mitochondrial potential in isolated mammalian cells. The Journal of Physiology. 1993;473:10. P. [Google Scholar]
- Rae J, Cooper K, Gates P, Watsky M. Low access resistance perforated patch recordings using amphotericin B. Journal of Neuroscience Methods. 1991;37:15–26. doi: 10.1016/0165-0270(91)90017-t. 10.1016/0165-0270(91)90017-T. [DOI] [PubMed] [Google Scholar]
- Zhu PJ, Krnjevic K. Adenosine release mediates cyanide induced suppression of neuronal activity. Journal of Neuroscience. 1997;17:2355–2364. doi: 10.1523/JNEUROSCI.17-07-02355.1997. [DOI] [PMC free article] [PubMed] [Google Scholar]
- Zini S, Tremblay E, Pollard H, Moreau J, Ben-Ari Y. Regional distribution of sulfonylurea receptors in the brain of rodent and primate. Neuroscience. 1993;55:1085–1091. doi: 10.1016/0306-4522(93)90322-7. 10.1016/0306-4522(93)90322-7. [DOI] [PubMed] [Google Scholar]