

Abstract
By applying fura-2-based fluorometric calcium imaging to neonatal rat hippocampal slices we identified a developmentally regulated spontaneous neuronal activity in the CA1 region of the hippocampus. The activity consisted of bursts of intracellular Ca2+ transients recurring synchronously at a slow rate of 0.4–2 min−1 in the entire population of pyramidal neurones and interneurones.
These early network oscillations (ENOs) were present during a restricted period of postnatal development. Thus, they were not detected at the day of birth (P0), at P1–P4 they consisted of bursts of large (up to 1.5 μm) Ca2+ transients, gradually transforming into regularly occurring, smaller Ca2+ transients during the subsequent week. Beyond P15–P16 no ENOs were detected.
The ENOs were blocked by tetrodotoxin (TTX) and by a reduction in temperature from 33–35°C to 20–22°C. By combining fluorometric imaging with whole-cell current-clamp recordings, we found that each ENO-related Ca2+ transient was associated with a high-frequency (up to 100 Hz) train of action potentials riding on a depolarizing wave.
Recordings in the voltage-clamp mode revealed barrages of synaptic currents that were strictly correlated with the ENO-associated Ca2+ transients in neighbouring pyramidal neurones. Perfusing the cells with an intracellular solution that allowed for a discrimination between GABAA and glutamate receptor-mediated currents showed that these barrages of synaptic currents were predominantly of GABAergic origin.
The ENOs were totally blocked by the GABAA receptor antagonist bicuculline and they were also substantially reduced by the glutamatergic antagonists d,l-2-amino-5-phosphonovaleric acid (d,l-APV) and 6-cyano-7-nitroquinoxaline-2,3-dione (CNQX).
Synaptic stimulation and application of the GABAA receptor agonist muscimol mimicked the spontaneous Ca2+ transients in pyramidal neurones. The efficacy of muscimol in evoking Ca2+ transients decreased during development in parallel with the gradual disappearance of the ENOs.
The developmental decrease in the amplitude of ENO-associated Ca2+ transients occurred in parallel with the transformation of the excitatory synaptic transmission in the hippocampus from the immature GABAergic to the mature glutamatergic form. Thus, at the beginning of the first postnatal week single-shock synaptic stimulation produced Ca2+ transients that were completely blocked by bicuculline. At the end of the second postnatal week the same type of evoked synaptic stimulation produced a Ca2+ transient that was little affected by bicuculline but was abolished by the combined application of d,l-APV and CNQX.
These results demonstrate the presence of periodic and spontaneous Ca2+ transients in the majority of pyramidal cells and interneurones of the neonatal CA1 hippocampal network. These ENOs exhibit a highly region-specific developmental profile and may control the activity-dependent wiring of the synaptic connectivity during early postnatal development.
The assembly of functional synaptic circuits in the mammalian brain relies on both activity-independent and activity-dependent mechanisms. The initial coarse pattern of synaptic connections is thought to be formed by largely activity-independent mechanisms whereas region-specific, patterned neuronal activity promotes functional maturation of precursor networks (Goodman & Shatz, 1993). In the neonatal retina, for example, spontaneous correlated activity is thought to provide the basis for the eye-specific segregation of retinal terminals in the lateral geniculate nucleus (Shatz, 1990; Goodman & Shatz, 1993).
It has been shown that the correlated neuronal activity in the retina gives rise to correlated Ca2+ oscillations in spatially restricted domains of amacrine and ganglion cells (Wong, Chernjavsky, Smith & Shatz, 1995; Feller, Wellis, Stellwagen, Werblin & Shatz, 1996). Similar domains of active cells, exhibiting spontaneous increases in intracellular calcium concentration ([Ca2+]i), have been found also in the developing neocortex (Yuste, Peinado & Katz, 1992; Yuste, Nelson, Rubin & Katz, 1995). Unlike the retinal Ca2+ oscillations, which are synaptically mediated and require activation of acetylcholine receptors (Feller et al. 1996), the oscillations in the neocortex propagate via gap junctions and do not require synaptic transmission (Yuste et al. 1995). It has been suggested that the Ca2+ oscillations in the neocortex are caused by inositol 1,4,5-trisphosphate (IP3) spreading through gap junctions and evoking Ca2+ release from internal stores (Kandler & Katz, 1995). If so, the Ca2+ oscillations observed in cortical neurones are mechanistically similar to those seen in epithelial and glial cells which also require gap junctions (Cornell-Bell, Finkbeiner, Cooper & Smith, 1990; Boitano, Dirksen & Sanderson, 1992).
Very recently, spontaneous Ca2+ oscillations, occurring simultaneously in groups of neighbouring cells, were found in the CA3 region of the neonatal hippocampus (Leinekugel, Medina, Khalilov, Ben-Ari & Khazipov, 1997). These Ca2+ oscillations were strictly correlated with giant depolarizing potentials (GDPs; Ben-Ari, Cherubini, Corradetti & Gaiarsa, 1989; Gaiarsa, Corradetti, Cherubini & Ben-Ari, 1990) in an adjacent cell, indicating that they reflect a synchronous network-driven activity in a population of cells. The actual size of this ‘active domain’, however, remained unknown.
Correlated spontaneous Ca2+ oscillations have also been described in embryonic Xenopus (Gu, Olson & Spitzer, 1994) and chick (O'Donovan, Ho & Yee, 1994) spinal neurones. However, in these preparations the percentage of cells showing synchronous Ca2+ transients was low and the synchronously active cells were randomly distributed throughout the spinal cord (Gu et al. 1994; O'Donovan et al. 1994). The spontaneous Ca2+ oscillations in spinal neurones are sensitive to blockers of voltage-gated sodium and calcium channels (Gu et al. 1994), but the precise mechanism of their generation remains unknown.
By imaging simultaneously the activity from up to 100 neurones, we demonstrate that spontaneous oscillatory Ca2+ transients occur during early postnatal development in the CA1 region of the rat hippocampus. These early network oscillations (ENOs) are synaptically mediated and are not restricted to small cellular domains as is the case in the neocortex (Yuste et al. 1992, 1995), but involve the synchronous activation of virtually the entire population of neurones, including interneurones of the strata radiatum and oriens. The ENOs exhibit several unique features, including a characteristic developmental profile consisting of powerful bursts of Ca2+ transients during the first 3-5 postnatal days followed by higher frequency single Ca2+ transients with gradually decreasing amplitudes. A part of these results has been reported in abstract form (Hanse, Garaschuk & Konnerth, 1996).
METHODS
Slice preparation and solutions
Hippocampal slices were prepared from brains of young (0-16 days old) Wistar rats as described previously (Edwards, Konnerth, Sakmann & Takahashi, 1989; Durand, Kovalchuk & Konnerth, 1996). Briefly, rats were decapitated and the brain hemispheres were rapidly isolated and placed in an ice-cold bicarbonate-buffered extracellular solution (for composition, see below). Transverse hippocampal slices of 300 μm thickness were cut with a vibratome, and kept before recording for at least 1 h at 34°C in a storage chamber containing extracellular solution bubbled with a mixture of 95 % O2 and 5 % CO2. The extracellular solution contained (mM): 125 NaCl, 4.5 KCl, 2 CaCl2, 1 MgCl2, 1.25 NaH2PO4, 26 NaHCO3 and 20 glucose (pH 7.4, when bubbled continuously with 95 % O2 and 5 % CO2).
The standard pipette solution used in the whole-cell patch-clamp recordings contained (mM): 140 KCl, 10 NaCl, 4 Mg-ATP, 0.4 Na-GTP, 0.1-0.2 fura-2 pentapotassium salt and 10 Hepes (pH 7.3, adjusted with KOH). For the experiments illustrated in Fig. 7 the pipette solution contained (mM): 130 CsCl, 20 TEACl, 4 Mg-ATP, 0.4 Na-GTP, 0.2 EGTA and 10 Hepes (pH 7.3, adjusted with CsOH). For the experiments illustrated in Fig. 8 the pipette solution contained (mM): 120 caesium gluconate, 2 NaCl, 10 EGTA, 4 Mg-ATP, 0.4 Na-GTP and 10 Hepes (pH 7.3, adjusted with CsOH).
Figure 7. Each spontaneous Ca2+ transient is associated with a barrage of synaptic currents.
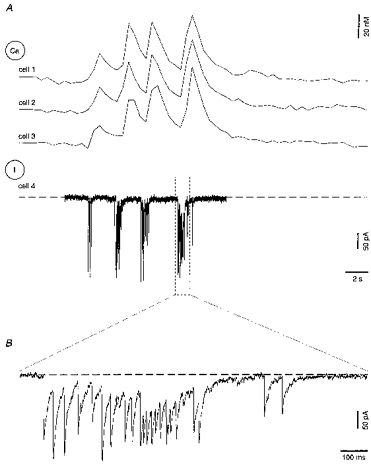
A, whole-cell voltage-clamp recordings from a CA1 pyramidal neurone (I, cell 4) in combination with fluorometric [Ca2+]i measurements from 3 neighbouring intact fura-2 AM-loaded pyramidal neurones (Ca, cells 1-3). The holding potential of cell 4 was -70 mV. B, the boxed region of the current trace in A shown at an expanded time scale. The slice was obtained from a rat at P3.
Figure 8. ENO-associated barrages of synaptic currents are carried predominantly by chloride ions.
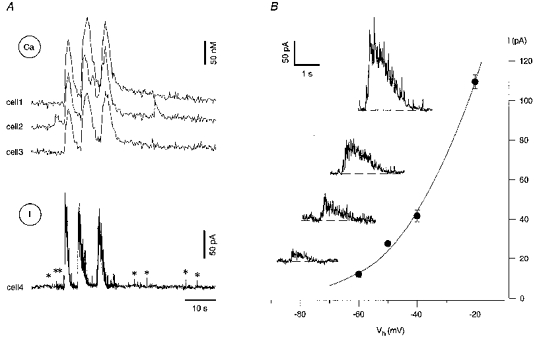
A, [Ca2+]i measurements from 3 fura-2 AM-loaded pyramidal neurones (Ca, cells 1-3) combined with the whole-cell current recording from a neighbouring pyramidal neurone (I, cell 4) voltage clamped at -20 mV. The pipette solution contained only 2 mM Cl− to obtain a reversal potential for Cl− at -109 mV (see Methods). Note that both the ENO-associated slow currents and the spontaneous synaptic currents (asterisks) detected before and after the burst were outward. B, current-voltage relation of the ENO-associated currents recorded in the voltage-clamped cell 4. The amplitude of the current represents the mean value within a 200 ms window at the peak of the response. Each point represents a mean of 3-8 measurements. The slice was obtained from a rat at P2. Insets illustrate ENO-associated currents recorded (from top to bottom) at holding potentials (Vh) of -20, -40, -50 and -60 mV.
All chemicals were purchased from Sigma.
Fluorometric Ca2+ measurements
Fluorometric Ca2+ measurements were performed in slices loaded with the membrane-permeant acetoxymethyl ester of fura-2 (fura-2 AM; Molecular Probes). Slices were incubated for 10 min at 36°C in oxygenated extracellular solution containing 10-15 μM fura-2 AM. A reasonably good loading of neuronal somata located in the top layers of the slice was routinely achieved (cf. Figs 2 and 3). The estimated intracellular fura-2 concentration reached 100 μM in the brightest ester-loaded cells and 20-60 μM in other cells (Garaschuk & Konnerth, 1997). In some experiments, after initial recordings from intact fura-2 AM-loaded cells, one of the neurones was selected for whole-cell recording and dialysed with the pipette solution containing 100-200 μM of the pentapotassium salt of fura-2 (Molecular Probes).
Figure 2. Spatially resolved changes in [Ca2+]i in individual CA1 pyramidal neurones during a spontaneous Ca2+ burst.
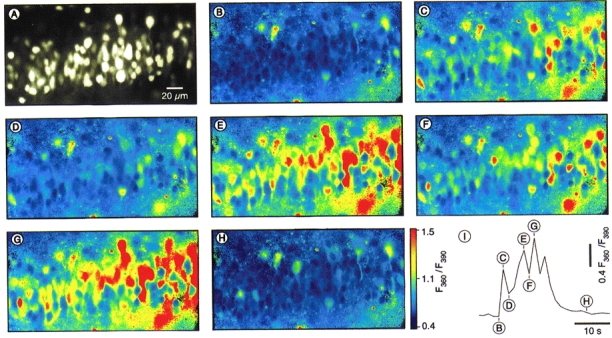
A, an epifluorescence image (taken at 390 nm excitation light) of the cell body layer in the CA1 region of a hippocampal slice from a 3-day-old rat taken with a × 40 objective lens. B-H, pseudocolour ratio images were taken at various time points, as indicated in I, during a Ca2+ burst consisting of four Ca2+ transients. I, time course of the Ca2+ burst calculated as a mean of all individual changes in [Ca2+]i (n= 107 cells).
Figure 3. Interneurones exhibit spontaneous Ca2+ bursts in synchrony with ENO-associated Ca2+ bursts in pyramidal cells.
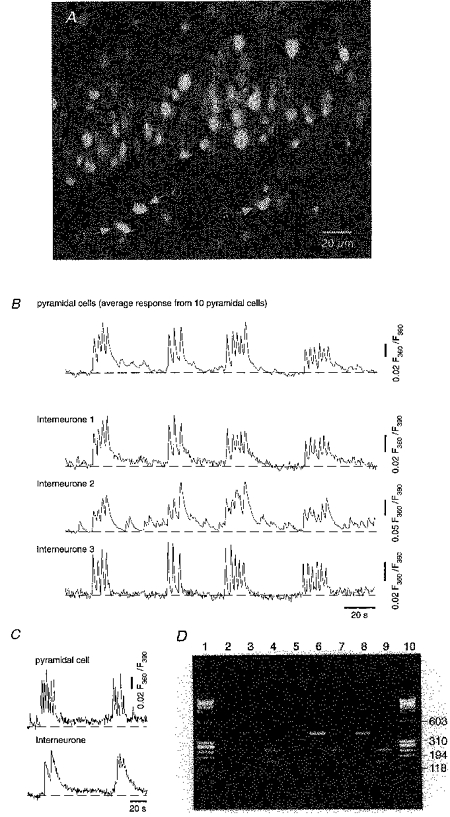
A, an epifluorescence image of the cell body layer, the proximal parts of the stratum radiatum (bottom) and stratum oriens (top) in the CA1 region. The image is an extension of that shown in Fig. 2A and it is composed from two partially overlapping images. Arrows indicate 3 morphologically identified interneurones in the stratum radiatum. B, spontaneous Ca2+ bursts recorded from the interneurones indicated in A. The trace representing the pyramidal neurones is a mean response from 10 arbitrarily chosen pyramidal cells. C, synchronous Ca2+ bursts recorded simultaneously in a CA1 pyramidal cell and a nearby interneurone (distance between cell bodies about 50 μm) of the stratum oriens. D, agarose gel electrophoresis of the PCR products. Values to the right of the gel are numbers of base pairs. Lanes 1 and 10: low molecular weight marker φX174/Hae III (Pharmacia). Lane 2: PCR amplification using content harvested from the CA1 pyramidal cell whose activity is shown in C. Lanes 3 and 4: band indicating the 391 bp product of the PCR amplification with GAD65-specific primers (lane 3). Restriction digest with Pst I after a second PCR amplification yielding expected products of 233 and 158 bp (lane 4). Material harvested from the interneurone whose activity is shown in C. Lanes 5-9: the cell content from 2 oscillating interneurones (lanes 6 and 7, and 8 and 9, respectively) in the stratum radiatum and a CA1 pyramidal cell (lane 5) from another slice, analysed as described above. Note that in pyramidal cells, lanes 2 and 5, the GAD65-specific 391 bp product is completely absent.
Fura-2 AM-loaded slices were placed in a recording chamber mounted on an upright microscope (Zeiss Axioscop FS, Oberkochen, Germany; objectives: 63×-W/0.9 NA, 40×-W/0.75 NA or 10×-W/0.3 NA) attached to a variable-scan digital imaging system (T.I.L.L. Photonics GmbH, München, Germany) equipped with ‘Image-8′ software (University of Saarland, Homburg, Germany). Digital fluorescence images of the slice were obtained (at rates of up to 10 Hz) using paired exposures to 360 and 390 nm excitation wavelength. During recordings, the slices were continuously perfused with the standard extracellular solution at 33-35°C.
CA1 pyramidal neurones in hippocampal slices were visually identified according to their characteristic shape and their location within the cell body layer (Garaschuk, Yaari & Konnerth, 1997). Interneurones in both stratum radiatum (cf. Fig. 3) and stratum oriens were also identified according to their characteristic morphology and their location in the slice.
Fluorescence values (F) representing spatial averages from up to thirty-two defined pixel regions were displayed on-line as a function of time and saved as an ASCII table for further analysis. In most cases the fluorescence signal was obtained from the cell bodies of different pyramidal cells. Each experiment provided simultaneous measurements from three to thirty-two different neurones. The background fluorescence was always measured in parallel in a separate pixel region near the cells of interest and used for an on-line correction of the cellular fluorescence signals. The calibration constants for the fura-2 measurements Keff (‘effective binding constant’), Rmin (fluorescence ratio at zero Ca2+) and Rmax (limiting fluorescence ratio at high Ca2+) were obtained from in vivo calibration experiments (Eilers, Schneggenburger & Konnerth, 1995). Calibration parameters found for Keff, Rmin and Rmax were 1056 ± 60 nM (n= 6), 0.64 ± 0.03 and 5.33 ± 0.68, respectively. In some experiments (cf. Fig. 2), consecutive paired exposures to 360 and 390 nm were used to construct ratiometric digital fluorescence images. They were displayed on-line in a pseudocolour mode on a monitor and stored on hard disk for later analysis.
Electrophysiological recordings
Whole-cell currents were recorded with the EPC-9 patch-clamp amplifier (HEKA, Lambrecht, Germany) as previously reported (Eilers et al. 1995; Durand et al. 1996). Unless otherwise indicated, the holding potential was set at -70 mV. Data acquisition and pulse protocols for controlling drug application (see below) were performed using the ‘Pulse’ software (HEKA, Lambrecht, Germany). Before establishing the whole-cell recording configuration the membrane surface was cleaned, if necessary, using procedures described previously (Edwards et al. 1989). Patch pipettes were made of borosilicate glass (Hilgenberg GmbH, Malsfeld, Germany) and coated with a silicon-based resin (General Electrics, Ruesselsheim, Germany). They had resistances of 3-4 MΩ when filled with the standard pipette solution. The series resistance was less than 10-12 MΩ. In some experiments it was compensated up to 60 % using standard procedures.
Drug application and synaptic stimulation
The GABAA receptor agonist muscimol was pressure applied using a Picospritzer II (General Valve, Fairfield, NJ, USA) from a fine pipette (6-12 MΩ) filled with standard extracellular solution containing 10-20 μM muscimol. The tip of the application pipette was placed near (≈5 μm) an arbitrarily chosen target neurone and, for a given muscimol concentration in the pipette, the shortest pulse duration (200-500 ms) evoking a reproducible response was selected. Alternatively, muscimol (20 μM) was delivered by bath application.
For synaptic stimulation of afferent fibres in the stratum radiatum, voltage (9-40 V, 100-150 μs) or current (15-39 μA, 100-150 μs) pulses generated by an isolated pulse stimulator (A-M Systems, Inc., Everett, WA, USA) were passed through pipettes, similar to the ones used for whole-cell recordings, filled with extracellular solution.
Single-cell RT-PCR
The single-cell reverse transcription-polymerase chain reaction (RT-PCR) technique (Lambolez, Audinat, Bochet, Crépel & Rossier, 1992) was used for identification of GABAergic neurones, by testing their characteristic expression of mRNA for glutamate decarboxylase (GAD; cf. Freund & Buzsaki, 1996). Following Ca2+ imaging, whole-cell recordings were obtained from the same cells by using standard pipettes (see above) filled with a pipette solution containing (mM): 140 CsCl, 3 MgCl2, 5 EGTA, 10 Hepes (pH 7.2). Harvesting of the cytoplasm and the following RT reaction were performed as previously described (Plant, Schirra, Garaschuk, Rossier & Konnerth, 1997). The primers used for the PCR reaction result in the amplification of a 391 base pair (bp) fragment of one form of GAD, GAD65. The amplification product was cut by the GAD65-specific restriction enzyme Pst I (Pharmacia, Freiburg, Germany; see Bochet et al. (1994)) yielding two products of 233 and 158 bp.
Data analysis
To quantify the oscillatory changes in [Ca2+]i in individual cells and in the population responses, we adopted algorithms initially described by Lopez et al. (1995). Two related parameters, the integral [Ca2+]i increase and the oscillation index (OI), were routinely used. The integral [Ca2+]i increase was measured as the total area under the [Ca2+]i trace minus an ‘offset’ area. The ‘offset’ area was calculated by multiplying the mean [Ca2+]i value obtained during the silent periods (equal to resting [Ca2+]i) by the integration time. The integral [Ca2+]i increase is thus equivalent to the area under the [Ca2+]i peaks. Increases in this parameter reflect increases of [Ca2+]i irrespective of whether they are oscillatory or not.
The oscillation index (OI) was calculated as the cumulative sum of all the differences between a given sample of the [Ca2+]i measurement and the next sample during the recording period (Lopez et al. 1995). To eliminate the influence of background noise a threshold, corresponding to the maximal width of the noise band (B), was introduced in the algorithm. Thus, given that Δxi is the difference between two consecutive [Ca2+]i measurements and m is the number of measurements during the recording period:
Thus, data were included in the cumulative sum only if the difference between the two points was larger than the noise band. An increase in the OI reflects an increase in either frequency or amplitude of the oscillations, but does not take into account the actual levels of [Ca2+]i.
Both the integral [Ca2+]i increase and the OI were normalized with respect to the recording period. The OI was used mainly to evaluate the effect of some experimental manipulations (e.g. drug administration and changes in temperature). In these experiments, the OI obtained during the manipulation was divided by the OI obtained during the control period in the same experiment yielding a paired quantitative measure of the effect.
Data are given as means ± standard error of the mean (s.e.m.).
RESULTS
Synchronized bursts of spontaneous oscillatory Ca2+ transients in the CA1 region of the neonatal hippocampus
Figure 1 illustrates fluorometric measurements obtained from the CA1 region in a fura-2 AM-loaded hippocampal slice from a 1-day-old rat (P1). The region of interest (rectangular box) was located in the cell body layer as illustrated in the photomicrograph taken at a low magnification (Fig. 1A). This allowed us to record a population response from a large number (up to 200) of neurones. The measurements revealed periodically occurring transient changes in the Ca2+-sensitive fluorescence (Fig. 1B), reflecting correlated bursts of transient elevations in [Ca2+]i in individual cells (see Fig. 2). These spontaneous bursts of Ca2+ transients recurred rhythmically at a low frequency with approximately the same amplitude and duration. In the experiment illustrated in Fig. 1B, the spontaneous Ca2+ bursts were recorded over a time period of 6 h. Besides a decrease in amplitude, which probably reflects some loss of healthy cells in the slice, there was no major change in the pattern of activity during this time period, suggesting that the observed phenomenon represents an on-going form of activity, present in hippocampal CA1 cells throughout early postnatal development. As shown on Fig. 1D, the spontaneous Ca2+ bursts were detected in region CA1 in five out of five slices, even after surgical separation of regions CA1 and CA3 (Fig. 1C).
Figure 1. Synchronized and periodic oscillatory Ca2+ bursts in the CA1 region of the neonatal hippocampus.
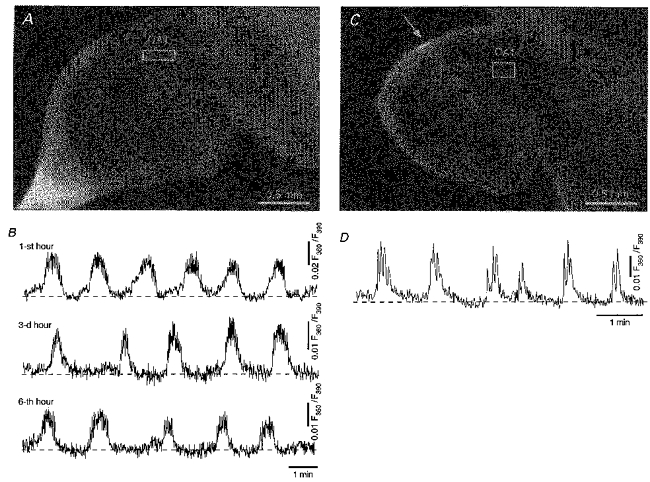
A, photomicrograph of a hippocampal slice from a 1-day-old rat. B, long-lasting fluorometric Ca2+ recordings from the region of interest delineated in A illustrating periodically recurring synchronous Ca2+ bursts. The integrated ratiometric signal (F360/F390) was collected with a × 10 objective lens and reflects the simultaneous activity of more than 90 neurones from a frame of 297 μm × 97 μm. C, photomicrograph of another hippocampal slice (P1) in which regions CA3 and CA1 were separated by a cut with a surgical scalpel through the entire depth of the slice at the site marked with an arrow. D, fluorometric recordings of spontaneous Ca2+ transients recorded from the area delineated by the frame (192 μm × 154 μm) in C.
It is noteworthy that the amplitude of this population response depended on the quality of the slice preparation. If the number of healthy cells in the superficial layers of the slice was very low, the population response was not seen at all. This finding suggests that the generation of these slow network oscillations requires a critical density of healthy cells.
Figure 2 illustrates the spatial distribution of changes in [Ca2+]i occurring in CA1 neurones during a spontaneous Ca2+ burst consisting of, in this particular case, four Ca2+ transients. The [Ca2+]i rose synchronously in 101 out of 107 cells seen, and was elevated above the baseline for the duration of the burst (approximately 20 s). Based on their morphology and their electrical properties (see below), all cells that contributed to the spontaneous Ca2+ signals were identified as neurones. Thus, the spontaneous Ca2+ bursts involved virtually the whole population of CA1 neurones. Analyses of data from thirty-one slices from rats at P1-P7 showed that 85 % (842 out of 986) of all CA1 pyramidal neurones participated in these ENOs. It should be noted, however, that the amplitude of the ENO-associated Ca2+ transients varied substantially from cell to cell (Fig. 2). At P1-P4 the amplitudes of ENO-associated Ca2+ transients in the cell bodies ranged from 25 to 1500 nM (246 ± 185 nM, data obtained from n= 22 slices).
In addition to the ENO-associated Ca2+ bursts, asynchronous Ca2+ transients were also often observed in individual neurones during the silent intervals (cf. Figs 5 and 9). These asynchronous Ca2+ transients were generally smaller in amplitude, rarely occurred in bursts and were not resolvable in the responses from populations of cells (cf. Fig. 1).
Figure 5. ENOs are blocked at room temperature.
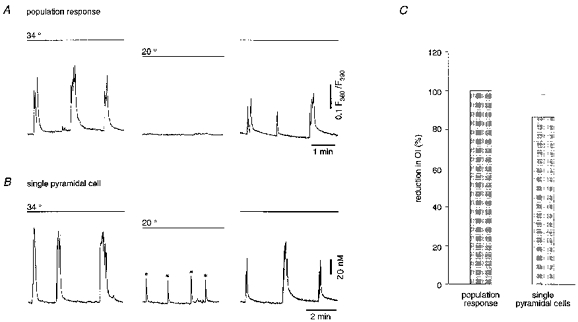
A, ratiometric fluorescence measurements from a region covering the CA1 pyramidal cell layer (cf. Fig. 1). B, ratiometric [Ca2+]i measurements from an individual CA1 pyramidal neurone. Asterisks (*) indicate non-synchronous Ca2+ transients. C, a bar graph summarizing the effect of lowering the temperature from 33-35 to 20-22 °C (n= 5 slices for population and n= 7 slices, 81 pyramidal cells for single cell responses).
Figure 9. Effect of GABAergic and glutamatergic antagonists on the ENOs.
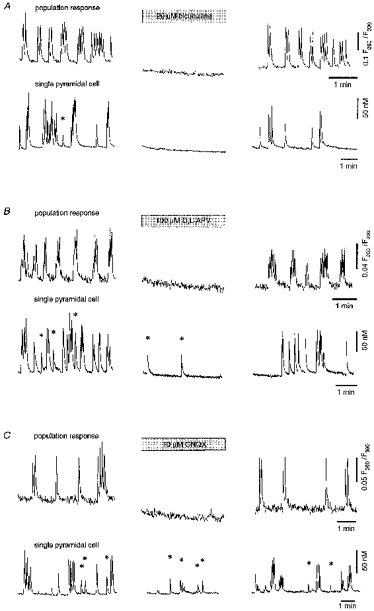
A-C, upper panels (‘population response’) show ratiometric fluorescence measurements from a region covering the CA1 pyramidal cell layer (cf. Fig. 1). Lower panels (‘single pyramidal cell’) show ratiometric [Ca2+]i measurements from individual CA1 pyramidal neurones. The left panel shows control recordings, the middle panel shows recordings in the presence of the drug and the right panel shows recordings after wash-out of the drug. Asterisks (*) indicate non-synchronous Ca2+ transients. All experiments illustrated were performed on slices at P2-P3.
To obtain insights about different cell types involved in the ENOs, we repeated the experiment shown in Fig. 2 by focusing on interneurones in stratum radiatum, known to be GABAergic (cf. Freund & Buzsaki, 1996). Figure 3 illustrates that interneurones in the stratum radiatum also experienced spontaneous Ca2+ bursts, which were strikingly similar to those recorded from CA1 pyramidal cells. There was a high degree of synchronization between traces recorded from all individual interneurones and the averaged trace obtained from ten pyramidal cells (Fig. 3B). On average, during P2-P3, synchronous changes in [Ca2+]i associated with spontaneous Ca2+ bursts in pyramidal cells were recorded in 70 % of interneurones (54/73 interneurones from stratum radiatum, n= 6 slices; 35/57 interneurones in stratum oriens, n= 5 slices). In individual interneurones the amplitudes of Ca2+ elevations during the burst varied from 20 to 270 nM, being on average 47.4 ± 59.9 nM in interneurones from the stratum oriens (n= 45 cells, 12 slices) and 40.6 ± 32.0 nM in interneurones from the stratum radiatum (n= 31 cells, 8 slices).
Interneurones were identified by their highly distinctive morphology (Freund & Buzsaki, 1996). Furthermore, we tested the identity of interneurones exhibiting ENOs directly by using single-cell RT-PCR analysis for mRNA of glutamate decarboxylase (GAD), a known marker for GABAergic cells (cf. Freund & Buzsaki, 1996). Figure 3C illustrates ENOs that were recorded in a CA1 pyramidal cell and a nearby interneurone-like cell from the stratum oriens. Figure 3D (lanes 3 and 4) confirms the GABAergic nature of the interneurone by showing that it was indeed GAD-positive. Lanes 6 and 7, and 8 and 9, respectively, of Fig. 3D demonstrate the GAD-positivity of two active interneurones from the stratum radiatum of another hippocampal slice. Altogether, eight of twelve of the morphologically identified interneurones were GAD-positive, while all six CA1 pyramidal neurones tested were GAD-negative.
In conclusion, during early postnatal development the vast majority of neurones in the CA1 region of the hippocampus exhibited synchronized spontaneous oscillatory Ca2+ bursts. These early network oscillations seem to represent a general property of the entire CA1 neuronal network during early postnatal development and, thus, represent an unusually massive form of correlated early neuronal activity compared with the spontaneous activities described so far in other regions of the nervous system (Yuste et al. 1992, 1995; Gu et al. 1994; O'Donovan et al. 1994; Wong et al. 1995; Leinekugel et al. 1997). The ENOs persisted in region CA1 after surgically separating regions CA1 and CA3. This suggests that region CA1 possesses endogenous pacemaking capabilities to sustain the ENOs. This feature of the ENOs is different from the synchronized epileptiform after-discharges found later in development that require a rhythmical drive from the pacemaking CA3 region (Wong & Traub, 1983; see also below).
Developmental profile of the ENOs
The ENO-associated [Ca2+]i oscillations had a characteristic developmental profile. They first appeared at P1, reached their peak of activity around P2 and progressively decreased during the next 2 weeks (Fig. 4A). During P1-P4, the ENOs most often consisted of synchronous bursts of two to fourteen Ca2+ transients (mean, 5.2 ± 0.5; n= 22 slices) with an intraburst interval of 4.6 ± 0.4 s (n= 22 slices), separated by interburst intervals that ranged from about 30 to 150 s. The mean frequency of the bursts was 1.0 ± 0.1 min−1 (n= 22 slices). After P5, the Ca2+ transients lost their bursty appearance, had progressively smaller amplitudes and occurred at rates of up to 15 min−1. At P15-P16 no ENOs were detected. The developmental profile of the ENOs was quantified by plotting the peak amplitudes of the oscillatory Ca2+ transients against the postnatal age (Fig. 4B). A very similar profile was obtained by plotting the integrated increase in [Ca2+]i (Fig. 4C), a parameter reflecting the combined contribution of the size and the frequency of oscillations. In an attempt to quantify the pattern of the oscillatory Ca2+ transients occurring during ENOs, we defined burst index as the ratio of intraburst frequency versus the interburst frequency. The plot in Fig. 4D was then obtained by plotting the burst index against the postnatal age.
Figure 4. Developmental profile of the ENOs.
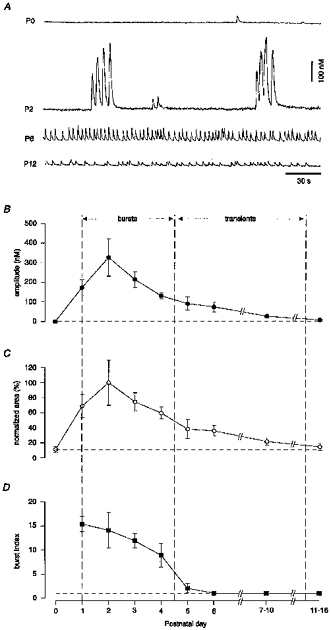
A, the traces show representative oscillatory Ca2+ transients recorded from individual fura-2 AM-loaded pyramidal neurones in slices from P0, P2, P6 and P12 rats. Note the large amplitudes and the burst-like appearance of the oscillatory Ca2+ transients at P2. B, averaged data showing the amplitude of the spontaneous Ca2+ transients plotted against postnatal age. C, a similar plot showing the developmental profile of the integrated [Ca2+]i elevations (area under the Ca2+ transients). The area measurements were normalized with respect to the maximal mean value obtained at P2. The dashed horizontal line in C represents the mean (n= 8 cells) normalized area obtained when all activity was blocked by bicuculline (cf. Fig. 9). D, the burst index, obtained by dividing the intraburst frequency with the interburst frequency, plotted against postnatal age. When no bursts were detected, that is when the activity was regular, this ratio became 1 (horizontal dashed line). Data points represent averaged values from 4, 6, 8, 8, 8, 6, 4, 7 and 7 slices prepared from rats at P0, P1, P2, P3, P4, P5, P6, P7-P10 and P11-P16, respectively. The value for each of these slices was obtained by evaluating recordings of at least 5 min duration from at least 3 active neurones. Non-active slices were not included in the calculation of burst index. Thus, P0 is not represented, 5/7 slices represent P7-P10 and 2/7 slices represent P11-P16. The vertical dashed lines subdivide the period during which ENOs are present into one when burst activity predominates and one when regular activity predominates.
The data illustrated in Fig. 4 clearly show that the time during which ENOs occur can be subdivided into two distinct periods roughly coinciding with the first and the second postnatal weeks. The first period is characterized by the presence of bursts of spontaneous Ca2+ transients and the large amplitudes of the Ca2+ transients. The second period is characterized by the presence of regularly occurring Ca2+ transients that were an order of magnitude smaller in amplitude and an associated dramatic decrease in the amount of Ca2+ charge entering the cell during each ENO event.
Temperature dependence of the ENOs
Characteristic features of the spontaneous oscillations described in the neonatal neocortex (Yuste et al. 1995) were that they were insensitive to tetrodotoxin (TTX) and more robust at lower temperatures. In contrast to these properties, the ENOs in the hippocampus were blocked when the temperature was reduced from the more physiological 33-35°C to room temperatures (20-22°C). It is noteworthy that the switch to low temperature was usually associated with a short period of intense, irregular activity causing a transient increase in [Ca2+]i (not shown). As illustrated in Fig. 5, a reduction in temperature to 20-22°C invariably diminished the synchronous ENO-associated Ca2+ bursts that were recorded with a low power objective lens (× 10; cf. Fig. 1). Asynchronous spontaneous Ca2+ transients, however, were detected in a minority of individual pyramidal cells (15/81 cells) even at 20-22°C (Fig. 5B). Lowering the temperature to 20-22°C also caused a slight reduction in the level of basal [Ca2+]i to, on average, 96.2 ± 1.6 % of the control value (n= 81 cells, 7 slices).
Electrical activity associated with the ENOs
To test whether the oscillatory Ca2+ bursts were associated with any change in membrane potential, whole-cell recordings were performed from one of the oscillating pyramidal cells. The concentration of Ca2+ indicator in the cell was maintained by adding 150 μM fura-2 to the pipette solution. Figure 6 illustrates such an experiment in which one pyramidal cell (cell 1) was recorded in current-clamp mode and [Ca2+]i was measured from that cell and from a neighbouring intact pyramidal cell (cell 2) loaded only with fura-2 AM. Each Ca2+ transient within the Ca2+ bursts was associated with a high-frequency burst of action potentials riding on a depolarizing wave (Fig. 6A and B, left panel). It is noteworthy that these electrical responses recorded in single CA1 pyramidal cells (Fig. 6B) shared similarities with the spontaneous GDPs found previously in the CA3 region of the immature rat hippocampus (Ben-Ari et al. 1989) and most recently also recorded in the CA1 region (Strata, Atzori, Molnar, Ugolini, Tempia & Cherubini, 1997). The mean voltage response associated with each Ca2+ transient had a duration of 477 ± 99 ms (calculated between the first and the last data point exceeding the noise band) and an amplitude of 38.3 ± 4.5 mV (calculated as the mean of a 2 ms long sampling interval during the plateau phase). The mean action potential frequency was 22.0 ± 2.5 Hz and the action potential frequency before adaptation (calculated from the first 2-4 interspike intervals) was 90.3 ± 12.8 Hz (n= 5 cells, 52 spontaneous events). It can also be noted that single action potentials (*) or miniature synaptic potentials (bottom trace right panel) did not produce any detectable changes in somatic [Ca2+]i. The oscillatory Ca2+ bursts and the associated action potential activity were completely abolished when the slice was perfused with 250 nM TTX (Fig. 6), indicating that action potential activity is necessary for the generation of the ENO-associated Ca2+ bursts. When recordings were performed in voltage-clamp mode (cf. cell 4 in Fig. 7), barrages of synaptic currents were seen in strict correlation with the ENO-associated Ca2+ transients in the neighbouring intact pyramidal cells (n= 9 cells, 9 slices).
Figure 6. TTX blocks both Ca2+ bursts and electrical activity associated with the ENOs.
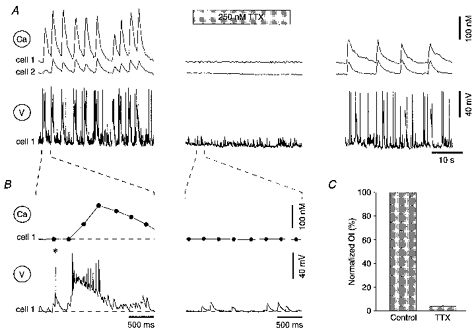
A and B, simultaneous [Ca2+]i measurements (Ca) and whole-cell current-clamp recordings (V) from a CA1 pyramidal neurone (cell 1) loaded with 150 μM fura-2 via the patch pipette. Cell 2 was one of the many neighbouring, fura-2 AM-loaded pyramidal neurones. Each of the Ca2+ transients is strictly correlated with a train of action potentials riding on a large depolarizing wave. The action potentials and the Ca2+ transients are reversibly blocked by 250 nM TTX. In B, one Ca2+ transient and the corresponding voltage trace are shown at an expanded time scale. Note that the Ca2+ transient is associated only with the slow depolarizing wave and that single action potential (*) or spontaneous miniature synaptic potentials (bottom trace right panel) do not produce any detectable changes in somatic [Ca2+]i. The slice was obtained from a rat at P1. C, bar graph showing the mean effect of 250 nM TTX (n= 7 slices, 18 cells).
These results show that activation of voltage-gated conductances are necessary for the generation of the spontaneous Ca2+ bursts. They also suggest that the ENO-associated Ca2+ bursts are synaptically mediated. We therefore explored this possibility further in the experiments described below.
Synaptic mechanisms of the ENOs
During early postnatal development activation of both glutamate- and GABA-activated receptor channels cause postsynaptic depolarization (cf. Cherubini, Gaiarsa & Ben-Ari, 1991) that is potentially capable of mediating ENO-associated neuronal activity. To identify the postsynaptic receptors involved in the ENOs, the chloride concentration of the intracellular solution was lowered to yield a theoretical reversal potential for chloride at -109 mV. Under these experimental conditions, GABAA and glutamate receptor-mediated currents should be outwardly and inwardly directed, respectively, at holding potentials between -109 and 0 mV. As illustrated in Fig. 8, the spontaneous barrages of synaptic currents in the voltage-clamped cells (cell 4), associated with the Ca2+ transients in the neighbouring intact cells (cells 1, 2 and 3), were outward at holding voltages positive to the chloride reversal potential, indicating that they were mainly mediated by a chloride flux across the membrane (n= 5 cells, 5 slices, P1-P4). It is noteworthy that the I-V relation of ENO-associated synaptic currents (Fig. 8B) showed rectification at the more hyperpolarizing potentials, consistent with the properties of hippocampal GABAA receptor channels in adult neurones (Collingridge, Gage & Robertson, 1984; Curmi, Premkumar, Birnir & Gage, 1993). Furthermore, the small, ‘unitary’ spontaneous currents (indicated by asterisks in Fig. 8A, lower panel), which were not correlated with detectable Ca2+ transients, were outwardly directed at holding potentials positive to the reversal potential for chloride. In fact, in 1- to 3-day-old CA1 pyramidal cells only 3.0 ± 0.4 % (n= 8 cells) of all spontaneous ‘unitary’ currents could be attributed to opening of glutamate receptor channels. At P5-P8 this number had increased to 40.8 ± 6.0 % (n= 3 cells). These results further support the view that glutamatergic synaptic transmission onto CA1 pyramidal cells is poorly developed during the very first postnatal days (Durand et al. 1996; Liao & Malinow, 1996).
To characterize further the synaptic mechanisms underlying the ENOs, the effects of GABAA, NMDA and AMPA receptor antagonists were investigated both for individual CA1 pyramidal cells and for populations of neurones (Figs 9 and 10). Consistent with the results described above, the GABAA receptor antagonist bicuculline totally blocked all ENO-associated Ca2+ transients in both groups (Figs 9A and 10A). The glutamate receptor antagonists d,l-2-amino-5-phosphonovaleric acid (D,L-APV) and 6-cyano-7-nitroquinoxaline-2,3-dione (CNQX) also effectively blocked the synchronized ENO-associated Ca2+ bursts (Figs 9B and C, upper panels, and 10A). However, in contrast to the powerful effect of bicuculline, asynchronous Ca2+ transients in individual pyramidal cells were still observed in the presence of D,L-APV and CNQX (Figs 9B and C, lower panels, and 10B).
Figure 10. Graph summarizing the effect of GABAergic and glutamatergic antagonists on the ENOs and basal [Ca2+]i.
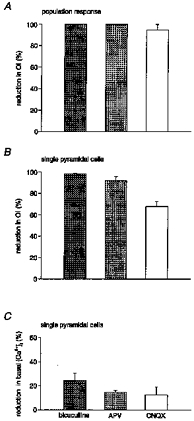
A, mean reduction in the oscillation index for the population of cells by 20 μM bicuculline (n= 5 slices), 100 μM d,l-APV (n= 3 slices) and 10 μM CNQX (n= 5 slices). B, mean reduction in the oscillation index of single pyramidal cells by 20 μM bicuculline (n= 8 slices, 24 cells), 100 μM d,l-APV (n= 5 slices, 15 cells) and 10 μM CNQX (n= 5 slices, 15 cells). C, mean reduction in basal [Ca2+]i caused by the drug application in the experiments shown in B.
Furthermore, all tested antagonists caused a significant reduction in the basal [Ca2+]i, suggesting that ENO-associated neuronal activity caused a sustained increase in the basal [Ca2+]i (Fig. 10C). In single pyramidal cells, bicuculline, D,L-APV and CNQX produced reductions in basal [Ca2+]i of 24.5 ± 1.1 % (n= 28 cells, 11 slices), 14.9 ± 0.2 % (n= 41 cells, 5 slices) and 12.7 ± 1.2 % (n= 30 cells, 5 slices), respectively. For comparison, application of 250 nM TTX caused a 14.3 ± 0.7 % (n= 18 cells, 7 slices) reduction in basal [Ca2+]i. It is noteworthy that the resting basal [Ca2+]i in fura-2 AM-loaded pyramidal cells at P2-P6 was 76.3 ± 0.9 nM (n= 314 cells, 91 slices) and thus was slightly higher that the resting [Ca2+]i found in these cells at P9-18 (49.5 nM; Garaschuk et al. 1997).
In conclusion, these pharmacological results show that the ENOs require functional AMPA, NMDA and GABAA receptors. They further underscore the fundamental importance of GABAA receptor-mediated transmission for the generation of the ENO-associated Ca2+ bursts in neonatal CA1 pyramidal cells.
Depolarizing action of GABA early in development
Consistent with a depolarizing action of GABA during early hippocampal development found in region CA3 (cf. Cherubini et al. 1991; Ben-Ari, Tseeb, Raggozzino, Khazipov & Gaiarsa, 1994), local applications of the GABAA receptor agonist muscimol evoked bicuculline-sensitive Ca2+ transients that were very similar to those associated with the ENOs (Fig. 11A). The amplitude of the muscimol-evoked Ca2+ transients varied from 60 to 500 nM (mean, 250 ± 19.8 nM; n= 42 cells, 8 slices). By applying muscimol in the bath for 30-60 s, an estimate could be made of the relative number of cells that exhibited evoked Ca2+ transients versus those that participated in the spontaneous ENOs. Virtually all neurones (all of 236 cells at P1-P6 and 114 out of 126 cells tested at P7-P12) involved in the ENOs responded with a Ca2+ transient when challenged with muscimol. The efficacy of muscimol in producing an increase in [Ca2+]i decreased with development (Fig. 11B). After P3 muscimol became gradually less effective and at the beginning of the third postnatal week little (< 10 nM) or no increase in somatic [Ca2+]i was produced. Interestingly, after P2 there was a close correlation between the developmentally regulated reduction in amplitudes of the ENO-related and the muscimol-evoked Ca2+ transients (Fig. 11B). This developmental shift most probably reflects a gradual reduction of the Cl− reversal potential from values more positive than the resting potential towards the mature hyperpolarizing levels (see, for example, Ben-Ari et al. 1989; Obrietan & van den Pol, 1995). Thus, over the first 2 postnatal weeks GABA gradually loses its depolarizing capacity whereas during the same time period there is a powerful development of the glutamatergic synaptic transmission in the hippocampus (Fig. 12, see also Hosokawa, Sciancalepore, Stratta, Martina & Cherubini, 1994; Durand et al. 1996; Liao & Malinow, 1996).
Figure 11. Similarity of muscimol-evoked and spontaneous ENO-associated Ca2+ transients.
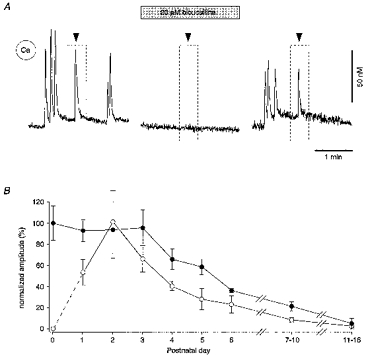
A, both the ENO-related Ca2+ transients and the Ca2+ transients induced by muscimol were reversibly blocked by bicuculline (20 μM). Muscimol (10 μM) was pressure-ejected (300 ms; pressure, 70 kPa) locally from an application pipette at the times indicated by the arrowheads (see boxed regions). Recording from a single neurone in an active slice obtained from a rat at P3. B, plot of the peak amplitude of the Ca2+ transients elicited by bath application (30-60 s) of 20 μM muscimol (•) in slices from rats at different ages. Each point represents the mean value from 2-8 slices and each slice was represented by the mean value from 19-52 pyramidal neurones. The amplitudes were normalized with respect to the mean response obtained at P0. For comparison, the plot of the peak amplitude of the ENO-associated Ca2+ transients as a function of age (taken from Fig. 4B) is superimposed (○).
Figure 12. The mechanism of excitatory synaptic transmission in the hippocampus shifts from GABA to glutamate mediated during the first 2 postnatal weeks.
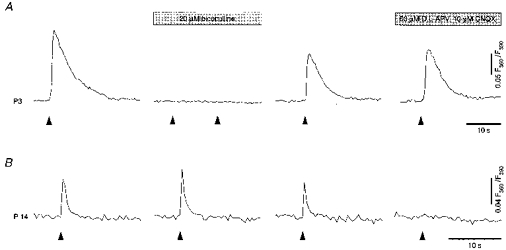
A, Ca2+ transients evoked by single-shock synaptic stimulation in a fura-2 AM-loaded CA1 pyramidal neurone (P3) are blocked by bicuculline but are not affected by CNQX + d,l-APV. B, Ca2+ transients evoked by single-shock synaptic stimulation at the end of the second postnatal week (P14) are insensitive to bicuculline but are abolished by CNQX + D,L-APV. Stimulation pipettes were positioned in the stratum radiatum approximately 100 μm away from the cell bodies. Each arrowhead represents a single-shock synaptic stimulation. These experiments were performed at room temperature to minimize interference from spontaneous activity.
This developmental shift in the ability of GABA versus glutamate to excite the pyramidal cells is illustrated in Fig. 12. At the beginning of the first postnatal week a single-shock synaptic stimulation produced a Ca2+ transient that was reversibly blocked by bicuculline (Fig. 12A). In contrast, a single-shock synaptic stimulation at the end of the second postnatal week produced a Ca2+ transient that was unaffected or enhanced by bicuculline, but blocked completely by a combination of CNQX and d,l-APV.
DISCUSSION
In the present study we describe the developmental profile and identify the synaptic origin of the slow network oscillations detected throughout the CA1 region of the hippocampus during early postnatal development. The hippocampal ENOs possess features that make them distinct from other examples of early spontaneous neuronal activity in different brain regions. Specifically, they consist of bursts of intracellular Ca2+ transients, they occur synchronously in almost the entire population of the CA1 pyramidal cells and interneurones, and they exhibit a characteristic developmental profile appearing at P1, peaking at P2 and gradually decreasing in potency during the following days until P14, when they disappeared.
Properties of the early network oscillations
Early in development, when sensory systems and functional connections between different regions in the nervous system are still poorly developed, spontaneous forms of correlated neuronal activity seem to control activity-dependent neuronal development (cf. Katz & Shatz, 1996). The hippocampal ENOs recurred continuously at a slow rate of 1-15 min−1 over a time period of up to 6 h, suggesting that they represent a form of on-going activity present in developing hippocampus throughout the first postnatal weeks. The ENO-associated Ca2+ signals were recorded simultaneously in more that 100 individual cells and were roughly synchronous over hundreds of micrometres, suggesting that the ENOs occur synchronously in the whole population of CA1 neurones. The ENOs gave rise to bursts of intracellular Ca2+ transients that were detected in 85 % of the pyramidal cells and 70 % of the interneurones in stratum oriens and stratum radiatum. These correlated Ca2+ bursts represent a hallmark of the ENOs, and are not characteristic for other types of early network activity. The peak amplitudes of the ENO-associated Ca2+ transients reached levels of up to 1.5 μM (up to 91 % of the change in ΔF/F measured with fura-2). Moreover, each ENO-associated Ca2+ burst represented a cluster of two to fourteen such Ca2+ transients, thus causing a profound and long-lasting increase in the [Ca2+]i in each particular cell.
The properties described above clearly distinguish the ENOs from other known forms of early correlated neuronal activity (Yuste et al. 1992, 1995; Gu et al. 1994; O'Donovan et al. 1994; Wong et al. 1995; Feller et al. 1996), which usually occur in subpopulations of cells, so-called neuronal domains (Yuste et al. 1992, 1995; Feller et al. 1996), are much less frequent (Yuste et al. 1992; Gu et al. 1994) and/or are associated with rather moderate increases in [Ca2+]i (Yuste et al. 1992, 1995; Wong et al. 1995).
Recently, correlated rises in [Ca2+]i were also shown to occur in the CA3 region of the neonatal hippocampus (Leinekugel et al. 1997). They were strictly associated with GABA-mediated GDPs, discovered by the same group earlier (Ben-Ari et al. 1989). Although synchronous Ca2+ oscillations in the CA3 region were shown only in a few adjacent pyramidal cells (Leinekugel et al. 1997), other data suggested that this activity involves a large population of neurones. Thus, the underlying GDPs can be recorded extracellularly (Ben-Ari et al. 1989) and they are synchronous between pairs of CA3 pyramidal cells (Ben-Ari et al. 1989; Leinekugel et al. 1997) as well as between interneurones and pyramidal cells (Khazipov, Leinekugel, Khalilov, Gaiarsa & Ben-Ari, 1997). In agreement with this evidence, we have also found ENO-like activity in the CA3 region of the neonatal hippocampus (E. Hanse, O. Garaschuk, J. Eilers & A. Konnerth, in preparation). This activity has very similar properties to those described here for the CA1 region. Moreover, we observed a tight synchrony between the ENO-associated Ca2+ bursts in the CA1 and in the CA3 region. Surprisingly, however, the spontaneous Ca2+ oscillations in the CA3 region and the ENOs in CA1 region were observed even when the two regions were surgically separated (Khazipov et al. 1997 and this paper, respectively). These observations suggest that both the CA3 and CA1 regions possess endogenous pacemaking capabilities to sustain the ENOs.
In contrast to the findings in region CA3 (Ben-Ari et al. 1989), field potential recordings in region CA1 failed to reveal detectable changes correlated with the optically recorded ENOs. This may be one of the reasons why ENOs have not been detected previously in the CA1 region. Moreover, in contrast to the single, regularly occurring spontaneous GDPs or GDP-associated Ca2+ transients reported for CA3 (Ben-Ari et al. 1989; Leinekugel et al. 1997), ENOs in the CA1 region were associated with bursts of GDPs and accompanying Ca2+ bursts. This discrepancy may be explained by the developmental profile of the ENOs. Indeed, as shown in the present paper, the burst-like high-amplitude activity is present in the neonatal hippocampus only until P4 while later on it gradually transforms into a regular, more frequent, but low-amplitude activity.
Synaptic origin of the ENOs
The hippocampal ENOs were blocked by TTX and by lowering the bath temperature to 20-22°C, and they were sensitive to antagonists of GABAA, NMDA and non-NMDA receptors. However, only TTX and the GABAA antagonist bicuculline were capable of abolishing spontaneous Ca2+ transients completely. The NMDA and non-NMDA receptor antagonists effectively blocked the synchronously occurring ENOs but not the asynchronous Ca2+ transients in individual neurones. In individual CA1 pyramidal cells the ENOs were associated with barrages of postsynaptic currents that were almost entirely carried by chloride ions. Furthermore, brief pressure applications of the GABAA receptor agonist muscimol produced Ca2+ transients that were strikingly similar to those associated with the ENOs. The critical role of depolarizing GABAergic transmission for the generation of ENOs was further supported by the observation that the developmental decrease in GABA-mediated depolarization was correlated with the decrease in the potency of ENOs. Beyond the end of the second postnatal week, neither GABA-mediated depolarization nor ENOs were any longer detected.
Based on these observations we conclude that the hippocampal ENOs represent a synaptically mediated network activity that relies on the synergistic activation of depolarizing GABAergic and glutamatergic synapses. The major contribution of the glutamatergic synapses to the generation of the ENOs in the CA1 region appears to be at the level of the interneurones, since at this age excitation of the pyramidal cells is mediated predominantly by GABAA receptor channels. Indeed, ENO-associated barrages of synaptic currents mediated via glutamate receptor channels were recorded in interneurones from the stratum oriens in the CA1 region (E. Hanse, unpublished observations).
The synaptic mechanism of generation clearly distinguishes the ENOs from the spontaneous Ca2+ oscillations in the neocortex. The neocortical oscillations are triggered by a temperature drop of 3°C from 22 to 26°C (Yuste et al. 1995), they require connectivity via gap junctions and they involve IP3-mediated Ca2+ release from internal stores (Yuste et al. 1992; Kandler & Katz, 1995). In contrast, the Ca2+ oscillations in the developing retina are also synaptically mediated (Wong et al. 1995; Feller et al. 1996). However, the generation of retinal oscillations requires activation of acetylcholine receptors and it is insensitive to the potent and selective GABAA receptor antagonist SR95531 (Feller et al. 1996).
It is noteworthy that the pharmacological profile of ENOs shares many similarities with the pharmacological profile of the spontaneous GDPs in the CA3 region of the neonatal hippocampus (Ben-Ari et al. 1989; Gaiarsa et al. 1990). Both the ENO-associated Ca2+ bursts in the CA1 and the GDPs in the CA3 are blocked by bicuculline, d,l-APV and CNQX. The effect of CNQX, however, appears to differ between the two areas. The spontaneous GDPs recorded in single CA3 neurones were shown to be completely blocked by CNQX (Gaiarsa et al. 1990), whereas in individual CA1 pyramidal neurones there was a significant amount of spontaneous activity left in the presence of CNQX. There were also developmental differences in the action of bicuculline. In the CA3 region bicuculline blocked spontaneous GDPs only up to P5, but later on effectively induced interictal discharges (Ben-Ari et al. 1989). By contrast, the ENO-associated Ca2+ bursts in the CA1 region were effectively blocked by bicuculline up to P13 without induction of interictal discharges (n= 143 cells, 15 slices, P1-P13).
In general, however, the similarity in pharmacological profiles further supports our conclusion that both the GDPs in the CA3 and the ENOs in the CA1 region reflect similar underlying network activity, and that the early network oscillations represent an intrinsic feature of the whole neonatal hippocampus. This conclusion was recently supported by data of Strata et al. (1997) showing that during early postnatal development GDPs can be observed in hippocampal hilar interneurones, CA3 and CA1 pyramidal cells.
Developmental switch in the hippocampal oscillatory behaviour
Slow oscillations are known to occur in the hippocampus throughout all stages of postnatal development. However, while during early stages this activity is physiological and requires depolarizing GABAergic activity, at later stages of development slow oscillations are associated with a pathophysiological condition of the hippocampus. Thus, after the switch of GABAergic transmission from depolarizing to hyperpolarizing and after the maturation of the glutamatergic connectivity, GABAA receptor antagonists exert the opposite effect and induce an epileptogenic activity that resembles the ENOs (see below).
Where is the ‘pacemaker unit’ of the slow hippocampal oscillations located? In the neonate, according to the model of Strata et al. (1997), GDPs are driven from a network of interneurones in the hilus which are interconnected via gap junctions. Excitation from the hilar interneurones then spreads to the CA3 region and from there to other hippocampal regions (Strata et al. 1997). However, some data from the present and other studies are not easily reconciled with this model. Thus, (1) the GDPs are preserved in the isolated CA3 subfield of the neonatal hippocampal slice (Khazipov et al. 1997) showing that they do not require any external drive to occur, and (2) ENOs in the CA1 region persist after separation of the CA3 and CA1 regions (Fig. 1C and D) showing that the spread of activity from the CA3 region is not a necessary requirement for the generation of the ENOs in the CA1 region. These observations, however, do not exclude the possibility that there are multiple pacemakers in the developing hippocampus and that hilar interneurones (Strata et al. 1997) represent one of them.
The adult hippocampal region CA3 (but not CA1) preserves the potential capability to exhibit a slow oscillatory behaviour. This relies on the reciprocal excitatory connections between CA3 pyramidal cells. These connections are normally under powerful inhibitory control, but when inhibition is impaired, synchronized oscillatory discharges can be generated (cf. Prince & Connors, 1986). In the disinhibited adult hippocampal slice the slow interictal discharges are initiated in CA3 region and spread to the CA1 region (Wong & Traub, 1983), driven by the mature glutamatergic connections of the Schaffer collaterals. The electrical activity underlying these interictal epileptiform discharges exhibits striking similarities with the ENO-associated GDPs. Thus, this pathological activity consists of synchronous bursts of action potentials riding on depolarizing waves that have durations and occur at frequencies comparable to those of the ENO-associated GDPs (Wong & Traub, 1983; Ben-Ari et al. 1989).
A possible role of ENOs for maturation of glutamatergic neuronal network in the developing hippocampus
The glutamatergic synaptic network is poorly developed at birth and consists mostly of NMDA-receptor-based synapses that are ‘silent’ at resting membrane potentials (Durand et al. 1996; Liao & Malinow, 1996). These observations are further supported by our results showing that only 3 % of all spontaneous ‘unitary’ currents in CA1 pyramidal cells are glutamatergic at P1-P3. Thus, at these early stages of development, GABA-mediated EPSCs represent the only excitatory postsynaptic currents that are active at resting membrane potentials (see also Hosokawa et al. 1994). Furthermore, during the first postnatal days, synaptically evoked somatic Ca2+ transients were completely blocked by bicuculline (for observations in CA3 see Leinekugel, Tseeb, Ben-Ari & Bregestovski, 1995) and were not influenced by CNQX and d,l-APV. The glutamatergic neuronal network develops substantially during the following 2 weeks (Hosokawa et al. 1994; Durand et al. 1996; Liao & Malinow, 1996), and at the end of the second postnatal week similar synaptic stimulation evokes Ca2+ transients that are completely blocked by antagonists of glutamatergic transmission, as in the mature hippocampus.
It was recently reported that functional maturation of the glutamatergic neuronal network in the neonatal hippocampus is activity dependent and relies on the transformation of a silent precursor network into a transmitting one (Durand et al. 1996; Liao & Malinow, 1996). The ENOs are present in the hippocampus during the time of intense maturation of CA3-CA1 pyramidal cell synapses. They produce recurrent discharges in the presynaptic cells associated with strong depolarizations of the postsynaptic cells. Thus, the ENOs possess the properties believed to be required for the activity-dependent synaptic maturation. Indeed, we found that ENO-like activity causes functional induction of new conducting glutamatergic synapses and strengthening of existing ones through an long term potentiation-like mechanism (E. Hanse, O. Garaschuk, J. Eilers & A. Konnerth, in preparation).
Therefore, the early network oscillations described here represent a likely mechanism for controlling the formation of conducting glutamatergic synapses during early postnatal development. The principal difference between the ENOs and conventional afferent tetanic stimulation, which fails to produce any changes in the efficacy of excitatory synaptic transmission at this age (Harris & Teyler, 1984; Müller, Oliver & Lynch, 1989; Liao & Malinow, 1996), is the powerful ENO-mediated depolarization of the postsynaptic cell that is produced by the activation of excitatory GABAergic inputs.
Acknowledgments
The authors thank C. Schirra for excellent help with the RT-PCR, Drs F. Viana and C. S. Colwell for comments on the manuscript and N. Rothgerber and E. Eilers for technical help. This work was supported by grants from the Deutsche Forschungsgemeinschaft (SFB 246), the Human Science Frontiers Program, the Bundesministerium für Bildung, Wissenschaft, Forschung und Technologie to A. K.; E. H. was supported by the Swedish Medical Research Council.
References
- Ben-Ari Y, Cherubini E, Corradetti R, Gaiarsa JL. Giant synaptic potentials in immature rat CA3 hippocampal neurones. The Journal of Physiology. 1989;416:303–325. doi: 10.1113/jphysiol.1989.sp017762. [DOI] [PMC free article] [PubMed] [Google Scholar]
- Ben-Ari Y, Tseeb V, Raggozzino D, Khazipov R, Gaiarsa JL. γ-Aminobutyric acid (GABA): a fast excitatory transmitter which may regulate the development of hippocampal neurones in early postnatal life. Progress in Brain Research. 1994;102:261–273. doi: 10.1016/S0079-6123(08)60545-2. [DOI] [PubMed] [Google Scholar]
- Bochet P, Audinat E, Lambolez B, Crépel F, Rossier J, Iino M, Tsuzuki K, Ozawa S. Subunit composition at the single-cell level explains functional properties of a glutamate-gated channel. Neuron. 1994;12:383–388. doi: 10.1016/0896-6273(94)90279-8. [DOI] [PubMed] [Google Scholar]
- Boitano S, Dirksen ER, Sanderson MJ. Intercellular propagation of calcium waves mediated by inositol trisphosphate. Science. 1992;258:292–295. doi: 10.1126/science.1411526. [DOI] [PubMed] [Google Scholar]
- Cherubini E, Gaiarsa JL, Ben-Ari Y. GABA: an excitatory transmitter in early postnatal life. Trends in Neurosciences. 1991;14:515–519. doi: 10.1016/0166-2236(91)90003-d. [DOI] [PubMed] [Google Scholar]
- Collingridge GL, Gage PW, Robertson B. Inhibitory post-synaptic currents in rat hippocampal CA1 neurones. The Journal of Physiology. 1984;356:551–564. doi: 10.1113/jphysiol.1984.sp015482. [DOI] [PMC free article] [PubMed] [Google Scholar]
- Cornell-Bell AH, Finkbeiner SM, Cooper MS, Smith SJ. Glutamate induces calcium waves in cultured astrocytes: long-range glial signaling. Science. 1990;247:470–473. doi: 10.1126/science.1967852. [DOI] [PubMed] [Google Scholar]
- Curmi JP, Premkumar LS, Birnir B, Gage PW. The influence of membrane potential on chloride channels activated by GABA in rat cultured hippocampal neurons. Journal of Membrane Biology. 1993;136:273–280. doi: 10.1007/BF00233666. [DOI] [PubMed] [Google Scholar]
- Durand GM, Kovalchuk Y, Konnerth A. Long-term potentiation and functional synapse induction in developing hippocampus. Nature. 1996;381:71–75. doi: 10.1038/381071a0. 10.1038/381071a0. [DOI] [PubMed] [Google Scholar]
- Edwards F, Konnerth A, Sakmann B, Takahashi T. A thin slice preparation for patch clamp recordings from neurones of the mammalian central nervous system. Pflügers Archiv. 1989;414:600–612. doi: 10.1007/BF00580998. [DOI] [PubMed] [Google Scholar]
- Eilers J, Schneggenburger R, Konnerth A. Patch clamp and calcium imaging in brain slices. In: Sakmann B, Neher E, editors. Single Channel Recording. New York: Plenum Publishing Co.; 1995. pp. 213–229. [Google Scholar]
- Feller MB, Wellis DP, Stellwagen D, Werblin FS, Shatz CJ. Requirement for cholinergic synaptic transmission in the propagation of spontaneous retinal waves. Science. 1996;272:1182–1187. doi: 10.1126/science.272.5265.1182. [DOI] [PubMed] [Google Scholar]
- Freund TF, Buzsaki G. Interneurons of the hippocampus. Hippocampus. 1996;6:347–470. doi: 10.1002/(SICI)1098-1063(1996)6:4<347::AID-HIPO1>3.0.CO;2-I. [DOI] [PubMed] [Google Scholar]
- Gaiarsa JL, Corradetti R, Cherubini E, Ben-Ari Y. Modulation of GABA-mediated synaptic potentials by glutamatergic agonists in neonatal CA3 rat hippocampal neurons. European Journal of Neuroscience. 1990;3:301–309. doi: 10.1111/j.1460-9568.1991.tb00816.x. [DOI] [PubMed] [Google Scholar]
- Garaschuk O, Konnerth A. Quantitative calcium imaging in brain slices. In: Rizzuto R, Fasolato C, editors. Imaging Living Cells. Austin, TX, USA: Landes/Springer; 1997. in the Press. [Google Scholar]
- Garaschuk O, Yaari Y, Konnerth A. Release and sequestration of calcium by ryanodine-sensitive stores in rat hippocampal neurones. The Journal of Physiology. 1997;502:13–30. doi: 10.1111/j.1469-7793.1997.013bl.x. [DOI] [PMC free article] [PubMed] [Google Scholar]
- Goodman CS, Shatz CJ. Developmental mechanisms that generate precise patterns of neuronal connectivity. Cell. 1993;72:77–98. doi: 10.1016/s0092-8674(05)80030-3. [DOI] [PubMed] [Google Scholar]
- Gu X, Olson EC, Spitzer NC. Spontaneous neuronal calcium spikes and waves during early differentiation. Journal of Neuroscience. 1994;14:6325–6335. doi: 10.1523/JNEUROSCI.14-11-06325.1994. [DOI] [PMC free article] [PubMed] [Google Scholar]
- Hanse E, Garaschuk O, Konnerth A. Early network oscillations in the developing hippocampus. Society for Neuroscience Abstracts. 1996;22:1975. [Google Scholar]
- Harris KM, Teyler TJ. Developmental onset of long-term potentiation in area CA1 of the rat hippocampus. The Journal of Physiology. 1984;346:27–48. doi: 10.1113/jphysiol.1984.sp015005. [DOI] [PMC free article] [PubMed] [Google Scholar]
- Hosokawa Y, Sciancalepore M, Stratta F, Martina M, Cherubini E. Developmental changes in spontaneous GABAA-mediated synaptic events in rat hippocampal CA3 neurons. European Journal of Neuroscience. 1994;6:805–813. doi: 10.1111/j.1460-9568.1994.tb00991.x. [DOI] [PubMed] [Google Scholar]
- Kandler K, Katz LC. Neuronal coupling and uncoupling in the developing nervous system. Current Opinion in Neurobiology. 1995;5:98–105. doi: 10.1016/0959-4388(95)80093-x. [DOI] [PubMed] [Google Scholar]
- Katz LC, Shatz CJ. Synaptic activity and the construction of cortical circuits. Science. 1996;274:1133–1138. doi: 10.1126/science.274.5290.1133. [DOI] [PubMed] [Google Scholar]
- Khazipov R, Leinekugel X, Khalilov I, Gaiarsa J-L, Ben-Ari Y. Synchronization of GABAergic interneuronal network in CA3 subfield of neonatal rat hippocampal slices. The Journal of Physiology. 1997;498:763–772. doi: 10.1113/jphysiol.1997.sp021900. [DOI] [PMC free article] [PubMed] [Google Scholar]
- Lambolez B, Audinat E, Bochet P, Crépel F, Rossier J. AMPA receptor subunits expressed by single Purkinje cells. Neuron. 1992;9:247–258. doi: 10.1016/0896-6273(92)90164-9. [DOI] [PubMed] [Google Scholar]
- Leinekugel X, Medina I, Khalilov I, Ben-Ari Y, Khazipov R. Ca2+ oscillations mediated by the synergistic excitatory action of GABAA and NMDA receptors in the neonatal hippocampus. Neuron. 1997;18:243–255. doi: 10.1016/s0896-6273(00)80265-2. [DOI] [PubMed] [Google Scholar]
- Leinekugel X, Tseeb V, Ben-Ari Y, Bregestovski P. Synaptic GABAA activation induces Ca2+ rise in pyramidal cells and interneurons from rat neonatal hippocampal slices. The Journal of Physiology. 1995;487:315–321. doi: 10.1113/jphysiol.1995.sp020882. [DOI] [PMC free article] [PubMed] [Google Scholar]
- Liao D, Malinow R. Deficiency in induction but not expression of LTP in hippocampal slices from young rats. Learning and Memory. 1996;3:138–149. doi: 10.1101/lm.3.2-3.138. [DOI] [PubMed] [Google Scholar]
- Lopez MG, Artalejo AR, Garcia AG, Neher E, Garcia Sancho J. Veratridine-induced oscillations of cytosolic calcium and membrane potential in bovine chromaffin cells. The Journal of Physiology. 1995;482:15–27. doi: 10.1113/jphysiol.1995.sp020496. [DOI] [PMC free article] [PubMed] [Google Scholar]
- Müller D, Oliver M, Lynch G. Developmental changes in synaptic properties in hippocampus of neonatal rats. Developmental Brain Research. 1989;49:105–114. doi: 10.1016/0165-3806(89)90063-1. [DOI] [PubMed] [Google Scholar]
- Obrietan K, van den Pol AN. GABA neurotransmission in the hypothalamus: developmental reversal from Ca2+ elevating to depressing. Journal of Neuroscience. 1995;15:5065–5077. doi: 10.1523/JNEUROSCI.15-07-05065.1995. [DOI] [PMC free article] [PubMed] [Google Scholar]
- O'Donovan M, Ho S, Yee W. Calcium imaging of rhythmic network activity in the developing spinal cord of the chick embryo. Journal of Neuroscience. 1994;14:6354–6369. doi: 10.1523/JNEUROSCI.14-11-06354.1994. [DOI] [PMC free article] [PubMed] [Google Scholar]
- Plant T, Schirra C, Garaschuk O, Rossier J, Konnerth A. Molecular determinants of NMDA receptor function in GABAergic neurones of rat forebrain. The Journal of Physiology. 1997;499:47–63. doi: 10.1113/jphysiol.1997.sp021910. [DOI] [PMC free article] [PubMed] [Google Scholar]
- Prince DA, Connors BW. Mechanisms of interictal epileptogenesis. Advances in Neurology. 1986;44:275–299. [PubMed] [Google Scholar]
- Reichling DB, Kyrozis A, Wang J, MacDermott AB. Mechanisms of GABA and glycine depolarization-induced calcium transients in rat dorsal horn neurons. The Journal of Physiology. 1994;476:411–421. doi: 10.1113/jphysiol.1994.sp020142. [DOI] [PMC free article] [PubMed] [Google Scholar]
- Shatz CJ. Impulse activity and the patterning of connections during CNS development. Neuron. 1990;5:745–756. doi: 10.1016/0896-6273(90)90333-b. [DOI] [PubMed] [Google Scholar]
- Strata F, Atzori M, Molnar M, Ugolini G, Tempia F, Cherubini E. A pacemaker current in dye-coupled hilar interneurones contributed to the generation of giant GABAergic potentials in developing hippocampus. Journal of Neuroscience. 1997;17:1435–1446. doi: 10.1523/JNEUROSCI.17-04-01435.1997. [DOI] [PMC free article] [PubMed] [Google Scholar]
- Wong RK, Traub RD. Synchronized burst discharge in disinhibited hippocampal slice. I. Initiation in CA2-CA3 region. Journal of Neurophysiology. 1983;49:442–458. doi: 10.1152/jn.1983.49.2.442. [DOI] [PubMed] [Google Scholar]
- Wong RO, Chernjavsky A, Smith SJ, Shatz CJ. Early functional neural networks in the developing retina. Nature. 1995;374:716–718. doi: 10.1038/374716a0. [DOI] [PubMed] [Google Scholar]
- Yuste R, Nelson DA, Rubin WW, Katz LC. Neuronal domains in developing neocortex: mechanisms of coactivation. Neuron. 1995;14:7–17. doi: 10.1016/0896-6273(95)90236-8. [DOI] [PubMed] [Google Scholar]
- Yuste R, Peinado A, Katz LC. Neuronal domains in developing neocortex. Science. 1992;257:665–669. doi: 10.1126/science.1496379. [DOI] [PubMed] [Google Scholar]