

Abstract
Ventricular myocytes isolated from ferret or cat were loaded with the acetoxymethyl ester form of indo-1 (indo-1 AM) such that ∼75 % of cellular indo-1 was mitochondrial. The intramitochondrial indo-1 concentration was 0.5–2 mm.
Myocytes were also voltage clamped (membrane capacitance, Cm = 100 pF) and a typical wash-out time constant of cytosolic indo-1 by a patch pipette was found to be ∼300 s. Depolarizations to +110 mV produced graded and progressive cellular Ca2+ load via Na+-Ca2+ exchange.
During these relatively slow Ca2+ transients, cell contraction (ΔL) paralleled fluorescence ratio signals (R) such that ΔL could be used as a bioassay of cytosolic [Ca2+] ([Ca2+]c), where [Ca2+]CL is the inferred signal which is delayed by ∼200 ms from true [Ca2+]c.
In myocytes without Mn2+ quench, the kinetics of the total cellular indo-1 signal, ΔR (including cytosolic and mitochondrial components), match ΔL during stimulations at low basal [Ca2+]i. However, after progressive Ca2+ loading, ΔR kinetics deviate from ΔL dramatically. The deviation can be completely blocked by a potent mitochondrial Ca2+ uniport blocker, Ru360.
When cytosolic indo-1 is quenched by Mn2+, initial moderate stimulation triggers contractions (ΔL), but no change in indo-1 signal, indicating both the absence of cytosolic Ca2+-sensitive indo-1 and unchanged mitochondrial [Ca2+] (Δ[Ca2+]m). Subsequent stronger stimulation evoked larger ΔL and also ΔR. The threshold [Ca2+]c for mitochondrial Ca2+ uptake was 300–500 nM, similar to that without Mn2+ quench.
At high Ca2+ loads where Δ[Ca2+]m is detected, the time course of [Ca2+]m was different from that of [Ca2+]c. Peak [Ca2+]m after stimulation has an ∼1 s latency with respect to [Ca2+]c, and [Ca2+]m decline is extremely slow.
Upon a Ca2+ influx which increased [Ca2+]c by 0.4 μm and [Ca2+]m by 0.2 μm, total mitochondrial Ca2+ uptake was ∼13 μmol (l mitochondria)−1.
With Mn2+ quench of cytosolic indo-1, there was no mitochondrial uptake of Mn2+ until the point at which mitochondrial Ca2+ uptake became apparent. However, after mitochondrial Ca2+ uptake starts, mitochondria continually take up Mn2+ even during relaxation, when [Ca2+]c is low.
It is concluded that mitochondria in intact myocytes do not take up detectable amounts of Ca2+ during individual contractions, unless resting [Ca2+]c exceeds 300–500 nM. At high cell Ca2+ loads and [Ca2+]c, mitochondrial Ca2+ transients occur during the twitch, but with much slower kinetics than those of [Ca2+]c.
Ca2+ is a ubiquitous second message for cell functions, such as excitation-contraction coupling in myocytes (Bers, 1991), transmitter secretion in neuron and endocrine cells (Augustine & Neher, 1992) and gene expression (Hardingham, Chawla, Johnson & Bading, 1997). In cardiac myocytes, excitation-contraction coupling is controlled by cytosolic Ca2+ ions, which are in turn affected by endogenous passive buffers (Berlin, Bassani & Bers, 1994) and by several Ca2+ influx and efflux mechanisms including Ca2+ channels, sarcoplasmic reticulum Ca2+ pump, Na+-Ca2+ exchanger, sarcolemmal Ca2+-ATPase and mitochondrial Ca2+ uptake (Bers, 1991).
It has been known since the 1950s that isolated mitochondria in vitro can take up Ca2+ (for reviews, see Crompton, 1990; McCormack & Denton, 1993; Gunter, Gunter, Sheu & Gavin, 1994; Hansford, 1994). Subsequently it has been found that mitochondrial Ca2+ uptake in intact cells may be different from that in vitro (Hansford, 1994). More recently, novel techniques have been developed to measure mitochondrial Ca2+ uptake in intact cells (Thayer & Miller, 1990; Rizzuto, Simpson, Brini & Pozzan, 1992; Friel & Tsien, 1994; Hajnoczky, Robb-Gaspers, Seitz & Thomas, 1995; White & Reynolds, 1995; Herrington, Park, Babcock & Hille, 1996; Jou, Peng & Sheu, 1996) including heart cells (Miyata, Silverman, Sollott, Lakatta, Stern & Hansford, 1991; Wendt-Gallitelli & Isenberg, 1991; Bassani, Bassani & Bers, 1992, 1993, 1994a,b; Chacon, Ohata, Harper, Trollinger, Herman & Lemasters, 1996). Although there are considerable differences among these studies, all found mitochondrial Ca2+ uptake under some experimental conditions.
Cellular ATP production is mainly by mitochondria. At least three mitochondrial enzymes, which might regulate the rate of ATP production, are dependent on [Ca2+] in the physiological range. Thus, in addition to cytosolic Ca2+ buffering, it has been suggested that the physiological function of mitochondrial Ca2+ uptake is as a key regulator of ATP production (Crompton, 1990; Duchen, 1992; McCormack & Denton, 1993; Gunter et al. 1994; Hansford, 1994; Brandes & Bers, 1997). Cellular Ca2+ overload can also cause a sudden mitochondrial permeability transition, and release reactive oxygen species, which are toxic and can cause cell injury or death (Gunter et al. 1994). Thus, the mechanisms and regulation of mitochondrial Ca2+ uptake are important for both physiology and pathology in all kinds of cells.
In a study of rat ventricular myocytes by Miyata et al. (1991), mitochondrial free Ca2+ concentration, [Ca2+]m, was directly measured using the Ca2+-sensitive fluorescent probe indo-1, after quenching of cytosolic indo-1 by addition of extracellular Mn2+. They found a significant increase in [Ca2+]m upon physiological stimulation, implicating a physiological role of mitochondria in Ca2+ sequestration. Although these results provide much useful information about mitochondrial Ca2+ uptake in intact heart cells, there are at least three important issues remaining. The first issue concerns the use of Mn2+ to quench cytosolic indo-1 (i.e. intracellular Mn2+ may affect mitochondrial Ca2+ uptake; Gavin, Gunter & Gunter, 1990; Hansford, 1994, Chacon et al. 1996). Thus, it is important to examine mitochondrial Ca2+ uptake under Mn2+-free conditions. The second issue is that Miyata et al. (1991) found the build-up of [Ca2+]m required many repeated field stimulations. Because the increase in [Ca2+]m during each twitch was too small to be resolved, it is not clear yet what the rate of mitochondrial Ca2+ uptake in the intact cell is. The third issue is the temporal relationship between cytosolic [Ca2+] ([Ca2+]c) and [Ca2+]m recorded at the same time in the same cell. Thus, the main aims of the present study are to address all of these three issues.
In previous work from our laboratory, Bassani et al. (1992, 1993, 1994a) used cytosolic indo-1 and pharmacological dissections to infer that at a [Ca2+]c of 1 μm, mitochondrial Ca2+ uptake from the cytosolic Ca2+ was at a rate of ∼1 μmol (l cytosol)−1 s−1 (or 2 μm s−1 referred to mitochondrial volume). Indeed, they found that mitochondria are responsible for less than 1–2 % of Ca2+ removal from the cytoplasm during relaxation of a normal twitch (Bassani et al. 1994a). Although these data are useful, all mitochondrial transport was estimated indirectly from cytosolic indo-1 signals. In the present work we have developed a method to heavily and preferentially load mitochondria with indo-1 AM. This allows direct measurements of fluorescence signals from mitochondrial indo-1. We took advantage of the strong Na+-Ca+ exchanger to bring Ca+ into the cell to varying levels under voltage clamp control. Under these conditions we were able to detect substantial Ca2+ uptake by mitochondria, but only after progressive loading of cells with Ca2+ (and elevation of resting [Ca2+]c). The increase in [Ca2+]m could even be detected in the presence of small contamination by cytosolic indo-1. To simultaneously monitor pure [Ca2+]m and [Ca2+]c, Mn2+ was used to quench cytosolic indo-1. We also used cell contraction as a bioassay for [Ca2+]c and refer to it as [Ca2+]CL to distinguish it from [Ca2+]c derived from the indo-1 signal. We found peak [Ca2+]c preceded peak [Ca2+]m by ∼1 s, and the kinetics of [Ca2+]m were substantially different from [Ca2+]c.
METHODS
Cells and solutions
Single ventricular myocytes were prepared, as described elsewhere, from hearts of either adult ferret (Bassani et al. 1994b) or adult cat (Wu, Vereecke, Carmeliet & Lipsius, 1991). Briefly, animals were anaesthetized with sodium pentobarbitone (50–75 mg kg−1, i.p.) and hearts were removed and perfused with collagenase and pronase. The isolated cells were kept in Dulbecco's modified Eagle's medium (Gibco, for ferret cells) or standard Tyrode solution (for cat cells) prior to experimental use the same day. Before use cells were re-plated in the experimental chamber containing standard Tyrode solution. Single chromaffin cells were prepared from calf adrenal glands (obtained from a local abbatoir) as described by Artalejo, Elhamdani & Palfrey (1996).
The standard external Tyrode solution contained (mm): 140 NaCl, 6 KCl, 1 MgCl2; 2 CaCl2, 10 glucose, 10 Hepes; pH 7.4. In some experiments, 0.7 mm MnCl2 was added to the standard Tyrode solution to quench the cytosolic indo-1. The bath solution for measurement of minimal indo-1 fluorescence ratio (Rmin) was the same as standard Tyrode solution, except 2 mm Ca2+ was replaced with 1 mm EGTA to yield a Ca2+-free (0 Ca2+) solution. For maximal fluorescence ratio (Rmax) the bath solution contained (mm): 110 KCl, 1 MgCl2, 30 BDM (2,3-butanedione monoxime), 10 glucose, 0.1 EGTA, 10 Hepes; pH 7.4. Digitonin (10 μm) and 3 mm CaCl2 were added during Rmax test. BDM was added to inhibit myocyte hypercontracture at high [Ca2+].
The standard, internal, pipette solution contained (mm): 80 caesium methanesulphonate, 40 CsCl, 6 NaCl, 0.1 EGTA, 1 MgCl2, 10 Hepes, 0.3 GTP, 10 ATP; pH 7.2. In some experiments, 1 mm indo-1 salt, 10 mm EGTA and/or 0.2–2 μm Ru360 were added to the internal solution. All experiments were done at room temperature (22°C).
Isolation of ferret heart mitochondria and measurement of Ca2+ uptake
Animals were anaesthetized with 30 mg pentobarbitone (kg body weight)−1 (i.p.). Hearts were excised, rinsed in ice-cold saline, and the atria and aorta were trimmed off. The ventricles were immersed in isolation medium containing 180 mm KCl, 10 mm EGTA and 0.5 % bovine serum albumin, pH 7.4. Mitochondria were isolated according to ‘procedure B’ described by Matlib, Vaghy, Rouslin & Schwatz (1984). Protein concentration was determined by the Lowry method. The rate of Ca2+ uptake into isolated mitochondria was measured spectrophotometrically using the differential absorption of arsenazo III (Sigma; 675 nm vs. 685 nm) in an Aminco dual-beam and dual-wavelength spectrophotometer as described previously (Vaghy, Johnson, Matlib, Wang & Schwartz, 1982). The assay was carried out at 37°C in 3 ml medium containing (mm): 120 KCl, 10 Mops-KOH buffer (pH 7.2), 2 potassium phosphate buffer (pH 7.2), 5 potassium malate, 5 potassium pyruvate, 0.05 arsenazo III; with 1 mg mitochondrial protein. The uptake of Ca2+ was started with the injection of 16.67 μm CaCl2 into the assay cuvette, which was continuously stirred. Ru360 was added 1 min before the addition of CaCl2.
Preparation of Ru360
Ru360 was prepared according to a procedure similar to that of Ying, Emerson, Clarke & Sanadi (1991). Details of the chemical structure and specificity of action on Ca2+ uptake into mitochondria will be published elsewhere (Matlib et al. 1998).
Electrophysiology and data acquisition
Standard whole-cell recording techniques and an Axopatch-1B amplifier (Axon Instruments) were used for all electrophysiological recordings. Pipette-cell access resistance (Racc) was routinely monitored by manual compensation. Except for the double whole-cell clamp experiments and indo-1 wash-out experiments (see Fig. 2), we did not try to control the access resistance, as long as it was below 20 MΩ. In the experiments of Fig. 2, to quantify the time constant of indo-1 wash-out or wash-in, we used larger pipettes (∼2 MΩ) and maintained Racc constant and below 5 MΩ during prolonged whole-cell dialysis.
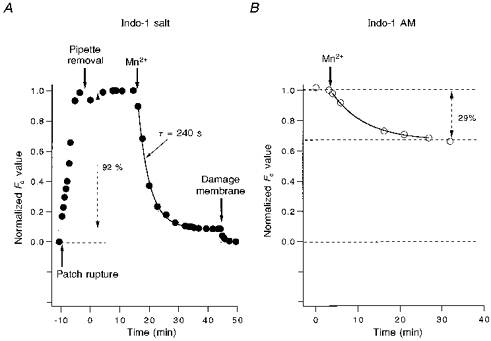
Figure 2. Time course of whole-cell dialysis of indo-1 via patch pipette.
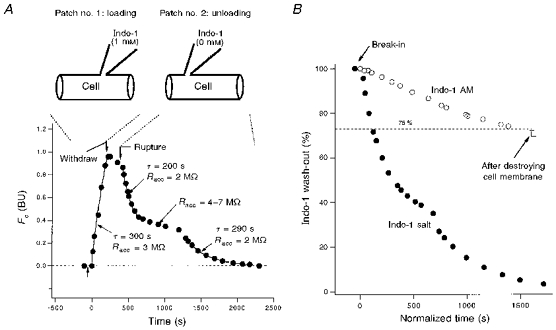
A, loading and unloading of indo-1 salt by double whole-cell dialysis in a cat ventricular myocyte. The cell was first loaded with indo-1 salt by patch pipette no. 1 (containing 1 mm indo-1). After partial loading, the first pipette was removed. Then the preloaded indo-1 was washed out by a second ruptured patch pipette, no. 2 (containing no indo-1). This experiment provides quantitative data for the time course of whole-cell dialysis in ventricular myocytes. See text for details. B, complete wash-out of cytosolic indo-1 by whole-cell dialysis in another cat cell. This cell (Indo-1 AM, ○) was preloaded by the standard indo-1 AM method. To assay the cytosolic fraction of indo-1, the whole cell was dialysed with a pipette containing no indo-1. After ≈2000 s, only 25 % of the dye was washed out. According to A, cytosolic indo-1 should already be completely washed out at this time. Breaking the cell membrane by patch pipette does not reduce the dye further (±, last two data points), indicating that all cytosolic indo-1 had been washed out. Thus the cytosol contains only 25 % of the total indo-1, while the rest (75 %) is in cell organelles. The cell in A is displayed again in B (Indo-1 salt, •) together with the indo-1 AM cell. Note that time in B is normalized by eqn (11a), which allows the cytosolic wash-out times to be comparable for the two cells.
The holding potential was always -40 mV. Two kinds of depolarization pulses were used. To evoke rapid Ca2+ influx through voltage-gated Ca2+ channels, 200–400 ms pulses to +10 mV were used. Inactivation of Ca2+ channels limits Ca2+ influx with longer pulses. In addition, Ca2+ current run-down under whole-cell dialysis in ventricular cells makes it difficult to maintain Ca2+ influx during 20–60 min experiments. To overcome these limitations of Ca2+ channels, most experiments here use depolarization pulses to +110 mV, which allows Ca2+ entry through the Na+-Ca2+ exchanger in ventricular cells (Bers, 1991). The advantage of this type of stimulation is that there is no apparent inactivation or run-down of the Na+-Ca2+ exchanger under our experimental conditions. Thus, we can control the Ca2+ inflow simply by pulse duration in the range of 200–5000 ms.
Signals for whole-cell current, cell contraction (see below) and two indo-1 fluorescence signals were simultaneously recorded by a data acquisition system pCLAMP 6 (Axon Instruments) using an IBM-PC compatible computer (sampling rate, 125–500 Hz). Fluorescence and contraction signals were further low-pass filtered by binomial smoothing with Igor software (smooth factor, 10). Analysis was done on a Macintosh computer PowerBook 520c using IgorPro 2.04 software (WaveMetrics, Oregon, USA).
Indo-1 fluorescence microscopy
Fluorescence recording was similar to that previously described (Bassani et al. 1992), with an oil-immersion objective (Nikon Fluo 40/1.3). Light from a UV illuminator (75 W xenon, Oriel) passed through an excitation filter (360 ± 5 nm bandwidth) and was reflected into the objective by a 380 nm dichroic mirror (Chroma, Brattleboro, VT, USA). The emitted fluorescence was split by another dichroic mirror (440 nm) into two bandpass filters (400 ± 12 and 500 ± 12 nm). Optimizing the optical system gave a total indo-1 detection efficiency of about 36 % (not including light losses at the lens and coverslip).
To reduce the rate of indo-1 photobleaching, the UV light is normally blocked by a shutter under pCLAMP 6 software control. This allows exposure of the cell to UV light only during data acquisition. Photobleaching of cellular indo-1 is less than 10 % of initial indo-1 fluorescence after 500 s, which is the maximum exposure time during these experiments.
Procedure for indo-1 AM loading
Cells were loaded with indo-1 either by a patch pipette containing indo-1 salt, or by incubation with Tyrode solution containing 5 μm indo-1 acetoxymethyl ester (indo-1 AM; Molecular Probes). The procedure for indo-1 AM loading is designed to load indo-1 AM preferentially and heavily into mitochondria. Before indo-1 AM loading, cells were plated on a laminin-coated chamber with a coverslip glass bottom. Then, 500 μl Tyrode solution containing 5 μm indo-1 AM was incubated with the cells for 40–75 min at 37°C. This condition loads the cell with a final intracellular indo-1 concentration of ∼0.5–1 mm (estimated by comparison with steady-state fluorescence signal in cells loaded by patch pipette containing 1 mm indo-1 salt). We found that at 37°C indo-1 loading speed was > 5 times faster than that at 23°C. Higher incubation temperature (37°C) may also help in preferentially loading organelles such as mitochodria (Malgaroli, Milani, Meldolesi & Pozzan, 1987). In addition to temperature, the following factors were also important for indo-1 AM loading. (1) The cell density strongly affects indo-1 AM loading. Low cell density helps indo-1 loading. (2) Longer loading time gives a higher loading level. (3) Addition of Pluronic F-127 (Molecular Probes; 1: 10 dilution in the 1 mm indo-1 AM stock) was necessary for stable and heavy indo-1 AM loading. Indo-1 AM loading solution examined under the microscope showed that most of the fluorescence comes from small (1–2 μm diameter) fluorescence spheres in the absence of Pluronic F-127. However, in Pluronic-containing indo-1 AM stock, fluorescence was evenly distributed.
Isosbestic indo-1 signals
When [Ca2+] is increased, indo-1 fluorescence emission is increased at 400 nm and decreased at 500 nm. Theoretically there is no Ca2+ sensitivity at ∼440 nm for indo-1 emission. A Ca2+-insensitive, isosbestic signal (Fc) is very useful because it is directly proportional to the concentration of the intracellular dye. However, in most cases the two fluorescence signals were both sensitive to Ca2+. For fura-2, Zhou & Neher (1993a) introduced a method to extract an Fc signal from the two Ca2+-sensitive fluorescence signals. Here we extend this method to indo-1 with the following formula:
| (1) |
where F400 and F500 are indo-1 emission signals at 400 nm and 500 nm wavelengths, respectively, and α is the ‘isocoefficient’ for the indo-1 set-up. The value of α is sensitive to the optical system including the Ca2+ dye. However, for a given set-up with fixed optical hardware conditions, α is constant for different intracellular indo-1 concentrations, for different cells of same cell types, and even for different cell types. Figure 1 shows how α is determined in a ventricular myocyte. Changes in F400 and F500 are shown in Fig. 1A, and the slope of their relationship in Fig. 1B is equivalent to -α. Figure 1A also shows that the calculated Fc signal is Ca2+ insensitive. The α value in Fig. 1 (1.0) was obtained with different settings than for most experiments reported here (where α = 0.23). As noted by Zhou & Neher (1993a), the α value may differ for different dye lot numbers, and α may also change due to slight changes of hardware properties. For these reasons the α value was checked frequently.
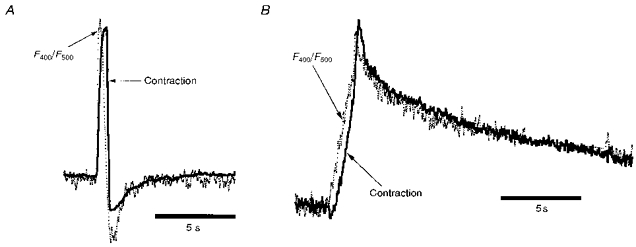
Figure 1. Ca2+-dependent and isosbestic fluorescence signals.
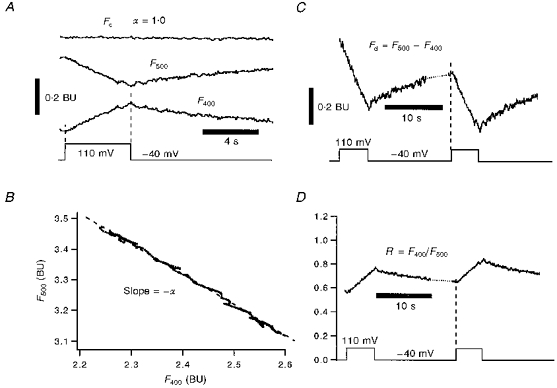
A, depolarization-induced indo-1 signals of F400 and F500 in a cat ventricular myocyte. Note both indo-1 signals are sensitive to Ca2+ influx: F400 increases in amplitude, while F500 decreases. The Ca2+-insensitive signal, Fc = F400+αF500, is a modified indo-1 signal from the two original indo-1 signals. Fc, F400 and F500 are in bead units (BU; see Methods). The isocoefficient, α, is determined in B. B, plot of F400vs. F500 during depolarization (marked by dashed lines in A) gives a linear regression line with slope -α = -1.0, where α is the ‘isosbestic coefficient’ of eqn (1) for our indo-1 system. C, one Ca2+-sensitive signal, Fd = F500 - F400. This has a high Ca2+ sensitivity and is useful because ΔFd is proportional to ΔCa2+-indo-1. D, second Ca2+-sensitive signal, R = F500/F400. R is the traditional ratio signal. All data are from the same cell and same pair of depolarization pulses.
Fluorescence beads (Fluorescence B/B beads, 4.5 μm; Polyscience, Warrington, PA, USA, Cat. No. 18340, Lot 400103) were used as a standard indo-1 fluorescence Fc unit, referred to as the bead unit (BU; Zhou & Neher, 1993b). The fluorescence amplitude of one standard bead is 1 BU, which is quite stable for at least 6 months when kept in the dark at 4°C.
Ca2+-sensitive indo-1 signals
We used two different Ca2+-sensitive indo-1 signals here. The first is the Ca2+-sensitive difference signal, Fd:
| (2) |
Since F500 decreases whilst F400 increases when indo-1 binds Ca2+, the sensitivity of Fd is the sum of its two components and is more sensitive than either F400 or F500. However, according to noise theory, the noise level is the same for F400, F500 and Fd. Thus, the signal-to-noise ratio of Fd is larger than that of F400 or F500. Nevertheless, the high sensitivity of Fd and its proportionality to Ca2+-bound indo-1 concentration makes it particularly useful in the estimation of Ca2+ influx into mitochondria (see below). The second Ca2+-sensitive indo-1 signal is the traditional fluorescence ratio (R = F400/F500). This signal is most convenient for calibration of free [Ca2+] (see below).
Correction of [Ca2+]c in the presence of compartmentalized indo-1
In indo-1 AM-loaded cells, indo-1 is present in both the cytosol and also in some cellular organelles. Thus, compartmentalized indo-1 can introduce potentially severe artifacts in [Ca2+]c measurement. However, if the compartment does not take up Ca2+, as in the case of cells treated with the mitochondrial Ca2+ uniport blocker Ru360, the contribution of this compartment can, in principle, be subtracted from the total fluorescence signal at each wavelength (as an additional background signal). We used the method described by Zhou & Neher (1993a) where the modified fluorescence ratio is Re = (F400 - F400b)/(F500 - F500b) where the subscript b refers to the value in the compartment. This can be rewritten in terms of directly measured values as (see Zhou & Neher, 1993a):
 |
(3) |
| (4) |
| (5) |
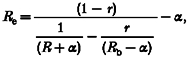
where R is the usual indo-1 fluorescence ratio, r is the fraction of total cellular indo-1 in the compartment, Fc and α are as defined in eqn (1), Rb is the R value of the compartment, and Fc,b is the Fc value of the compartment. In practice, the unknown compartmental parameter, Rb, is assumed to be the same as R before cell stimulation (i.e. at rest Rb = R). The initial value of r can be estimated from average cells by either dialysis of indo-1 out of the cytosol (or sarcolemmal permeabilization) or by quenching of cytosolic indo-1 by Mn2+ (see Results). It can also be determined in situ by rupturing the cell membrane at the end of the experiment (Zhou & Neher, 1993a):
| (6) |
where Rmax is the maximum R value when all cellular indo-1 is at very high [Ca2+] during calibrations. Rs is the measured R at very high [Ca2+]c when the cell membrane is ruptured by breaking the pipette seal and mitochondrial uptake is blocked by Ru360 (leading to irreversible contraction). It is assumed that the difference between Rs and Rmax is solely due to compartmentalized indo-1 which was not exposed to high [Ca2+]. The r value gradually increases during recording because whole-cell dialysis washes out part of the cytosolic indo-1 before the end of the experiment. To account for this effect, r is corrected according to the wash-out rate of indo-1 (see Fig. 2).
Calibration of intracellular [Ca2+]
The intracellular [Ca2+] is:
| (7) |
where Rmin, Rmax, Kd and β are calibration/system constants which are determined in the next paragraph. This [Ca2+]i is based on all of the intracellular indo-1 and represents a mixed signal from the cytosol and compartments (e.g. mitochondria). When there is no compartmental indo-1, cytosolic free [Ca2+], or [Ca2+]c, is equal to [Ca2+]i. When there is compartmental indo-1, but the compartmental uptake is prevented, [Ca2+]c can be estimated by:
| (8) |
where Re is defined by eqn (3). Note that eqn (8) is only valid when there are no Ca2+ changes in the compartment.
To calculate [Ca2+]i, one needs to know the four calibration constants of eqn (7). These can be measured by in situ calibration experiments in permeabilized cells with known [Ca2+] in the bath (Bassani, Bassani & Bers, 1995). Cells for calibration of Rmin, Rmax and α were heavily preloaded with indo-1 AM. Briefly, to measure Rmin, indo-1 AM-loaded cells were incubated in 0 Ca2+ solution (see ‘Cells and solutions’). Rmin was measured after resting [Ca2+]i fell to a minimum value (> 20 min). Rmin was 0.32 ± 0.02 (n = 6). In some experiments, 1 μm carbonyl cyanide p-trifluoromethoxyphenylhydrazone (FCCP) was added together with 10 μm digitonin to assess Rmin in mitochondria. We found that Rmin values were nearly identical for cells with or without FCCP or digitonin treatment. To determine Rmax from cytosol plus mitochondria, cells were first incubated in BDM solution (see ‘Cells and solutions’). R was measured after adding 10 μm digitonin and 4 mm CaCl2 to the bath. Rmax was 3.6 ± 0.2 (n = 5). The Rmin and Rmax from in vivo calibration were found to be the same for both cat and ferret ventricular myocytes. These calibration values were used for most of the experiments of the present work (where α = 0.23). Where α = 1.0, we found Rmin = 0.68 and Rmax = 6.31. A Kd of 0.844 μm for indo-1 was taken from previous intracellular estimates (Hove-Madsen & Bers, 1992; Bassani et al. 1995).
The last calibration constant in eqn (7) is β, which is calculated from the following (Zhou & Neher, 1993a):
| (9) |
where Rmin and Rmax are indo-1 constants determined by the in vivo calibrations and α is defined by eqn (1). According to eqn (9), β was 6.96 when α = 0.23, and 4.35 when α = 1.0.
Mn2+ quench of cytosolic indo-1
Cytosolic indo-1 can be selectively quenched by adding micromolar concentrations of Mn2+ to the bath (Miyata et al. 1991; Blatter, 1995) or the patch pipette (Tse, Tse & Hille, 1994), without appreciable quenching of the compartmentalized indo-1. To measure a pure mitochondrial Ca2+ signal, 0.4–0.7 mm MnCl2 was added to the extracellular Tyrode solution to quench cytosolic indo-1. In most cases, we found that 0.7 mm Mn2+ was needed to quench cytosolic indo-1 completely (see Results). This [Mn2+] is higher than previously reported data in rat ventricular myocytes, where 0.1 mm extracellular Mn2+ was sufficient to quench cytosolic indo-1. The two possible reasons for the higher concentration of Mn2+ required in the present study are the much heavier indo-1 load and the presence of a patch pipette which acts as a sink for slow Mn2+ entry.
Measurement of cellular [indo-1]
In the absence of Mn2+ quench, total indo-1 concentration, [indo]t, can be estimated by the Ca2+-insensitive fluorescence signal, Fc, which is proportional to the total number of intracellular indo-1 molecules. To convert Fc to [indo], Fc values in indo-1 AM-loaded cells are compared with Fc values in test cells loaded to a steady state using a patch pipette containing known concentrations of indo-1 salt. Thus, the [indo] of an indo-1 AM-loaded cell is:
| (10) |
where V and Fc are the cell volume and isosbestic indo-1 signal of the test cell, respectively, Vs and Fc,s are corresponding values of the standard calibration cell, and [indo]s is the concentration of indo-1 salt in the patch pipette for the calibration cell. k1 is the relative fraction of indo-1-accessible cell volume vs. the calibration cell. That is, since in the calibration cell indo-1 salt only has access to the non-mitochondrial space, which is ∼70 % of cell volume in ventricular myocytes (Bers, 1991), but to 100 % of the cell in indo-1 AM-loaded cells, then k1 = 0.7/1 = 0.7. Since cell volume is proportional to its membrane capacitance (Cm; Satoh, Delbridge, Blatter & Bers, 1996), Vs/V can be replaced with the corresponding Cm ratio. The value for k2 is 1.5, reflecting 50 % of indo-1 binding to cytosolic proteins (Blatter & Wier, 1990; Hove-Madsen & Bers, 1992). For a typical cell, Cm = 80 pF if [indo]s = 0.5 mm and Fc,s is ∼1 BU. Thus, if an indo-1 AM-loaded cell has a membrane capacitance of 100 pF and Fc = 1.12 BU, then the total intracellular [indo] is 0.49 mm:
Since Fc is proportional to the [indo], the decline in Fc during whole-cell dialysis or Mn2+ quench can easily be converted to indo-1 concentrations using eqn (10) and:
| (11) |
where [indo](t) and Fc(t) are the values at time t, and [indo](0) and Fc(0) are initial values.
In the presence of Mn2+ in the bath, the non-quenched intra-mitochondrial indo-1 concentration [indo]m can also be calculated using a variation of eqn (10) where k1 also reflects the 30 % of cell volume which is mitochondria, or k1 = 0.7/0.3 = 2.3.
In the case of whole-cell dialysis of indo-1, the wash-out time constant is dependent on cell volume and access resistance, Racc. To correct for cell to cell differences in Racc and cell size, the recording time can be normalized by (Pusch & Neher, 1988; Zhou & Neher, 1993a):
| (11a) |
where t is the original recording time, and tn is the normalized t for a ventricular cell. The cell size is reflected by the corresponding Cm (in pF). Racc is in megaohms, and 300 is the value for RaccCm for the standard cell in Fig. 2 (i.e. for Racc = 3 MΩ, Cm = 100 pF and tn = t).
Strategies for assay of mitochondrial [Ca2+]m
Real time mitochondrial Ca2+ uptake was detected by two different methods. The first method is based on comparing two Ca2+-sensitive signals of the cell (contraction and fluorescence of indo-1, as R) which are measured simultaneously during depolarization. The principle of this approach is that cell shortening reflects a purely cytosolic Ca2+ signal (see below), while the indo-1 signal reports a mixed Ca2+ signal from both cytosol and mitochondrial compartments (at least in the absence of Mn2+ or Ru360). Thus, any major kinetic difference between cytosolic [Ca2+]c and [Ca2+]m can be detected by superimposition of the two signals. The advantage of this method is that the cells are in nearly physiological solutions without exposure to Mn2+, which could potentially influence mitochondrial Ca2+ uptake (Gunter et al. 1994; Hansford, 1994). The disadvantage is that it is not particularly quantitative.
The second method is based on the selective quenching of cytosolic indo-1 by Mn2+ (Miyata et al. 1991). In this case, the non-quenched indo-1 (present only in mitochondria) provides a pure mitochondrial Ca2+ signal (as [Ca2+]m, using eqn (7)). Furthermore, a pure cytosolic [Ca2+] signal can be estimated using cell contraction as a ‘biosensor’ (see below). The advantage of this method is that the relationship between the [Ca2+]c and [Ca2+]m can be evaluated more quantitatively. The disadvantage of this method is the presence of Mn2+. However, the two methods are expected to produce complementary results and, therefore, both are used in the present work.
Assay of mitochondrial Ca2+ influx
Ca2+ influx into intracellular organelles (such as mitochondria) cannot be readily measured by membrane currents using voltage clamp. However, a new optical method using fura-2 has been used to measure transmembrane Ca2+ influx (independent of membrane current measurement; Zhou & Neher, 1993b). The method is based on the fact that Fd of eqn (2) is proportional to the total number of indo-1 molecules bound to Ca2+. Upon Ca2+ influx, the total amount of Ca2+ influx (QCa) is proportional to the change in Fd:
| (12) |
| (13) |
where QCaB is the fraction of Ca2+ influx bound by indo-1, and fmax is a calibration constant which converts the optical signal, ΔFd, into Ca2+ flux under the condition that indo-1 binds 100 % of Ca2+ influx (i.e. δ = 1). Because the endogenous Ca2+ buffers in cytosol or in mitochondria are finite, δ increases to 1 if [indo] is very high compared with endogenous buffers. The Ca2+ buffering capacity of indo-1, κB, is (Zhou & Neher, 1993a):
| (14) |
where Kd is the dissociation constant of indo-1. The total Ca2+ binding capacity, κ (bound: free) is:
| (15) |
where κS is the endogenous Ca2+ binding capacity. Combining eqns (12)-(15) gives:
| (16) |
| (17) |
Equation (17) allows the estimation of Ca2+ influx, QCa, at any [indo]. Thus, eqn (17) is an extended form of the Ca2+ influx equation given by Zhou & Neher (1993b), which applies only when κB≥κS. In ventricular myocytes, the cytosolic Kd of indo-1 is ∼3 times larger than Kd of fura-2 used by Zhou & Neher (1993a) in chromaffin cells, and cytosolic Ca2+ buffering, κS, is ∼2.5 times larger in myocytes than in chromaffin cells (Zhou & Neher, 1993a; Hove-Madsen & Bers, 1993; Berlin et al. 1994). Thus, it is prudent to use eqn (17) for QCa measurement in myocytes. To estimate mitochondrial QCa by ΔFd, we assumed that the two unknown parameters in eqn (17), Kd and κS, are the same in both cytosol and mitochondria. Thus, Kd = 0.84 μm and κS = 100 (Berlin et al. 1994). It is seen from eqns (14)-(17) that if κB >> κS, eqn (17) becomes QCa = ΔFd/fmax, which is independent of both Kd and κS. Thus, larger [indo] makes eqn (17) less dependent on assumptions of Kd and κS. In the present work, [indo]m is in the range 0.5–2 mm. When the cell is not progressively stimulated, [Ca2+]m is < 0.1 μm (see Results). Under these conditions, according to eqn (16), indo-1 will bind 90 % of Ca2+ influx, if the mitochondrial [indo]m is 1 mm.
The calibration constant fmax in eqn (17) can be determined by a special whole-cell patch clamp experiment in chromaffin cells, in which Ca2+ influx is purely from voltage-gated Ca2+ current, so that QCa can be measured by membrane current, assuming Kd of indo-1 is the same in both chromaffin cells and myocytes. With 2 mm indo-1 in the pipette, during whole-cell dialysis, depolarization pulses are applied to evoke Ca2+ influx. The ratio ΔFd/QCa is measured at each pulse. ΔFd/QCa increases within 60 s after ‘break-in’ of the patch, and then becomes constant (because after κB >> κS is reached, indo-1 will bind virtually 100 % of entering Ca2+, or δ = 1). The saturated ΔFd/QCa value is 0.005 BU pC−1, which is fmax for chromaffin cells. We did not use ventricular myocytes to estimate fmax, because sarcoplasmic reticulum (SR) Ca2+ flux and Na+-Ca2+ exchange may complicate QCa measured by Ca2+ current.
Since cardiac myocytes are large cells (100–150 μm long) and the fluorescence sensitivity is not completely uniform in the microscope field, fmax was also adjusted for this effect. The fluorescence bead signal is 25 % lower when moved 30 μm from the central point of the microscope. While the middles of cells are placed in the central point of the microscope field they are 10 times longer than the chromaffin cell diameter. Thus the fmax value from chromaffin cells is corrected to fmax = 0.0038 BU pC−1 when used to calculate mitochondrial Ca2+ influx in ventricular myocytes.
Cytosolic [Ca2+] measured by cell length ([Ca2+]CL)
Myocyte contraction was measured using a video-edge-detection system (Crescent Electronics, Sandy, UT, USA), and is shown as a shortening in length (ΔL). Contraction depends on [Ca2+]c, and the Ca2+ transients here activated by Na+-Ca2+ exchange are very slow. We have taken advantage of the steady-state [Ca2+]vs.ΔL relationship as determined by Bassani et al. (1995) to use ΔL as a bioassay for [Ca2+]c. The maximum cell length was measured after a long period of rest, and shortening (ΔL) is reported as a percentage of this maximum cell length (L0). The dependence of ΔL on [Ca2+] can be well described by a Hill equation with a Hill coefficient of 2 (ΔL = ΔLmax/{1 + (Kd,c/[Ca2+])2}). The [Ca2+] (μm) inferred from the ΔL signal ([Ca2+]CL) is then:
| (18) |
where [Ca2+]CL is [Ca2+]c estimated from cell contraction, Kd,c is the [Ca2+] at half-maximal contraction (0.8 μm) and ΔLmax is the maximum extent of cell shortening at very high [Ca2+] (ΔLmax = 37 % of resting cell length). Equation (18) assumes that before any stimulation, when the cell has its maximum length (L = L0, ΔL = 0%), resting [Ca2+]c = 0.07 μm.
Total cytosolic [Ca2+] ([Ca2+]c,t) can be estimated from [Ca2+]c (Hove-Madsen & Bers, 1993):
| (19) |
where Bmax is the total of endogenous Ca2+-binding sites (232 μmol (l cytosol)−1) and Kd,c,y is the apparent lumped dissociation constant (455 nM).
RESULTS
Fraction of indo-1 loaded into mitochondria
Strong mitochondrial fluorescence signals were obtained from cells plated at low density (24 000 ml−1) with 5 μm indo-1 AM for 1 h at 37°C, followed by ∼30 min in indo-1- free normal Tyrode solution at room temperature (23°C). Under these loading conditions a total intracellular indo-1 concentration of 0.5–1 mm was attained (based on cells loaded by dialysis with known concentrations of indo-1 salt, eqn (10)).
Figure 2A shows loading and wash-out of indo-1 salt via patch pipettes in a single ventricular myocyte. The cell was first loaded with indo-1 via ruptured patch for 2 min using a pipette containing 1 mm indo-1 salt. At this point the Ca2+-independent fluorescence signal (Fc) reached a value of ∼1 BU. Loading was then terminated by removal of the first patch pipette. This cell (and 5 of 12 other attempts) survived this step. The cell was then patch clamped with a second pipette containing the same filling solution, but without any indo-1. There was a small decline in Fc between the removal of the first pipette and patching with the second. This probably reflects redistribution of indo-1 in the cell, because the system is more sensitive to fluorescence in the centre of the field (and cell) than near the edges. Upon patch rupture with the second, indo-1-free pipette, the indicator washed out of the cell with an initial time constant of 200 s (for Racc = 2 MΩ). This indo-1 wash-out slowed when there was an increase in series resistance (4–7 MΩ), but was largely restored when Rs was returned to 2 MΩ by brief application of suction to the pipette. This 200–300 s time constant is about 10 times longer than required for adrenal chromaffin cells (Cm = 7 pF and cell volume = 1.7 pl), consistent with the ventricular myocytes being 10 times larger (80 pF, or ∼15 pl). While 100 % of the cytosolic indo-1 could be washed out of the ventricular myocyte, the process took ∼40 min. The experiments in Fig. 2A were done with 10 mm EGTA in the patch pipette to prolong cell viability. In cells in which cytosolic Ca2+ transients were occurring, this recording lifetime is generally shorter. For these reasons, the very long dialysis time required makes it impractical to completely remove cytosolic indo-1 prior to experiments to assess mitochondrial signals uncomplicated by cytosolic fluorescence. Thus, in the experiments described below using indo-1 AM-loaded cells during dialysis, it can be expected that fluorescence signals emanate from both cytosolic and mitochondrial indo-1.
The experiment in Fig. 2B shows assessment of intramitochondrial indo-1 loading using Fc. The cell was preloaded with indo-1 AM via the standard conditions above. After membrane break-in with an indo-1-free pipette, cytosolic indo-1 was washed out with a time course similar to that in Fig. 2A (reproduced as •), but only 25 % of the indo-1 appears to dialyse out of the cell after indo-1 AM loading. No further reduction in Fc was observed after the cell membrane was damaged by aggressive movement of the patch pipette (last two points in the trace, □). In eight cells, the average fraction of indo-1 which was inaccessible to the dialysing patch pipette was 75 % (range, 65–85 %). This suggests that 75 % of the indo-1 was compartmentalized and most of that is likely to be in mitochondria because it is sensitive to mitochondrial Ca2+ transport blockers (see below). Since mitochondria occupy ∼30 % of ventricular myocyte volume (Barth, Stammler, Speiser & Schaper, 1992), a total cellular [indo] of 0.5–1 mm corresponds to cytosolic and mitochondrial indo-1 concentrations of 0.17–0.35 mm and 1.2–2.5 mm, respectively.
Contraction and fluorescence signals induced by depolarization
Due to run-down of Ca2+ currents in long (30–50 min) experiments in ruptured patch, and a limited Ca2+ entry at each depolarization resulting from channel inactivation, we used strong depolarizations to +110 mV to produce Ca2+ influx via Na+-Ca2+ exchange (see Fig. 3). Ca2+ entry via Na+-Ca2+ exchange does not run down and the duration of the pulse can be varied to alter the amount of Ca2+ which enters the cell at each pulse. Indeed, under our conditions a 400 ms pulse to +110 mV brings in a similar amount of Ca2+ via Na+-Ca2+ exchange as does a 400 ms pulse to +10 mV via the Ca2+ current (before substantial Ca2+ current run-down). Note that in Fig. 3[Ca2+]i continues to rise during the depolarization, such that the pulse duration can be used to vary peak [Ca2+]i. Thus, a 2 s pulse to +110 mV can bring in up to 5 times as much Ca2+ as a 2 s pulse to +10 mV. It may be noted that the theoretical reversal potential for Na+-Ca2+ exchange is ∼0 mV under our experimental conditions. Also, +110 mV is close to the theoretical Ca2+ reversal potential, so little or no Ca2+ current is expected during these pulses. The inward holding current at -40 mV develops slowly upon cellular dialysis and can be blocked by extracellular tetraethylammonium (TEA). This current might be partly due to inward current through potassium channels (since there is no K+ inside but 6 mm K+ outside). While the large outward current during the pulse to +110 mV undoubtedly includes a substantial outward Na+-Ca2+ exchange current, we did not attempt to quantify that current flux explicitly here.
Figure 3. Ca2+ influx evoked by strong membrane depolarization.
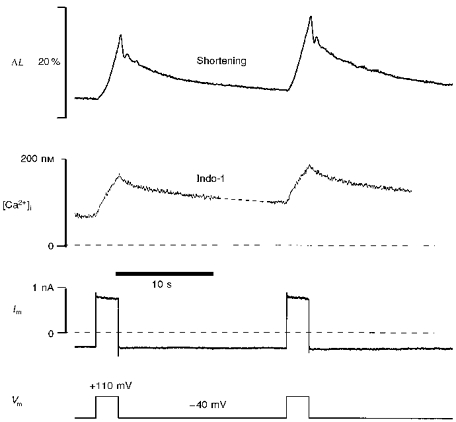
A cat ventricular myocyte was under whole-cell voltage clamp. Membrane potential (Vm) pulses induced cell shortening (ΔL), which was measured simultaneously with membrane current (Im) and intracellular Ca2+ concentration [Ca2+]i. [Ca2+]i was calculated from the indo-1 signal using eqn (7).
Figure 3 shows a typical example of two sequential 2.4 s pulses to +110 mV in a feline ventricular myocyte. Both the [Ca2+]i signal and cell contraction develop gradually during the depolarization pulses. The slow contraction (ΔL) and Ca2+ transient during pulses to +110 mV has another advantage for the present study. That is, contraction can be used to assess the purely cytosolic Ca2+ signal, whereas the fluorescence signal comes from indo-1 present in both the cytosol and the mitochondria. The slow rise and decline of [Ca2+]i limits the impact of the kinetic discrepancy between [Ca2+]i and contraction during normal excitation-contraction coupling (where peak [Ca2+]i occurs in < 100 ms). It should also be noted that the 170–350 μm cytosolic indo-1 concentration may slow the time course of the cytosolic Ca2+ signal.
Figure 4 shows normalized and superimposed ratios of Ca2+ signals (F400/F500) and contraction traces from two cat cells. Figure 4A shows a 200 ms depolarization to +10 mV where the Ca2+ transient is initiated primarily by a Ca2+ current and may include SR Ca2+ release. Figure 4B shows a 1.6 s pulse to +110 mV and is typical of the type used for most of the experiments reported here. While both traces show similar kinetics between indo-1 and contraction signals, it can be seen that the signals in Fig. 4B are closer in time course, particularly during the declining phase. The major difference is that the indo-1 signal appears to lead the ΔL signal by ∼200 ms (see Fig. 12A). Several factors may contribute to the delay between the rise in [Ca2+]i and ΔL (e.g. the chemical steps between Ca2+ binding to troponin C and cross-bridge power stroke, inertial and/or viscous components to cell shortening). Based on experiments described below (Figs 6 and 8), we believe that the indo-1 signals in Fig. 4 are due almost exclusively to cytosolic changes in [Ca2+]. This suggests that we can use cell contraction as a bioassay for cytosolic [Ca2+] under conditions where mitochondrial indo-1 fluorescence is changing.
Figure 4. Kinetic similarity of cytosolic [Ca2+] and cell shortening in ventricular myocytes.
A, contraction (ΔL) and F400/F500 signals evoked by Ca2+ influx via voltage-gated Ca2+ channels. A 200 ms depolarization from -40 to +10 mV was applied. B, ΔL and F400/F500 signals evoked by Ca2+ influx via the Na+-Ca2+ exchanger. A 1.6 s depolarization from -40 to +110 mV was applied. A and B are from two different cat cells, and ΔL and R signals are scaled vertically to allow superimposition. See text for details.
Figure 12. Delay of [Ca2+]m compared with [Ca2+]c.
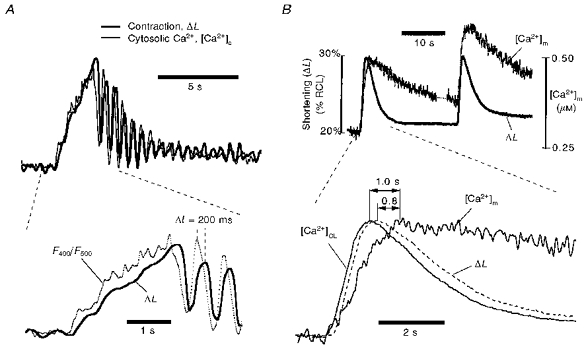
A, delay of cell contraction (ΔL) after depolarization-induced changes in cytosolic calcium concentration, [Ca2+]c (expanded version of part of Fig. 8). Note the oscillating peaks of [Ca2+]c, recorded by indo-1 fluorescence, precedes that of ΔL. The latency of ΔL is about 200 ms. Since Ru360 blocks mitochondrial Ca2+ uptake, F400/F500 reports only cytosolic Ca2+. There was no Mn2+ in the bath but 0.2 μm Ru360 in the pipette to block mitochondrial Ca2+ uptake. B, delay of mitochondrial [Ca2+]m after depolarization-induced cell contraction in another ferret cell without Ru360. Note the depolarization-induced [Ca2+]m is preceded by cell contraction (shown as percentage of resting cell length, RCL). The latency of [Ca2+]mvs. contraction was 0.8 s. Addition of the 200 ms delay between [Ca2+]c and contraction (A) makes the total delay of [Ca2+]mvs.[Ca2+]c about 1 s. Mn2+ (0.7 mm) was in the bath to quench cytosolic indo-1.
Figure 6. Mitochondrial Ca2+ uptake in a ventricular myocyte without Mn2+ quench.
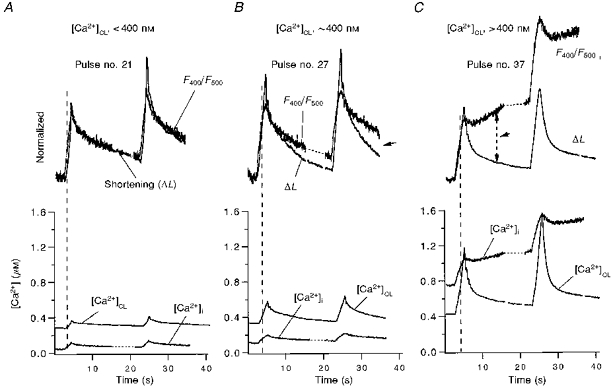
The cell was preloaded with indo-1 AM, so the total indo-1 signal has contributions from both cytosolic and mitochondrial indo-1. Intracellular [Ca2+] is estimated by both indo-1 R ([Ca2+]i or F400/F500) and by cell contraction ([Ca2+]CL or ΔL). A-C, Ca2+ signals upon progressive depolarization pulses no. 21, no. 27 and no. 37, respectively. To assess mitochondrial Ca2+ uptake in the upper traces, normalized F400/F500 is scaled and superimposed on ΔL. The difference between F400/F500 and ΔL (as marked by the arrows during the decay phase) is interpreted as the presence of mitochondrial Ca2+ uptake (see text for details). All data are from the same cat cell.
Figure 8. Block of mitochondrial Ca2+ uptake by Ru360.
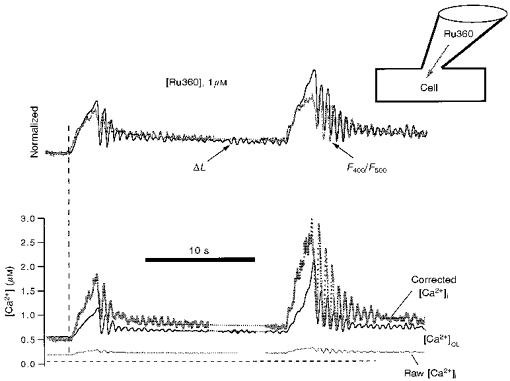
Experimental conditions in this cell are similar to that in Fig. 6C, except the specific mitochondrial uniporter antagonist Ru360 (1 μm) is included in the patch pipette, and thus dialysed into the cell. In contrast to Fig. 6, the differences between normalized ΔL and F400/F500 are completely blocked by Ru360 even after progressive Ca2+ load (n = 4). The Corrected [Ca2+]i (bottom) is cytosolic [Ca2+] estimated by indo-1 fluorescence after subtracting mitochondrial indo-1 fluorescence (eqns (3)-(8), see text for details).
Contraction as a biosensor for [Ca2+]c
For the slow contractions used here, [Ca2+]c can be ‘back’ calculated from the change in cell length (ΔL) using the modified Hill equation (eqn (18)). Resting cell length (L0) is taken as the cell length after a long period of rest before progressive loading pulses. The maximum degree of contraction (ΔLmax) was determined experimentally as the shortest stable contracture at the end of a series of very long depolarizations to +110 mV for > 5 s, but prior to hypercontracture associated with cell death. This maximal degree of contracture (ΔLmax = 37 ± 2 % of resting cell length, n = 15) was the same for cat and ferret cells. The relationship between ΔL and [Ca2+]c used here (Fig. 5A) was very similar to the steady-state relationship determined by Bassani et al. (1995) in a study of indo-1 calibration in ventricular myocytes. Figure 5B shows an example of [Ca2+]c calculated from the ΔL trace for two different depolarizing pulses. During the break in the record there were five additional pulses accounting for the decrease in resting cell length and increase in diastolic [Ca2+]c. In this cell cytosolic indo-1 was quenched with Mn2+ (see below), so there is no cytosolic Ca2+ signal from indo-1. Thus, cell contraction is the only indicator of [Ca2+]c.
Figure 5. Pure cytosolic free [Ca2+] estimated by contraction signal.
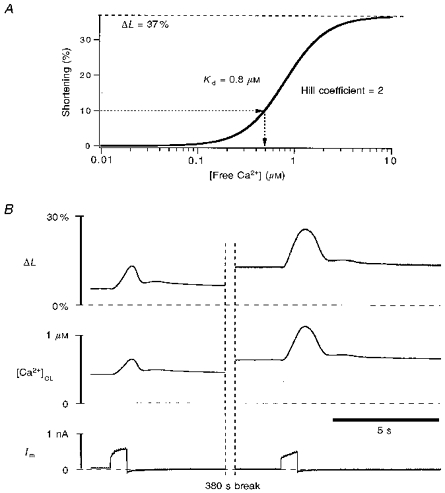
A, model of the Ca2+ dependence of cell contraction in ventricular myocytes, based on Bassani et al. (1995), with slight modification in parameters (see text and eqn (18)). This model was used in B for ‘back’ calculation of cytosolic [Ca2+]c. B, the ferret cell was stimulated by repetitive depolarization pulses to +110 mV, two of which are shown here. Not shown are five pulses during the 380 s break, which increased the resting Ca2+ level. The cytosolic Ca2+ is calculated from the contraction signal, ΔL, using eqn (18) as in A. The subscript ‘CL’ replaces ‘c’ for [Ca2+]c estimations based on cell length ([Ca2+]CL). The cytosolic indo-1 in this cell was quenched by 0.7 mm Mn2+ in the bath.
Mixed indo-1 signals and mitochondrial Ca2+ uptake in the absence of Mn2+
A first series of experiments was done in the absence of Mn2+ quench, when the indo-1 fluorescence signal comes from both cytosol and mitochondria. In this case we used the ΔL signal to assess the [Ca2+]c and compared the kinetics with those of the overall mixed indo-1 fluorescence signal. The three sets of traces in Fig. 6 represent different times during a long series of progressive Ca2+ loading pulses. The first pair of pulses were of 1.6 s duration (Fig. 6A). At this stage diastolic [Ca2+]c was less than 400 nM and the pulses produced normalized fluorescence signals (F400/F500) with kinetics which were superimposable with the ΔL signal (except for the usual delay of the rising phase). The global indo-1 signal ([Ca2+]i) predicts a much smaller Ca2+ transient than [Ca2+]c derived from the ΔL signal. We infer that the cytoplasmic Ca2+ transient must be greatly damped by either an unchanging low mitochondrial [Ca2+]i or one that is very much smaller in amplitude (but with the same kinetics).
There were six pulses between Fig. 6A and B, and the pulse duration for Fig. 6B was 2.4 s. As diastolic and peak [Ca2+]c increased, a difference in the kinetics of decline of the fluorescence F400/F500 signal became apparent. That is, relaxation still occured promptly upon repolarization, but there was a long tail of slowed F400/F500 decline. At this stage the diastolic [Ca2+]c was increased to ∼400 nM. The slower decline in F400/F500 could reflect an increase in mitochondrial [Ca2+] during the declining phase of the cytosolic [Ca2+]. This effect was even more dramatic after an additional eight pulses of 2.4 s, and further elevated diastolic [Ca2+]i to > 400 nM (Fig. 6C). In this case the global [Ca2+]i increased slowly while [Ca2+]c was declining, as evidenced by the cell relaxation. Similar results were observed in all nine cells studied with this protocol. These results suggest that mitochondrial Ca2+ uptake may be slow compared with [Ca2+]c decline. In addition, since most of the cellular indo-1 is in the mitochondria, the global [Ca2+]i signal should be very sensitive to mitochondrial [Ca2+] changes. This is consistent with changes in [Ca2+]ivs.[Ca2+]CL: [Ca2+]i < [Ca2+]CL in Fig. 6A and B, but [Ca2+]i > [Ca2+]CL in Fig. 6C. To confirm that the slowed decline of global [Ca2+]i during relaxation (or even [Ca2+]i increase) is really due to mitochondrial Ca2+ uptake, we performed additional experiments using the mitochondrial Ca2+ uniport inhibitor Ru360 in the pipette.
Mitochondrial Ca2+ uniport inhibitor Ru360
The action of Ru360 on the rate of Ca2+ uptake into isolated mitochondria was tested to determine its effectiveness in vitro. The rate of Ca2+ uptake into isolated mitochondria was inhibited by Ru360 in a concentration-dependent manner (Fig. 7). The half-maximum inhibition of Ca2+ uptake rate (IC50) based on the curve in Fig. 7 was 0.19 nM. This indicates that Ru360 is > 30 times more potent than Ruthenium Red, a well-known mitochondrial Ca2+ uptake inhibitor. The IC50 and data correspond to a 99 % inhibition at 20 nM Ru360. These data indicate that Ru360 is an effective and potent inhibitor of Ca2+ uptake into mitochondria.
Figure 7. Inhibition of the rate of Ca2+ uptake into mitochondria in vitro.
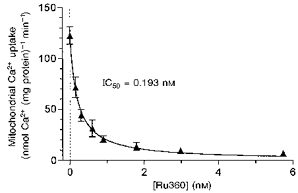
The maximum rate of Ca2+ uptake into mitochondria upon addition of Ca2+ is plotted vs.[Ru360] in the assay medium. The maximum rate of Ca2+ uptake without Ru360 was 122.7 ± 8.6 nmol Ca2+ min−1 (mg protein)−1. Each data point represents mean ± s.e.m. of four experiments with two mitochondrial preparations. The curve is a simple Michaelis-Menten fit: V = Vmax(1 - 1/(1 + IC50/[Ru360])), where V is the rate of mitochondrial Ca2+ uptake and IC50 is the [Ru360] required for 50 % inhibition (0.193 nM or 0.32 ng (mg mitochondrial protein)−1; MW, 550.5).
Figure 8 shows an experiment like that in Fig. 6, but where 1 μm Ru360 was included in the patch pipette. At this stage, where diastolic [Ca2+]i is very high (e.g. like Fig. 6C) the cell showed spontaneous oscillations characteristic of Ca2+ overload. Even at this extremely high cellular Ca2+ load with [Ca2+]i oscillations, the contraction and [Ca2+]i signals are still well matched kinetically. This confirms that the kinetic disparity in Fig. 6C is due to Ca2+ uptake into mitochondria and can be completely suppressed by Ru360. The [Ca2+]c oscillations probably reflect SR Ca2+ release and reuptake because Ru360 (up to 1 μm) does not affect either SR Ca2+ uptake or SR Ca2+ release in permeabilized cells (Matlib et al. 1998) in contrast to high concentrations of Ruthenium Red.
Since there is no mitochondrial Ca2+ uptake in Fig. 8, the change in indo-1 fluorescence comes exclusively from the cytosol. In this case we can subtract the constant mitochondrial fluorescence at both wavelengths to obtain a ‘corrected [Ca2+]i’ signal (see eqn (8), Methods). The raw [Ca2+]i in Fig. 8 is much lower than either the corrected [Ca2+]i or [Ca2+]CL. This is probably because intramitochondrial [Ca2+] is very low in the presence of intracellular Ru360. Ideally the corrected [Ca2+]i and [Ca2+]CL would give the same signal via independent calibrations. While the kinetics are the same, the moderate differences probably reflect inaccuracies in the constants or forms of the equations for these Ca2+ concentrations (eqns (7), (8), or (18)).
Mitochondrial [Ca2+] measured with Mn2+ quench of cytosolic indo-1
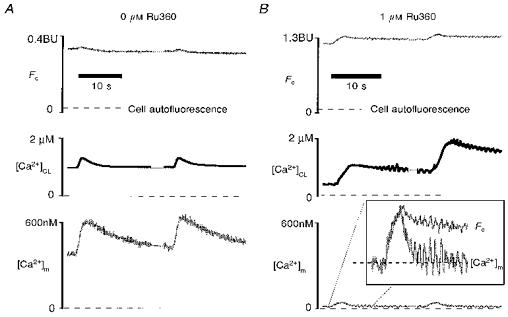
Selective quenching of cytosolic indo-1 by Mn2+ allows detection of a relatively pure mitochondrial [Ca2+]m in cells loaded with indo-1 AM (Miyata et al. 1991). Figure 9A shows the time course of Mn2+ quench of purely cytosolic indo-1 (which had been loaded as the salt via patch pipette). Addition of 0.7 mm Mn2+ to the bath quenched 92 % of the indo-1 fluorescence with a time constant of 240 s. The remaining 8 % of indo-1 fluorescence is lost when the membrane is ruptured. This 8 % of Fc is also not sensitive to increasing Mn2+ concentration and probably reflects residual fluorescence of Mn2+-bound cytosolic indo-1. This is consistent with in vitro experiments where Mn2+ quenches only 95 % of indo-1 fluorescence (not shown). This small fraction of unquenched fluorescence is very minor for the present work because 75 % of intracellular indo-1 is mitochondrial. However, in cells with either less mitochondrial indo-1 loading or a smaller fraction of cell volume occupied by mitochondria, > 90 % of the dye can be cytosolic (Zhou & Neher, 1993a). In this case up to 50 % of the residual signal could be Mn2+-bound indo-1 fluorescence, which could cause serious artifacts.
Figure 9. Time course of Mn2+ quench of cytosolic indo-1.
A, the cell was loaded by a patch pipette containing 1 mm indo-1 for 8 min whole-cell dialysis. After withdrawing the patch pipette, 0.7 mm Mn2+ was added to the bath. The time course of cytosolic indo-1 quenched by Mn2+ is monitored by the normalized Fc signal. After about 15 min, Fc becomes stable. Additional 0.3 mm Mn2+ does not reduce Fc further (not shown), indicating all of the cytosolic indo-1 is quenched by Mn2+. However, breaking the cell membrane by a patch pipette reduces Fc to the original level before loading indo-1. B, the cell was preloaded with indo-1 AM. Addition of 0.7 mm Mn2+ reduces Fc by 29 % after > 20 min. According to A, cytosolic indo-1 is completely quenched by Mn2+ at this time. This suggests that Mn2+-resistant indo-1 (71 % of total indo-1) is not located in the cytosol, but in cell organelles.
Figure 9B shows the time course of Mn2+ quench in a typical cell loaded with the AM form of indo-1. After 10 min of Mn2+ quench, Fc is reduced by only 29 %, indicating that ∼71 % of the total cellular indo-1 is in mitochondria. These experiments (n = 6) are consistent with the average of 75 % mitochondrial indo-1 loading from Fig. 2, and confirm that most of the cellular indo-1 with our standard indo-1 AM-loading method is in mitochondria.
This situation increases the sensitivity of our mitochondrial Ca2+ uptake measurement for several reasons. First, our method loads mitochondria to an [indo] of 1–2 mm, which gives a fluorescence 50–100 times larger than the autofluorescence. Second, the high mitochondrial [indo] also gives a better signal-to-noise ratio, partly because most of the Ca2+ which enters the mitochondria will be bound by indo-1 (and produce signal). The heavy loading also allows long-term recording. Third, the whole-cell patch clamp gradually dialyses out much of the cytosolic indo-1. Mn2+ quench of the remaining cytosolic indo-1 also eliminates interference by [Ca2+]c, yielding a pure mitochondrial signal. Finally, patch clamp allows larger Ca2+ influx via Na+-Ca2+ exchange during a single depolarization, helping to make mitochondrial Ca2+ uptake detectable within the pulse.
Figure 10 shows pure mitochondrial Ca2+ signals during single depolarizations in a ferret myocyte. Figure 10A shows an early 400 ms pulse from -40 to +110 mV. In contrast to the moderate contraction signal (ΔL) and inferred cytosolic Ca2+ signal ([Ca2+]CL), there is no increase in [Ca2+]m, indicating the absence of mitochondrial Ca2+ uptake at this [Ca2+]c level.
Figure 10. Mitochondrial Ca2+ uptake during Mn2+ quench of cytosolic indo-1 in a ferret cell.
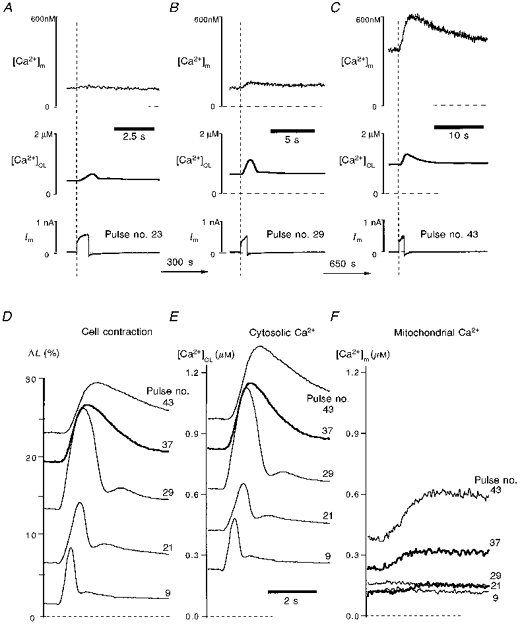
To measure both pure cytosolic and pure mitochondrial Ca2+, the cytosolic indo-1 was quenched by 0.7 mm Mn2+ in the bath. A-C, signals evoked by three individual depolarization pulses to +110 mV. Pulse number represents the corresponding number of depolarization pulses applied to this cell. [Ca2+]CL and [Ca2+]m are estimated by contraction and indo-1 fluorescence, respectively. D, contraction signals from five individual pulses superimposed and labelled with the pulse number. E and F, [Ca2+]CL and [Ca2+]m from the five pulses shown in D.
Figure 10B shows that after seven more pulses, a subsequent 0.8 s depolarization induced a large contraction, a large [Ca2+]CL and a small but detectable [Ca2+]m signal. Note the increased resting ΔL and [Ca2+]CL. After fifteen additional pulses (Fig. 10C) a similar ΔL and Δ[Ca2+]CL are evoked, but from substantially elevated resting levels. The pulse in Fig. 10C produces a substantial increase in [Ca2+]m. Figure 10D-F shows five representative and superimposed depolarization-induced contractions (D), Δ[Ca2+]CL (E) and Δ[Ca2+]m (F). These panels emphasize that very little change in [Ca2+]m is observed at physiological levels of resting [Ca2+]c and cell length. It may be noted that a typical twitch contraction in intact ventricular myocytes is from a resting value of 0 to a peak of ∼10 %. Substantial phasic [Ca2+]m changes during the pulse are only apparent when the resting cell is substantially contracted and [Ca2+]c is greatly elevated (> 400 nM). As phasic Δ[Ca2+]m becomes detectable there is also a slow progressive rise in resting [Ca2+]m, consistent with the very slow decline in [Ca2+]m, compared with [Ca2+]c (Fig. 10Evs. F). Thus, mitochondrial Ca2+ appears to accumulate with progressive pulses once uptake begins.
These results are entirely consistent with results from the Mn2+-free data of Fig. 6. Comparing Figs 6 and 10 it is clear that (with or without Mn2+ quench), mitochondria start to take up Ca2+ at similar basal [Ca2+]c levels (0.3–0.5 μm), and mitochondrial Ca2+ uptake is larger at high [Ca2+]c levels. This may suggest that 0.7 mm Mn2+ in the bath does not affect mitochondrial Ca2+ uptake significantly. It should be noted that cytosolic Mn2+ may be mostly bound to indo-1, such that free cytosolic [Mn2+] might be quite low in our conditions. Indeed, contraction amplitude is not different in the Mn2+-quenched cell (which could be depressed if cytosolic free [Mn2+] were high). As it happens, extracellular Mn2+ does not block Ca2+ entry via Na+-Ca2+ exchange very strongly, but does block Ca2+ current. This would make it difficult to do these same experiments using Ca2+ current as the source of Ca2+ influx rather than Na+-Ca2+ exchange.
We have used Mn2+ and Ru360 to block separately cytosolic and mitochondrial indo-1 signals, respectively (Figs 10 and 7). Figure 11 shows that combining Mn2+ and Ru360 can completely block all of the indo-1 signal. In Fig. 11A, cytosolic indo-1 has been quenched with 0.7 mm Mn2+ in the bath. Fc indicates the level of Ca2+-insensitive indo-1 in the mitochondria, which is about 0.6 mm (see Methods). Upon progressively strong depolarization, indo-1 fluorescence reported increases in [Ca2+]m, and contraction reported large Δ[Ca2+]CL and elevated resting [Ca2+]c. Figure 11B shows a similar experiment, except that 1 μm Ru360 was included in the patch pipette. Despite the higher concentration of indo-1 in this cell (Fc implies about 2 mm mitochondrial indo-1), very strong depolarization did not increase [Ca2+]m (or indo-1 signal) at all. This was the case even though extremely strong contractions indicated large and oscillatory changes in [Ca2+]c. These experiments (n = 3) further confirm that mitochondrial Ca2+ uptake can be fully blocked by cytosolic Ru360. The small and transient increase in [Ca2+]m is probably secondary to displacement of cytosolic Mn2+ from indo-1 by the very large cytosolic Ca2+ transient (Fig. 11B inset, see below).
Figure 11. Blockade of indo-1 signals by Mn2+ and Ru360.
A, Mn2+ alone does not block indo-1 signals from mitochondria in a ferret ventricular myocyte. Mn2+ (0.7 mm) was in the bath to quench cytosolic indo-1, but no Ru360 was in the pipette. Thus the indo-1 signal indicates [Ca2+]m exclusively. Before the two pulses shown here, the cell had been stimulated to a high level of Ca2+ load (note resting [Ca2+]CL). The Ca2+-insensitive fluorescence, Fc, which is directly proportional to mitochondrial [indo] ([indo]m) is given by eqn (11). B, similar experiment to A in another cell, but with 1 μm Ru360 in the patch pipette (as well as Mn2+ quench). Despite even stronger Ca2+-loading pulses, as seen by [Ca2+]CL, there is almost no mitochondrial indo-1 signal. This suggests that cytosolic and mitochondrial indo-1 signals are completed blocked by Mn2+ and Ru360. The small and transient changes in [Ca2+]m (inset) may be due to slight displacement of cytosolic indo-1-bound Mn2+ by Ca2+ (see text). Note Fc in B is larger than in A, indicating [indo]m is larger in the cat cell (B). See text for details.
Latency of [Ca2+]m with respect to [Ca2+]c
The combined [Ca2+]c and [Ca2+]m measurements allow us to assess the temporal latency between these signals. Figure 12A shows the temporal relationship between cytosolic [Ca2+]c and ΔL in a ventricular cell. These traces are expanded versions of part of the right-hand pulse from Fig. 8. There was 0.2 μm Ru360 in the pipette to block mitochondrial Ca2+ uptake, and thus the changes of indo-1 signal reflect purely cytosolic Ca2+ binding of indo-1 (see Fig. 8). It can be seen that the contraction signal tracks the cytosolic indo-1 signal, [Ca2+]c, except that there is a 200 ms latency for [Ca2+]CL calculated from contraction with respect to that based on indo-1 fluorescence ([Ca2+]c). Because Ca2+ binding with indo-1 is much faster than the contraction delay, 200 ms is the intrinsic latency of [Ca2+]CL. The mean latency of ΔL vs. F400/F500 is 222 ± 62 ms (n = 10). Thus, to compensate for this latency where both signals are not available, [Ca2+]CL should be shifted ∼200 ms earlier in time when comparing with [Ca2+]m timing.
Figure 12B shows a direct comparison of contraction (ΔL) with [Ca2+]m (estimated from the pure mitochondrial indo-1 signal after Mn2+ quench without Ru360). The lower panel shows an enlargement of the rising phases and includes the inferred [Ca2+]CL time course (estimated from the ΔL) and offset by 200 ms. It can be seen that the peak contraction (ΔL) precedes the indo-1-based peak [Ca2+]m by ∼800 ms. With the 200 ms delay for the rising phase of contraction vs.[Ca2+]c, the overall delay in time to peak of [Ca2+]m from that of [Ca2+]c is ∼1.0 s.
Ca2+ influx into mitochondria
When cytosolic indo-1 is quenched with Mn2+, the Ca2+-sensitive mitochondrial indo-1 Fd signal can be used to measure the amount of Ca2+ influx into mitochondria during the pulse (see Methods and eqn (17)). Figure 13 shows an experiment in which mitochondrial Ca2+ uptake (QCa,m) is measured in this way. In addition, [Ca2+]m based on the indo-1 fluorescence ratio and [Ca2+]CL based on ΔL are shown. It may be noted that this recording is at a time when the progressive Ca2+ loading of the cell has already elevated resting [Ca2+]c to 800 nM. The intramitochondrial indo-1 concentration, [indo]m, was 0.6 mm in this cell (using eqn (10)). During each of the 1.2 s pulses shown in Fig. 13, cytosolic [Ca2+]CL increased by 0.4 μm, mitochondrial [Ca2+]m increased by 0.2 μm, and the mitochondria in this cell took up ∼20 pC (corresponding to 13 μmol (l mitochondria)−1, or 0.104 fmol) of Ca2+. The maximum rate of mitochondrial Ca2+ uptake during the [Ca2+]c spike is about 20 pC s−1 in this cell. In cellular volume units this corresponds to a Ca2+ flux of ∼6 μmol (l cytosolic volume)−1 s−1.
Figure 13. Real time Ca2+ influx into mitochondria.
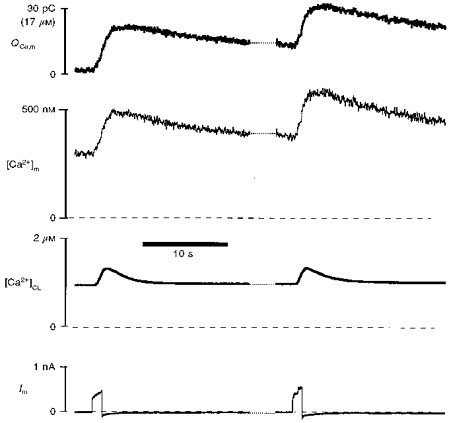
Depolarization to +110 mV was applied to a ferret cell with Mn2+ quench of cytosolic indo-1. [Ca2+]m and [Ca2+]CL are estimated by ΔL and mitochondrial indo-1 fluorescence using eqns (7) and (18), respectively. The net mitochondrial Ca2+ influx, QCa,m, was measured by the Ca2+-sensitive indo-1 signal, ΔFd (see eqn (17)). Scale for QCa,m is given in both Ca2+ charge (30 pC) and total mitochondrial Ca2+ concentration (17 μm), assuming a total mitochondrial volume of 9 pl for this cell.
Figure 14 shows the progression of a typical experiment as a function of the gradual rise in resting [Ca2+]c during twenty-two pairs of depolarizing pulses in a cell after Mn2+ quench. As resting [Ca2+]CL rises in Fig. 14A, resting [Ca2+]m declines to 100–150 nM and does not increase much until [Ca2+]CL is above 400 nM. Figure 14B shows Δ[Ca2+]CL and Δ[Ca2+]m per pulse as a function of resting [Ca2+]CL. Figure 14C is similar, except the free [Ca2+] is replaced by total [Ca2+] ([Ca2+]t) using eqns (17) and (19). At 200 nM [Ca2+]CL, increasing Ca2+ influx (Δ[Ca2+]CL) at two individual pulses to levels comparable with those attained at greater [Ca2+]CL (> 400 nM) failed to produce detectable Δ[Ca2+]m. This indicates that it is not only the Δ[Ca2+]c amplitude that causes mitochondrial Ca2+ uptake, but also a threshold level of resting [Ca2+]c. Here the threshold is at about 400 nM [Ca2+]CL where mitochondrial Ca2+ uptake starts to become detectable. There also seems to be some sort of facilitation of mitochondrial Ca2+ uptake. That is, for a given sarcolemmal Ca2+ influx, or Δ[Ca2+]CL, mitochondrial Ca2+ uptake is greater at higher basal [Ca2+]c (or higher [Ca2+]m) than at lower basal [Ca2+]CL (or [Ca2+]m). Similar results were seen in three other cells.
Figure 14. Ca2+ dependence of mitochondrial Ca2+ uptake during progressive Ca2+ loading.
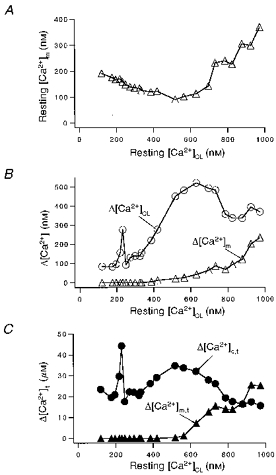
A, steady-state relationship of resting [Ca2+]CL and [Ca2+]m, measured just prior to test pulses. B, resting [Ca2+]CLvs. depolarization-induced changes in cytosolic (Δ[Ca2+]CL) and mitochondrial (Δ[Ca2+]m) Ca2+ concentration. C, resting [Ca2+]CLvs. depolarization-induced total (free + bound) changes in cytosolic (Δ[Ca2+]c,t) and mitochondrial (Δ[Ca2+]m,t) Ca2+ concentration. Pulses to +110 mV ranged from 0.2 s to 1.2 s in duration in this ferret myocyte. Cytosolic indo-1 was quenched with 0.7 mm Mn2+ in the bath, and the total experimental time was 35 min.
Transient relief of cytosolic Mn2+ quench of indo-1 with strong [Ca2+]CL pulses
In Fig. 11B, with Mn2+ quench there is a small, but apparent, transient increase in the [Ca2+]m signal during each of the very strong depolarizations, despite the presence of Ru360. This is not due to a contraction-induced artifact since [Ca2+]m is based on the fluorescence ratio. As shown in Fig. 11B inset, the depolarization induced a small artifactual ΔFc (because of the non-uniform optical effect in the microscope field), which is kinetically identical to the normalized ΔL. The rise in ΔFc also corresponds to the apparent rise in [Ca2+]m, but [Ca2+]m declines rapidly with oscillations which are consistent with [Ca2+]CL changes. Thus, the apparent Δ[Ca2+]m is not due to a contraction artifact, but could be reflecting a very small cytosolic signal. The transient [Ca2+]m is also not due to unblocking of the Ca2+ uniporter by Ru360 because the Δ[Ca2+]m kinetics are too fast (see Fig. 10). Also, the Ru360 concentration is ∼1000 times higher than the Ki for block. Furthermore, the basal [Ca2+]m (< 100 nM) is lower than the threshold for mitochondrial uptake (see Fig. 14).
We suggest that the very small transient rise in apparent [Ca2+]m in Fig. 11B is due to Ca2+ influx-induced transient Mn2+ unbinding (relieving quench) and Ca2+ binding of cytosolic indo-1. This interpretation seems reasonable because we have used the minimum extracellular [Mn2+] to stably quench cytosolic indo-1. Thus, cytosolic [Mn2+], while unknown, is probably only a little higher than that required to bind all cytosolic indo-1 in competition with Ca2+ at resting [Ca2+]c levels. When local[Ca2+]c rises to high levels it is reasonable to expect Ca2+ to compete and displace a small amount of Mn2+ from indo-1 (e.g. near Na+-Ca2+ exchange sites), thus relieving some of the Mn2+ quench and producing some cytosolic Ca2+-indo-1 fluorescence signal. The transient unbinding of Mn2+-indo-1 would increase the total non-quenched [indo] in the cell and produce a transient Fc component that is not paralleled by contraction, which is indeed observed (data not shown). This interpretation is also consistent with our observation that when we remove Mn2+ completely from the bath, there is some recovery of cytosolic Ca2+ signals (n = 5). Thus, the small apparent rise in [Ca2+]m in Fig. 11B is probably artifactual, but given its small size it is unlikely to alter any of our conclusions with respect to mitochondrial Ca2+ transport.
Mn2+ uptake by mitochondria
Manganese can permeate the plasma membrane and quench cytosolic indo-1 when present in the bath (Miyata et al. 1991; Blatter, 1995; this work). This raises the question of whether Mn2+ can also enter mitochondria after it enters the cytosol. Figure 9 shows that Mn2+ can quench virtually all of the cytosolic indo-1 within 10 min, while the majority of mitochondrial indo-1 remains unquenched even after > 30 min. However, this result is from non-stimulated cells.
After Mn2+ has quenched the cytosolic indo-1, changes in Fc can be used as a Ca2+-insensitive monitor for Mn2+ quench of mitochondrial indo-1 as well. In isolated mitochondria, it is known that Mn2+ can compete with Ca2+ for entry into mitochondria (Gavin et al. 1990). In our intact cells, we assume that nearly all Mn2+ entry into mitochondria is bound by indo-1 due to the high mitochondrial [indo]. Thus the amount of the Mn2+ uptake can be estimated by the quench-induced decline in the Fc signal. Figure 15C shows the time course of Fc in a cell. At each data point the cell was stimulated by a pair of depolarization pulses (similar to Fig. 2A; pulse duration, 0.8–1.2 s). For the first 1200 s, Fc did not decrease even during repetitive stimulation of the cell. During this period, when mitochondrial Mn2+-free indo-1 concentration was about 1.0 mm (estimated by eqn (11)), there was no mitochondrial Ca2+ uptake either. The absence of mitochondrial uptake of Ca2+ and Mn2+ during this time is evident in Fig. 15A (recorded at the time of the first arrow in Fig. 15C). In Fig. 15A there is neither a detectable decrease in Fc nor an increase in [Ca2+]m with the stimulation. However, when the mitochondria start to take up Ca2+, after the first arrow in Fig. 15C, then Fc starts to decrease. This is evident from the progressive decrease in Fc and increase in [Ca2+]m upon stimulation. In Fig. 15B (taken at the second arrow in Fig. 15C) stimulation causes Fc to decrease by 0.01 BU, while [Ca2+]m increases by 140 nM. The decrease in Fc during the stimulation corresponds to 10 % of the unquenched indo-1, which is bound by Ca2+ during the stimulation. This suggests that, during the stimulation 10 times more Ca2+ than Mn2+ enters mitochondria. On the other hand, during the time between two stimuli, while there is extrusion of Ca2+ from mitochondria (evident from the slow [Ca2+]m decline), net Mn2+ influx into mitochondria continues (evident from the Fc decline in Fig. 15B and C). This is entirely consistent with the hypothesis that Mn2+ is a Ca2+ substitute for mitochondrial uptake. These experiments (n = 4) suggest the following properties of mitochondria in intact cells exposed to sub-millimolar levels of Mn2+. (1) Mn2+ uptake is dependent on the Ca2+ uptake process. Before [Ca2+]c (or [Ca2+]m) reach the apparent threshold of Ca2+ uptake, there is no Mn2+ uptake. (2) Ca2+ uptake during a strong (1–2 s) depolarization is much larger than Mn2+ uptake under our experimental conditions. Thus, during a single pulse the artifact introduced by Mn2+ quench is negligible. (3) After the start of Ca2+ and Mn2+ uptake, mitochondrial Mn2+ uptake continues, even during the diastolic period when mitochondrial Ca2+ efflux is also occurring.
Figure 15. Ca2+-induced Mn2+ uptake coincides with Ca2+ uptake.
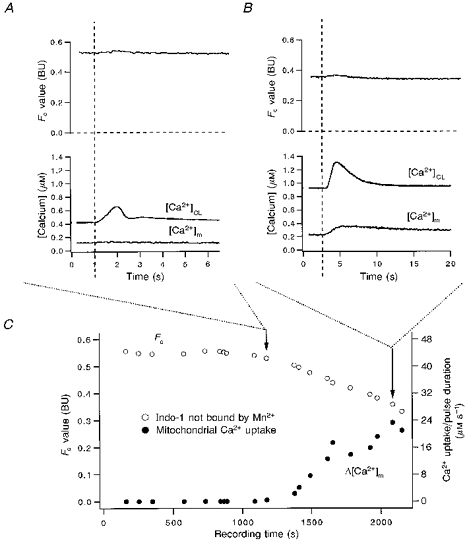
The cytosolic indo-1 was quenched by 0.7 mm Mn2+ in bath. At the beginning of the recording the Fc value (≈0.55 BU) corresponded to an [indo]m of ≈1.0 mm. A and B, pulses indicated by the first and second arrows in C, respectively. (Dashed lines indicate the time of stimulation.) Note the time course of Fc (or [indo]m) decreases as Δ[Ca2+]m goes up, suggesting that Mn2+ uptake is dependent on the same system that takes up Ca2+ into mitochondria. Note, in C, the Ca2+ uptake is shown in Δ[Ca2+]m divided by pulse duration. The increase in Δ[Ca2+]m s−1 indicates a facilitation of Ca2+ uptake with increasing resting [Ca2+]m.
DISCUSSION
We have addressed three open questions concerning mitochondrial Ca2+ in ventricular myocytes, finding that (1) mitochondria take up Ca2+ in intact cells in physiological solutions without Mn2+ (but only when [Ca2+]c is elevated); that (2) the maximum rate of mitochondrial Ca2+ uptake is 6 μmol (l cytosol)−1 s−1; and that (3) the kinetics of [Ca2+]m are significantly different from [Ca2+]c. We have used preferential loading of mitochondria with indo-1, cytosolic dialysis, Mn2+ quench of cytosolic indo-1, a selective mitochondrial Ca2+ uniport blocker (Ru360) and cell contraction as a bioassay of [Ca2+]c in a complementary fashion to address these issues.
Contraction as a bioassay of [Ca2+]c
Muscle contraction has been used for many years as a semi-quantitative indicator of [Ca2+]c. Indeed, the [Ca2+] dependence of isometric contractile force has been extensively characterized in both skinned and intact cardiac muscle (Yue, Marban & Wier, 1986; Bers, 1991; Gao, Backx, Azan-Backx & Marban, 1994). The steady-state [Ca2+]c dependence of cell shortening in isolated myocytes has also been characterized (Spurgeon et al. 1990; Bassani et al. 1995). Here we have used this quantitative relationship to infer a purely cytosolic [Ca2+] signal (distinct from a fluorescence signal, which includes a mitochondrial component). During the rapid rising phase of the Ca2+ transient in physiological excitation-contraction (E-C) coupling, the [Ca2+]c-length relationship is different from the steady state (Spurgeon et al. 1990). The slow Ca2+ transients used here minimize this difference during the rising phase (∼200 ms delay) and during [Ca2+]c decline. Thus, the steady-state relationship should provide a good approximation for these data. Indeed, our results show good kinetic agreement for contractions and indo-1 signals where mitochondrial Ca2+ uptake does not occur (Figs 3, 4, 6A, 8 and 12A).
Ionic currents via Ca2+-activated K+ channels have also been used as biosensors of local [Ca2+] near the membrane in hair cells, smooth muscle and chromaffin cells (Stehno-Bittel & Sturek, 1992; Prakriya, Solaro & Lingle, 1996). The contractile proteins in our case provide information about mean cytosolic [Ca2+], which is appropriate for our purposes.
In addition to the kinetic constraints mentioned above, there are several limitations in using contraction as a bioassay for [Ca2+]c. We assume that the [Ca2+]-contraction relationship does not change during the course of an experiment. While this may be a reasonable default, changes in intracellular conditions (e.g. pH, [ATP], [PO4−] and [Mg2+]) which can occur during ischaemia are known to shift the myofilament Ca2+ sensitivity (e.g. see Bers, 1991). We have no reason to expect substantial changes in these parameters and the continual whole-cell dialysis should help to buffer any changes in these substrates after each stimulation. Nevertheless, we have not measured these parameters directly.
The equation used to translate ΔL to [Ca2+]CL (eqn (18)) may also be imperfect, although it is consistent with direct steady-state measurements by Bassani et al. (1995) in a study of calibration of intracellular indo-1 in cardiac myocytes. The maximum reversible steady-state ΔL measured here (37 %) is typical of cardiac myocytes from many species, although this does not include the cellular hypercontracture associated with cell death. We used a lower apparent Ca2+ affinity (Kd,c = 0.8 μm) and Hill coefficient (2) than reported for isometric force in muscles (0.5–0.6 μm and 5–6, respectively; Yue et al. 1986; Gao et al. 1994). This might be reasonable because as the cell contracts, the steady-state myofilament Ca2+ sensitivity decreases (Kentish, ter Keurs, Ricciardi, Bucx & Noble, 1986). We also chose to include a basal [Ca2+]CL (70 nM) at maximal resting cell length in eqn (18). This prevents predicted [Ca2+] from approaching zero when the cell relaxes completely (i.e. as ΔL approaches 0). The relationship in eqn (18) predicts that at 112 nM [Ca2+]CL the cell will contract by 0.1 % of resting cell length. Figure 8 shows reasonable, if imperfect, agreement between two methods for estimating [Ca2+]c when mitochondrial Ca2+ uptake was blocked ([Ca2+]CL from ΔL and a corrected [Ca2+]c after compensating for unchanging mitochondrial indo-1 fluorescence, eqn (8)). Despite some limitations, we feel that [Ca2+]CL calculated from ΔL is a good approximation and a valuable approach to assess [Ca2+]c in these experiments.
Time course of whole-cell dialysis in ventricular myocytes
We had hoped initially to be able to remove all cytosolic indo-1 by dialysis with the patch pipette, such that the remaining indo-1 was entirely mitochondrial. Despite extensive efforts, including large pipettes and small myocytes, this strategy appeared experimentally impractical in ventricular myocytes (since > 40 min of dialysis was required). This is why we used complementary Mn2+ quench experiments to effectively remove any cytosolic indo-1 signal. Although the time constant of Mn2+ quench is similar to that of whole-cell dialysis (10 min, Fig. 8), the cells are intact during the quench process. Thus, [Ca2+]m can be measured immediately after formation of whole-cell patch clamp configuration.
The time course of whole-cell dialysis has been studied in detail in small spherical chromaffin cells, where a molecule like fura-2 can be completely washed out by a patch pipette within 3 min (Pusch & Neher, 1988; Zhou & Neher, 1993b). The larger and more complex geometry of ventricular myocytes may account for the difference. Our measurements of myocyte dialysis may allow a more general estimation of the time constant (τ) of wash-out (Pusch & Neher, 1988):
| (20) |
where M is molecular mass (in daltons) of the dialysed substance, Racc is in megaohms, Cm is in picofarads (and is proportional to myocyte volume; Satoh et al. 1996), and 300 (in s) is the τ value for standard conditions (e.g. M = 840 for indo-1, Racc = 3 MΩ and Cm = 80 pF, then τ = 300 s). In this context the 10–20 times slower dialysis of ventricular myocytes vs. chromaffin cells is explained by the 10–20 times larger cell size and different cell shape (cylindrical vs. spherical).
Mitochondrial Ca2+ uptake in intact ventricular myocytes
Figures 6 and 8 demonstrate that in the absence of Mn2+, mitochondria can take up Ca2+ in intact cells. However, Ca2+ uptake by mitochondria is apparent only after progressive Ca2+ load, with a [Ca2+]c threshold of ∼300–500 nM, and is sensitive to the mitochondrial Ca2+ uniport blocker, Ru360. Mitochondrial Ca2+ uptake becomes greater when basal [Ca2+]c is further elevated, and is characterized by a distinctly different time course to that of the cytosolic Ca2+ transient. For [Ca2+]c below this threshold, the normalized contraction signal (ΔL) is identical to the indo-1 ratio signal (F400/F500). This suggests that there is no contribution from mitochondria in the normalized F400/F500, unless [Ca2+]m is kinetically indistinguishable from [Ca2+]c (as reported by Chacon et al. 1996). The latter possibility seems unlikely for several reasons. (1) We see a threshold for this kinetically distinct and clearly mitochondrial component at ∼300–500 nM [Ca2+]c. (2) A very similar threshold and much slower [Ca2+]m are seen with Mn2+ quench of cytosolic indo-1. (3) Only the slow component is sensitive to the mitochondrial Ca2+ uniport blocker, Ru360. (4) As dialysis proceeds, the rapid Ca2+-sensitive indo-1 signal, ΔFd (see Fig. 1C), associated with contraction becomes smaller (i.e. the fast Ca2+ signal washes out as cytosolic indo-1 washes out; not shown). In addition, the rates of Ca2+ transport into and out of mitochondria required to match the cytosolic Ca2+ transient are inconsistent with other data (see below).
These results and conclusions are consistent with the seminal report by Miyata et al. (1991) in intact myocytes with cytosolic indo-1 quenched by Mn2+. They also found that mitochondria take up Ca2+, but they only saw slow progressive changes in [Ca2+]m with high stimulation frequencies. We have also used Mn2+ to quench cytosolic indo-1 (in combination with dialysis) to obtain a relatively pure [Ca2+]m signal (Figs 9-15). Again, at low basal [Ca2+]c (< 300 nM) no Δ[Ca2+]m was seen with depolarization-induced Ca2+ influx into the cell. When resting [Ca2+]c reaches 300–500 nM, mitochondrial Ca2+ uptake starts. The Ca2+ uptake becomes stronger when basal [Ca2+]c is higher. These phenomena, including the threshold for [Ca2+]c in the presence of Mn2+, are essentially the same as in the absence of Mn2+, indicating that Mn2+ did not substantially alter the basic Ca2+ dependence of mitochondrial Ca2+ uptake.
The lack of effect of Mn2+ on mitochondria under our experimental conditions may be because free cytosolic [Mn2+] is probably very low (just enough to quench all cytosolic indo-1). In isolated mitochondria, both Ca2+ influx and efflux were found to be sensitive to intramitochondrial Mn2+. However, the effective intramitochondrial Mn2+ concentration was in the millimolar range (Gavin et al. 1990), which is far larger than the estimated nanomolar to micromolar range of Mn2+ in the present work. Because mitochondrial indo-1 is less than half-saturated by Mn2+ (even at the end of Fig. 15), the mitochondrial [Mn2+] must be below the 10 nM Kd for Mn2+ binding of indo-1 (Spurgeon et al. 1990). Thus, it is unlikely that either mitochondrial Ca2+ influx or Ca2+ efflux in this work are greatly altered by the presence of Mn2+, although some minor quantitative effect of Mn2+ cannot be ruled out.
Delay of [Ca2+]m after [Ca2+]c
Another major new finding of the present work is that even when mitochondrial Ca2+ uptake at a single pulse becomes detectable (Figs 10 and 12) the peak of [Ca2+]m is delayed by 1 s with respect to the slow rising [Ca2+]c with our protocol (Fig. 12B). In this case further increase in [Ca2+]c is terminated by repolarization. After the peak, [Ca2+]m decays very slowly, consistent with the 40 s time constant of mitochondrial Ca2+ extrusion inferred by Bassani et al. (1993). In some cases, when cellular Ca2+ load is high, [Ca2+]m continues to rise even after the cell contraction and [Ca2+]CL has completely declined (e.g. Fig. 6C).
Our results contrast with a recent study by Chacon et al. (1996) using confocal microscopy to spatially distinguish mitochondrial from cytosolic Ca2+ signals in rabbit ventricular myocytes. They reported twitch transients in [Ca2+]m which had the same kinetics as [Ca2+]c. They did not use either Mn2+ quench or dialysis to minimize cytosolic signals, or any mitochondrial uniport blocker to confirm the source of the signals. It is possible that the rapid [Ca2+]m transients they reported are contaminated with cytosolic fluorescence signals that are not adequately excluded by confocal microscopy. Although they did have high mitochondrial indicator loading compared with cytosol, even a small rapid cytosolic fluorescence transient might complicate the interpretation. Indeed, in our experiments even though most of the indo-1 was trapped in mitochondria (especially after partial dialysis), the small amount of cytosolic indo-1 can give a signal that could easily be misinterpreted as coming from mitochondria. These possibilities or alternatives were not addressed in the study of Chacon et al. (1996).
Comparison with other preparations
Our results and apparent threshold for mitochondrial Ca2+ uptake are in agreement with results with digitonin-permeabilized ventricular myocytes (Fry, Powell, Twist & Ward, 1984; Hove-Madsen & Bers, 1993). Those studies showed no evidence of mitochondrial Ca2+ uptake below 1 μm[Ca2+]c. Indeed, measurements with isolated mitochondria (at physiological concentrations of Na+ and Mg2+) have also typically shown very low Ca2+ uptake below 0.5 μm medium [Ca2+], but with a sharp increase in Ca2+ uptake (and [Ca2+]m) starting between 0.5 and 1.5 μm Ca2+ (Crompton, 1990; McCormack & Denton, 1993; Leisey, Grotyohann, Scott & Scaduto, 1993).
The finding of a [Ca2+]c threshold of 300–500 nM for mitochondrial Ca2+ uptake in ventricular myocytes is also consistent with previous reports in sympathetic neurons (Thayer & Miller, 1990; Friel & Tsien, 1994), chromaffin cells (Herrington et al. 1996), and smooth muscle cells (McGeown, Drummond, McCarron & Fay, 1996). This general agreement may allow data from the present work in cardiac myocytes to be useful for other cell types. At the single cell level, the large cell size (100–200 pF) and the large fraction of cell volume occupied by mitochondria (30 %) gives large mitochondrial fluorescence signals. However, a disadvantage of ventricular myocytes is the long time required for cytosolic dialysis by patch pipette.
The kinetics of [Ca2+]c changes in cardiac myocytes are normally fast compared with other cell types (although we have intentionally slowed them in the present studies). In other cell types, where the [Ca2+]c changes are slower, the participation of mitochondria may differ. Using the Ca2+-sensitive photoprotein aequorin, Rizzuto and co-workers found [Ca2+]m decline to be faster than that of [Ca2+]c in both non-excitable cells and excitable cells (Rizzuto et al. 1992; Rutter, Theler, Murgia, Wollheim, Pozzan & Rizzuto, 1993). Using electron probe microanalysis (EPMA) of rapidly frozen ventricular myocytes, Isenberg, Han, Schiefer & Wendt-Gallitelli (1993) reported only a 20 ms delay in the rise of mitochondrial Ca2+ content compared with that of [Ca2+]c. While EPMA can give a purely mitochondrial signal (in contrast to confocal microscopy used by Chacon et al. 1996), the space between inner and outer membranes is still sampled. They also used a very aggressive Ca2+-loading protocol, whereas Moravec & Bond (1992) found no mitochondrial Ca2+ changes using EPMA, even in the steady state with β-adrenergic agonists (seeing increases only upon removal of extracellular Na+). The results of Isenberg et al. (1993) also suggest that the amount of Ca2+ going into the mitochondria within 40 ms of depolarization is ten times higher than the total amount of cellular Ca2+ cycling during E-C coupling (Bers, 1991; Bassani et al. 1994a). Thus, there are some kinetic and quantitative issues which remain to be resolved in cardiac myocytes.
In both astrocytes and chromaffin cells, large cytosolic Ca2+ transients occur and precede mitochondrial Ca2+ transients by up to 10 s (Jou et al. 1996; Babcock, Herrington & Hille, 1996). Furthermore, Herrington et al. (1996) demonstrated that mitochondrial Ca2+ uptake in chromaffin cells plays a dominant role in the time course of [Ca2+]c decline. Interestingly, [Ca2+]c decline takes 20–40 s in chromaffin cells, which is similar to that in ventricular myocytes when the SR Ca2+-ATPase and Na+-Ca2+ exchange are disabled and mitochondria take up ∼50 % of the cytosolic Ca2+ (Bassani et al. 1992, 1994a). Thus, the more dominant role of mitochondria in the chromaffin cell may be primarily due to weaker competition by the SR/endoplasmic reticulum Ca2+-ATPase or Na+-Ca2+ exchange, which are both very strong in ventricular myocytes. These studies also showed slow decline of [Ca2+]m in chromaffin cells and astrocytes (t½ > 20 s; Jou et al. 1996; Babcock et al. 1996). This is consistent with our observations here and elsewhere for cardiac mitochondria (Bassani et al. 1993).
Quantification of Ca2+ influx into mitochondria
We have measured a maximum mitochondrial Ca2+ uptake rate after progressive Ca2+ loading at ∼10 μm s−1 (Fig. 13). Since a large fraction of the intramitochondrial Ca2+ buffer is indo-1 (e.g. ∼0.6 mm in this cell), our estimate depends less on precise knowledge of the endogenous buffering. This maximal uptake rate at 1–2 μm[Ca2+]c would correspond to transport out of the cytosol of ∼5 μmol (l cytosol)−1 s−1 (since 2/3 of the cell volume is cytosolic). This is 5–10 times larger than the rate in intact myocytes derived from the data of Bassani et al. (1994a) during a single cytosolic Ca2+ transient reaching a peak of 1 μm. In digitonin-permeabilized cells and isolated mitochondria, maximal Ca2+ uptake rates of 2–5 μm s−1 at 1 μm[Ca2+]c can be inferred from the data of Fry et al. (1984) and Crompton (1990). The slightly higher maximal Ca2+ uptake rate here (vs.Bassani et al. 1994b) may be a consequence of the preceding progressive cellular Ca2+ loading and non-linear dependence on [Ca2+]c (note that diastolic [Ca2+]c in Fig. 13 is nearly 1 μm). The 13 μm Ca2+ entering the mitochondria in 1.2 s can raise [Ca2+]m by 200 nM (as in Fig. 13).
During a normal cardiac twitch [Ca2+]c declines rapidly due to transport by the SR Ca2+-ATPase and Na+-Ca2+ exchange, such that much less total mitochondrial Ca2+ uptake can occur. During a twitch, if only 0.7 μm Ca2+ enters the mitochondria (based on Bassani et al. 1994a), it would raise [Ca2+]m from a resting value of 100 nM by only 7 nM (or 21 nM without mitochondrial indo-1 buffering). This small change might be difficult to detect. This may be why Miyata et al. (1990) did not detect mitochondrial transients at single twitches, but did see gradual cumulative changes after many contractions upon changes in frequency. Indeed, these slow cumulative changes in [Ca2+]m are consistent with net transport models (Crompton, 1990) and may have regulatory effects on mitochondrial energy production due to the Ca2+-dependent stimulation of several key mitochondrial enzymes involved in NADH and ATP generation (McCormack & Denton, 1993; Hansford, 1994). Indeed, Brandes & Bers (1997) recently demonstrated [Ca2+]c-dependent stimulation of mitochondrial NADH production upon changes in work in intact ventricular muscle which has temporal delays consistent with slow mitochondrial Ca2+ uptake and extrusion.
The high concentration of indo-1 in the mitochondria here assures us that almost all Ca2+ influx into the mitochondria produces a fluorescence signal. Indeed, the resolution of [Ca2+]m is technically the same as ΔFd, indicating that any detectable Ca2+ influx reported by ΔFd will also be seen as Δ[Ca2+]m (although the absolute change in free [Ca2+]m for a given Ca2+ influx is smaller with more mitochondrial indo-1). While maximizing the detectability of mitochondrial Ca2+ influx, this buffering effect of indo-1 may diminish the absolute rate of Ca2+ extrusion from the mitochondria. This may limit quantitative conclusions about Ca2+ efflux kinetics.
Thus, we saw no mitochondrial Ca2+ influx at a resting [Ca2+]c of 100–200 nM, even with strong depolarizations bringing large amounts of Ca2+ in via Na+-Ca2+ exchange. It is conceivable that mitochondria could respond differently to Ca2+ influx via Ca2+ channels and SR Ca2+ release during physiological twitches. However, Miyata et al. (1991) could not detect any beat-to-beat changes in [Ca2+]m during field stimulation, even with high frequency stimulation. This finding with Mn2+ quench of cytosolic indo-1 was also very recently confirmed using another approach to eliminate cytosolic indo-1 (Griffiths, Stern & Silverman, 1997).
The high rates of mitochondrial Ca2+ uptake measured here (e.g. > 10 μm s−1) at high levels of cellular Ca2+ load and at a resting [Ca2+]c of ∼1 μm are probably not physiological, but may occur under pathological conditions, such as Ca2+ overload. This may serve as protection for the cell from sustained high [Ca2+]c and irreversible contracture. However, prolonged Ca2+ overload may result in dramatic mitochondrial Ca2+ uptake, which may lead to both permeability transition and cell death.
Intracellular Mn2+ in mitochondrial studies
Adding Mn2+ to the bath to quench selectively cytosolic indo-1 has been a useful strategy in studying [Ca2+]m in cells (Miyata et al. 1991; Blatter, 1995; present work). Mn2+ probably enters the cell via voltage-gated Ca2+ channels (Masumiya, Tateyama & Ochi, 1997) or some other pathway. There may be two main reasons why this quench is relatively selective for cytosolic indo-1. First, the same transport mechanism may not be present or as active in the inner mitochondrial membrane. Second, the low free [Mn2+] in the cytosol may limit Mn2+ entry into mitochondria. In our case dialysis with the patch pipette may also be important in preventing progressive increases in cytosolic [Mn2+]. Thus, cytosolic Mn2+ may be in a quasi-steady state in our experiments. This may explain why studies without patch clamp dialysis have required lower extracellular [Mn2+] to accomplish Mn2+ quench of cytosolic indo-1. Since we can only just detect very small displacements of Mn2+ from cytosolic indo-1 at very high [Ca2+]c (Fig. 11B, inset) we think that we are at an optimal cytosolic free [Mn2+]. That is, [Mn2+] is just high enough to quench cytosolic indo-1, but not high enough to produce major alterations in other cellular functions (perhaps 0.1 μm Mn2+). Notably, maximum contraction is not altered and a given depolarization protocol produces similar contractions in the presence and absence of Mn2+ quench. This allows us to measure pure [Ca2+]m signals after Mn2+ quench of cytosolic indo-1.
The present results show that Mn2+ permeability of the mitochondrial membrane is dramatically increased at the same degree of cellular Ca2+ load required to reach the threshold for mitochondrial Ca2+ uptake (Fig. 15). It seems plausible that Ca2+ and Mn2+ use the same pathway (the uniporter) to enter mitochondria. However, the mitochondrial uptake rate for Mn2+ is much smaller than that for Ca2+ (∼10:1). No doubt, part of this difference is because free [Mn2+] is probably lower than [Ca2+]c. In addition, during [Ca2+]m decline, while Ca2+ is extruded from mitochondria, Mn2+ continues to be taken up. On the other hand, while Ca2+ uptake may continue after the rising phase of [Ca2+]c (as evident in Fig. 6), in most cases [Ca2+]m started to decline shortly after repolarization (Fig. 10), such that Ca2+ extrusion must be faster than Ca2+ influx. If Mn2+ is only poorly extruded from mitochondria (Gunter et al. 1994), this could explain the sustained Mn2+ uptake even during [Ca2+]m decline.
Conclusions
From multiple types of experiments and analyses we conclude that beat-to-beat fluctuations in mitochondrial Ca2+ are likely to be extremely small, and are essentially undetectable, even with the sensitive methods used here (where most of that Ca2+ would bind to a sensitive fluorescent indicator). On the other hand, cumulative changes in [Ca2+]m occur with recurrent stimulation. We suggest that such slow cumulative changes in [Ca2+]m may have physiological importance in the regulation of energy metabolism. When the cell and/or mitochondria reach a threshold Ca2+ level (e.g. [Ca2+]c, 400–500 nM) mitochondria begin to take up Ca2+ much more rapidly and changes in [Ca2+]m can be readily detected even during individual large and slow contractions (and [Ca2+]c transients). This rapid Ca2+ uptake mode at very high [Ca2+]c is sensitive to the mitochondrial Ca2+ uniport blocker Ru360 and can also transport Mn2+. This rapid uptake is probably not functioning during physiological conditions and normal beat-to-beat regulation in heart.
Acknowledgments
We are grateful to Dr Stephen Lipsius for cat ventricular myocytes, and to Dr Cristina Artalejo for bovine chromaffin cells. We thank Christine Zakavec-Hovance, Steven Scaglione and the late Christine Rechenmacher for careful work in isolating cardiac myocytes, Selena Knight for Ru360 preparation and testing on ferret heart mitochondria in vitro, and Drs Jörg Hüser and Thomas Shannon for comments on the manuscript. Valuable help from Drs Eileen McCall, Li Li, Weilong Yuan and Ken Ginsburg, and John Payne, Slim Whitaker and Michael Pesigan are also acknowledged. This work was supported by grants from the USPHS (NIH HL 30077 to D. B.) and American Diabetes Association and University of Cincinnati Faculty Development Council (to M. A. M.).
References
- Artalejo CR, Elhamdani A, Palfrey HC. Calmodulin is the divalent cation receptor for rapid endocytosis, but not exocytosis, in adrenal chromaffin cells. Neuron. 1996;16:195–205. doi: 10.1016/s0896-6273(00)80036-7. 10.1016/S0896-6273(00)80036-7. [DOI] [PubMed] [Google Scholar]
- Augustine GJ, Neher E. Calcium requirements for secretion in bovine chromaffin cells. The Journal of Physiology. 1992;450:247–271. doi: 10.1113/jphysiol.1992.sp019126. [DOI] [PMC free article] [PubMed] [Google Scholar]
- Babcock DF, Herrington J, Hille B. Simultaneous monitoring of cytosolic and mitochondrial [Ca2+] in single cells. Biophysical Journal. 1996;70:A181. [Google Scholar]
- Barth E, Stammler G, Speiser B, Schaper J. Ultrastructural quantitation of mitochondria and myofilaments in cardiac muscle from 10 different animal species including man. Journal of Molecular and Cellular Cardiology. 1992;24:669–681. doi: 10.1016/0022-2828(92)93381-s. [DOI] [PubMed] [Google Scholar]
- Bassani RA, Bassani JWM, Bers DM. Mitochondrial and sarcolemmal Ca2+ transport reduce [Ca2+]i during caffeine contractures in rabbit cardiac myocytes. The Journal of Physiology. 1992;453:591–608. doi: 10.1113/jphysiol.1992.sp019246. [DOI] [PMC free article] [PubMed] [Google Scholar]
- Bassani JWM, Bassani RA, Bers DM. Ca2+ cycling between sarcoplasmic reticulum and mitochondria in rabbit cardiac myocytes. The Journal of Physiology. 1993;460:603–621. doi: 10.1113/jphysiol.1993.sp019489. [DOI] [PMC free article] [PubMed] [Google Scholar]
- Bassani JWM, Bassani RA, Bers DM. Relaxation in rabbit and rat cardiac cells: species-dependent differences in cellular mechanisms. The Journal of Physiology. 1994a;476:279–293. doi: 10.1113/jphysiol.1994.sp020130. [DOI] [PMC free article] [PubMed] [Google Scholar]
- Bassani RA, Bassani JWM, Bers DM. Relaxation in ferret ventricular myocytes: unusual interplay among calcium transport systems. The Journal of Physiology. 1994b;476:295–308. doi: 10.1113/jphysiol.1994.sp020131. [DOI] [PMC free article] [PubMed] [Google Scholar]
- Bassani JWM, Bassani RA, Bers DM. Calibration of indo-1 and resting intracellular [Ca2+]i in intact rabbit cardiac myocytes. Biophysical Journal. 1995;68:1453–1460. doi: 10.1016/S0006-3495(95)80318-8. [DOI] [PMC free article] [PubMed] [Google Scholar]
- Berlin JR, Bassani JWM, Bers DM. Intrinsic cytosolic calcium buffering properties of single rat cardiac myocytes. Biophysical Journal. 1994;67:1775–1787. doi: 10.1016/S0006-3495(94)80652-6. [DOI] [PMC free article] [PubMed] [Google Scholar]
- Bers DM. Excitation-contraction Coupling and Cardiac Contractile Force. Dordrecht, Netherlands: Kluwer Academic Press; 1991. pp. 1–258. [Google Scholar]
- Blatter LA. Depletion and filling of intracellular Ca2+ stores in smooth muscle. American Journal of Physiology. 1995;268:C503–512. doi: 10.1152/ajpcell.1995.268.2.C503. [DOI] [PubMed] [Google Scholar]
- Blatter LA, Wier WG. Intracellular diffusion, binding and compartmentalization of the fluorescent calcium indicators indo-1 and fura-2. Biophysical Journal. 1990;58:1491–1499. doi: 10.1016/S0006-3495(90)82494-2. [DOI] [PMC free article] [PubMed] [Google Scholar]
- Brandes R, Bers DM. Intracellular Ca2+ increases NADH production and redox potential during elevated work in intact cardiac muscle. Circulation Research. 1997;80:82–87. doi: 10.1161/01.res.80.1.82. [DOI] [PubMed] [Google Scholar]
- Chacon E, Ohata H, Harper IS, Trollinger DR, Herman B, Lemasters JJ. Mitochondrial free calcium transients during excitation-contraction coupling in rabbit cardiac myocytes. FEBS Letters. 1996;382:32–36. doi: 10.1016/0014-5793(96)00138-x. [DOI] [PubMed] [Google Scholar]
- Crompton M. The role of Ca2+ in the function and dysfunction of heart mitochondria. In: Langer GA, editor. Calcium and the Heart. New York: Raven Press; 1990. pp. 167–198. [Google Scholar]
- Duchen MR. Ca2+ dependent changes in the mitochondrial energetics in single dissociated mouse sensory neurons. Biochemical Journal. 1992;283:41–50. doi: 10.1042/bj2830041. [DOI] [PMC free article] [PubMed] [Google Scholar]
- Friel DD, Tsien RW. An FCCP-sensitive Ca2+ store in bullfrog sympathetic neurons and its participation in stimulus-evoked changes in [Ca2+]i. Journal of Neuroscience. 1994;14:4007–4024. doi: 10.1523/JNEUROSCI.14-07-04007.1994. [DOI] [PMC free article] [PubMed] [Google Scholar]
- Fry CH, Powell T, Twist VW, Ward JPT. Net calcium exchange in adult rat ventricular myocytes: An assessment of mitochondrial calcium accumulating capacity. Proceedings of the Royal Society of London. 1984;B 223:223–238. doi: 10.1098/rspb.1984.0091. [DOI] [PubMed] [Google Scholar]
- Gao WD, Backx PH, Azan-Backx M, Marban E. Myofilament Ca2+ sensitivity in intact versus skinned rat ventricular muscle. Circulation Research. 1994;74:408–414. doi: 10.1161/01.res.74.3.408. [DOI] [PubMed] [Google Scholar]
- Gavin CE, Gunter KK, Gunter TE. Manganese and calcium efflux kinetics in brain mitochondria. Relevance to manganese toxicity. Biochemical Journal. 1990;266:329–334. doi: 10.1042/bj2660329. [DOI] [PMC free article] [PubMed] [Google Scholar]
- Griffiths EJ, Stern MD, Silverman HS. Measurement of mitochondrial calcium in single living cardiac myocytes by selective removal of cytosolic indo-1. American Journal of Physiology. 1997;273:C37–44. doi: 10.1152/ajpcell.1997.273.1.C37. [DOI] [PubMed] [Google Scholar]
- Gunter TE, Gunter KK, Sheu SS, Gavin CE. Mitochondrial Ca2+ transport: physiological and pathological relevance. American Journal of Physiology. 1994;267:C313–339. doi: 10.1152/ajpcell.1994.267.2.C313. [DOI] [PubMed] [Google Scholar]
- Hajnoczky G, Robb-Gaspers LD, Seitz MB, Thomas AP. Decoding of cytosolic calcium oscillations in the mitochondria. Cell. 1995;82:415–424. doi: 10.1016/0092-8674(95)90430-1. [DOI] [PubMed] [Google Scholar]
- Hansford RG. Physiological role of mitochondrial Ca transport. Journal of Bioenergetics and Biomembranes. 1994;26:495–508. doi: 10.1007/BF00762734. [DOI] [PubMed] [Google Scholar]
- Hardingham GE, Chawla S, Johnson CM, Bading H. Distinct functions of nuclear and cytoplasmic calcium in the control of gene expression. Nature. 1997;385:260–265. doi: 10.1038/385260a0. 10.1038/385260a0. [DOI] [PubMed] [Google Scholar]
- Herrington J, Park YB, Babcock DF, Hille B. Dominant role of mitochondria in clearance of large Ca2+ loads from rat adrenal chromaffin cells. Neuron. 1996;16:219–228. doi: 10.1016/s0896-6273(00)80038-0. 10.1016/S0896-6273(00)80038-0. [DOI] [PubMed] [Google Scholar]
- Hove-Madsen L, Bers DM. Indo-1 binding to protein in permeabilized ventricular myocytes alters its spectral and Ca2+ binding properties. Biophysical Journal. 1992;63:89–97. doi: 10.1016/S0006-3495(92)81597-7. [DOI] [PMC free article] [PubMed] [Google Scholar]
- Hove-Madsen L, Bers DM. Passive Ca2+ buffering and SR Ca2+ uptake in permeabilized rabbit ventricular myocytes. American The Journal of Physiology. 1993;264:C677–686. doi: 10.1152/ajpcell.1993.264.3.C677. [DOI] [PubMed] [Google Scholar]
- Isenberg G, Han S, Schiefer A, Wendt-Gallitelli MF. Changes in mitochondrial calcium concentration during the cardiac contraction cycle. Cardiovascular Research. 1993;27:1800–1809. doi: 10.1093/cvr/27.10.1800. [DOI] [PubMed] [Google Scholar]
- Jou MJ, Peng TI, Sheu SS. Histamine-induced oscillation of mitochondrial free Ca2+ concentration in single cultured brain astrocytes. The Journal of Physiology. 1996;497:299–308. doi: 10.1113/jphysiol.1996.sp021769. [DOI] [PMC free article] [PubMed] [Google Scholar]
- Kentish JC, ter Keurs HEDJ, Ricciardi L, Bucx JJJ, Noble NIM. Comparison between the sarcomere length-force relations of intact and skinned trabeculae from rat right ventricle. Circulation Research. 1986;58:755–768. doi: 10.1161/01.res.58.6.755. [DOI] [PubMed] [Google Scholar]
- Leisey JR, Grotyohann LW, Scott DA, Scaduto RC. Regulation of cardiac mitochondrial calcium by average extramitochondrial calcium. American Journal of Physiology. 1993;265:H1203–1208. doi: 10.1152/ajpheart.1993.265.4.H1203. [DOI] [PubMed] [Google Scholar]
- McCormack JG, Denton RM. Mitochondrial Ca2+ transport and the role of intramitochondrial Ca in the regulation of energy metabolism. Developmental Neuroscience. 1993;15:165–173. doi: 10.1159/000111332. [DOI] [PubMed] [Google Scholar]
- McGeown JG, Drummond RM, McCarron JG, Fay FS. The temporal profile of calcium transients in voltage clamped gastric myocytes from Bufo marinus. The Journal of Physiology. 1996;497:321–336. doi: 10.1113/jphysiol.1996.sp021771. [DOI] [PMC free article] [PubMed] [Google Scholar]
- Malgaroli A, Milani D, Meldolesi J, Pozzan T. Fura-2 measurement of cytosolic free Ca2+ in monolayers and suspensions of various types of animal cells. Journal of Cell Biology. 1987;105:2145–2155. doi: 10.1083/jcb.105.5.2145. 10.1083/jcb.105.5.2145. [DOI] [PMC free article] [PubMed] [Google Scholar]
- Masumiya H, Tateyama M, Ochi R. L-type manganese current and current quenching of fura-2 signals in rabbit ventricular cells. Biophysical Journal. 1997;72:A165. [Google Scholar]
- Matlib MA, Vaghy PL, Rouslin W, Schwartz A. Isolation of cardiac muscle mitochondria: an update. In: Schwartz A, editor. Methods in Pharmacology. Vol. 5. New York: Plenum Press; 1984. pp. 25–37. [Google Scholar]
- Matlib MA, Zhou Z, Knight S, Ahmed S, Choi KM, Krause-Bauer J, Phillips R, Altschuld R, Katsube Y, Sperelakis N, Bers D. Ru360 specifically inhibits Ca2+ uptake into mitochondria in vitro and in situ in cardiac myocytes. Biophysical Journal. 1998;74 doi: 10.1074/jbc.273.17.10223. in the Press. [DOI] [PubMed] [Google Scholar]
- Miyata H, Silverman HS, Sollott SJ, Lakatta EG, Stern MD, Hansford RG. Measurement of mitochondrial free Ca concentration in living single rat cardiac myocytes. American Journal of Physiology. 1991;261:H1123–1134. doi: 10.1152/ajpheart.1991.261.4.H1123. [DOI] [PubMed] [Google Scholar]
- Moravec CS, Bond M. Effect of inotropic stimulation on mitochondrial calcium in cardiac muscle. Journal of Biological Chemistry. 1992;267:5310–5316. [PubMed] [Google Scholar]
- Prakriya M, Solaro CR, Lingle CJ. [Ca2+]i elevations detected by BK channels during Ca2+ influx and muscarine-mediated release of Ca2+ from intracellular stores in rat chromaffin cells. Journal of Neuroscience. 1996;16:4344–4359. doi: 10.1523/JNEUROSCI.16-14-04344.1996. [DOI] [PMC free article] [PubMed] [Google Scholar]
- Pusch M, Neher E. Rates of diffusional exchange between small cells and a measuring patch pipette. Pflügers Archiv. 1988;411:204–211. doi: 10.1007/BF00582316. [DOI] [PubMed] [Google Scholar]
- Rizzuto R, Simpson AW, Brini M, Pozzan T. Rapid changes of mitochondrial Ca2+ revealed by specifically targeted recombinant aequorin. Nature. 1992;358:325–327. doi: 10.1038/358325a0. [DOI] [PubMed] [Google Scholar]
- Rutter GA, Theler JM, Murgia M, Wollheim CB, Pozzan T, Rizzuto R. Stimulated Ca2+ influx raises mitochondrial free Ca2+ to supra micromolar levels in a pancreatic B-cell line. Journal of Biological Chemistry. 1993;268:22385–22395. [PubMed] [Google Scholar]
- Satoh H, Delbridge LMD, Blatter LA, Bers D. Surface:volume relationship in cardiac myocytes studied with confocal microscope and membrane capacitance measurements: species-dependence and developmental effects. Biophysical Journal. 1996;70:1494–1454. doi: 10.1016/S0006-3495(96)79711-4. [DOI] [PMC free article] [PubMed] [Google Scholar]
- Spurgeon HA, Stern MD, Baartz G, Rafaeli S, Hansford RG, Talo A, Lakatta EG, Capogrossi MC. Simultaneous measurement of Ca2+, contraction, and potential in cardiac myocytes. American Journal of Physiology. 1990;258:H574–586. doi: 10.1152/ajpheart.1990.258.2.H574. [DOI] [PubMed] [Google Scholar]
- Stehno-Bittel L, Sturek M. Spontaneous sarcoplasmic reticulum calcium release and extrusion from bovine, not porcine, coronary artery smooth muscle. The Journal of Physiology. 1992;451:49–78. doi: 10.1113/jphysiol.1992.sp019153. [DOI] [PMC free article] [PubMed] [Google Scholar]
- Thayer SA, Miller RJ. Regulation of the intracellular free calcium concentration in single rat dorsal root ganglion neurons in vitro. The Journal of Physiology. 1990;425:85–115. doi: 10.1113/jphysiol.1990.sp018094. [DOI] [PMC free article] [PubMed] [Google Scholar]
- Tse WF, Tse A, Hille B. Cyclic Ca2+ changes in intracellular stores of gonadotrophs during gonadotropin-releasing hormone-stimulated Ca2+ oscillations. Proceedings of the National Academy of Sciences of the USA. 1994;91:9750–9754. doi: 10.1073/pnas.91.21.9750. [DOI] [PMC free article] [PubMed] [Google Scholar]
- Vaghy PL, Johnson JD, Matlib MA, Wang T, Schwartz A. Selective inhibition of Na+-induced Ca2+ release from heart mitochondria by diltiazem and certain other calcium antagonist drugs. Journal of Biological Chemistry. 1992;257:6000–6002. [PubMed] [Google Scholar]
- Wendt-Gallitelli MF, Isenberg G. Total and free myoplasmic calcium during a contraction cycle: X-ray microanalysis in guinea-pig ventricular myocytes. The Journal of Physiology. 1991;435:349–372. doi: 10.1113/jphysiol.1991.sp018514. [DOI] [PMC free article] [PubMed] [Google Scholar]
- White RJ, Reynolds IJ. Mitochondria and Na/Ca exchanger buffer glutamate-induced calcium loads in cultured cortical neurons. Journal of Neuroscience. 1995;15:1318–1328. doi: 10.1523/JNEUROSCI.15-02-01318.1995. [DOI] [PMC free article] [PubMed] [Google Scholar]
- Wu J, Vreecke J, Carmeliet E, Lipsius SL. Ionic currents activated during hyperpolarization of single right atrial myocytes from cat heart. Circulation Research. 1991;68:1059–1069. doi: 10.1161/01.res.68.4.1059. [DOI] [PubMed] [Google Scholar]
- Ying WL, Emerson J, Clarke MJ, Sanadi DR. Inhibition of mitochondrial calcium ion transport by oxo-bridged dinuclear ruthenium amine complex. Biochemistry. 1991;30:4949–4952. doi: 10.1021/bi00234a016. [DOI] [PubMed] [Google Scholar]
- Yue DT, Marban E, Wier WG. Relationship between force and intracellular [Ca2+] in tetanized mammalian heart muscle. Journal of General Physiology. 1986;87:223–242. doi: 10.1085/jgp.87.2.223. [DOI] [PMC free article] [PubMed] [Google Scholar]
- Zhou Z, Neher E. Mobile and immobile Ca2+ buffers in bovine adrenal chromaffin cells. The Journal of Physiology. 1993a;469:245–273. doi: 10.1113/jphysiol.1993.sp019813. [DOI] [PMC free article] [PubMed] [Google Scholar]
- Zhou Z, Neher E. Calcium permeability of nicotinic acetylcholine receptor channels in bovine adrenal chromaffin cells. Pflügers Archiv. 1993b;425:511–517. doi: 10.1007/BF00374879. [DOI] [PubMed] [Google Scholar]