

Abstract
Isotonic shortening velocities at very light loads were examined in single fibres of the anterior tibialis muscle of the frog, Rana temporaria, using load-clamp recording and slack tests (temperature, 1–3 °C; initial sarcomere length, 2.25 μm).
Shortening velocities at very light loads (force-clamp recording) were found to be higher early in the rise of a tetanic contraction than during the plateau of the contraction. The upper limit of the load at which there was elevated shortening velocity early in the contraction was 1.5–5.4 % of the maximum tetanic tension (Fo) depending on the particular fibre.
The maximum shortening velocity determined using the slack test method (Vo) was as much as 30 % greater early in a contraction than at the tetanic plateau. Vo was elevated above the plateau level up to about 30 ms after the end of the latent period, which is equivalent to the time required for the force in an isometric contraction to rise to about 30 % of Fo. Vo is depressed below the plateau value during relaxation at the cessation of stimulation.
Simulation studies show that the cross-bridge model of Huxley (1957) predicts the maximum shortening velocity to be greater early in a contraction, when new actin binding sites are becoming activated and new cross-bridge connections are being formed rapidly, than during steady-state contraction. The elevated shortening velocity in the model is a consequence of new cross-bridges being formed in the pulling configuration, and there being a delay before the newly added bridges are dragged beyond their equilibrium position so they begin to retard shortening. The model also predicts that maximum shortening velocity should be depressed below the plateau level during early relaxation as cross-bridge binding sites are rapidly removed from the active population.
The maximum shortening velocity of a muscle or muscle fibre, which is the shortening velocity reached at zero load, has proven to be a particularly useful parameter for understanding the basic mechanisms of muscle contraction, as well as for characterizing the diversity in performance among different muscles and muscle fibres. The maximum shortening velocity of a muscle fibre is nearly independent of fibre length, and therefore of filament overlap (Gordon, Huxley & Julian, 1966; Edman, 1979; Granzier, Burns & Pollack, 1989). It is similar in twitches and in tetanic contractions, even if the intracellular calcium release during the twitch is sufficiently reduced by treatment with dantrolene to reduce twitch tension to one-half to one-tenth of its normal value (Edman, 1979). In skinned fibres in which muscle activation is varied by manipulation of the calcium concentration in the bathing solution, maximum velocity is nearly independent of the degree of fibre activation at higher levels of activation, although it is depressed when activation levels are low and velocity is measured after some shortening has already occurred (Ford, Nakagawa, Desper & Seow, 1991; Moss, Diffee & Greaser, 1995). Maximum velocity is depressed by muscle fatigue, but less so than is the maximum tetanic force (Edman & Mattiazzi, 1981; Curtin & Edman, 1994; Westerblad & Lännergren, 1994).
The relative constancy of maximum shortening velocity during changes in sarcomere length and changes in the degree of activation, both factors which should change the number of participating cross-bridges, is consistent with the model of muscle contraction of Huxley (1957). In this model cross-bridges from thick filaments attach to thin filaments and pull them toward the centre of the sarcomere. In a shortening muscle some cross-bridges get dragged beyond their equilibrium position before they detach, and then retard rather then promote filament sliding. The force-velocity properties of a muscle are determined by the balance between forces generated by cross-bridges which are attached on the Z-line side of their equilibrium position, and are ‘pullers’, and the force of those cross-bridges which have been dragged beyond their equilibrium position but have not yet detached, and are therefore ‘retarders’. The fraction of cross-bridges which are pullers declines while the fraction which are retarders increases with increasing shortening velocity. When there is no external load on a muscle, the maximum velocity is reached when the total force generated by the retarding cross-bridges just balances that of the pulling cross-bridges so there is no net force promoting shortening. In this model the maximum shortening velocity depends on the ratio of pulling to retarding cross-bridges and not the absolute number of cross-bridges which are active, which is why the model predicts that maximum shortening velocity should not change with filament overlap or degree of fibre activation.
Most measurements of shortening velocity have been done with muscles or muscle fibres which are in a steady state of activation. Determinations of shortening velocity with living fibres are typically made during the plateau of a tetanic contraction. In skinned fibres also measurements are generally made well after activation has reached a steady state. During an investigation of the time course of muscle activation (K. A. P. Edman & R. K. Josephson, unpublished observations), we found that early in a tetanic contraction, when the level of activation is changing rapidly, the maximum shortening velocity is greater than it is during the tetanic plateau. The elevated maximum shortening velocity is detectable only very early in a tetanus and at very light loads. The following report further quantifies the time course and degree of elevated shortening velocity early in a contraction, and also shows that there is an equivalent depression of shortening velocity during relaxation. A simulation study demonstrates that an elevated shortening velocity very early in a tetanus is to be expected from Huxley's (1957) model of cross-bridge action, and further, that the Huxley model predicts depressed shortening velocity early in relaxation. A brief account of this work was presented at a meeting of The Physiological Society (Edman & Josephson, 1990).
METHODS
Measurements were made from single muscle fibres isolated from the anterior tibialis muscle of the frog Rana temporaria. The frogs were killed by decapitation followed by destruction of the spinal cord. The fibres were mounted horizontally in a saline bath, suspended between a strain gauge (AE 801, Aksjeselskapet Mikroelektronikk, Horten, Norway) and a lever projecting from the moving arm of a servo-controlled puller. The puller was used to rapidly change the length of the fibre in slack test measurements of shortening velocity, or to allow shortening at a rate that maintained fibre force constant during isotonic measurements. A water jacket surrounding the saline bath maintained its temperature at 1–3°C. In any single experiment the temperature varied by less than 0.5°C. The initial fibre length was adjusted such that the sarcomere length, as measured by laser diffraction, was 2.25 μm. The fibre was stimulated with 0.2 ms current pulses passed between two platinum-plate electrodes, one on each side of the fibre and about 2 mm from it. The stimuli were approximately 15 % above threshold for the fibre. The pulses were delivered in 1–2 s trains at a frequency (14–22 Hz) just sufficient to give a fully fused mechanical response. Trials were presented regularly at 2 min intervals. The period of data collection was preceded by ten to twenty pacing trials at 2 min intervals. Details on preparing and mounting fibres, on the saline and apparatus used, and on the methods used to determine fibre length and cross-sectional area are given in Edman & Reggiani (1984).
The maximum shortening velocity of a fibre predicted by Huxley's (1957) cross-bridge model was determined for different times in a contraction using a computer model written in Pascal and implemented on an IBM-compatible personal computer. Details of the model are given below.
RESULTS
Maximum shortening velocity early in contraction: measurements with isotonic shortening and slack tests
The shortening velocity of a fibre contracting isotonically under very light load is greater early in a tetanus than at the tetanic plateau. However, the shortening velocity early in a contraction declines more rapidly as the load is increased than does the velocity during the plateau of the tetanus, with the result that force-velocity (F-V) curves determined early in a tetanus and during the plateau cross one another (Fig. 1, see also Edman & Josephson, 1990). Figure 2 summarizes the isotonic forces at which early and plateau F-V curves intersected in the ten fibres for which the density of experimental points was greatest, and therefore the resolution of the F-V curves highest, at low forces. The cross-over point for the F-V curves of these fibres occurred at loads ranging from 1.5 to 5.4 % of the maximum isometric force. The average force at cross-over for the data of Fig. 2, considering only the earliest F-V curve when two were collected during the tetanic rise, was 2.9 %Fo (n = 10; mean time after force onset, 35 ms). Thus for measurements made 30–50 ms after force onset, it is only with loads of about 3 %Fo or less that the isotonic shortening velocity can be expected to be greater early in a contraction than later.
Figure 1. Force-velocity curves derived from force clamp contractions ( = isotonic shortening) early in a tetanus and at the plateau of the contraction.
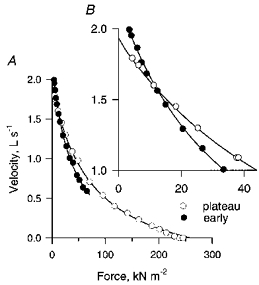
B is an expanded version of the upper left portion of A. For the early curve the fibre was released from isometric to isotonic contraction 31 ms after force onset, by which time the force had reached approximately 25 % of the maximum isometric force (Fo). Measurements of the force and velocity were taken 15 ms after the release to isotonic shortening when the isotonic force was less than 50 %Fo and 20–50 ms after release to larger isotonic force, the longer delay being required at the higher forces because it took longer for the velocity to reach an approximate steady state. Examples of the kinds of original records from which such curves are derived are given in Edman, Mulieri & Scubon-Mulieri (1976) and in Edman & Hwang (1977). The continuous lines are best fits to a Hill equation using the method of Wohlfart & Edman (1994).
Figure 2. Isotonic forces at which F-V curves obtained early in contractions intersected those from the plateau of the contraction.
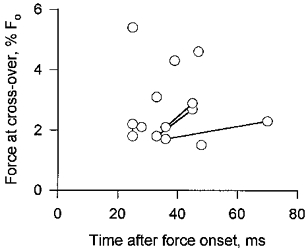
Circles joined by lines are instances in which two early F-V curves were obtained from a single fibre. The abscissa indicates the time after the initial isometric force onset at which velocity was measured, which was 15–20 ms after the release to isotonic shortening.
The elevated maximum shortening velocity of a fibre early in a contraction is perhaps most easily demonstrated with the slack test. In the slack test a fibre is quickly released by an amount great enough to bring the force to zero. The slackened fibre is then allowed to shorten under what is effectively no load until the slack is taken up and tension redevelopment begins. This procedure is repeated at different release distances. A plot of release distance against slack time ( = time from release to onset of force development) has a slope, Vo, which is the shortening velocity under zero load (Edman, 1979). Figure 3 shows two examples of tension redevelopment following quick releases in slack tests. In each example one set of releases came very early during the tetanic contraction (force traces marked E), the other set at a later time during the contraction (traces marked L). The preparations of Fig. 3A and B were chosen as examples in part because in both the delay to force redevelopment following the shorter release (R1) is nearly identical for the releases early and late in contraction (force traces ER1 and LR1). The shortest release distances which we used in slack tests were 2.8–4 % in different preparations. With these release distances slack times in all preparations were similar for releases early and late in contraction but not always indistinguishable. In three out of seven preparations the slack time was slightly shorter for the release late in contraction; in one it was shorter for the early release. It is instructive that similar releases early and late in a contraction can sometimes result in nearly identical slack times. Part of the shortening after the quick release of a slack test is taken up by elastic recoil of stretched series elastic elements, the remainder by filament sliding under zero load. The distance of elastic recoil is greater the greater the force at the time of release. Thus for a given release distance, the shortening distance required of contractile elements to take up the slack is greater the lower the force at the time of release. The similarity of the delays to force redevelopment following similar releases early in contraction, when the force and the elastic recoil were low, and late in contraction, when force and elastic recoil were high and therefore the distance of filament sliding reduced, in itself indicates that the shortening velocity under zero load is greater early in contraction than later.
Figure 3. Tension redevelopment following quick release in slack test measurements of Vo.
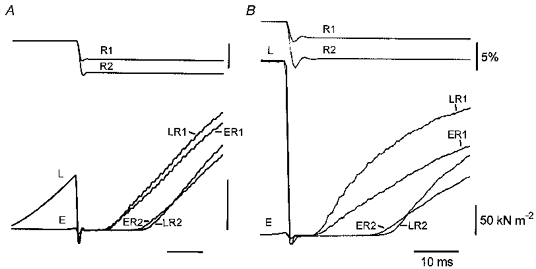
A and B are from different fibres. A fibre contracted isometrically until it was released and allowed to shorten rapidly for different distances, each of which was more than sufficient to bring the force to zero. The fibre then redeveloped tension at the new length. Each panel compares force redevelopment following a pair of releases (R1, R2) early in contraction (traces marked E) with those following later releases (traces marked L). The traces have been positioned horizontally such that the early and late releases are aligned. In A the early releases occurred when the force had reached approximately 0.5 %Fo and the later releases when the force reached 24 %Fo. In B the force was 1.9 %Fo at the early releases, and the late releases were during the plateau of the contraction.
The difference in the delay to force redevelopment between a short and a long release, each of which brings the force to zero, is a measure of maximum shortening velocity uncomplicated by the recoil of stretched elastic elements. In both Fig. 3A and B increasing the release distance from R1 to R2 led to a smaller increase in slack time for the release early in contraction (ER1 to ER2) than for that later in the contraction (LR1 to LR2), clearly demonstrating that the shortening velocity under no load was greater early in the contraction. This is further illustrated in Fig. 4A which shows that the slope of the relation between release amplitude and slack time is steeper ( = higher velocity) when measurements are made during the early rising phase than during the plateau of a tetanus.
Figure 4. Release distance and associated slack times for a slack test early in a tetanic contraction, at the plateau of the contraction, and during relaxation.
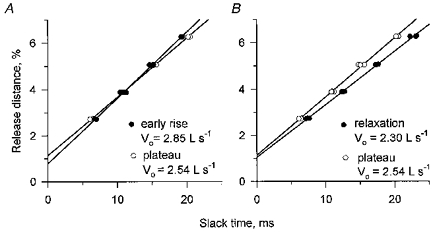
The early releases in A occurred 7.5 ms after force onset, by which time force had risen to approximately 8 %Fo. The releases during relaxation occurred when the force had dropped to about 79 %Fo. The lines through the data points are least squares, linear regressions. The slopes of these lines are the shortening velocities under zero load (Vo). The slopes of the two regressions in A and of the two in B are significantly different (P < 0.01).
Although the maximum shortening velocity is greater early in a tetanus than later, the rate of force increase after the end of the slack period is slower early in the contraction (Fig. 3). Muscle activation is incomplete early in a contraction and shortening velocities at other than very light loads are slower early in the contraction than they are during the plateau (Fig. 1; see also Cecchi, Colomo & Lombardi, 1978, 1981; Cecchi, Colomo, Lombardi & Piazzesi, 1979). The slower rise of force following early than following later releases is presumably largely a reflection of this incomplete activation. Still another factor that probably contributes to the slower tension rise after early releases is shortening induced deactivation. This depressant effect of shortening (see overview article, Edman, 1996), is insignificant when the movement occurs at full activation, such as during the tetanus plateau, but is pronounced after shortening at submaximal activation.
Slack tests were done at different times during the rise of tetanic contractions in order to chart the decline in Vo following the onset of stimulation. There was considerable variation from fibre to fibre in the time course of the decline in Vo (Fig. 5). In general the maximum shortening velocity was substantially greater than the plateau value only during the first 20 ms or so after force onset, which is equivalent to the time which the force would have taken to reach about 30 %Fo had the contraction been isometric. The average shortening velocity during the tetanic rise for the data of Fig. 5, considering only the earliest set of slack tests in preparations in which two or more sets of slack tests were obtained during the rise, was 16 % greater then the velocity during the tetanic plateau (s.d. = 6.2 %, n = 12; mean time of measurement was 16 ms after force onset).
Figure 5. Slack test measurements of Vo early in a tetanic contraction relative to that during the plateau of the contraction.
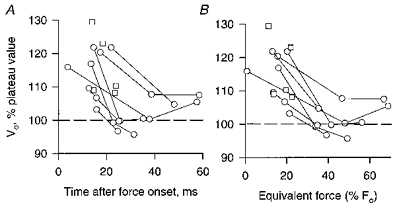
□, data from fibres in which a single determination of Vo was obtained during the rise of the contraction for comparison with the value of Vo during the plateau. ○, from fibres in which 2 or more determinations of Vo were obtained at different times during the rise of the contraction. The time of the measurement was taken to be the mid-point of the slack interval. In order to define this time as narrowly as possible, only the shortest two release distances were used to determine Vo in experiments like those of Fig. 3 in which 3 or more different release distances were applied at a given release time. The ‘equivalent force’ of B is the isometric force, relative to Fo, at the same time after the stimulus onset as the Vo measurement.
The higher value of Vo observed early in a tetanus is probably a consequence of the rapid increase in activation at this time (see Discussion). If this is so, the maximum speed of shortening would be expected to be lower during the linear phase of relaxation, when activation is falling off rapidly, than during the tetanus plateau. Changes in Vo during relaxation were not examined in detail, but in four fibres, including that of Fig. 4, Vo was measured during relaxation using releases applied when muscle force had declined to 79–83 % of Fo, which is well before the ‘shoulder’ during the relaxation of isometric tension. Vo during relaxation was indeed found to be lower than the plateau value (Fig. 4B). In the four fibres investigated the maximum speed of shortening during relaxation ranged from 84 to 92 % of the plateau value.
The possibility that the decline in the maximum speed of shortening between the rising phase and the plateau of a tetanus is a consequence of the accumulation of metabolic products was examined by determining shortening velocities during the early rise and plateau of two closely spaced tetani. If the decline in shortening velocity were due to accumulation of metabolic products, then the shortening velocity in the second tetanus of a pair, separated from the first by only a short interval, should be depressed relative to that in the first tetanus. The results of an experiment testing this hypothesis are illustrated in Fig. 6. The fibre was stimulated at regular, 2 min intervals to produce two isometric tetani in rapid succession. The second tetanus in each pair was initiated approximately 250 ms after the first tetanus had fully relaxed (see inset in Fig. 6). The rest intervals preceding the two contractions were thus approximately 2 min and 250 ms, respectively. As can be seen in Fig. 6, the F-V curves obtained from load-clamp recordings, and the intercepts of each of these curves with the velocity axis ( = maximum velocity), were very nearly the same during the plateau in both tetani. The F-V relation measured during the rising phase (20 ms after the latent period) was likewise similar in the two tetani; in both cases the velocities recorded at the smallest loads were clearly higher than during the plateau. The cross-over point of the F-V relations derived early and late during contraction was close to 2 %Fo in both tetani. In a parallel experiment with a different fibre, slack-test measurements were obtained at the times indicated in Fig. 6 (inset), i.e. on the tetanus plateau and approximately 15 ms after the onset of tension rise in both of two closely spaced contractions. It was found that in each of the two tetani, Vo was significantly higher (P < 0.001) soon after the onset of activation than during the tetanic plateau (Table 1). These results, showing that the maximum speed of shortening is similar early in the rise of two closely spaced tetanic contractions, indicates that the decline in maximum velocity between the early rise and the plateau of a tetanus is unlikely to be due to the accumulation of metabolic products.
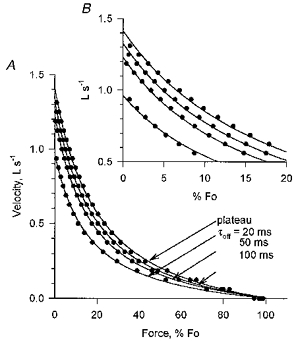
Figure 6. F-V curves obtained from load clamp recordings early in the rising phase (•) and during the plateau (○) of tetanic contractions.
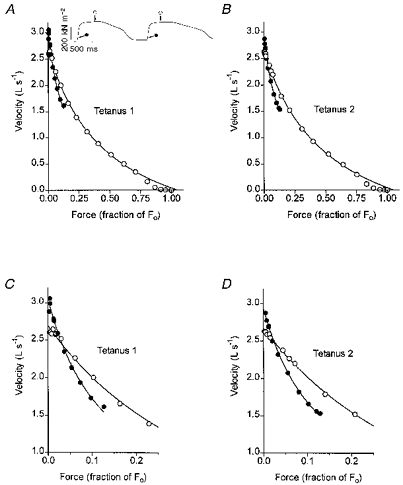
A and B are from the first and second tetanic contractions of a pair; C and D show the early portions of each of these curves on an expanded time base. Inset: oscilloscope records of two isometric tetani initiated in rapid succession. Arrows with open and filled symbols indicate times at which the fibre was released for load-clamp recordings.
Table 1.
Vo (slack tests) recorded early during the rising phase and during the plateau of two closely spaced tetani
| Tetanus 1 | Tetanus 2 | |||
|---|---|---|---|---|
| Early rising phase | Plateau | Early rising phase | Plateau | |
| V0 (L s−1) | 3.19 ± 0.03 | 2.46 ± 0.01 | 2.90 ± 0.05 | 2.40 ± 0.01 |
| r2 | 0.9920 | 0.9994 | 0.9810 | 0.9975 |
Vo (mean ± s.e.m.) was obtained as the slope of the linear regression linking release distance and slack time. n = 10 slack test releases for each value of Vo. r2 is the squared correlation coefficient.
Huxley's cross-bridge model predicts a decline in shortening velocity early in contraction and relaxation
Despite the advancing age of Huxley's (1957) model of muscle contraction based on independent cross-bridges, and the wealth of information about contraction that has been obtained since it was proposed, the model is still widely used for exploring and explaining mechanical aspects of muscle contraction (e.g. Goldman, 1987; Harry, Ward, Heglund, Morgan & McMahon, 1990; Zahalak & Ma, 1990; Ford, 1991; Moss, Diffee & Greaser, 1995; Rome, Syme, Hollingworth, Linstedt & Baylor, 1996). Huxley's model was developed for the steady-state case, that in which the fraction of cross-bridges bound to thin filament sites at any level in a sarcomere does not change with time. The preceding section demonstrates that the maximum shortening velocity of frog muscle fibres is highest very early in a tetanic contraction, declines to a steady value during the plateau of the contraction, and then declines still further during relaxation. The following is an extension of Huxley's (1957) analysis of steady-state kinetics to the onset of contraction, when the population of attached cross-bridges is rising toward its steady-state value, and to relaxation when the number of active cross-bridges declines. Our goal in doing this was to determine if a decline in maximum velocity early in contraction and relaxation is to be expected from Huxley's cross-bridge model.
The model
The muscle is assumed to be composed of interdigitating arrays of thick (myosin) and thin (actin) filaments. Cross-bridges project from the thick filaments. Thermal agitation results in rapid oscillation of unattached cross-bridges along the axis of the thick filament. The oscillation is about an equilibrium position for each cross-bridge. There are binding sites to which the cross-bridges can attach on the thin filaments. Each cross-bridge can interact with only one actin binding site, the nearest. The probability distribution of actin binding sites is uniform over the distance reached by a single cross-bridge in its oscillation. The position of an actin binding site, x, is measured with respect to the equilibrium position of the nearest cross-bridge. The distance is positive if the actin site is on the Z-line side of the cross-bridge equilibrium point and negative if the actin site is toward the centre of the sarcomere from the equilibrium point. The maximum positive value of x at which a cross-bridge can form a new attachment to an actin binding site is h.
It is assumed that actin sites are inactive in a resting muscle, incapable of forming an attachment to a cross-bridge, and that muscle activation in response to stimulation involves an alteration of actin sites from non-permissive to permissive binding states. This assumption is a change from the original Huxley model in which there was a constant population of potential binding sites. During stimulation the fraction of activated binding sites (A) out of the total population of sites is assumed either to be constant at 1, or to rise with time (t) following the onset of stimulation according to the following relationship, where τon is a supplied time constant:
| (1) |
The fraction of activated sites declines exponentially at the end of stimulation according to the relationship:
| (2) |
where Ao is the fraction of activated sites at the end of stimulation and τoff is a supplied inactivation time constant. A decision had to be made as to how to treat cross-bridges attached to binding sites which became inactivated during relaxation. The equivalent physiological question is what happens to an attached cross-bridge when calcium dissociates from that control site on troponin which activates the binding site to which the cross-bridge is attached? It was decided that an attached cross-bridge would not detach immediately when its binding site became inactivated; rather it would detach with the usual dissociation kinetics governing active binding sites.
In the model, force is calculated from the distribution along the x-axis of actin binding sites to which cross-bridges are attached. The following diagram summarizes the states of the cross-bridge binding sites and the transitions between these states. Transitions indicated by dotted arrows apply only to relaxation.
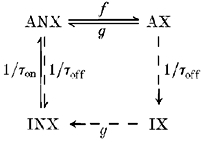
f, g, 1/τon and 1/τoff are rate constants for the indicated transitions; ANX, activated, no cross-bridges; AX, activated, with cross-bridges; INX, inactivated, no cross-bridges; IX, inactivated, with cross-bridges.
Consider the population of cross-bridge binding sites throughout the muscle which lie in the interval (x, x+Δx). The rate of change in the proportion of those actin binding sites in this interval which are both active and with attached cross-bridges is given by:
| (3) |
where f is the association rate constant and g is the dissociation rate constant.
The brackets on the right side of eqn (3) enclose the proportion of activated, unbound sites in the interval. The product of this and the rate constant, f, is the rate of formation of new bridge connections in the interval. The last term in the relation, gAX, is the rate of bridge dissociation in the interval. Rate constants f and g are functions of x, specifically:
| (4) |
| (5) |
| (6) |
The equation equivalent to eqn (3) for a relaxing muscle is:
| (7) |
The product, (1/τoff)AX, represents the rate at which binding sites to which cross-bridges are attached become inactivated. The equation governing the rate of formation of inactivated binding sites to which are attached cross-bridges is:
| (8) |
It is assumed that a cross-bridge attached to a binding site at other than x = 0 produces a shearing force, Fi, between the actin and myosin filaments which is proportional to the displacement, xi, of the bridge from its equilibrium position:
where k is bridge stiffness. The force, Fx, generated by the population of cross-bridges attached in interval (x, x+Δx), relative to that which would be produced were there cross-bridges attached to all the binding sites in the interval, is:
| (9) |
Bridges formed at positive values of x, toward the Z-line of a sarcomere from the equilibrium position, tend to shift the filaments to greater overlap, i.e. to cause muscle shortening. A cross-bridge which is pulled by muscle shortening into the region x < 0 produces force, again proportional to x, which retards further shortening. A maximum shortening velocity is reached when the total force produced by all cross-bridges in the region x < 0 just balances the shortening force produced by the bridges attached at x > 0.
Muscle force was evaluated with the model during simulated constant velocity shortening (velocity clamp) or during isometric contraction, by determining the proportion of actin sites bound to cross-bridges as a function of x, and summing the force contributions of the attached cross-bridges over the total range of x for which there were attached bridges. Distance along the x-axis was divided into a series of length bins, each usually of width 0.1 %h. The changing proportion of sites bound to cross-bridges in the interval represented by each length bin was calculated for a series of time steps, typically of 0.1 ms, using eqns (1)-(9) above. A fourth-order Runge-Kutta evaluation was used to lessen the dependence of the performance of the model on the duration of the time step. The model behaviour was found to be relatively independent of the size of the length bin. Muscle shortening or lengthening was simulated by shifting the value for the proportion of actin sites bound to bridges in each length bin an appropriate number of bin widths toward smaller values of x for shortening or toward larger values of x for lengthening. The simulated shortening or lengthening was done at the end of each evaluation at a new time step. The following values, based on those proposed by Huxley (1957, pp. 288 and 295), were used in simulations:
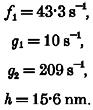 |
Sarcomere length, used in calculating strain rate, was assumed to be 2.5 μm. The bridge stiffness, k, enters as a scaling factor for force and disappears when force is expressed as relative force, F/Fo.
Muscle force was determined as a function of time for a number of isovelocity contractions at different shortening velocities. These data were used to construct F-V curves for varied times following the onset of activity using the procedure of Wohlfart & Edman (1994). The fitted curves were used to determine the shortening velocity at zero load.
It seems reasonable to expect there to be a limit in the extent to which an attached cross-bridge can be dragged beyond its equilibrium position before the strain becomes so great that the bridge is pulled free or breaks. We have arbitrarily taken the maximum strain distance to be 3h. Any bridge which is dragged this far from its equilibrium position is detached. Even at shortening velocities approaching the maximal velocity only a very small fraction of the total bridge population still remained attached at a strain distance of 3h, and imposing this distance as a maximum strain had very little effect on the calculated force.
The interdigitating filaments in the model are assumed to be rigid, and the array of filaments to extend from one end of the muscle to the other. These assumptions lead to two significant differences between the behaviour expected of the model and that of real muscles. First, there are no series elastic elements in the model as there are in muscle. Thus the F-V properties of the model are those of the filaments and cross-bridges alone, without distortion introduced by length changes occurring in compliant components which are in series with the filaments. Second, because the filaments are rigid, they can produce negative, compressive force when shortening velocities greater than the maximum which the muscle can generate are imposed on the muscle. The fibres of real muscle withstand tension but not, to any great extent, compression. If shortening velocities greater than the maximum velocity are imposed on living muscle, the muscle becomes slack. Periods of negative force in the model correspond to periods during which real muscles would be slack.
Results
A common way to characterize the F-V relationship of a muscle or a muscle fibre is to measure force during the shortening following release from isometric to isovelocity contraction. Figure 7 compares force trajectories predicted by the simulation model following release to isovelocity shortening early in a tetanic contraction, during the plateau of the contraction, and during early relaxation. It is to be noted that for all three release times force is not constant but changes during the course of the imposed isovelocity shortening.
Figure 7. Force trajectories predicted by the simulation model during release from isometric contraction to isovelocity shortening early in a tetanus (Aa and b; release when force = 5 %Fo), during the plateau of the tetanus (Ba and b) and early in relaxation (Ca and b; release when force = 90 %Fo).
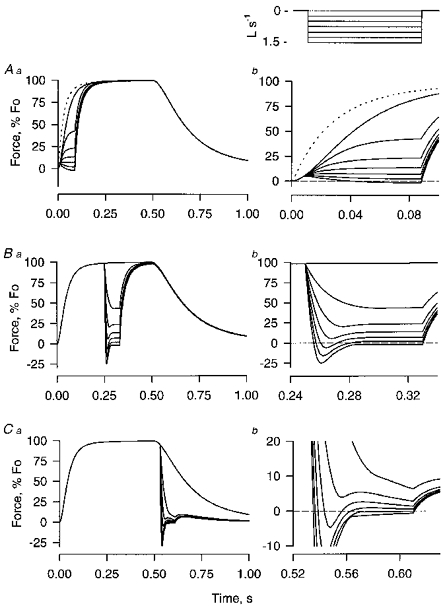
The right column shows the shortening part of the response on an expanded time base. The activation time constant (τon) was 20 ms, the inactivation time constant (τoff) was 50 ms. The dahsed line in A is the rise of isometric force predicted by the model for instantaneous activation of cross-bridge binding sites.
There are two factors leading to the variation in force during isovelocity shortening. One is a shift in the distribution of already attached cross-bridges engendered by a change in shortening velocity. This factor is particularly important during releases from high force levels; and it is responsible for the large, transient, negative-going force changes at the onset of shortening in the releases during the tetanic plateau and during early relaxation of Fig. 7. The change in velocity here is from zero velocity during the isometric part of the contraction to the constant velocity of the release phase. The rising force during the isometric phase of the contraction is a consequence of the formation of a large population of cross-bridges attached on the pulling side, i.e. on the Z-line side, of their equilibrium position. The release to isovelocity shortening results in a shift of these attached cross-bridges through their equilibrium position to the retarding side where they produce negative force. The negative force wanes as the retarding cross-bridges dissociate and some of them reattach in the pulling position. A new steady-state distribution of cross-bridges, and a constant force level, develops within a few tens of milliseconds following a release during the tetanic plateau. With releases during relaxation, forces tend to decline following recovery from the initial negative transient, as cross-bridges are removed from the active population. In real muscles the presence of a series elastic element would modify, and perhaps totally obscure, initial force transients resulting from cross-bridge movement such as those in Fig. 7. The decline in force resulting from a shift in attached cross-bridges would allow stretched series elastic elements to shorten. Thus part of the shortening imposed on the muscle would be taken up by shortening series elastic elements, lessening the shortening velocity of the contractile components themselves and in this way increasing the force generated by the contractile elements. The series elastic elements in real muscles act as a buffer which reduces the amplitude of rapid, transient force change produced by the contractile portion of the muscle.
The second factor leading to a change in force during the course of isovelocity shortening is a change in the distribution of attached cross-bridges resulting from changes in the size of the pool of activated cross-bridge binding sites. Such changes are associated with the addition of newly activated binding sites during the onset of contraction, and to the removal of active sites during relaxation. It was change in force due to changing populations of activated binding sites which was of particular interest in this study. Therefore measurements of force-velocity properties were made under conditions chosen to minimize force transients due to changing velocity. F-V properties early in contraction were quantified using shortening ramps which began at the same time as stimulation; thus there were no initial transients caused by displacement of already attached cross-bridges at the onset of shortening (Fig. 8C). F-V properties during the plateau were measured using either isovelocity shortening continued from the onset of stimulation into the plateau, or with releases from isometric to isovelocity shortening during the plateau. In the latter case measurements were made after the initial force transients had subsided (Fig. 8A and B). Measurements during relaxation were obtained by continuing isovelocity shortening, begun during the plateau, into relaxation (Fig. 8A and B).
Figure 8. The approach used to quantify force-velocity relationships.
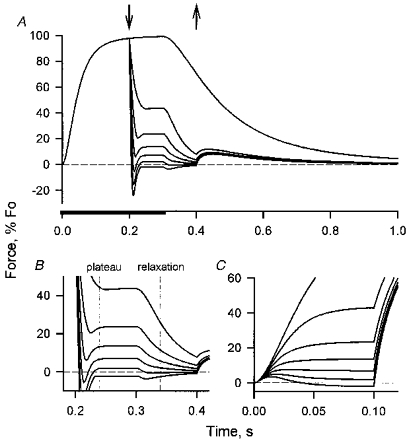
A, the muscle was stimulated and, when the force had reached a plateau, released to isovelocity shortening (τon = 20 ms, τoff = 50 ms). Shortening continued after the end of stimulation into the relaxation phase. The down arrow indicates the start of shortening, the up arrow the end of shortening. The stimulation period is marked by thickening of the time axis. The shortening velocities imposed on the muscle were 0, 0.25, 0.5 … 1.5 lengths per second. B, expansion of the portion of A during which there was shortening. The vertical lines indicate when force-velocity measurements were made to characterize the F-V relationships during the plateau of contraction and during early relaxation (Fig. 12). C, force during isovelocity shortening (0, 0.25, 0.5 … 1.5 l s−1) early in the contraction. Here the shortening began at the same time as stimulation, rather than following release from a developing isometric contraction as in Fig. 7A. Note that at the highest velocity shown the muscle force is positive early in the contraction, but negative later, indicating a decline in the maximum shortening velocity.
If the activation time constant is set at 0, so that all actin binding sites become instantaneously activated, the muscle force during an isometric contraction rises abruptly with an approximately hyperbolic trajectory (Fig. 7A, dotted line). The time to half-maximum force is about 20 ms. Increasing the activation time constant to 20 ms results in a sigmoidal force trajectory with a time to half-maximum tension of about 42 ms (Fig. 7A, 2; top continuous line).
The maximum velocity, determined from the F-V curves predicted by the model, does decline early in a contraction (Figs 9-11). With instantaneous muscle activation, the maximum velocity drops quickly and is within 5 % of the asymptotic value in 15–20 ms (Fig. 11A). With an activation time constant of 20 ms, the declining maximum velocity is within 5 % of the asymptotic value in 40–45 ms. With either instantaneous activation or activation with a 20 ms time constant, maximum velocity is close to its asymptotic value at an elapsed time equivalent to that taken by muscle force to rise to 40–50 % of Fo during an isometric contraction (Fig. 11). The basic reason for the enhanced velocity in the model is that the bridges form in a pulling position, and it is only after some time that a bridge becomes displaced across the equilibrium position so that it begins to retard shortening. During the onset of contraction new bridges are rapidly recruited, and the new bridges form in the pulling configuration. Early in a contraction the ratio of bridges which are pullers to those which are retarders is greater than in the steady state, and so, therefore, is the maximum shortening velocity.
Figure 9. Force-velocity relationships 20 and 200 ms after force onset calculated from the Huxley model.
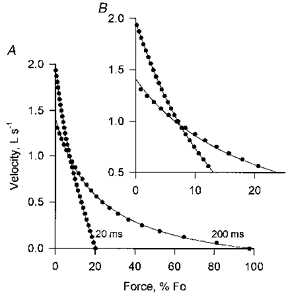
B is an expanded version of the upper left portion of A. These results were obtained with isovelocity shortening which began at the onset of stimulation. τon = 20 ms. The calculated values are shown as points; the continuous lines are Hill curves fitted to these points. This figure shows that (1) a Hill curve provides a reasonable fit to calculated values even when activation time is made part of the model, and (2) the Huxley model predicts elevated shortening velocity at low force early in a contraction.
Figure 11. Maximum shortening velocity (Vmax) during the rise of contraction as predicted by the Huxley model.
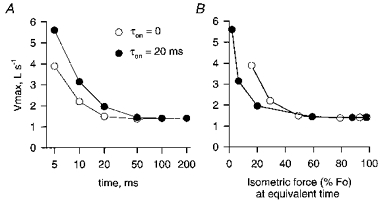
The values for maximum velocity were determined from Hill curves fitted to sets of calculated F-V points. Values are plotted as a function of time after force onset (A) and as a function of the isometric force which would have been measured at the time at which the F-V data were collected (B).
Figure 10. The progressive change predicted by the Huxley model in the form of force-velocity curves early in contraction.
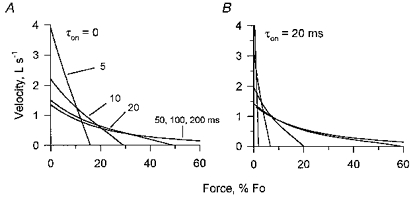
The lines indicate the calculated F-V curves at 5, 10, 20, 50, 100 and 200 ms after force onset for instantaneous activation (A) and for activation with a time constant of 20 ms (B).
F-V curves generated by the model for early relaxation are depressed relative to the plateau curve and have smaller values for maximum velocity (Fig. 12). The extent of the depression is a function of the relaxation time constant. The shorter is the time constant, the more rapid is the removal of active binding sites from the population and the greater is the depression of the F-V curve relative to the plateau position. This emphasizes the importance of the rate of change of the binding site population as a determinant of the instantaneous F-V properties of a muscle.
Figure 12. Force-velocity curves predicted by the model for the plateau of the contraction and for early relaxation with different relaxation time constants.
B is an expanded version of the upper, left portion of A. Measurements during the plateau were made 40 ms after the release to isovelocity shortening, by which time the initial force transients were largely over, especially for the releases to higher velocities and lower steady-state force. Measurements during relaxation were taken 40 ms after the end of stimulation.
DISCUSSION
Is elevated velocity early in contraction due to passive recoil?
The procedures used to measure maximum shortening velocity early and late in a tetanic contraction involved release from isometric contraction to a lower force in isotonic measurements or to zero force in slack tests. Part of the shortening during and following release is due to passive recoil of stretched elastic elements - elastic components which are in parallel with the cross-bridges and which produce resting force at longer lengths, and components which are in series with the cross-bridges. At the initial sarcomere length in these experiments, 2.25 μm, there is essentially no resting tension, so there is no significant contribution of passive force from stretched parallel elastic filaments to the fibre shortening upon release to isotonic or to unloaded shortening (for discussion of the effects of passive recoil on measurements of maximum shortening velocity when there is passive force see Edman, 1979; Claflin, Morgan & Julian, 1989). Series elastic elements do become stretched during the isometric portion of the contraction. Recoil of series elastic elements could contribute to the measured shortening velocity if, as proposed by Seow & Ford (1992), the shortening of stretched elastic elements is damped so that the recovery extends into the measurement period. Damped recoil of elastic elements would increase the shortening velocity of a fibre, and the effect should be greater the greater the stretch of elastic elements at the release. Damped series elastic elements would increase apparent shortening velocity more at the plateau of a tetanic contraction when the force at release is high than early in the contraction when the initial force is low. Thus recoil of damped elastic elements cannot account for the high maximum shortening velocity early in a tetanic contraction. It is apparently cross-bridge dynamics rather than stored elastic energy which powers the elevated maximum shortening velocity at the onset of a tetanus.
Huxley's (1957) cross-bridge model and behaviour of living muscles
In Huxley's model the reaction kinetics for the formation and dissolution of cross-bridges between thick and thin filaments depends on the position of the cross-bridges with respect to their equilibrium position. Cross-bridge connections to thin filaments form only on the Z-line side of their equilibrium position. Bridges on the Z-line side of equilibrium generate a force which tends to slide thin filaments toward the centre of the sarcomere and thus to produce muscle shortening. The shortening force is opposed by the external load if there is one, and, for shortening muscle, by the retarding force generated by cross-bridges which have been dragged beyond their equilibrium position but which have not yet detached. The velocity is maximum when there is no external load. At maximal velocity the net force generated by the pulling bridges is just balanced by the net force of the retarding bridges.
At the onset of contraction actin binding sites become activated and the population of sites available to which cross-bridges might make connection increases rapidly. During this period the maximum shortening velocity predicted by the model is greater than that during the plateau of contraction (Figs 9-11). The elevated velocity is a consequence of the rapid recruitment of newly activated sites into the available pool, and the fact that when bridges form connections to these sites the bridges are formed as pullers, producing muscle shortening. Only after some shortening has occurred are the newly formed bridges dragged beyond their equilibrium position to retard shortening. The rapid addition of newly available binding sites results in an increase in the ratio of pulling to retarding bridges above that which would pertain in a steady state. In unloaded muscle the extra force generated by the newly added pulling bridges results in acceleration of filaments and higher shortening velocity until the increasing number of cross-bridges dragged into a retarding configuration, and the greater distance to which individual bridges become stretched, is such that the summed retarding force of the stretched bridges balances the force produced by the rising number of pulling bridges. The model also predicts that during relaxation, when cross-bridges are being removed from the available population and therefore the rate of bridge formation declines, the ratio of pulling to retarding bridges will fall below the steady-state level and the maximum shortening velocity will be lower than that during the plateau of the contraction.
Huxley's cross-bridge model has survived, and been cherished, because it predicts many important features about the mechanics of muscle contraction: among others the general shape of the F-V curve, the relative independence of maximum shortening velocity on level of activation, and the importance of cross-bridge dissociation rate as a determinant of maximum shortening velocity. The model also predicts, it turns out, that the maximum shortening velocity should be elevated above the plateau level early in a contraction and depressed below the plateau level during relaxation. As is shown in the first section of this paper, such changes in maximum shortening velocity do occur in muscle fibres. As predicted by the model (Fig. 11), the enhanced shortening velocity early in a contraction is only detectable quite early in the contraction and at light loads. The time course of the elevation of shortening velocity predicted by the model, using the original model parameters proposed by Huxley, agrees remarkably well with that actually found in single muscle fibres (compare Figs 5A and 11A). The highest values for maximum velocity obtained with the model were substantially greater than those from real muscles, but this is largely due to differences in the earliest times examined in the real and in the simulation experiments. The model allows determination of shortening velocities as early as one wishes after the onset of activation. With living fibres it is difficult to determine values for maximum velocity sooner than 15–20 ms after force onset. At 20 ms after force onset, the model predicts a maximum velocity 6 % greater than the plateau level if activation is instantaneous, and 40 % greater than the plateau for an activation time constant of 20 ms (Fig. 11A). Thus the predicted values for velocity enhancement are quite similar to those actually measured at an equivalent time (compare Figs 5A and 11A). The agreement between experimental results and theory seems strong evidence that the Huxley scheme, in which cross-bridges act as independent force generators at positive and negative strain, does underlie muscle contraction.
The Huxley model is not the only model which might explain the relative independence of maximum shortening velocity and degree of muscle activation. One could imagine the rate of longitudinal movement of an individual cross-bridge during a working cycle being intrinsically force dependent. If there were an internal load on the filaments, the maximum shortening velocity would increase with increasing numbers of cross-bridges sharing the force. If there were no internal load, the maximum rate of filament sliding would equal the maximum velocity of cross-bridge movement, no matter how many cross-bridges were involved. However under no obvious circumstances should the filament sliding velocity be greater than that in a fully activated muscle. The proposal that maximum shortening velocity is determined by, and is equal to, the maximum rate of movement of an individual cross-bridge is inconsistent with the finding that maximum velocity is greatest early in a contraction when activation is less than maximal but is rapidly increasing.
Maximum velocity and muscle activation
Abundant experimental evidence indicates that the rising muscle activation at the onset of contraction results from calcium released into the cytoplasm from the sarcoplasmic reticulum (SR), and that the declining activation during relaxation is a consequence of calcium uptake by the SR. The elevated maximum velocity of early contraction, and the depressed maximum velocity of early relaxation, occur during periods when the activation levels are rising or falling, but it is not the degree of activation per se, or, indirectly, the cytoplasmic calcium concentration, which is responsible for the deviations of maximal velocity from the plateau value; it is the rate at which activation changes. In skinned muscle fibres the maximum velocity measured shortly after release to isovelocity shortening is little altered as levels of muscle activation are changed by varying calcium concentration (summarized by Moss et al. 1995). Further, in intact frog muscle fibres, Vo measured by slack tests has been shown to remain quite constant as the level of activation is reduced by depressing the release of calcium from the sarcoplasmic reticulum (Edman, 1979). In our physiological and simulation measurements the maximum velocity is greatest very early in the contraction, when activation is low but rising rapidly, and declines as activation increases but its rate of change decreases (Figs 5 and 11). We have not charted the extent to which depression of maximum velocity changes throughout relaxation, but it is clear in preliminary simulation studies that the maximum velocity is more depressed shortly after the cessation of stimulation, when activation is high but dropping rapidly, than later when activation is lower but changing less rapidly. Further, the depression of maximum velocity in early relaxation is quite sensitive to the value of the relaxation time constant, a parameter whose principal effect is to alter the rate at which inactivation proceeds. Deviations of maximum velocity from the plateau value reflect not overall levels of activation, but rather the rate of change of the intensity of activation.
Why has elevated shortening velocity early in a contraction not been reported previously?
Several earlier studies have examined F-V properties during the rise of muscle contraction but, to the best of our knowledge, none before this one has noted an early elevation in the maximum shortening velocity. There are several possible reasons why the high shortening velocity early in a contraction may have been missed.
(1) Measurements were not made early enough in the contraction. We have not fully characterized the time which it takes for the early elevation of maximum shortening velocity to decline to the plateau value, but we estimate that the period of enhanced shortening velocity is essentially over by the time that it would take the force, were the contraction isometric, to reach 30 %Fo (Fig. 4B). In a set of studies by Cecchi et al. (1978, 1979, 1981) and by Ambrogi-Lorenzini, Colomo & Lombardi (1983), muscle fibres were released from isometric contraction to isovelocity shortening early in a tetanus, and the force during shortening was used to monitor the early development of the F-V relationship. The release to isovelocity shortening usually occurred after the force had risen to at least 25 % of Fo, and the interval over which shortening velocity was measured came even later. Thus in these studies the determinations of shortening velocity probably came too late to see the early elevation in maximum shortening velocity.
(2) Velocities were not measured with sufficient resolution to detect the early increase. Lombardi & Menchetti (1984) extended the studies of Cecchi et al. to include the earliest parts of tetanic contractions. They report that the maximum shortening velocity very early in a tetanus is the same as that during the tetanic plateau. The difficulty here may be inherent in the use of isovelocity contractions to measure maximum shortening velocity. Lombardi & Menchetti measured the maximum shortening velocity as the minimum imposed velocity just adequate to bring and maintain contractile force at zero. The F-V curve is very steep near the zero force axis. The ratio of change in force to change in velocity becomes small at low force, making it difficult to determine accurately that velocity just needed to bring the force to zero. In our experiments shortening velocities measured in the first 20 ms after force onset were higher than at the tetanic plateau, but only by 10–20 %. It seems possible that such small elevations in the shortening velocity would not have been detected in Lombardi & Menchetti's experiments given the expected low sensitivity of the isovelocity approach.
(3) Elevated shortening velocity was not noticed because it was not expected. A number of studies have been directed toward determining if maximum shortening velocity is or is not depressed when the level of muscle activation is low (see, for example, Julian, 1971; Podolin & Ford, 1983; Moss et al. 1995). The possibility that maximum shortening velocity might be especially high when the level of activation is low but rising rapidly, as it is early in a tetanic contraction, seems not to have been considered. It is likely that enhanced shortening velocity early in a contraction has been overlooked largely because it was not expected.
Acknowledgments
This work was supported by NSF grants DCB-8811347, DCB-9104170, and IBN-9603187 to R. K. J.; and grants to K. A. P. E. from the Swedish Medical Council (14X-184), the Crafoord Foundation, and the Medical Faculty at the University of Lund. We thank Britta Kronborg for valued help with the physiological experiments, Garr Updegraff for assistance in developing the simulation model, and Dr J. Malamud for useful suggestions about the manuscript.
References
- Ambrogi-Lorenzini C, Colomo F, Lombardi V. Development of force-velocity relation, stiffness and isometric tension in frog single muscle fibres. Journal of Muscle Research and Cell Motility. 1983;4:177–189. doi: 10.1007/BF00712029. [DOI] [PubMed] [Google Scholar]
- Cecchi G, Colomo F, Lombardi V. Force-velocity relation in normal and nitrate-treated frog single muscle fibres during rise of tension in an isometric tetanus. The Journal of Physiology. 1978;285:257–273. doi: 10.1113/jphysiol.1978.sp012570. [DOI] [PMC free article] [PubMed] [Google Scholar]
- Cecchi G, Colomo F, Lombardi V. Force-velocity relation in deuterium oxide-treated frog single muscle fibres during the rise of tension in an isometric tetanus. The Journal of Physiology. 1981;317:207–221. doi: 10.1113/jphysiol.1981.sp013821. [DOI] [PMC free article] [PubMed] [Google Scholar]
- Cecchi G, Colomo F, Lombardi V, Piazzesi G. Development of activation and rise of tension in an isometric tetanus. Pflügers Archiv. 1979;381:71–74. doi: 10.1007/BF00582334. [DOI] [PubMed] [Google Scholar]
- Claflin DR, Morgan DL, Julian FJ. Effects of passive tension on unloaded shortening speed of frog single muscle fibers. Biophysical Journal. 1989;56:967–977. doi: 10.1016/S0006-3495(89)82742-0. [DOI] [PMC free article] [PubMed] [Google Scholar]
- Curtin NA, Edman KAP. Force-velocity relation for frog muscle fibres: effects of moderate fatigue and of intracellular acidification. The Journal of Physiology. 1994;475:483–494. doi: 10.1113/jphysiol.1994.sp020087. [DOI] [PMC free article] [PubMed] [Google Scholar]
- Edman KAP. The velocity of unloaded shortening and its relation to sarcomere length and isometric force in vertebrate muscle fibres. The Journal of Physiology. 1979;291:143–159. doi: 10.1113/jphysiol.1979.sp012804. [DOI] [PMC free article] [PubMed] [Google Scholar]
- Edman KAP. Fatigue vs. shortening-induced deactivation in striated muscle. Acta Physiologica Scandinavica. 1996;156:183–192. doi: 10.1046/j.1365-201X.1996.t01-1-198000.x. [DOI] [PubMed] [Google Scholar]
- Edman KAP, Hwang JC. The force-velocity relationship in vertebrate muscle fibres at varied tonicity of the extracellular medium. The Journal of Physiology. 1977;269:255–272. doi: 10.1113/jphysiol.1977.sp011901. [DOI] [PMC free article] [PubMed] [Google Scholar]
- Edman KAP, Josephson RK. Changes in the maximum speed of shortening during the rising phase of a tetanus in isolated muscle fibres of the frog. The Journal of Physiology. 1990;426.P:37P.. [Google Scholar]
- Edman KAP, Mattiazzi A. Effects of fatigue and altered pH on isometric force and velocity of shortening at zero load in frog muscle fibres. Journal of Muscle Research and Cell Motility. 1981;2:321–334. doi: 10.1007/BF00713270. [DOI] [PubMed] [Google Scholar]
- Edman KAP, Mulieri LA, Scubon-Mulieri B. Non-hyperbolic force-velocity relationship in single muscle fibres. Acta Physiologica Scandinavica. 1976;98:143–156. doi: 10.1111/j.1748-1716.1976.tb00234.x. [DOI] [PubMed] [Google Scholar]
- Edman KAP, Reggiani C. Redistribution of sarcomere length during isometric contraction of frog muscle fibres and its relation to tension creep. The Journal of Physiology. 1984;351:169–198. doi: 10.1113/jphysiol.1984.sp015240. [DOI] [PMC free article] [PubMed] [Google Scholar]
- Ford LE. Mechanical manifestations of activation in cardiac muscle. Circulation Research. 1991;68:621–637. doi: 10.1161/01.res.68.3.621. [DOI] [PubMed] [Google Scholar]
- Ford LE, Nakagawa K, Desper J, Seow CY. Effect of osmotic compression on the force-velocity properties of glycerinated rabbit skeletal muscle cells. Journal of General Physiology. 1991;97:73–88. doi: 10.1085/jgp.97.1.73. [DOI] [PMC free article] [PubMed] [Google Scholar]
- Goldman YE. Measurement of sarcomere shortening in skinned fibers from frog muscle by white light diffraction. Biophysical Journal. 1987;52:57–68. doi: 10.1016/S0006-3495(87)83188-0. [DOI] [PMC free article] [PubMed] [Google Scholar]
- Gordon AM, Huxley AF, Julian FJ. The variation in isometric tension with sarcomere length in vertebrate muscle fibres. The Journal of Physiology. 1966;184:170–192. doi: 10.1113/jphysiol.1966.sp007909. [DOI] [PMC free article] [PubMed] [Google Scholar]
- Granzier HLM, Burns DH, Pollack GH. Sarcomere length dependence of the force-velocity relation in single frog muscle fibers. Biophysical Journal. 1989;55:499–507. doi: 10.1016/S0006-3495(89)82843-7. [DOI] [PMC free article] [PubMed] [Google Scholar]
- Harry JD, Ward AW, Heglund NC, Morgan DL, McMahon TA. Crossbridge cycling theories cannot explain high-speed lengthening behavior in frog muscle. Biophysical Journal. 1990;57:201–208. doi: 10.1016/S0006-3495(90)82523-6. [DOI] [PMC free article] [PubMed] [Google Scholar]
- Huxley AF. Muscle structure and theories of contraction. Progress in Biophysics and Biophysical Chemistry. 1957;7:255–318. [PubMed] [Google Scholar]
- Julian FJ. The effect of calcium on the force-velocity relation of briefly glycerinated frog muscle fibres. The Journal of Physiology. 1971;218:117–145. doi: 10.1113/jphysiol.1971.sp009607. [DOI] [PMC free article] [PubMed] [Google Scholar]
- Lombardi V, Menchetti G. The maximum velocity of shortening during the early phases of the contraction in frog single muscle fibres. Journal of Muscle Research and Cell Motility. 1984;5:503–513. doi: 10.1007/BF00713257. [DOI] [PubMed] [Google Scholar]
- Moss RL, Diffee GM, Greaser ML. Contractile properties of skeletal muscle fibers in relation to myofibrillar protein isoforms. Reviews of Physiology, Biochemistry and Pharmacology. 1995;126:1–63. doi: 10.1007/BFb0049775. [DOI] [PubMed] [Google Scholar]
- Podolin RA, Ford LE. The influence of calcium on shortening velocity of skinned frog muscle cells. Journal of Muscle Research and Cell Motility. 1983;4:263–282. doi: 10.1007/BF00711996. [DOI] [PubMed] [Google Scholar]
- Rome LC, Syme DA, Hollingworth S, Linstedt SL, Baylor SM. The whistle and the rattle: the design of sound producing muscles. Proceedings of the National Academy of Sciences of the USA. 1996;93:8095–8100. doi: 10.1073/pnas.93.15.8095. [DOI] [PMC free article] [PubMed] [Google Scholar]
- Seow CY, Ford LE. Contribution of damped passive recoil to the measured shortening velocity of skinned rabbit and sheep muscle fibres. Journal of Muscle Research and Cell Motility. 1992;13:295–307. doi: 10.1007/BF01766457. [DOI] [PubMed] [Google Scholar]
- Westerblad H, Lännergren J. Change of the force-velocity relation, isometric tension and relaxation rate during fatigue in intact, single fibres of Xenopus skeletal muscle. Journal of Muscle Research and Cell Motility. 1994;15:287–298. doi: 10.1007/BF00123481. [DOI] [PubMed] [Google Scholar]
- Wohlfart B, Edman KAP. Rectangular hyperbola fitted to muscle force-velocity data using three-dimensional regression analysis. Experimental Physiology. 1994;79:235–239. doi: 10.1113/expphysiol.1994.sp003756. [DOI] [PubMed] [Google Scholar]
- Zahalak GI, Ma S-P. Muscle activation and contraction: constitutive relations based directly on crossbridge kinetics. ASME Journal of Biomechanical Engineering. 1990;112:52–62. doi: 10.1115/1.2891126. [DOI] [PubMed] [Google Scholar]