

Abstract
The effect of extracellular K+ on membrane currents of bull frog (Rana catesbeiana) taste receptor cells (TRCs) was investigated by the patch clamp and fast perfusion techniques. Extracellular K+ (2.5–90 mm) increased a TRC resting conductance and enhanced both inward and outward whole-cell currents.
To isolate the inward current activated by external potassium (PA current), TRCs were dialysed with 110 mm NMGCl while extracellular NaCl was replaced with NMGCl. Under these conditions, the PA current displayed an {font AaSans}S-shaped current-voltage (I-V) curve in the -100 to 100 mV range. Extracellular Rb+ and NH4+, but not Li+, Na+ or Cs+, evoked similar currents.
The PA current reversal potential (Vr) did not follow the equilibrium K+ potential under experimental conditions. Therefore, K+ ions were not the only current carriers. The influence of other ions on the PA current Vr indicated that the channels involved are permeable to K+ and H+ and much less so to Na+, Ca2+ and Mg2+. Relative permeabilities were estimated on the basis of the Goldman- Hodgkin-Katz equation as follows: PH:PK:PNa = 4000:1:0.04.
All I-V curves of the PA current were nearly linear at low negative potentials. The slope conductance at these voltages was used to characterize the dependence of the PA current on external K+ and H+. The slope conductance versus K+ concentration was fitted by the Hill equation. The data yielded a half-maximal concentration, K½ = 19 ± 3 mm and a Hill coefficient, nH = 1.53 ± 0.36 (means ± s.e.m.).
The dependence of the mean PA current and the current variance on the K+ concentration indicated a rise in the open probability of the corresponding channels as extracellular K+ was increased. With 110 mm KCl in the bath, the single channel conductance was estimated at about 6 pS. Taken together, the data suggest that extracellular K+ may serve as a ligand to activate specific small-conductance cation channels (PA channels). The mean number of the PA channels per TRC was estimated as at least 2000.
Extracellular Ba2+, Cd2+, Co2+, Ni2+ and Cs+ blocked the PA current in a potential-dependent manner. The PA current was blocked by Cs+ as quickly as the blocker could be applied (∼15 ms). The time course of the divalent cation block was well fitted by a single exponential function. The time constants were estimated at 26.5 ± 1.9, 41.7 ± 3.1, 56.1 ± 4.2 and 370 ± 18 ms at 1 mm Cd2+, Co2+, Ni2+ and Ba2+, respectively. The blocker efficiency at negative voltages followed the sequence: Cs+ > Cd2+ > Ba2+ > Ni2+ > Co2+.
The data indicate that protons and divalent blockers act within the PA channel pore and that H+ and the divalent ions probably act via similar mechanisms to affect the PA current. These observations and the strong pH dependence of the PA current Vr suggest that H+ occupation of the PA channel pore leading to interruption of K+ flux is the main mechanism of the pH dependence of the PA current.
Extracellular K+ enhanced the sensitivity of isolated TRCs to bath solution acidification due to activation of the PA channels. With 10 mm K+ in the bath, half-maximal depolarization of the TRCs was observed at pH values of 6.4–6.8. The possible role of the PA channels in sour transduction is discussed.
That the apical and basal portions of the taste receptor cell (TRC) plasma membrane are exposed to different media may be important to TRC function. In human blood plasma the K+ and Na+ ion concentrations are about 4 and 140 mm, respectively, while in resting saliva these concentrations are estimated as 46 and 3 mm (Bradley, 1991). Tight junctions between neighbouring cells in a taste bud or disc may create distinct compartments in the extracellular space, resulting in distinct extracellular K+ and Na+ gradients along the TRC surface. TRC physiology may critically depend on these gradients. Altered activity of TRC ion channels may lead to a transient redistribution of ions between the cell cytosol and the extracellular space, as is the case in other sensory and neuronal systems. For instance, light and odorants have been shown to change external K+ in amphibian retinas (Karwoski, Lu & Newman, 1989) and in frog olfactory epithelium (Khayary, Math & Trotier, 1991). The extracellular K+ concentration varies significantly in response to neuronal activity (Sykova, 1983).
Several cell types recognize and respond to small changes in the extracellular K+ concentration (for review, see Brown, 1991). Extracellular K+ is essential for neuronal activity since the spatial buffering of external K+ is presumably a specific and important function of glial cells (Orkand, Nicholls & Kuffler, 1966). Extracellular K+ has been shown to regulate the activity of fast K+ channels (Pardo et al. 1992; Baukrowitz & Yellen, 1995). These data suggest that K+ ions may serve as an extracellular messenger in many cellular systems. In the present study we have examined how extracellular K+ regulates the frog TRC conductance.
METHODS
Cell preparation
Bullfrogs (Rana catesbeiana; 70–150 g) were decapitated and pithed. The tongue was excised and maintained in extracellular Na+ solution at 4°C to decrease saliva secretion. Thirty to thirty-five taste discs were dissected and collected in 1 ml of Ca2+-free solution (mm): NaCl, 110; KH2PO4, 3.5; MgCl2, 1; EGTA, 0.3; glucose, 5; and Hepes, 10; pH 7.2. A stock solution of collagenase (Sigma) was added to the taste disc suspension to yield a final concentration of 1 mg ml−1. The mixture was incubated for 20–25 min at room temperature (22–25°C). After collagenase-Ca2+-free treatment, taste discs were kept at 4°C for 3–5 h in the following solution (mm): NaCl, 110; KH2PO4, 3.5; MgCl2, 1; CaCl2, 0.1; glucose, 5; and Hepes, 10; pH 7.2. To dissociate taste tissue, two or three taste discs were sucked into a glass pipette (with an opening of 150–200 μm), and then expelled from the pipette into the electrophysiological chamber. This mechanical treatment resulted in a number of single TRCs and some small cell clusters containing TRCs and associated cells. TRCs were easily identified by their characteristic bipolar shape (Avenet & Lindemann, 1987) and frequently by the nerves that were still attached.
Solutions
The basic extracellular solution contained (mm): NaCl, 110; CaCl2, 1; MgCl2, 1; and Hepes-NaOH, 10; pH 7.2 (extracellular Na+ solution). The sodium-free extracellular solution contained (mm): N-methyl-D-glucamine (NMG) chloride or TEA-Cl, 110; CaCl2, 1; MgCl2, 1; and Hepes-NMGOH, 10; pH 7.2 (extracellular NMG or TEA solution). Calcium- and/or magnesium-free external solutions contained 1 mm EGTA and/or EDTA instead of Ca2+ and Mg2+, respectively. All extracellular solutions containing KCl were different from the corresponding extracellular Na+, NMG or TEA solutions in that NaCl, NMGCl or TEACl were replaced with equimolar KCl to keep the total Cl− concentration constant. The patch pipette solution contained (mm): KCl or NMGCl or TEACl, 110; MgCl2, 1; EGTA, 1; K2ATP, 2; and Hepes-KOH or Hepes-NMGOH, 10; pH 7.2 (intracellular K+ or NMG or TEA solution). Therefore, intracellular NMG or TEA solution dialysing the voltage clamped TRCs contained 4 mm K+. In some experiments, patch pipettes contained 104 mm NMGCl + 6 mm KCl instead of 110 mm NMGCl to elevate pipette K+ to 10 mm. To record Vm, an intracellular K+ solution with 0.1 mm instead of 1 mm EGTA was used. In all cases at pH 5.5–6.4, 10 mm Hepes was replaced with 10 mm Mes.
Tetrodotoxin (TTX) was from Research Biochemicals International; sodium methylsulphate (NaMeSO4) was from IN Biomedical Inc. (New York, NY, USA). All other chemicals were from Sigma Chemical Co.
Perfusion systems
Two thin parallel glass plates placed horizontally 1 mm apart served as the recording chamber (about 100 ml volume). The chamber was equipped with slow and fast perfusion systems. The slow perfusion system continuously perfused the entire chamber by gravity (1–2 ml min−1). The fast perfusion system provided a local change of the solution composition. A solution was released into the chamber from a 100 μm hole in the wall of a plastic tube (o.d. = 1 mm, i.d. = 0.7 mm) (Fig. 1A). The tube was connected to an eight-channel perfusing system that maintained a constant hydraulic pressure gradient along the tube (i.e. P and P1, Fig. 1A, left panel). Complete solution replacement in the tube took about 20 s. Hydraulic pressure was less in the tube than in the chamber, leading to suction of a small fraction of the chamber solution (Fig. 1A, left panel). An air pulse created a pressure excess in the tube perfusing system (i.e. ΔP, Fig. 1A, right panel) leading to the quick release of the tube solution into the chamber (Fig. 1A, right panel). The injected solution was removed from the chamber via re-suction into the tube and by the slow perfusion system. Air pulses were generated by a Picospritzer (General Valve Co., Fairfield, NJ, USA) controlled by a computer.
Figure 1. Perfusion of the recording chamber.

A, slow perfusion of the entire chamber (SP) and fast local solution replacement (FP) (for comments see text). B, the family of liquid junction potentials indicating time course of stimulus delivery. The potentials were generated by serial local replacement of the bath solution each 4 s for 1 min. C, the fast perfusion replacement of extracellular NaCl by the same solution did not cause any artifacts due to mechanical disturbance of the cell (left panel); voltage-gated Na+ current is inhibited as a result of fast replacement of extracellular NaCl with NMGCl (right panel). The cell was dialysed with intracellular NMG solution (4 mm KCl).
TRC stimulation
The stimulus time course was assessed by the liquid junction potential (LJP) that arises as a result of local solution replacement. The measuring electrode was placed 200 mm from the hole of the perfusing tube (Fig. 1A) (the standard position of the patch pipette for TRC stimulation). With 110 mm NaCl in the electrode, the chamber was perfused by 110 mm NMGCl. Application of a 200 ms air pulse to the fast perfusion system (at the zero time, Fig. 1B) evoked the transient release of 110 mm KCl and a change in potential between the measuring and reference electrodes (that was delayed 30–300 ms depending on the magnitude of air pressure). Data obtained with an intermediate pressure are presented in Fig. 1B. The time course of stimuli was influenced by solution density and viscosity and parameters that can influence them (i.e. temperature, ion concentration, pH and so on). Variations in stimulus lag time and duration of the initial phase, evoked by the differential chemical composition of liquid stimuli, were rendered negligible by adjusting the air pulse pressure.
Figure1C (left panel) illustrates temporal variations of whole-cell current during TRC stimulation. The cell was slowly perfused with 110 mm NaCl and clamped at -70 mV. Application of 110 mm NaCl via the fast perfusion system did not induce a current change, indicating the absence of any artifacts due to mechanical disturbance of the cell. The TRC was polarized by voltage ramp during stimulation. The ramp initiated a fast transient inward current that could be blocked by TTX (data not shown), indicating voltage-gated Na+ current. The subsequent fast application of 110 mm NMGCl led to reversible suppression of the resting current and elimination of the voltage-gated Na+ current (Fig. 1C, right panel). These data suggest that NaCl was fully replaced with NMGCl within 25 ms. In principle, the solution surrounding the TRC could be exchanged within 5 ms. However, such forceful local perfusion frequently destroyed the whole-cell preparations. Gentler TRC stimulation preserved the preparations, but resulted in a replacement time of 15–30 ms.
Patch clamp recordings
Recordings were made using an Axopatch-1D amplifier (Axon Instruments) at a filter cut-off frequency of 2–5 kHz. For whole-cell clamping, the patch membrane was ruptured by a 1 V pulse. Voltage whole-cell clamp, outside-out mode and current whole-cell clamp were used. Data were acquired by a Digi Data 1200 interface (Digi Data Corp., Jessup, MD, USA) at 0.1–10 kHz and analysed by pCLAMP software (Axon Instruments). In the experiments described below, series resistance ranged from 10 to 20 MΩ and was compensated for by 70–85 %. This significantly reduced membrane potential (Vm) errors, which did not exceed 1–3 mV for 1 nA whole-cell current. Data were not corrected for voltage errors due to series resistance, since the Vm errors were typically quite small.
Ramp generated current-voltage curves and reversal potential
To generate I-V curves, TRCs were polarized by voltage ramp (generally a 1 mV ms−1 ramp from -100 to 100 mV). The time-dependent whole-cell current (I(t)) at varying voltages is given by:
| (1) |
where G is the integral time- and potential-dependent conductance; Vr is the reversal potential of the current; C is the membrane capacitance. Hence, the voltage ramp evoked a constant shift of the true ionic current that was directly proportional to the membrane capacitance and the ramp speed. The whole-cell current recorded in the presence of external K+ (IK) can be presented as a sum of K+ sensitive and insensitive (Io) components:
| (2) |
| (3) |
where Go and Vr,o are the conductance and reversal potential, respectively, of the K+ insensitive component while GK and Vr,K are the conductance and the reversal potential of the K+ sensitive component. Vr of the potassium-activated (PA) current was determined by the intersection of I-V curves in the absence and in the presence of extracellular K+. Therefore, the PA current Vr is the solution of the equation Io = IK which is equivalent to:
| (4) |
Thus, the intersect method gives the true value of the PA current Vr even if the membrane capacitance was not fully compensated for.
The current Vr is a function of internal and external concentrations of permeable ions. The ion activity in the cell cytoplasm may be estimated, but its exact value is unlikely to be known even in the case of dialysed cells. Even if diffusion exchange between the pipette and the cell cytoplasm fully compensates for ion leakage through the plasma membrane, the presence of macromolecules, cytoskeletal and membrane structures in the cell cytoplasm may affect the ion activity. In addition, the membrane potential can only be determined to an accuracy of a few millivolts due to the existence of a Donnan potential (Marty & Neher, 1995) and the LJP (Neher, 1992).
In accordance with the Goldman-Hodgkin-Katz equation (see Hille, 1992), the absolute value and Vr shift are theoretically equivalent means with which to characterize ionic permeabilities. However, the Vr shift follows the extracellular ion concentration independently of the concentration of cytoplasmic ions in the case of a pure cationic (or anionic) current. In addition, apparently constant factors that contribute to the membrane potential uncertainty (e.g. amplifier offset potential, Donnan potential), are subtracted when the Vr shift is calculated. Therefore, we characterized channel selectivity using the Goldman-Hodgkin- Katz equation for the Vr shift and the Vr shift as an experimental parameter.
Liquid junction potential correction
The patch clamp amplifier offset is typically adjusted to zero current before seal formation. If the pipette and bath solutions differ, the offset voltage includes a LJP between these solutions. Since the LJP disappears after gigaohm seal formation (for discussion, see Barry & Lynch, 1991) Vm must be corrected by this value. In the case of voltage clamp whole-cell recordings, Vm at the given command voltage (V) is (Neher, 1992):
| (8) |
where Vlj is the value of LJP that is the potential of the bath solution with respect to the pipette solution (Barry, 1992). Local perfusion (Fig. 1A) gives rise to a LJP between the bath solution and the solution close to the cell (Fig. 1A, right panel, solutions 1 and 2, respectively). As a result, Vm must be corrected for two LJPs, according to Neher (1992):
| (9) |
where V2,1 is a value of LJP of solution 2 with respect to solution 1.
We measured the LJPs (in at least 3 independent experiments for each Vlj) for a number of solutions with respect to the extracellular Na+ solution (as described by Neher, 1992). The data obtained (means ± s.e.m.) are summarized in Table 1 and were used to correct Vm. Correction of the I-V curves does not influence the slope conductance since it is independent of a shift along any axis. Therefore, we corrected the I-V curves only in those cases where Vr was measured. Note that because of the LJP convention (Barry, 1992), V2,1 and Vlj in eqn (9) have different polarities for the same solutions, e.g. 110 mm NMGCl solution with respect to 110 mm NaCl solution has Vlj = -8.6 mV and V2,1 = 8.6 mV (Table 1).
Table 1.
Liquid junction potentials
| Solution composition (mm) | ||||||||||||
|---|---|---|---|---|---|---|---|---|---|---|---|---|
| Sol. | NMG-MeSO4 | NMGCl | KCl | RbCl | NH4Cl | CaCl2 | MgCl2 | EGTA | K2ATP | Buffer | pH | Vlj (mV) |
| 1 | — | 110 (104) | (6) | — | — | — | 1 | 0.1 | 2 | 10 KOH-Hepes | 7.2 | −5.8 ± 0.3 (−5.6 ± 0.2) |
| 2 | 55 | 55 (45) | (10) | — | — | 1 | 1 | — | — | 10 NMGOH-Hepes | 7.2 | −2.6 ± 0.1 (−1.8 ± 0.1) |
| 3 | — | 90 | — | 20 | — | 1 | 1 | — | — | 10 NMGOH-Hepes | 7.2 | −5.7 ± 0.2 |
| 4 | — | 90 | — | — | 20 | 1 | 1 | — | — | 10 NMGOH-Hepes | 7.2 | −5.8 ± 0.2 |
| 5 | — | 110 (100) | (10) | — | — | 1 | 1 | — | — | 10 NMGOH-Hepes | 8.0 | −8.4 ± 0.3 (−7.0 ± 0.2) |
| — | 110 (100) | (10) | — | — | 1 | 1 | — | — | 10 NMGOH-Hepes | 7.2 | −8.6 ± 0.2 (−7.9 ± 0.2) | |
| — | 110 (100) | (10) | — | — | 1 | 1 | — | — | 10 NMGOH-Mes | 6.4 | −6.9 ± 0.3 (−5.1 ± 0.2) | |
| — | 110 (100) | (10) | — | — | 1 | 1 | — | — | 10 NMGOH-Mes | 5.5 | −6.4 ± 0.3 (−4.2 ± 0.2) | |
| 6 | — | 110 | 0 | — | — | 1 | 1 | — | — | 10 NMGOH-Hepes | 7.2 | −8.6 ± 0.2 |
| — | 107.5 | 2.5 | — | — | 1 | 1 | — | — | 10 NMGOH-Hepes | 7.2 | −8.4 ± 0.3 | |
| — | 105 | 5 | — | — | 1 | 1 | — | — | 10 NMGOH-Hepes | 7.2 | −8.1 ± 0.3 | |
| — | 100 | 10 | — | — | 1 | 1 | — | — | 10 NMGOH-Hepes | 7.2 | −7.9 ± 0.2 | |
| — | 85 | 15 | — | — | 1 | 1 | — | — | 10 NMGOH-Hepes | 7.2 | −7.4 ± 0.3 | |
| — | 90 | 20 | — | — | 1 | 1 | — | — | 10 NMGOH-Hepes | 7.2 | −6.7 ± 0.2 | |
| — | 70 | 40 | — | — | 1 | 1 | — | — | 10 NMGOH-Hepes | 7.2 | −3.4 ± 0.2 | |
| — | 20 | 90 | — | — | 1 | 1 | — | — | 10 NMGOH-Hepes | 7.2 | 2.9 ± 0.2 | |
The liquid junction potentials (LJPs) were measured with respect to the extracellular Na+ solution (sol.) (see ‘Solutions’). The bracketed values under solution composition indicate that 110, 55 and 110 mm NMGCl in the solutions from the first second and fifth rows were substituted for 104 mm NMGCl + 6 mm KCl, etc. The LJP values are indicated in the corresponding brackets in the right column (Vlj), where Vlj is the value of LJP that is the potential of the bath solution with respect to the pipette solution (Barry, 1992).
RESULTS
With 110 mm KCl in the patch pipette and 110 mm NaCl in the chamber, a small (< 50 pA) inward current was typically recorded at -70 mV. A large inward current was activated by extracellular potassium (PA current) in a dose-dependent manner (Fig. 2A). External K+ strongly increased the integral conductance and enhanced its potential dependence at negative voltages. This K+ effect was especially pronounced if NMG or TEA was substituted for intracellular K+ (Fig. 2B and C). Therefore, in most of our experiments TRCs were dialysed with the intracellular NMG solution. With NaCl in the bath, whole-cell recordings were very stable and longer lasting than those carried out in the external NMG solution. So TRCs were continuously perfused by 110 mm NaCl and briefly stimulated by replacement of NaCl with NMGCl + KCl = 110 mm. These ionic conditions eliminated both the inward voltage-gated Na+ and the outward K+ currents.
Figure 2. Effect of extracellular K+ on whole-cell current.

A, inward currents evoked by K+ at different concentrations. The TRC was dialysed with intracellular K+ solution. Extracellular K+ was applied (slow perfusion) by replacement of 110 mm NaCl in extracellular Na+ solution with NaCl + KCl = 110 mm. B and C, extracellular K+ increased both inward and outward whole-cell currents. The TRCs were dialysed with intracellular NMG (10 mm KCl) and TEA (4 mm KCl) solutions (B and C, respectively). TRCs were stimulated by the slow perfusion system. In all cases the holding potential (Vh) was -70 mV. Application of extracellular KCl inhibited the voltage-gated Na+ current (B) for several seconds via a currently unknown mechanism. Frequently, washout of external K+ did not restore the Na+ current, indicating an indirect effect of external K+ on the Na+ current (data not shown).
Dependence of PA current on K+ concentration
Slow perfusion
PA current recordings were initially performed using the slow perfusion system. TRCs were clamped at -70 mV and polarized by 50 ms pulses ranging from -100 to 70 mV (Fig. 3A). In the absence of external K+, the voltage pulses evoked small transient and sustained currents (Fig. 3A, upper current family) characterized by near-linear steady-state I-V curves (Fig. 3C). External K+ produced an inward resting whole-cell current along with an increase in the membrane conductance. Currents evoked by the voltage pulses exhibited a pronounced transient component, that was never observed in the absence of K+, at voltages more negative than -60 mV (Fig. 3A, middle current traces). The steady-state I-V curves of the PA current were S-shaped at several different K+ concentrations (Fig. 3B). At any external K+ concentration, the dependence of the current peak on step voltage was nearly linear (Fig. 3C, continuous lines). At any K+ concentration, the peak current reversed apparently at the same potential as the sustained current (Fig. 3C, triangles). In addition, both currents were blocked by Cs+ and divalent cations (see below). These observations imply that the peak and sustained currents are transported through the same pathways. Therefore, the current transient results from inactivation of the PA current.
Figure 3. Dependence of whole-cell current on extracellular K+.
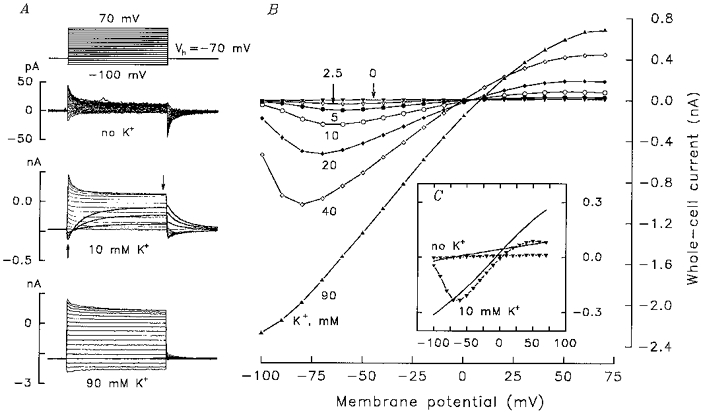
A, 50 ms voltage step protocol and families of whole-cell currents in response to step stimulation with different concentrations of K+ in the bath. Peak and steady-state currents were measured at the moments indicated by the upward and downward arrows, respectively. B, steady-state whole-cell current versus step voltage at varying K+ concentrations. C, steady-state (triangles) and peak currents (continuous lines) versus step voltage in the absence and presence of 10 mm K+. The patch pipette was filled with intracellular NMG solution (4 mm KCl).
The interaction of a channel and its permeant ions is one of the factors determining channel gating (Bennekou & Christophersen, 1990; Armstrong & Cota, 1991). PA current inactivation clearly depended on the extracellular K+ concentration and almost fully disappeared at 90 mm KCl (Fig. 3A, bottom current traces). Inactivation also depended on external Ca2+, Mg2+ and H+ concentrations (data not shown). Therefore, PA current inactivation probably comes from the voltage-dependent interaction of the channels with K+ and other ions rather than from intrinsic inactivation of the channels.
The PA current Vr at any given K+ concentration was determined by the intersection of the I-V curves measured in the presence and absence of KCl in the bath. An increase in the K+ concentration from 2.5 to 90 mm shifted the Vr by about 20 mV (Fig. 3B). This may indicate imperfect K+ selectivity. Some data, however, suggested the inappropriateness of the slow perfusion protocol in the experiments described above. For instance, the I-V curve measured when the PA current reached saturation (Fig. 4A, inset, current transient 1) displayed Vr = 23 mV (at 15 mm KCl) (Fig. 4A, curve 1). In 7 s the Vr shifted -19 mV (Fig. 4A, curve 2). The following consideration may explain the time-dependent shift of I-V curves. With 10 mm KCl in the bath, the magnitude of the inward PA current was generally not less than 100 pA at -70 mV. This level of current is equivalent to the monovalent cation influx of 1 fmol s−1. The frog TRC volume may be estimated as 200–400 fl. Therefore, 1 fmol s−1 K+ influx might elevate internal K+ by 3–5 mm s−1. When TRCs were dialysed with the intracellular NMG solution, the outward K+ currents disappeared within 1–5 min, this time being characteristic of intracellular K+ replacement. This slow (< 2 mm K+ s−1) diffusional exchange between the TRC and the patch pipette cannot prevent K+ accumulation in the TRC cytoplasm if K+ influx is high as was the case with our experiments. We therefore only performed Vr measurements in experiments where the fast application of K+ and the fast generation of I-V curves were done.
Figure 4. Taste receptor cell responses to fast K+ application and voltage ramp polarization.
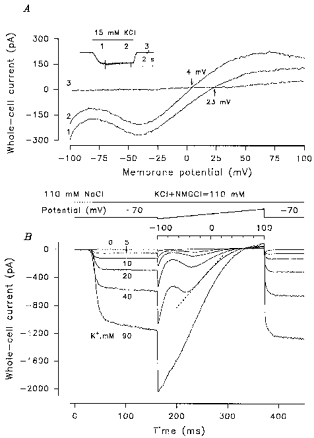
A, time variation of the PA current Vr during prolonged application of 15 mm K+. The inset illustrates evolution of the PA current. The current transients (1, 2, 3) indicate the moments of voltage ramp application to generate the I-V curves (1, 2, 3, respectively). The I-V curve generated 5 s before K+ application (data not shown) was identical to curve 3. B, family of current records in response to fast K+ application and voltage ramp polarization. The upper inset shows the protocols of local solution replacement and cell polarization, respectively. In all cases the TRCs were dialysed with intracellular NMG solution (4 mm KCl) and stimulated by extracellular NMG solutions with 110 mm NMGCl or NMGCl + KCl = 110 mm. Vh = -70 mV.
Fast perfusion
In the experiments described below, TRCs were continuously perfused with 110 mm NaCl and briefly (for 500 ms) stimulated by the fast perfusion system (see Methods); 50–150 ms after K+ application, the I-V curve was generated by voltage ramp. Temporal changes of the whole-cell currents evoked by K+ application followed by voltage ramp polarization are presented in Fig. 4B. As illustrated, external K+ induced a large inward whole-cell current for ∼15–20 ms, suggesting an extracellular effect of the ions. The ramp generated I-V curves were nearly linear (Fig. 4B) in a distinctive region of voltages; depending on the external K+, this varied within the region between -50 and 10 mV. We fitted the I-V curves at these voltages by linear curves (Fig. 4B, dashed line) to determine the slope conductance and characterize the dependence of the PA current on external K+ (see below).
Raising the K+ concentration from 2.5 mm to 90 mm shifted the experimentally observed Vr of the PA current positively (Figs 4B and 5A). Current-voltage curves were corrected for the LJP of intracellular NMG solution and the LJPs of stimulus solutions with respect to extracellular Na+ solution. The shift of the corrected Vr as a function of external K+ displayed a slope of about 36 mV (Fig. 5B), versus a slope of about 60 mV per logarithmic unit for the K+ equilibrium potential. Therefore, K+ ions are not the only carriers of the PA current.
Figure 5. The PA current Vr as a function of extracellular K+.

A, fragments of I-V curves generated 100 ms after fast application of extracellular K+. The I-V curves were corrected for LJPs (Table 1). Rs (16 MΩ) was compensated for by 75 %. B, Vr shift versus the K+ concentration. The different symbols correspond to 6 TRCs. The shift was measured relative to the Vr recorded at 2.5 mm K+. Vr values were determined by the intersection of the I-V curves corrected for LJPs (see Methods). The straight line corresponds to the equation: ΔVr shift = 36ln([K+]o/2.5), where ΔVr shift is the Vr shift (mV) and [K+]o is the extracellular K+ concentration (mm). In all cases the TRCs were dialysed with intracellular NMG solution (4 mm KCl) and stimulated by extracellular NMG solutions with 110 mm NMGCl or NMGCl + KCl = 110 mm.
Channel selectivity
In addition to K+, other ions (Cl−, Mg2+, Ca2+ and H+) might carry the PA currents recorded with NMGCl in the bath. When the pH of the external NMG solution was changed from 7.2 to 6.4, the PA current Vr was shifted positively. At 10 mm KCl the shift (corrected for LJPs) was 13.5 ± 1.4 mV (n = 13, 6 cells) (Fig. 6A). This resulted in the following estimate (based on the Goldman-Hodgkin-Katz equation) of the relative proton permeability at 10 mm K+ and pH 7.2: PH/PK≈4000.
Figure 6. Dependence of the PA current on extracellular H+, Ca2+, Mg2+ and Cl−.
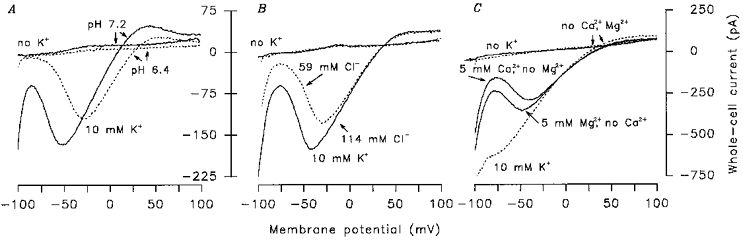
TRCs were briefly (for 500 ms) stimulated by the fast perfusion system and the I-V curves were generated 100–150 ms after stimulus application (Fig. 4B). A, the TRC was stimulated by extracellular NMG solution (pH 7.2 or 6.4) containing 110 mm NMGCl or 100 mm NMGCl + 10 mm KCl at pH 6.4 and 7.2. The patch pipette was filled with intracellular NMG solution (10 mm KCl). B, the TRC was stimulated as in A (the continuous I-V curves) or by similar solutions excepting replacement of 55 mm Cl− with 55 mm MeSO4− (the dashed I-V curves). C, the TRC was stimulated by modified extracellular NMG solutions with 110 mm NMGCl or 100 mm NMGCl + 10 mm KCl. Instead of 1 mm CaCl2+ 1 mm MgCl2 the following combinations were used: 1 mm EGTA + 1 mm EDTA; 1 mm EGTA + 5 mm MgCl2; 1 mm EDTA + 5 mm CaCl2. In B and C the patch pipettes were filled with intracellular NMG solution (4 mm KCl). The I-V curves were corrected for LJPs.
Inhibition of the PA current at pH 6.4 can be explained by potential-dependent blockage of K+-carried current by H+ ions (see below).
Substitution of 50 % of the Cl− ions in the bath with methylsulphate (MeSO4−) did not cause a significant shift in the PA current Vr (Fig. 6B). Therefore, Cl− ions are not carriers of the PA current. Note, that the PA current was attenuated at negative voltages (Fig. 6B) when MeSO4− was substituted for Cl−. The reasons for this effect of impermeant anions on the PA current are presently unknown. Note, however, similar observations from Aplysia muscles where Cl−/MeSO4− substitution inhibits distinctive K+ currents (Laurienti & Blankenship, 1996).
Ca2+ and Mg2+ only slightly, if at all, shifted the PA current Vr positively. At potentials more negative then -50 mV these ions strongly modified I-V curves (n = 8, 6 cells) (Fig. 6C) as was the case with the divalent blockers of the PA current (see below). This suggests that Ca2+ and Mg2+ are poorly permeable blockers of the PA current, unlikely to be the main current carriers.
Among other tested monovalent cations, Li+, Na+ and Cs+ did not evoke effects analogous to those described above. Extracellular Rb+ and NH4+ induced inward currents which displayed voltage and time dependence similar to those of the PA current (Figs 2-4). In addition, currents evoked by Rb+ and NH4+ were similarly inhibited by the blockers of the PA current (see below). This suggests that the currents (recorded in the presence of external K+, Rb+ and NH4+) were all transported via the same pathway and, therefore, Rb+ and NH4+ are also capable of gating the PA current. At the same ion concentration, the magnitudes of the Rb+- and NH4+-evoked currents were less than that of the K+-induced current. However, the Vr of the Rb+-induced current was shifted positively by 15 ± 2 mV, while that of NH4+-induced current was shifted negatively by 19 ± 1 mV (5 cells) (Fig. 7A). Neglecting the H+ contribution to the current at pH 7.2, one can estimate the relative permeabilities as PRb:PK:PNH4 = 1.9: 1:0.3.
Figure 7. Effects of extracellular cations on the whole-cell currents.

A, the TRC was stimulated by extracellular NMG solution with 110 mm NMGCl or 90 mm NMGCl + 20 mm KCl or 20 mm RbCl or 20 mm NH4Cl. B, the TRC was stimulated by extracellular NMG solution with 110 mm NMGCl or 100 mm NMGCl + 10 mm KCl and by extracellular Na+ solution with 110 mm NaCl or 100 mm NaCl + 10 mm KCl. In all cases the patch pipettes were filled with intracellular NMG solution (4 mm KCl). The I-V curves were corrected for LJPs.
Replacement of NMGCl with NaCl in the stimulus solution shifted the PA current Vr positively by 8.0 ± 0.9 mV (4 cells) (Fig. 7B). Therefore, although Na+ does not activate the PA current (Fig. 7B) it does permeate the PA channels to some extent in the presence of external K+. The data led to the following estimate: PNa:PK = 0.04.
Thus, among physiologically relevant ions only H+ and K+ permeate the channels significantly.
The role of extracellular K+
When the recording pipette contained the NMG internal solution (i.e. 4 or 10 mm KCl), external K+ increased both the inward and outward currents (Figs 2-6). It may be that high K+ influx elevates internal K+ by 3–5 mm s−1 (see ‘Slow perfusion’ above) increasing the concentration of outward current carriers. However, the following considerations argue against this mechanism. First, an increase in the outward current was observed as quickly as external K+ could be applied (15 ms) and the I-V curve generated (20 ms, 10 mV ms−1 ramp) (data not shown). It is unlikely that the internal [K+] could rise significantly during the ∼35 ms needed to apply K+ and generate the I-V curve. Second, 110 mm KCl in the patch pipette did not prevent a fast and significant increase (30–50 % at 10 mm KCl and 100 mV) in the outward current initiated by extracellular K+ (Fig. 8A) (23 cells). The conventional model of passive electrodiffusion cannot explain these observations (Figs 2-6 and 8A). Elevation of external [K+] decreases the electromotive force of an outward component of a K+ carried current at apparently constant intracellular [K+], so that an outward K+ current should be attenuated (Hille, 1992). Physiologically relevant ions (i.e. Ca2+, Mg2+, Na+ and K+) have been shown to modulate the activity of a number of ion channels (Kameyama, Kakei, Sato, Shibasaki, Matsuda & Irisawa, 1984; Latorre, Oberhauser, Labarca & Alvarez, 1989; Pardo et al. 1992; Baukrowitz & Yellen, 1995). Therefore, it is not unreasonable to propose that K+ ions might activate a specific frog TRC conductance.
Figure 8. Dependence of the whole-cell current and current noise on extracellular K+.

A, extracellular K+ increases both the inward and the outward whole-cell currents. The TRC was dialysed with intracellular K+ solution and stimulated (fast perfusion) by extracellular NMG solutions with 110 mm NMGCl or 100 mm NMGCl + 10 mm KCl. B, outside-out patch I-V curves. The patch pipette was filled with intracellular K+ solution. The patch was stimulated by extracellular NMG solutions with 110 mm NMGCl or 85 mm NMGCl + 25 mm KCl. C, the normalized slope conductance (see text and Fig. 4) versus K+ concentration. Different symbols correspond to 6 TRCs. The PA current was determined as the difference between whole-cell currents at a given K+ concentration and in the absence of K+. D, the normalized relation of I2/Dversus K+ concentration. Different symbols correspond to 5 TRCs. E, the relation of D/Iversus K+ concentration. Different symbols correspond to 5 TRCs. TRCs in C-E were clamped at -70 mV, dialysed with intracellular NMG solution (4 mm KCl), and stimulated by extracellular NMG solutions with 110 mm NMGCl or NMGCl + KCl = 110 mm. The mean PA current and the current variance were determined by the difference between mean currents and current variances in the presence and in the absence of external K+, correspondingly. The current variances were determined from current samples measured at amplifier filter cut-off frequency of 5 kHz and digitized at 10 kHz.
We recorded from outside-out patches to determine if external K+ changes the open probability of any particular channels. With 110 mm KCl in the pipette and 110 mm NMGCl in the bath, activity of the known K+ channels (Avenet, Hofmann & Lindemann, 1988) and cation channels (Fujiyama, Miyamoto & Sato, 1993) or any other channels were not observed in nine out of thiry-one outside-out patches. External K+ (25 mm) increased the integral conductances of two of these nine patches, unaccompanied by the occurrence of any single channel activity (Fig. 8B). This observation may be consistent with the activation of small conductance channels. However, single channel recording or current noise analysis will be required to test this assumption.
Dependence of the slope conductance on the K+ concentration
At voltages from -40 to 0 mV, the PA current I-V curves were nearly linear (Figs 3 and 4), indicating independence of the open probability from the membrane potential. The I-V curves were fitted by linear curves in this voltage range (see Fig. 4B, dashed line). The slope conductances of these linearized I-V curves were used as a parameter to characterize the dependence of the PA current on external K+per se.
In many cases the single-channel conductance γversus ion concentration S can be described by the Michaelis-Menten curve. This indicates saturation of the single channel current and suggests that binding-unbinding of the ion to a certain single site in the channel pore becomes the rate limiting step of ion permeation (Hille, 1992). In our experiments, the slope conductance vs. external K+ concentration was described by the Hill equation in the normalized form:
| (10) |
where S is the K+ concentration; G(S), G (10) and G (0) are the slope conductance in the presence of S, 10 and 0 mm K+; K½ and nH are the half-effective concentration and the Hill coefficient, respectively. We obtained the following values (means ± s.e.m.): K½ = 19 ± 3 mm and nH = 1.53 ± 0.36 (6 cells). Figure 8C shows the normalized conductance as a function of K+ concentration. The continuous line corresponds to eqn (10) at K½ = 19 mm and nH = 1.53. A conventional interpretation of the Hill coefficient suggests that the channels have at least two distinctive sites to bind K+. This result would be expected if extracellular K+ is both a ligand to activate the channel and a carrier of PA current. In this case the integral conductance should depend on the K+ concentration at greater than the first power in the Hill coordinates.
Noise analysis
For N identical independent channels, the mean current I and the current variance D are given by:
| (11) |
| (12) |
where P and i are the open probability and the single channel current, respectively. Equations (11) and (12) yield the following relations:
| (13) |
| (14) |
Both the integral whole-cell current and its noise depended on external K+ (Fig. 2A). Using the above equations, we analysed the data to determine if the open probability of PA channels is dependent on K+ concentration. To compare different experiments, the relation of I2/D at different K+ concentrations was normalized to the value at 15 mm K+. We analysed 200 ms current patterns recorded 50–100 ms after fast application of 2.5–20 mm K+. At 40 and 90 mm K+ stimuli, the PA current was sampled 300–500 ms after K+ application as it reached the steady-state level (see Fig. 4). It is highly unlikely that N could vary within this time frame, although N might vary during an experiment. Therefore, extracellular K+ was applied in an arbitrary sequence of concentrations, for instance (mm): 90–5-2.5- 40–15-25–5. Different symbols in Fig. 8D correspond to particular experiments. In all cases the relation of I2/D increases monotonically (up to 20-fold) as external K+ is changed from 2.5 to 90 mm. We believe that our experimental protocol and the data obtained suggest that the observed variability in the value of I2/D resulted from the dependence of P, rather than N, on external K+.
The mean integral current is directly proportional to the single channel current (eqn (11)). Consequently, at constant P the relation of D/I and I as functions of external K+ should be similar. In four out of five experiments, the relation of D/I (unlike I (Fig. 8C)) was not a monotonic function of extracellular K+ (Fig. 8E). These observations are also consistent with the dependence of P on external K+.
The PA current fluctuations exceeded background noise beginning at 5 mm K+. Since the value of 1 - P should be closest to 1 at the lowest K+ concentration, the relation of D/I (eqn (14)) at 5 mm K+ was used to estimate the single channel current. We calculated i to be about 20 fA at -70 mV or 0.3 pS conductance. Linear extrapolation led to a single channel conductance of about 6 pS at 110 mm K+. For P < 0.5, P/(1 - P) < 1, eqn (13) gives N > I2/D at P < 0.5. With 2.5–10 mm K+ in the bath, the value of I2/D exceeded 2000 in all experiments (7 cells). Assuming that in this concentration range P < 0.5, the number of the operating PA channels may be estimated as > 2000 per TRC. Taken together, the data in Figs 8A and C-E suggest that external K+ acts as a ligand to activate the small conductance cation channels.
Block of the PA current
External Ba2+, Cd2+, Co2+, Ni2+ and Cs+ slightly attenuated the resting whole-cell current and blocked the PA current in potential- and dose-dependent manners. Cs+ and Ba2+ shifted the PA current Vr (Fig. 9A), implying that they are permeable blockers. Cd2+, Ni2+ and Co2+ seemed to act as impermeant plugs (Fig. 9B). At 1 mm concentration, the blockers acted with different rates (Fig. 10A). Cs+ suppressed the PA current as rapidly as it was applied (∼15 ms), while the kinetics of the action of the other blockers was well resolved (Fig. 10A). The blockage displayed two phases. During the initial fast phase more than 90 % of the PA current was blocked. This phase was fitted by a single exponential function (data not shown). The time constants for 1 mm Cd2+, Co2+, Ni2+ and Ba2+ blockage were estimated as (ms): 26.5 ± 1.9, 41.7 ± 3.1, 56.1 ± 4.2 and 370 ± 18, respectively (means ± s.e.m., 5 cells). The blocker efficiency at negative voltages followed the sequence: Cs+ > Cd2+ > Ba2+ > Ni2+ > Co2+.
Figure 9. Effects of Ba2+, Cs+, Co2+, Ni2+ and Cd2+ on the PA current I-V curves.

All I-V curves were generated from the same TRC. The patch pipette was filled with intracellular NMG solution (4 mm KCl). The TRC was stimulated by extracellular NMG solution with 110 mm NMG or 100 mm NMG + 10 mm KCl and those containing the particular blocker (A: Ba2+, Cs+; B: Co2+, Ni2+, Cd2+).
Figure 10. Effects of Cs+ and divalent blockers on the PA current.
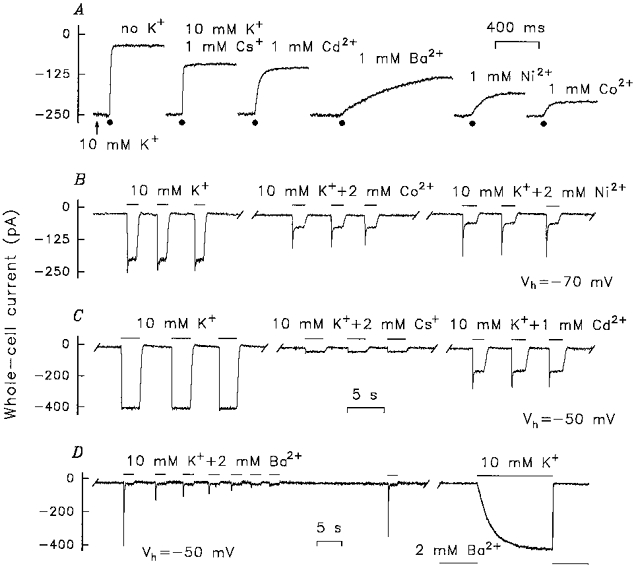
A, the TRC was dialysed with intracellular NMG solution (4 mm KCl), clamped at -70 mV, and continuously perfused by extracellular NMG solution with 100 mm NMGCl + 10 mm KCl. The cell was briefly stimulated by the same solution containing 1 mm of the particular blocker. As a control, 110 mm NMGCl was applied (the left-most current trace). B and C, the TRC was dialysed with intracellular NMG solution (4 mm KCl), clamped at -70 or -50 mV, perfused with extracellular Na+ solution and stimulated (1.5–2 s) by extracellular NMG solution with 100 mm NMGCl + 10 mm KCl with or without the particular blocker. D, left panel, recording conditions as in B and C. D, right panel, the TRC was perfused with extracellular Na+ solution (containing 2 mm BaCl2) and stimulated by 100 mm NMGCl + 10 mm KCl. The current traces presented in A or B-D are the consequent recordings that were interrupted for 25–40 s to replace stimulus solution in the fast perfusion system.
When stimulus solutions contained K+ and divalent cations, they evoked a large transient current followed by a smaller sustained current (Fig. 10B-D). These observations are consistent with relatively slow effects of the divalent cations: the PA current activates within 15–20 ms while the PA channel blockage develops more slowly (Fig. 10A). Therefore, simultaneous application of K+ and the divalent cations initiated the fast inward PA current followed by the slower current ‘inactivation’ resulting from PA channel blockage (Fig. 10B and C). In agreement with the fast kinetics of the Cs+ blockage (Fig. 10A), the currents induced by simultaneous application of K+ and Cs+ (Fig. 10C) did not display the transient components.
With Ba2+ in the stimulus solution, the PA current transients gradually decreased during serial stimulation while the sustained current was virtually invariant (Fig. 10D). This peculiarity of the Ba2+ blockage might come from prolonged occupation of the PA channels by Ba2+ ions. The amplitude of the transient component of the TRC responses to 10 mm K++ 1 mm Ba2+ is proportional to the number of PA channels that are not blocked at the moment of stimulus application. Therefore, application of 10 mm K++ 1 mm Ba2+ should activate a transient current of smaller amplitude if Ba2+ did not leave some PA channels after the previous application of 10 mm K++ 1 mm Ba2+. The sustained current is a result of the steady-state blockage of the PA current by Ba2+ and should be of the same level at any application of 10 mm K++ 1 mm Ba2+.
The refractive period of the Ba2+ block (i.e. the time taken for full recovery of the transient component of a TRC response to 10 mm K++ 1 mm Ba2+ after their serial application (Fig. 10D, left panel)) was about 30 s (4 cells). TRCs that were pre-exposed to 2 mm Ba2+ responded to 10 mm K+ slowly (Fig. 10D, right panel) indicating slow release of Ba2+ from the channels. In this case, the PA current rose exponentially with a time constant of 2.7 ± 0.1 s at -50 mV (4 cells). This characteristic time, however, is too short to explain the 30 s refractive period of the Ba2+ blockage (Fig. 10D, left panel).
To explain the blocking effects of quaternary ammonium ions on the delayed rectifier K+ current, Armstrong and colleagues have suggested that blockers cannot freely occupy and leave the channel pore. The channels must first be activated by depolarization to be blocked, while the blockers are not released from the closed channels (for review, see Armstrong, 1975). Following this idea of the state-dependent blockage, one can assume that Ba2+ leaves the closed PA channels (no external K+) much more slowly in comparison to the open channels (10 mm K+). If so, the refractive period of the Ba2+ blockage should be much longer than the characteristic time of the Ba2+ release with K+ in the bath (Fig. 10D).
pH dependence of the PA current
To avoid indirect effects of H+ ions on the PA current (such as cytoplasmic acidification followed by altered enzyme activity) TRCs were continuously perfused with 110 mm NaCl (pH 7.2) and briefly (for 0.5–1.5 s) stimulated by 100 mm NMGCl + 10 mm KCl at stimulus pH 5.5–8.0. As a control, TRCs were stimulated at the same pH values by 110 mm NMGCl.
With no K+ in the bath, acidification of the 110 mm NMGCl stimulus from pH 8.0 to pH 6.4 evoked negligible TRC responses. At pH 5.5 a small (5–10 pA) transient current was recorded in a number of experiments (see Fig. 12). These observations indicate insignificant H+ effects on the resting TRC conductance with no added K+ in the bath. In contrast, the TRC responses to 100 mm NMGCl + 10 mm KCl were strongly dependent on the stimulus pH (17 cells). At pH 8.0, a sustained PA current occurred (Fig. 11A). Stimulus acidification led to the appearance of a transient current and inhibited the sustained component. Both current components were blocked by PA channel blockers, i.e. Cs+ and the divalent cations (data not shown). These observations and the negligible TRC responses to acid stimuli in the absence of external K+ suggest the current transients to be the result of proton action on the PA current.
Figure 12. pH dependence of the PA current.

A, whole-cell current variation evoked by stimulus application and voltage ramp polarization. The TRC was dialysed with intracellular NMG solution (10 mm KCl), pH 7.2. Perfusion: extracellular Na+ solution, pH 7.2; stimulation: 500 ms, extracellular NMG solution with 110 mm NMGCl or 100 mm NMGCl + 10 mm KCl, pH 5.5–8.0. B, the TRC was dialysed with intracellular NMG solution (10 mm KCl), pH 6.4. Perfusion and stimulation as in A. C and D, slope conductance (normalized to the value at pH 8.0) and Vr (corrected for LJPs) versus stimulus pH. At any pH, I-V curves of the PA current were apparently linear at some voltages (e.g. from -40 to 0 mV at pH 8.0 (A and B)) and were fitted by linear curves to determine the slope conductances (see Fig. 4B). The recording conditions as in A (▾, 5 cells) or B (▵, 3 cells).
Figure 11. TRC responses to 10 mm KCl at different pH values.

A, perfusion: extracellular Na+ solution, pH 7.2; stimulation: extracellular NMG solution with 100 mm NMGCl + 10 mm KCl, pH 5.5–8.0. B, perfusion: extracellular Na+ solution, pH 6.4; stimulation as in A. The recordings in A and B were made from the same TRC. The recordings were interrupted for 25–40 s to replace solutions in the fast perfusion system tube (Fig. 1A and B). C, perfusion: extracellular Na+ solution, pH 6.4; stimulation: extracellular NMG solution with 100 mm NMGCl + 10 mm KCl, pH 7.2. The dashed line corresponds to the equation f(t) = -312 + 180exp(-t/3.1). D, perfusion: extracellular Na+ solution, pH 7.2 (a and c) or 6.4 (b and d); stimulation: extracellular NMG solution with 100 mm NMGCl + 10 mm KCl, pH 7.2 in the absence (a and b) or in the presence of 1 mm Cd2+ (c and d). E, responses b and d from D were scaled to compare with responses a and c, respectively. In all cases the TRCs were dialysed with intracellular NMG solution (4 mm KCl) and clamped at -70 mV.
A number of ion channels display strong interactions between permeable ions within the channel pore. For instance, alkali cations permeate voltage-gated Ca2+ channels which are not occupied by Ca2+, while the presence of calcium prevents the passage of monovalent cations (Kostyuk, Mironov & Shuba, 1983). Permeable Ca2+ and Mg2+ reduce Na+ influx through cGMP-gated channels by two orders of magnitude (Nakatani & Yau, 1988). Since both H+ and K+ are permeant, they should compete for the PA channel pore. Those channels which are occupied by H+ may be impermeable to K+. The transient component of the PA current probably reflects the kinetics of proton occupation of the channel (Fig. 11A). This idea is supported by the following observation. If TRCs are perfused with 110 mm NaCl at pH 6.4, leading to an increased fraction of PA channels being occupied by protons in the absence of K+, TRC responses to low pH-10 mm K+ stimuli showed no transient component, while the amplitude of the sustained current was essentially unchanged (3 cells) (Fig. 11B). TRC responses to pH 7.2 and pH 8.0 stimuli were slowed (Fig. 11B). This probably was the result of slow proton release from the channels that was initiated by the pH jump from 6.4 to 7.2 or 8.0. In this case, PA current activation kinetics displayed fast (about 30 % of the amplitude) and slow phases (Fig. 11C). The latter was fitted by the single exponential curve with a time constant of 3.1 ± 0.2 s at -70 mV (4 cells) (Fig. 11C, dashed line).
The following observations indicate interactions of H+ and divalent cations inside the PA channel pore. When TRCs were continuously perfused at pH 6.4, the amplitude of the response to 150 ms 10 mm K+ (pH 7.2) stimuli was reduced by about 25 % (Fig. 11D, a and b). 1 mm Cd2+ in the stimulus solution enhanced TRC sensitivity to the bath solution pH. TRCs pre-exposed to pH 6.4 responded to 10 mm KCl + 1 mm Cd2+ (pH 7.2) with a 4-fold reduction in the response amplitude in comparison with the control response (Fig. 11D, c and d). In contrast to the responses to 10 mm K+, 10 mm K++ 1 mm Cd2+ evoked responses with apparently identical kinetics independent of the perfusing solution pH (Fig. 11E). The fact that H+ and Cd2+, and the other divalent blockers (data not shown), did not additively affect the amplitude and kinetics of TRC responses suggests that H+ interacts with Cd2+ inside the channel pore.
In addition to the resting current, we studied the pH dependence of the TRC membrane conductance (9 cells). TRCs were briefly stimulated by 100 mm NMGCl + 10 mm KCl (pH 5.5–8.0), then I-V curves were generated 50–150 ms after stimulus application. The control 110 mm NMGCl stimulus was at the same pH as the test one. The stimulation and voltage ramp polarization of TRCs resulted in the temporal evolution of the whole-cell current as shown in Fig. 12A. In the absence of extracellular K+, acidification of the stimulus solution only weakly changed the TRC conductance at pH 8.0–6.4, while the conductance was suppressed by 20–30 % at pH 5.5 (Fig. 12A). As the stimulus pH decreased from pH 8.0 to 5.5, the PA current and the current slope conductance were gradually suppressed (Fig. 12A and C (filled triangles)). Simultaneously, stimulus acidification shifted the PA current Vr (Fig. 12A and D (filled triangles)). The pH effect on the PA current was more pronounced at negative voltages (Fig. 12A) suggesting the potential-dependent blockage of the PA channels by protons.
To determine if protons actually permeate the PA channel and cause intracellular acidification we did the following. In the absence of extracellular Na+, H+ extrusion from the TRC cytoplasm (mediated by Na+-H+ exchange) must be inhibited. Although our experimental protocol was designed to avoid acidification of the whole TRC cytoplasm, brief application of 100 mm NMGCl + 10 mm KCl might induce local cytoplasmic acidification due to both activation of H+ influx (through the PA channels) and inhibition of H+ extrusion. This might be responsible in part for the pH dependence of the PA current. In control experiments (3 cells), TRCs were dialysed with the internal NMG solution at pH 6.4, negatively shifting the PA current Vr (Fig. 12B and D (open triangles)). This small Vr shift was statistically significant, at least at pH 8.0 and 7.2 stimuli (6.7 ± 2.1 and 4.7 ± 2.4 mV, respectively) (Fig. 12D), indicating acidification of the cytoplasm of the cell via the patch pipette. However, the character of the response to 100 mm NMGCl + 10 mm KCl (recorded at different stimulus pH) was not qualitatively changed with the exception of a slight slowing of the response kinetics (Fig. 12B-D). This indicates that TRC cytoplasmic acidification plays an insignificant role in the external pH effects described above.
Thus, taken together, the resemblance of the effects of protons and divalent blockers (Figs 9 and 11), interference of H+ and divalent ions inside the channel pore (Fig. 11D), the pH dependence of the PA current Vr (Fig. 12A and D), and weak effects of cytoplasmic acidification on the PA current (Fig. 12B-D) suggest that the main mechanism of the PA current pH dependence is H+ occupation of the channel pore resulting in interruption of K+ flux through the PA channel.
Extracellular K+ enhances TRC sensitivity to acid stimuli
Since the PA channels are strongly dependent on pH, they may contribute to acid transduction. Under physiological ion gradients the PA channels should transport outward K+ current. Extracellular protons may cause TRC depolarization by blocking this outward current. If this is the case then extracellular K+ may serve as a modulator of frog TRC sensitivity to bath solution pH. To check this idea, we recorded from TRCs clamped at zero current. In the absence of external K+, increasing the pH of the bath solution from 7.2 to 8.0 hyperpolarized the TRCs by 5–7 mV, while at pH 6.4 and 5.5 a strong depolarization of TRCs was observed (Fig. 13A) (5 cells). In addition to the TRC depolarization, the low pH stimuli evoked a significant increase in Vm variance (more than 2-fold at pH 5.5) (Fig. 13A). If the main mechanism of the proton effects in the absence of extracellular K+ is blockage of TRC K+ channels (Kinnamon, Dionne & Beam, 1988), this can explain why acidification of the bath solution simultaneously depolarizes TRCs and increases Vm noise. The addition of 10 mm K+ to the bath depolarized TRCs by 13–17 mV at pH 7.2 and 8.0 (Fig. 13A) (5 cells). Extracellular K+ increased the TRC depolarization evoked by the low pH stimuli (Fig. 13A). Note that Vm variance was relatively insensitive to stimulus pH in the presence of 10 mm K+, in contrast to that recorded in K+-free bath solutions (Fig. 13A). In contrast to the dose-response curve generated in the absence of external K+, with 10 mm K+ in the bath, the half-maximal effect and saturating depolarization were observed at pH 6.8–6.6 and 5.5, respectively (Fig. 13B) (5 cells). These observations indicate that extracellular protons depolarize frog TRCs via different mechanisms in the presence and absence of K+ in the bath. Our preliminary observations suggest that the PA channels play a major role in setting TRC resting potential in the presence of extracellular K+ (data not shown). If so, a significant increase in TRC sensitivity to bath solution pH in the presence of external K+ is explained by the proton blockage of K+ efflux through the PA channels.
Figure 13. Dependence of Vm on bath solution pH.

A, the TRC was dialysed with intracellular K+ solution (0.1 mm EGTA) and clamped at zero current. Perfusion: extracellular Na+ solution with or without 10 mm KCl at different pHs. Solutions were replaced by the slow perfusion system. B, TRC Vm as a function of bath solution pH (5 cells) in the absence and presence of 10 mm KCl in the bath.
DISCUSSION
In the present investigation we recorded from 152 voltage clamped bull frog TRCs. All TRCs displayed a large increase in integral conductance to millimolar K+ in the bath (Fig. 2). Under our recording conditions, K+ current through the known K+-selective channels seemed to contribute only negligibly to whole-cell currents for two reasons: (i) the carrier concentration was low (4 or 10 mm K+ in the patch pipette and 10 mm K+ in the bath); and (ii) intracellular NMG solutions contained 2 mm ATP and 1 mm EGTA with no added Ca2+. These factors should have suppressed the activity of the 48 pS K+ channels (which are inhibited by phosphorylation) and led to negligible activity of the 74 pS Ca2+-activated K+ channels (Avenet et al. 1988; Fujiyama, Miyamoto & Sato, 1994). This is supported by our observations that: (i) extracellular K+ increased both inward and outward currents; and (ii) extracellular Cd2+ or Co2+ (which are not blockers of frog TRC K+ channels) could inhibit the currents activated by extracellular K+. Although some contribution of the K+-selective channels may not be fully ruled out at high external [K+], we believe that with low cytoplasmic [K+], these channels contributed only negligibly to the PA current at low and moderate extracellular [K+].
As external [K+] was varied from 2.5 to 90 mm, the dependence of PA current variance on K+ concentration indicated an increase of the open probability of the PA channels (Figs 2 and 8C-E). These data lead us to the conclusion that extracellular K+ acts as a ligand to activate specific cation channels in frog TRCs. Among physiologically important ions, H+ and K+ predominantly permeate the channels (Figs 5B, 6A and 13B); Na+, Ca2+ and Mg2+ are permeable to some extent (Figs 6C and 7B); while Cs+, Ba2+, Cd2+, Ni2+ and Co2+ blocked the PA channels at millimolar concentrations (Figs 9 and 10A).
We did not find any evidence for inwardly rectifying (IR) K+ channels in bullfrog TRCs. Unlike the PA current observed by us, the current transported through IR K+ channels shows: (i) a square root dependence of the slope conductance on external K+ concentration; (ii) a reversal potential that follows the equilibrium K+ potential; and (iii) an outward component of the current that is nearly independent of external K+ concentration (Hagiwara & Takahashi, 1974; Hagiwara, Miyazaki & Rosenthal, 1976; Sakmann & Trube, 1984; Harvey & Ten Eick, 1988). Previous observations by others of the inwardly rectifying current in frog TRCs were attributed to activity of the IR K+ channels for the following reasons: (i) activation by hyperpolarization; (ii) blockage by external Cs+; and (iii) enhancement by external K+ (Miyamoto, Okada & Sato, 1991). These observations can be explained by properties of the PA channels which resemble those of IR K+ channels.
Under physiological conditions, the PA channels should transport small inward currents carried by H+ and probably Na+, Mg2+ and Ca2+ in accordance with their electrochemical gradients. Therefore, external K+ may directly (not via cell depolarization) modulate intracellular pH and probably the concentration of Mg2+ and Ca2+ in the frog TRC cytoplasm. Such a regulatory role of extracellular K+ has been demonstrated in voltage clamped rat glomerulosa cells where external millimolar [K+] increased Ca2+ influx by activation of Ca2+-permeable channels (Varnai, Osipenko, Vizi & Spat, 1995).
Possible role of the PA channels in sour transduction
Tight junctions between mammalian taste bud cells are apparently more permeable than are those in lingual and other epithelia (Holland, Zampighi & Simon, 1991). Mammalian TRC tight junctions might provide pathways for diffusion of ions and relatively small molecules (∼500–600 Da) from a taste pore into the extracellular space (Holland et al. 1991). This paracellular pathway has been proposed to contribute to taste transduction (Ye, Heck & DeSimone, 1991; Holland et al. 1991; Simon, Holland, Benos & Zampighi, 1993). Frog tight junctions may also be permeable to small molecules and ions, e.g. K+ and H+.
It is generally thought that salt and sour transduction do not utilize second messenger cascades (for review, see Lindemann, 1996). For instance, sour transduction may be based on proton block of the apical K+ conductance (Kinnamon et al. 1988). Our present observations suggest that the paracellular pathway could contribute significantly to sour transduction in frog TRCs. The diffusion of K+ from K+ enriched saliva into the extracellular space (in combination with electrical activity of cells in a taste bud) may elevate the extracellular K+ and sustain sufficient activity of the PA channels. In our experiments, frog TRCs were much more sensitive to extracellular pH in the presence of external K+ than in its absence. With 10 mm K+ in the bath, the half-maximal effect and saturating depolarization were observed at pH 6.8–6.6 and 5.5, respectively (Fig. 13B). Typical acid stimuli (e.g. 1 mm HCl, pH 3.0) may quickly permeate through tight junctions and shift the pH of media in the extracellular space from 7.2 to 6.8–6.4, thereby blocking the PA channels and depolarizing the TRC by 20–40 mV (Fig. 13A and B). Note, that in situ recordings observed 15–20 mV depolarization of frog TRCs by 1 mm HCl (Sato, 1980). In certain cases the protons bind more tightly in the channel than the normal permeant ion, e.g. Gilbertson, Avenet, Kinnamon & Roper (1992) have shown that protons block NaCl conduction by blocking the amiloride-sensitive Na+ channel.
In conclusion, the high sensitivity of the PA channels to extracellular concentrations of monovalent K+, Rb+, NH4+ and Cs+ as well as divalent Ba2+, Cd2+, Ni2+, Co2+, Ca2+ and Mg2+ suggests that the PA channels may contribute to the perception of the salts of these cations. In mammals, A and H fibres (electrolyte responsive single units of the glossopharyngeal and chorda tympani nerves, respectively) respond well to K+, NH4+ and acids (Frank, 1991), suggesting that a PA-type channel may also be involved in their responses to salts and acids.
Acknowledgments
We are grateful to Professors S. Kinnamon, B. Lindemann and D. Logothetis for critically reading the manuscript and for their helpful comments. This research was supported in part by grants from the Howard Hughes Medical Institute (HHMI 75195–545801) and the US Civilian Research and Development Foundation (RN1-401) awarded to S. S. K. and R. F. M.
References
- Armstrong CM. Ionic pores, gates, and gating currents. Quarterly Review of Biophysics. 1975;7:179–210. doi: 10.1017/s0033583500001402. [DOI] [PubMed] [Google Scholar]
- Armstrong CM, Cota G. Ca2+ ion as a cofactor in Na+ channel gating. Proceedings of the National Academy of Sciences of the USA. 1991;88:6528–6531. doi: 10.1073/pnas.88.15.6528. [DOI] [PMC free article] [PubMed] [Google Scholar]
- Avenet P, Hofmann F, Lindemann B. Transduction in taste receptor cells requires cAMP-dependent protein kinase. Nature. 1988;331:351–354. doi: 10.1038/331351a0. 10.1038/331351a0. [DOI] [PubMed] [Google Scholar]
- Avenet P, Lindemann B. Patch clamp study of isolated taste receptor cells of the frog. Journal of Membrane Biology. 1987;97:223–240. doi: 10.1007/BF01869225. [DOI] [PubMed] [Google Scholar]
- Barry PH. Ionic permeation mechanisms in epithelia: Biionic potentials, dilution potentials, conductances, and streaming potentials. Methods in Enzymology. 1992;171:678–715. doi: 10.1016/s0076-6879(89)71038-7. [DOI] [PubMed] [Google Scholar]
- Barry PH, Lynch JW. Liquid junction potentials and small cell effects in patch clamp analysis. Journal of Membrane Biology. 1991;121:101–117. doi: 10.1007/BF01870526. [DOI] [PubMed] [Google Scholar]
- Baukrowitz T, Yellen G. Modulation of K+ current by frequency and external [K+]: A tale of two inactivation mechanisms. Neuron. 1995;15:951–960. doi: 10.1016/0896-6273(95)90185-x. [DOI] [PubMed] [Google Scholar]
- Bennekou P, Christophersen P. The gating of human red cell Ca2+-activated K+-channels is strongly affected by permeant cation species. Biochimica et Biophysica Acta. 1990;1030:183–187. doi: 10.1016/0005-2736(90)90255-m. [DOI] [PubMed] [Google Scholar]
- Bradley RM. Salivary secretion. In: Getchell TV, Bartoshuk LM, Doty RL, Snow JB Jr, editors. Smell and Taste in Health and Disease. New York: Raven Press; 1991. pp. 127–144. [Google Scholar]
- Brown EM. Extracellular Ca2+ sensing, regulation of parathyroid cell function, and role of Ca2+ and other ions as extracellular (first) messengers. Physiological Reviews. 1991;71:371–411. doi: 10.1152/physrev.1991.71.2.371. [DOI] [PubMed] [Google Scholar]
- Frank M. Taste-responsive neurons of the glossopharyngeal nerve of the rat. Journal of Neurophysiology. 1991;65:1452–1463. doi: 10.1152/jn.1991.65.6.1452. [DOI] [PubMed] [Google Scholar]
- Fujiyama R, Miyamoto T, Sato T. Non-selective cation channel in bullfrog taste cell membrane. NeuroReport. 1993;5:11–13. doi: 10.1097/00001756-199310000-00002. [DOI] [PubMed] [Google Scholar]
- Fujiyama R, Miyamoto T, Sato T. Differential distribution of two Ca2+-dependent and -independent K+ channels throughout receptive and basolateral membranes of bullfrog taste cells. Pflügers Archiv. 1994;429:285–290. doi: 10.1007/BF00374325. [DOI] [PubMed] [Google Scholar]
- Gilbertson T, Avenet P, Kinnamon SC, Roper S. Proton currents through amiloride sensitive Na+ channels in hamster taste cells: role in acid transduction. Journal of General Physiology. 1992;100:803–824. doi: 10.1085/jgp.100.5.803. [DOI] [PMC free article] [PubMed] [Google Scholar]
- Hagiwara S, Miyazaki S, Rosenthal P. Potassium current and the effect of cesium on this current during anomalous rectification of the egg cell membrane of a starfish under low intracellular Ca2+ Journal of General Physiology. 1976;48:141–161. doi: 10.1085/jgp.67.6.621. [DOI] [PMC free article] [PubMed] [Google Scholar]
- Hagiwara S, Takahashi K. The anomalous rectification and cation selectivity of the membrane of starfish egg cell. Journal of Membrane Biology. 1974;18:61–80. doi: 10.1007/BF01870103. [DOI] [PubMed] [Google Scholar]
- Harvey RD, Ten Eick RE. Characterization of the inward-rectifying potassium current in cat ventricular myocytes. Journal of General Physiology. 1988;91:593–615. doi: 10.1085/jgp.91.4.593. [DOI] [PMC free article] [PubMed] [Google Scholar]
- Hille B. Ionic Channels of Excitable Membranes. Sunderland, MA, USA: Sinauer Associates; 1992. [Google Scholar]
- Holland VF, Zampighi GA, Simon SA. Tight junctions in taste buds: Possible role in perception of intravascular gustatory stimuli. Chemical Senses. 1991;16:69–79. [Google Scholar]
- Kameyama M, Kakei M, Sato R, Shibasaki T, Matsuda H, Irisawa H. Intracellular Na+ activates a K+ channel in mammalian cardiac cells. Nature. 1984;309:354–356. doi: 10.1038/309354a0. [DOI] [PubMed] [Google Scholar]
- Karwoski CJ, Lu H-K, Newman EA. Spatial buffering of light-evoked potassium increases by retinal Muller (glial) cells. Science. 1989;244:578–580. doi: 10.1126/science.2785716. [DOI] [PMC free article] [PubMed] [Google Scholar]
- Khayary A, Math F, Trotier D. Odorant-evoked potassium changes in the frog olfactory epithelium. Brain Research. 1991;539:1–5. doi: 10.1016/0006-8993(91)90679-p. [DOI] [PubMed] [Google Scholar]
- Kinnamon SC, Dionne VE, Beam K. Apical localization of K+ channels in taste cells provides the basis for sour taste transduction. Proceedings of the National Academy of Sciences of the USA. 1988;85:7023–7027. doi: 10.1073/pnas.85.18.7023. [DOI] [PMC free article] [PubMed] [Google Scholar]
- Kostyuk PG, Mironov SL, Shuba, Ya M. Two ion-selecting filters in the calcium channel of the somatic membrane of mollusk neurons. Journal of Membrane Biology. 1983;76:83–93. [Google Scholar]
- Latorre R, Oberhauser A, Labarca P, Alvarez O. Varieties of calcium-activated potassium channels. Annual Review of Physiology. 1989;51:385–399. doi: 10.1146/annurev.ph.51.030189.002125. [DOI] [PubMed] [Google Scholar]
- Laurienti PJ, Blankenship JE. Parapodial swim muscle in Aplisia brasiliana. II. Ca2+-dependent K+ currents in isolated muscle fibers and their blockage by chloride substitutes. Journal of Neurophysiology. 1996;76:1531–1539. doi: 10.1152/jn.1996.76.3.1531. [DOI] [PubMed] [Google Scholar]
- Lindemann B. Taste Reception. Physiological Reviews. 1996;76:719–766. doi: 10.1152/physrev.1996.76.3.719. [DOI] [PubMed] [Google Scholar]
- Marty A, Neher E. Tight-seal whole-cell recording. In: Sakmann B, Neher E, editors. Single Channel Recording. New York: Plenum Press; 1995. pp. 31–52. [Google Scholar]
- Miyamoto T, Okada Y, Sato T. Voltage-gated membrane current of isolated bullfrog taste cells. Zoological Science. 1991;8:835–845. [Google Scholar]
- Nakatani K, Yau K-W. Calcium and magnesium fluxes across the plasma membrane of the toad rod outer segment. The Journal of Physiology. 1988;395:695–729. doi: 10.1113/jphysiol.1988.sp016942. [DOI] [PMC free article] [PubMed] [Google Scholar]
- Neher E. Correction for liquid junction potentials in patch clamp experiments. Methods in Enzymology. 1992;207:123–131. doi: 10.1016/0076-6879(92)07008-c. [DOI] [PubMed] [Google Scholar]
- Orkand RK, Nicholls JG, Kuffler SW. Effect of nerve impulses on the membrane potential of glial cells in the central nervous system of amphibia. Journal of Neurophysiology. 1966;29:788–806. doi: 10.1152/jn.1966.29.4.788. [DOI] [PubMed] [Google Scholar]
- Pardo LA, Heinemann SH, Terlau H, Ludewig V, Lorra C, Pongs O, Stuhmer W. Extracellular K+ specifically modulates a rat brain K+ channel. Proceedings of the National Academy of Sciences of the USA. 1992;89:2466–2470. doi: 10.1073/pnas.89.6.2466. [DOI] [PMC free article] [PubMed] [Google Scholar]
- Sakmann B, Trube G. Conductance properties of single inwardly rectifying potassium channels in ventricular cells from guinea-pig heart. The Journal of Physiology. 1984;347:641–657. doi: 10.1113/jphysiol.1984.sp015088. [DOI] [PMC free article] [PubMed] [Google Scholar]
- Sato T. Recent advances in the physiology of taste cells. Progress in Neurobiology. 1980;14:25–67. doi: 10.1016/0301-0082(80)90003-9. [DOI] [PubMed] [Google Scholar]
- Simon SA, Holland VF, Benos DJ, Zampighi GA. Transcellular and paracellular pathways in lingual epithelia and their influence in taste transduction. Microscopy Research Technique. 1993;26:196–208. doi: 10.1002/jemt.1070260303. [DOI] [PubMed] [Google Scholar]
- Sykova E. Extracellular K+ accumulation in the central nervous system. Progress in Biophysics and Molecular Biology. 1983;42:135–189. doi: 10.1016/0079-6107(83)90006-8. [DOI] [PubMed] [Google Scholar]
- Varnai P, Osipenko ON, Vizi ES, Spat A. Activation of calcium current in voltage-clamped rat glomerulosa cells by potassium ions. The Journal of Physiology. 1995;483:67–78. doi: 10.1113/jphysiol.1995.sp020568. [DOI] [PMC free article] [PubMed] [Google Scholar]
- Ye Q, Heck GL, DeSimone JA. The anion paradox in sodium taste reception: Resolution by voltage-clamp studies. Science. 1991;254:724–726. doi: 10.1126/science.1948054. [DOI] [PubMed] [Google Scholar]