

Abstract
We questioned whether exercise-induced arterial hypoxaemia (EIAH) occurs in healthy active women, who have smaller lungs, reduced lung diffusion, and lower maximal O2 consumption rate (
 ) than age- and height-matched men.
Twenty-nine healthy young women with widely varying fitness levels (
 57 ± 6 ml kg−1 min−1; range, 35–70 ml kg−1 min−1; or 148 ± 5 %; range, 93–188 % predicted) and normal resting lung function underwent an incremental treadmill test to during the follicular phase of their menstrual cycle. Arterial blood samples were taken at rest and near the end of each workload.
Arterial PO2 (Pa,O2) decreased > 10 mmHg below rest in twenty-two of twenty-nine subjects at
(Pa,O2, 77.5 ± 0.9 mmHg; range, 67–88 mmHg; arterial O2 saturation (Sa,O2), 92.3 ± 0.2 %; range, 87–94 %). The remaining seven subjects maintained Pa,O2 within 10 mmHg of rest. Pa,O2 at was inversely related to the alveolar to arterial O2 difference (A-aDO2) (r = -0.93; 35–52 mmHg) and to arterial PCO2 (Pa,CO2) (r = -0.62; 26–39 mmHg).EIAH was inversely related to
(r = -0.49); however, there were many exceptions. Almost half of the women with significant EIAH had within 15 % of predicted normal values ( 40–55 ml kg−1 min−1); among subjects with very high (55–70 ml kg−1 min−1), the degree of excessive A-aDO2 and EIAH varied markedly (e.g. A-aDO2, 30–50 mmHg; Pa,O2, 68–91 mmHg).In the women with EIAH at
many began to experience an excessive widening of their A-aDO2 during moderate intensity exercise, which when combined with a weak ventilatory response, led to a progressive hypoxaemia. Inactive, less fit subjects had no EIAH and narrower A-aDO2 when compared with active, fitter subjects at the same  (40–50 ml kg−1 min−1).
These data demonstrate that many active healthy young women experience significant EIAH, and at a
that is substantially less than those in their active male contemporaries. The onset of EIAH during submaximal exercise, and/or its occurrence at a relatively low implies that lung structure/function subserving alveolar to arterial O2 transport is abnormally compromised in many of these habitually active subjects.
The structural capacities of the lung are commonly viewed to be over-built with respect to demand for pulmonary O2 transport in the healthy untrained human during maximal exercise near sea level. However, it has recently become clear that the capacities of the lung, airways and chest wall do not always exceed the demands imposed by maximal exercise. Most notably, many young adult male athletes with maximal O2 consumption rate (O2,max) > 150 % of normal, show significant exercise-induced arterial hypoxaemia (EIAH) and/or significant air flow limitation during maximal exercise (Rowell, Taylor, Wang & Carlson, 1964; Dempsey, Hanson & Henderson, 1984; Johnson, Saupe & Dempsey, 1992; Powers et al. 1992). Furthermore, when the EIAH is prevented by adding small amounts of O2 to the inspirate, increases in proportion to the amount of arterial O2 desaturation experienced while breathing room air (Powers, Lawler, Dempsey, Dodd & Landry, 1989; Harms, McClaran, Nickele, Pegelow & Dempsey, 1997). Other examples of an under-built lung during exercise include: (1) many healthy elderly fit humans with a normal age-dependent deterioration in lung function who encounter expiratory air flow limitation and EIAH at much lower than in the younger athlete (Johnson & Dempsey, 1991; Prefaut, Anselme, Caillaud & Masse-Biron, 1994), and (2) exercising thoroughbred horses who show extreme hypoxaemia, CO2 retention, and even pulmonary haemorrhage (Bayly, Hodgson, Schulz, Dempsey & Gollnick, 1989; West et al. 1993).
We questioned whether healthy young women might be especially vulnerable to exercise-induced pulmonary limitations, perhaps even at work rates that are substantially less than those required in young men. The basis for this hypothesis is found in the considerable literature which shows that the adult female lung has a smaller vital capacity, reduced airway diameter and a smaller diffusion surface, relative to males, even when gender comparisons are made at comparable stature, sitting height and body mass (Mead, 1980; Thurlbeck, 1982; Schwartz, Katz, Fegley & Tockman, 1988a, b).
METHODS
Subjects
Twenty-nine young adult women (non-smoking), aged 18–42 years, with resting pulmonary function within normal limits, were recruited to participate in this study. Twenty-four of the subjects were runners (including thirteen former collegiate runners and one former Olympian) and most competed regularly in middle and long distance races. These subjects ran at least three times per week and averaged 32.5 miles per week. Five subjects were sedentary. Informed consent was obtained in writing from each subject and all procedures were approved by the Institutional Review Board of the University of Wisconsin-Madison. Physical characteristics and resting pulmonary function of the subjects are shown in Table 1. All subjects were free of any history or symptoms of cardiopulmonary disease, including exercise-induced asthma. In additional studies (McClaran, Harms, Pegelow & Dempsey, 1996), all subjects also showed a normal increase in their maximal flow: volume envelope immediately following maximal exercise. All tests were performed during the follicular phase of the menstrual cycle as determined by progesterone levels and self-reported basal temperature recordings over a 30 day period. None of our subjects reported abnormalities with their menstrual cycle in the 6 months prior to testing.
Table 1.
Subject characteristics and resting pulmonary function (n = 29)
| Percentage predicted | ||||
|---|---|---|---|---|
| Mean ± s.d. | Range | Women† | Men‡ | |
| Age (years) | 27 ± 7 | 18–42 | — | — |
| Height (cm) | 166 ± 7 | 155–179 | — | — |
| Weight (kg) | 59 ± 6 | 45–75 | — | — |
| [Hb] (g dl−1) | 13.8 ± 0.8 | 12.8–15.5 | — | — |
| [Progesterone] (ng ml−1)§ | 0.8 ± 0.4 | 0.2–1.3 | — | — |
|
(ml kg−1 min−1) |
57 ± 6 | 35–70 | 148 ± 5* | 133 ± 6* |
| TLC (l) | 5.6 ± 0.7 | 4.5–7.8 | 106 ± 3* | 94 ± 2* |
| VC (l) | 4.1 ± 0.5 | 2.8–5.4 | 106 ± 3* | 88 ± 2* |
| FRC (l) | 2.9 ± 0.3 | 1.8–4.1 | 102 ± 4 | 107 ± 4* |
| FEV1.0 (l) | 3.4 ± 0.5 | 2.6–4.7 | 106 ± 3 | 87 ± 3* |
| MEF50 (l s−1) | 4.4 ± 0.5 | 3.5–5.3 | 103 ± 3 | 91 ± 2* |
| DLCO (ml min−1 mmHg−1)‖ | 27.5 ± 4.5 | 19–39 | 88 ± 2* | 78 ± 3* |
| DLCO/VA (ml min−1 mmHg−1 l−1)‖ | 6.72 ± 0.36 | 6.01–7.26 | 90 ± 2* | 81 ± 3* |
Standard progesterone range for follicular phase of menstrual cycle = 0.1–1.4 mg ml−1.
Predicted value significantly different than obtained value, P < 0.05 (Student's unpaired t test).
Measurement of DLCO obtained in only 23 of the 29 subjects.
Pulmonary function values in women as a percentage of normal values predicted for women of same age and height.
Pulmonary function in women as a percentage of normal values predicted for men of same age and height. DLCO/VA, ratio of DLCO to alveolar volume. Prediction equations from Crapo & Morris (1981) and Crapo, Morris & Gardner (1982).
Measurements
During all tests, subjects breathed through a low-resistance (0.9-1.0 cmH2O l−1 s−1 at 5–6 l s−1 flow rate) two-way valve (Hans Rudolph, Model 2400) with low dead space (< 150 ml), and expired gases were sampled continuously at the mouth via a Perkin-Elmer mass spectrometer (model 1100). Inspiratory and expiratory flow rates were measured separately by pneumotachographs (Johnson et al. 1992). All signals were displayed on a chart recorder, sent through an analog-to-digital board, and sampled on a computer at 75 Hz.
Arterial blood was obtained from a 20-gauge indwelling plastic catheter inserted in the brachial or radial artery under local 1 % lidocaine anaesthesia. Multiple blood samples of 3–4 ml were drawn anaerobically (on and off the mouthpiece) over 20–30 s during a 15 min rest period in the sitting position and during the final minute at each grade during a progressive treadmill test to . Measurements of arterial PO2 (Pa,O2), PCO2 (Pa,CO2) and pH were made with a blood gas analyser calibrated with tonometered blood (Radiometer ABL300), and measurements of O2 saturation (Sa,O2) and haemoglobin were made with a co-oximeter (Radiometer OSM3). Calculated Sa,O2 (based on measured Pa,O2 and changes in body temperature and pH) were in close agreement with obtained Sa,O2 measurements (r = 0.94; where Sa,O2 is expressed as a percentage, calculated Sa,O2 = 1.035 (obtained Sa,O2) + 3.15). Blood gases were corrected for in vivo temperature changes during exercise as measured from a thermocouple placed intranasally in the lower third of the oesophagus (Mon-a-Therm 6500). Oesophageal temperature increased 1.8 ± 0.6°C from rest to maximal exercise. The alveolar gas equation was used to calculate ideal alveolar oxygen tension (PA,O2) and the alveolar-arterial oxygen tension difference (A-aDO2) (Otis, 1964). PA,O2 was found to be significantly related to and slightly higher than the directly measured end-tidal PO2 (r = 0.84; PA,O2 = 0.907 (PET,O2) + 11.643). Blood lactate concentration was analysed by means of a YSI Lactate Analyser (model 1500 Sport) and plasma potassium was analysed by ion-specific electrodes (AVL Electrolyte Analyser, series 9100). Progesterone was determined by radioimmunoassay (Endocrine Sciences, Tarzana, CA, USA).
Experimental protocols
Subjects completed two progressive incremental maximal O2 uptake exercise tests () with an identical protocol on a treadmill between 48 h and 1 week of each other. The first exercise test served to familiarize subjects with the protocol. A 5–10 min warm-up period at 4–6 mph with 0 % gradient was followed by increasing the speed of the treadmill by 2 mph every 2.5 min until a comfortable speed of 6, 8 or 10 mph was reached. At this stage, the slope of the treadmill was increased 2 % every 2.5 min until volitional fatigue. The mean length of time for the test was 12 ± 2 min. Between the final two workloads, the change in VO2 with respect to increasing workload was reduced in slope, so that increased 85 ± 5 ml min−1 in twenty-four subjects and decreased 38 ± 3 ml min−1 in five subjects between the final two workloads.
Defining EIAH
In this study, our goal was to determine the adequacy of pulmonary gas exchange during exercise among healthy female subjects. For this purpose, we reasoned that a reduction in Pa,O2 of > 10 mmHg below resting values, which occurred during strenuous and/or maximal intensity exercise, represented a clear, measurable inability to maintain Pa,O2 in the face of increasing demands for O2 transport. Whether in a given subject this degree of arterial hypoxaemia also caused a significant measurable limitation to systemic O2 delivery and to requires further experimentation.
Statistical analysis
A split plot analysis of variance (time × group) with Tukey post hoc test was used to compare mean values across work rates. Groups were compared with weighted means. Pearson product moment coefficients were used to determine relationships. Significance for all tests was set at P < 0.05.
RESULTS
Resting lung function
Mean, range and per cent predicted values for womens’ and mens’ resting lung functions are shown in Table 1. Our subjects’ total lung capacity (TLC) and vital capacity (VC) were significantly higher while lung diffusion capacity (DLCO) was lower than predicted. TLC, VC, functional residual capacity (FRC), forced expiratory volume in 1 s (FEV1.0), maximal expiratory flow at 50 % of VC (MEF50), and DLCO were all lower for our women subjects when compared with height- and weight-matched men based on prediction equations.
Individual subject responses
Individual data for arterial blood gases at each exercise stage to are shown in Fig. 1A-D. At rest, blood gases in all subjects were well within the normal range. There was much variability in the responses to exercise. Seven of the twenty-nine subjects maintained Pa,O2 within 10 mmHg of resting values at (Pa,O2, 89–103 mmHg and Sa,O2, 95–97 %). The remaining twenty-two subjects reduced their Pa,O2 > 10 mmHg below their resting values at (Pa,O2, 67–88 mmHg). In these subjects, Sa,O2 at was 87–94 %, resulting from the combination of the reduced Pa,O2 along with acid shifts in pHa (-0.06 to -0.25) and increases in temperature (1.1 to 3.0°C) (see Table 2). This EIAH occurred at a ranging from 43 to 70 ml kg−1 min−1.
Figure 1. Arterial blood gases during rest and progressive exercise.
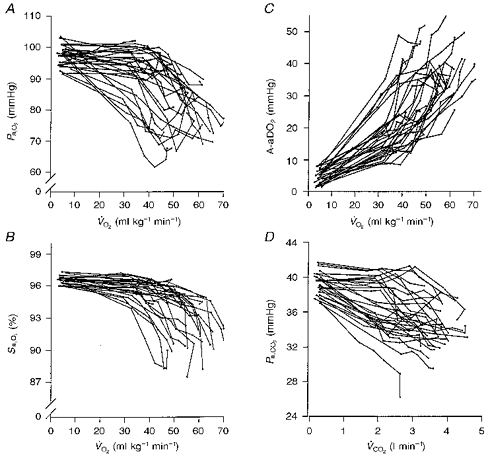
A, individual arterial oxygen pressure (Pa,O2); B, arterial oxygen saturation (Sa,O2); C, alveolar to arterial oxygen pressure difference (A-aDO2); D, carbon dioxide pressure (Pa,CO2) during rest and each exercise workload to ; n = 29.  , CO2 consumption rate.
Table 2.
Mean resting data and data at for twenty-nine female subjects divided into three groups based on the fall in Pa,O2 at
| Reduction in Pa,O2 (rest –) |
Group 1 (no EIAH; n = 7) | Group 2 (mild EIAH; n = 7) < 10 mmHg 10–20 mmHg | Group 3 (severe EIAH; n = 15) > 20 mmHg |
|---|---|---|---|
| Resting data | |||
| Height (cm) | 169 ± 3 | 162 ± 4 | 165 ± 7 |
| Weight (kg) | 65.5 ± 6.1* | 56.3 ± 2.8 | 56.9 ± 6.4 |
| DLCO (ml min−1 mmHg−1) | — | 25.3 ± 3.3 | 27.1 ± 5.1 |
| DLCO/VA (ml min−1 mmHg−1 l−1) | — | 6.63 ± 0.47 | 6.79 ± 0.71 |
| TLC (l) | 5.47 ± 0.33 | 5.26 ± 0.70 | 5.68 ± 0.08 |
| VC (l) | 4.18 ± 0.24 | 3.91 ± 0.61 | 4.07 ± 0.58 |
| MEF50 (l s−1) | 4.69 ± 0.20 | 4.18 ± 0.38 | 4.26 ± 0.47 |
| [Hb] (g dl−1) | 13.2 ± 1.4 | 14.2 ± 0.7 | 13.6 ± 0.6 |
| Data at
| |||
| (ml kg−1 min−1) |
47.4 ± 3.4* | 57.0 ± 3.1 | 60.6 ± 2.3 |
| (range) | 31–55 | 50–62 | 43–70 |
| (l min−1) | 3.10 ± 0.63 | 3.21 ± 0.51 | 3.45 ± 0.23 |
 (l min−1) (l min−1) |
103.9 ± 12.4 | 110.7 ± 10.5 | 107.0 ± 12.8 |
| VT (l) | 2.10 ± 0.29 | 2.12 ± 0.29 | 2.04 ± 0.41 |
| Frequency (breaths min−1) | 50 ± 7 | 53 ± 8 | 54 ± 9 |
| /
|
29.8 ± 3.1 | 29.4 ± 3.5 | 27.7 ± 2.0 |
| VD/VT | 0.16 ± 0.03 | 0.15 ± 0.02 | 0.15 ± 0.01 |
| PA,O2 (mmHg) | 118.0 ± 3.2 | 119.3 ± 4.6 | 113.9 ± 2.9† |
| Pa,O2 (mmHg) | 93.3 ± 2.7* | 86.3 ± 0.5 | 73.2 ± 0.9† |
| A-aDO2 (mmHg) | 25.0 ± 2.3* | 33.5 ± 2.1 | 40.4 ± 2.3† |
| Sa,O2 (%) | 95.3 ± 0.4* | 93.8 ± 0.3 | 90.4 ± 0.2† |
| Pa,CO2 (mmHg) | 31.7 ± 1.2 | 32.1 ± 1.1 | 35.4 ± 0.7† |
| pH | 7.293 ± 0.047 | 7.268 ± 0.060 | 7.290 ± 0.065 |
| [Lactate] (mm) | 10.0 ± 1.5 | 10.5 ± 2.7 | 10.2 ± 1.7 |
| [K+] (mm) | 6.4 ± 0.3 | 6.3 ± 0.5 | 6.4 ± 0.7 |
| Body temperature (°C) | 38.3 ± 0.1 | 38.2 ± 0.1 | 38.2 ± 0.1 |
Values are means ± s.d.
significantly different from groups 2 and 3, P < 0.05
significantly different from groups 1 and 2, P < 0.05. , expiratory ventilation; VT, tidal volume; VD, dead space.
A-aDO2 increased from rest for all subjects in a near-linear fashion with increasing . At O2,max, these changes ranged from 3–10 times rest or 18–51 mmHg (Fig. 1C). During exercise, Pa,CO2 decreased from rest with considerable variability between subjects. End exercise Pa,CO2 values ranged from 27 to 39 mmHg. Note that seventeen subjects reduced Pa,CO2 at the first workload (∼40 %) with further reductions occurring throughout submaximal exercise, while twelve subjects maintained Pa,CO2 near resting values until the exercise intensity approached .
Causes of arterial hypoxaemia at
The relationships between Pa,O2vs. A-aDO2 and Pa,CO2 at are shown in Fig. 2A and B, respectively. Pa,O2 was inversely related to A-aDO2 (r = -0.93; P < 0.001); i.e. with no exceptions, those subjects who exhibited the greatest widening in A-aDO2 at had the most hypoxaemia. Pa,O2 was also inversely related to the magnitude of the hyperventilatory response at as depicted by Pa,CO2 (r = -0.62; P < 0.001). However, there were several exceptions to this relationship. For example, the four subjects with the greatest hypoxaemia (Pa,O2, 65–70 mmHg) showed a substantial hyperventilatory response (Pa,CO2, 31–34 mmHg), and these subjects also had the widest A-aDO2 (46–52 mmHg).
Figure 2. The relationship between Pa,O2 and A-aDO2 and between Pa,O2 and Pa,CO2 at .
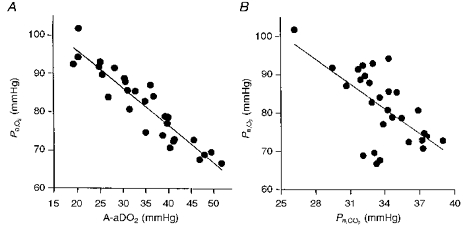
A, Pa,O2vs. A-aDO2; r = 0.93*, y = −0.971 x+ 115.4; B, Pa,O2vs. Pa,CO2; r = 0.62*, y = −2.15 x+ 154.4; n = 29; *P < 0.05. A similar relationship (r = 0.62) was also observed between / and Pa,O2 at (not shown).
Resting lung diffusion capacity (DLCO) or per cent predicted DLCO were not significantly related to A-aDO2 at (Fig. 3A and B). However, eleven of the twenty-three subjects in whom DLCO was measured showed values that were > 20 % below predicted, and eight of these eleven subjects widened A-aDO2 in excess of 35 mmHg at .
Figure 3. The relationship between A-aDO2 at and measured DLCO at rest, and between A-aDO2 at and per cent predicted DLCO.
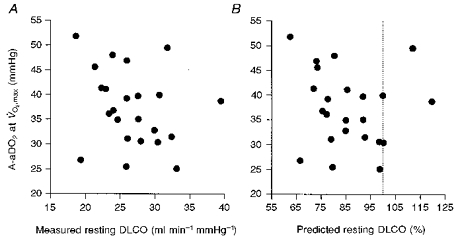
A, A-aDO2 at vs. DLCO at rest; B, A-aDO2 at vs. per cent predicted DLCO (see Crapo et al. 1982). The dotted line is 100 % predicted. The relationships in both panels are not significant (P > 0.05).
Figure 4A and B shows that was inversely related to Pa,O2 (r = -0.49; P = 0.007) and directly to A-aDO2 (r = 0.40; P = 0.033). Although these relationships with were significant, there were several notable exceptions of arterial hypoxaemia and substantial widening of A-aDO2 in subjects with < 50 ml kg−1 min−1 (see below).
Figure 4. The relationship between and Pa,O2 at and between and A-aDO2 at .
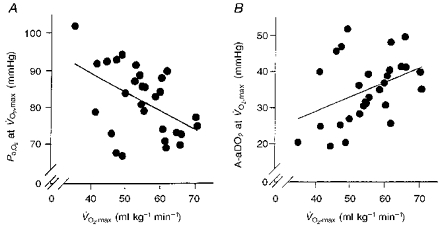
A, Pa,O2vs. ; r = 0.49*; y = -0.515x+ 109.8; B, A-aDO2vs. ; r = 0.40*; y = 0.400x+ 12.952; n = 29; *P < 0.05.
Contrasting subject groups with varying levels of EIAH throughout exercise
We separated the twenty-nine subjects into three groups based on the degree of hypoxaemia at and their respective (Fig. 5; Table 2). Group 1, with no hypoxaemia, had significantly lower than groups 2 (10–20 mmHg reduction in Pa,O2) and 3 (severe EIAH; > 20 mmHg reduction in Pa,O2 from rest), whereas groups 2 and 3 had similar . There were no significant differences among the three groups in age, height, lung volumes, maximal flow rates, DLCO or haemoglobin concentration (Table 2).
Figure 5. Mean changes in blood gases during progressive exercise to in subjects divided into three groups based on the fall in Pa,O2 at from resting values and their respective values.
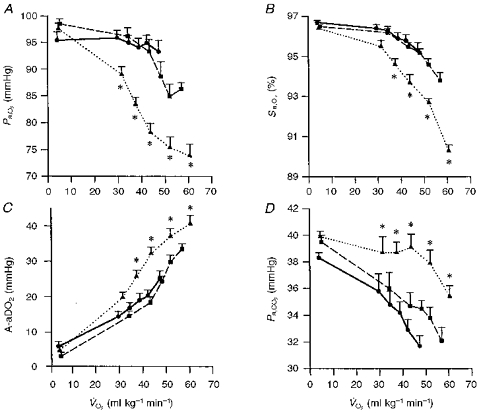
Group 1 (n = 7), < 10 mmHg (•, continuous line); group 2 (n = 7), 11–20 mmHg (▪, dashed line); group 3 (n = 15), > 20 mmHg (▴, dotted line). A, Pa,O2; note that in the most hypoxaemic group 3, Sa,O2 fell from 96.7 ± 0.1 % at rest to 90.4 ± 0.2 % at maximal exercise; 42 % of the fall in Sa,O2 was due to the fall in Pa,O2 and 58 % of the desaturation was due to rightward shift of the HbO2 dissociation curve because of increasing acidity and temperature (see Table 2). B, Sa,O2. C, A-aDO2. D, Pa,CO2. Values are means ± s.e.m.; * denotes group 3 mean value significantly different from groups 1 and 2, P < 0.05.
Groups 1 and 2 showed similar trends in Pa,O2, Pa,CO2 and A-aDO2 throughout submaximal exercise. Differences between these two groups occurred only at the higher workloads achieved by group 2 subjects during which they further widened their A-aDO2 and decreased Pa,O2 to 86.3 ± 0.5 mmHg.
Groups 2 and 3 had similar but differed markedly in their respective responses to exercise. In group 3, Pa,O2 began to fall significantly (-7 ± 2 mmHg from rest) at even the lightest workload (, 25–45 ml kg−1 min−1; 44 ± 3 %) as A-aDO2 widened and no hyperventilation occurred. At moderate intensity exercise (, 45–60 ml kg−1 min−1 or 74 ± 2 %), Pa,O2 for group 3 had fallen 20 mmHg below rest as A-aDO2 continued to widen to 4–5 times resting levels and a significant hyperventilation had not yet occurred. This onset of EIAH at mild to moderate exercise intensities occurred in eleven of the fifteen group 3 subjects; the remaining four subjects did not show significant EIAH until exercise intensity exceeded 80 %. In contrast, group 2 widened their A-aDO2 substantially less than did group 3 subjects at all workloads and hyperventilated progressively throughout exercise. Accordingly, group 2 avoided significant EIAH until very strenuous exercise, and even then Pa,O2 fell < 20 mmHg below resting values. At similar levels of maximal exercise, the Pa,O2 in group 3 subjects (mean 73.2 ± 0.9 mmHg) was 13 mmHg lower than in group 2, and this difference was attributable to a 7 mmHg wider A-aDO2 and a 6 mmHg lower alveolar PO2 in group 3.
Finally, because of the onset of EIAH in group 3 subjects during submaximal exercise, it is of interest to contrast group 1 vs. group 3 at similar exercise , maximal for group 1 and submaximal for group 3. Note at similar values of 40–50 ml kg−1 min−1, the substantially wider A-aDO2, higher Pa,CO2 and therefore substantially lower Pa,O2 in group 3 (78.2 ± 2.0 mmHg) vs. group 1 subjects (93.3 ± 2.7 mmHg).
Gender effects
Figure 6A and B shows Pa,O2vs. and A-aDO2vs. respectively, for the twenty-nine individual female subjects in this study compared with the range of mean values in young adult males from fourteen studies taken from the literature (see Dempsey, Powers & Gledhill, 1990, for summary). Note that for the male subjects, Pa,O2 at is maintained near resting levels until exceeds 60–65 ml kg−1 min−1; many, but not all, highly fit male subjects with higher experience significant EIAH. Women in the present study demonstrated comparable levels of EIAH and widened A-aDO2 to similarly aged, highly fit men. Furthermore, as with males, not all highly fit women showed EIAH. However, EIAH (Fig. 6A) and excessively widened A-aDO2 (Fig. 6B) occurred in women at a lower compared with similarly aged men.
Figure 6. Comparison between young adult females (n = 29) and the mean range of values of young adult males in fourteen studies since 1960 which measured arterial blood gases at .
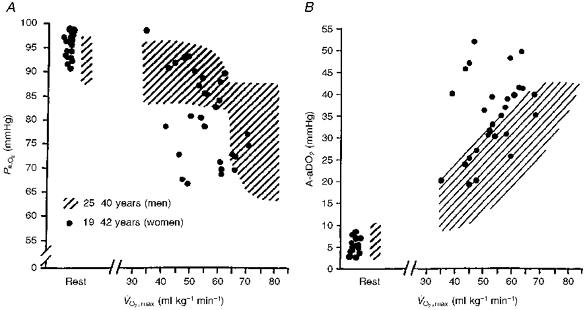
The hatched area represents male data (see summary in Dempsey et al. 1990), and filled circles are individual values for female subjects. A, Pa,O2vs. ; B, A-aDO2vs. .
DISCUSSION
We have demonstrated significant arterial hypoxaemia during strenuous exercise in the majority of a sample of twenty-nine healthy young women of widely varying fitness levels. In general, exercise-induced arterial hypoxaemia was most prevalent in women with higher although there were several cases of severe hypoxaemia in habitually active women exhibiting near normal levels of . The exercise-induced arterial hypoxaemia (EIAH) was primarily associated with an excessively widened alveolar to arterial PO2 difference, which was not sufficiently compensated by the hyperventilatory response. Among those women who became hypoxaemic at one-half began to experience an excessive widening of their A-aDO2 and EIAH during moderate intensity exercise, and the hypoxaemia became progressively worse with further increases in workload.
Exercise-induced arterial hypoxaemia: gender effects
Both men and women demonstrate significant EIAH, which is most closely associated with an increasing A-aDO2, but is also related to the absence of sufficient compensatory hyperventilation. The EIAH in women differed from that previously reported among young men in several ways. First, among female subjects, the minimum at which EIAH occurred was substantially lower than in men. Furthermore, normally fit male subjects with within 15 % of predicted normal (i.e. in the 40–50 ml kg−1 min−1 range) have never been reported to demonstrate EIAH, which contrasts with our current study in which 40 % of our female sample with within 15 % of normal ( 35–50 ml kg−1 min−1) experienced EIAH. Finally, among both male and female subjects who demonstrated significant EIAH at maximal exercise, most subjects showed hypoxaemia beginning to develop during submaximal exercise of moderate intensity. Several highly fit young adult males also showed EIAH onset during submaximal exercise (Dempsey et al. 1984). Women appear to be especially prone to the onset of EIAH at submaximal exercise as shown in eleven of the fifteen most severe EIAH subjects (group 3) in the present sample.
We believe these gender comparisons allow us to propose that healthy young women are more susceptible to EIAH than are their male counterparts; however, we must also emphasize the need for more descriptive data in women. For example, sufficient studies in young adult men have been conducted to clearly document that the untrained normally widen their A-aDO2 2- to 3-fold from rest to maximal exercise, and that they also hyperventilate, which raises alveolar PO2 sufficiently during strenuous exercise to prevent Pa,O2 from falling below resting levels. However, we are aware of only one other study that measured arterial blood gases during exercise in women and these data were obtained only at maximal exercise in high subjects (Gore et al. 1997). In both studies, subject samples are weighted towards the habitually active subject and usually with higher than normal . Our very surprising finding of significant EIAH in several of the active female subjects with near normal clearly needs further testing in order to determine the prevalence of EIAH among the normal population of young women. In other words, we need to establish the ‘reference’ standard of response for these fundamental indices of lung function during exercise. Finally, we also wish to emphasize that all of our subjects were tested only in the follicular phase of the menstrual cycle in order to avoid any confounding effects of changes in ovarian hormones. Clearly these hormonal changes do affect a variety of ventilatory, cardiovascular, volume regulatory and haemotological functions, which may influence EIAH (Lebrun, 1993). These effects need to be studied.
Our findings also point to a greater susceptibility to EIAH in women in two other physiological circumstances. First, given the deterioration in lung elastic recoil, the increase in airway closing volume, and the reduced diffusion surface area coincident with the normal ageing process, we might also expect even greater gender effects on the prevalence of EIAH in older females across the entire fitness spectrum (Johnson & Dempsey, 1991; Prefaut et al. 1994). Secondly, even very modest reductions in inspired PO2 (PI,O2) as experienced at only moderately high altitudes (PI,O2, ∼125 mmHg; altitude, 1000-1500 m) have been shown to cause or to markedly exacerbate EIAH and to reduce in highly fit males (Dempsey et al. 1984; Gore et al. 1997). Perhaps an even greater susceptibility to environmental hypoxia may be expected in fit females.
Mechanisms of EIAH
Exercise-induced hypoxaemia occurred in most of our subjects during both submaximal and maximal exercise as a result of two deficits; namely, an underlying excessive widening of the alveolar to arterial PO2 difference, combined with a blunted ventilatory response that was insufficient to compensate for the underlying excessive A-aDO2. Our study does not address the mechanisms causing the widened A-aDO2. Previous studies in fit male subjects with no or modest EIAH have documented exercise-induced non-uniformity of ventilation to perfusion distribution (VA/Q); by exclusion, these studies have also estimated a significant contribution to the widening of A-aDO2 from diffusion disequilibrium (Torre-Bueno, Wagner, Saltzman, Gale & Moon, 1985) and/or from the normal small anatomical shunt (Gledhill, Froese & Dempsey, 1977). The smaller lung volumes and diffusion surface, narrowed airways, and even reduced levels of circulating haemoglobin in healthy women (see Introduction) provide a morphological basis for gender differences in both diffusion capacity and in the uniformity of intra-regional distribution of ventilation. Our female subjects as a group did show a significantly lower than normal DLCO at rest even if corrected for alveolar lung volume, but we were unable to distinguish between those subjects with and those without EIAH based solely on these resting measurements. Measurements of A-aDO2 determinants are needed during exercise in these types of female subjects with varying degrees of EIAH. Our observations would suggest that the mechanism responsible is already often present during even submaximal exercise, a finding that favours significant contributions from VA/Q maldistribution (see below).
Why did our most hypoxaemic subjects ventilate less at any given submaximal or maximal work rate? First, we emphasize that the higher Pa,CO2 throughout exercise in the severe EIAH group was associated with an overall (and /), which were lower than those of group 2. Secondly, differences in the level of known circulating chemical stimuli and in mechanical constraints to ventilation can be ruled out by comparing the responses to exercise among the three groups shown in Fig. 5. Note (Table 2) that the known chemical stimuli in arterial blood were either similar (K+, lactate, temperature) or even greater (i.e. lower Pa,O2 and pHa) at all workloads in the group with the lower ventilatory responses. Significant expiratory flow limitation did occur during heavy and maximal exercise in our female subjects (see below) (McClaran et al. 1996). However, during mild and moderate exercise intensities, clear differences in ventilatory response were already present among the three groups, even though flow limitation was not present. Accordingly, by exclusion, we propose that the ventilatory control system in our most hypoxaemic group was less ‘responsive’ (or sensitive) to a given sensory stimulus throughout all exercise intensities. Whether or not these stimuli are the usual chemoreceptor feedback influences, the locomotor-linked stimuli responsible for ‘exercise hyperpnoea’, per se, or their combination is unknown.
During maximal exercise in our hypoxaemic female subjects (group 3), a clear role for mechanical limitation in preventing adequate compensatory hyperventilation does arise because of their underlying excessive A-aDO2. For example, given the mean A-aDO2 of 40 mmHg at maximal exercise, it can be shown (from the alveolar air equation) that these subjects must raise their an additional 55 l min−1 (about a 50 % increase) in order to raise alveolar PO2 sufficiently to prevent significant EIAH (i.e. Pa,O2 > 85 mmHg). This required for compensation of the widened A-aDO2 is substantially in excess of these subjects’ maximum flow: volume envelope (or maximum voluntary ventilation) and therefore not mechanically feasible (McClaran et al. 1996).
In summary, the data clearly show that in most subjects with EIAH, the A-aDO2 is excessively widened and the ventilatory response reduced during both submaximal and maximal exercise. Our original hypothesis for this study focused on the reduced lung volume and diffusion surface in the female (see Introduction). However, it seems reasonable to suggest that these gender-dependent maximal dimensions of the lung and airways would only become critical determinants of pulmonary O2 and CO2 exchange at or near maximal exercise. The onset of EIAH during submaximal exercise in many of the subjects suggests that there may be additional important determinants of EIAH during less strenuous exercise.
Re-examination of the (high) demand vs. (normal) capacity concept of EIAH
A striking finding in our study was the onset of excessive A-aDO2 and arterial hypoxaemia during submaximal exercise in many of the subjects who experienced EIAH during maximal exercise (see Fig. 5). The onset of significant hypoxaemia during submaximal exercise and its further progression with more strenuous exercise has only been observed in habitually active subjects, male and female. In our present study, this mainly included females with a high but even occurred in some active subjects with a near normalV˙O,2max.
These observations challenge the previously held concept that arterial hypoxaemia incurred at maximal exercise in many highly fit subjects represents the imbalance between the normal capacity of a healthy lung for diffusion and for VA/Q distribution uniformity and the extraordinarily high demands for O2 transport by a highly trained O2 transport system (Dempsey, 1986). This concept was based on observations that the lung's diffusion capacity, lung volumes, and maximal flow: volume envelope usually remain relatively unaltered from normal in the highly fit or as a result of intense physical training, whereas other key determinants of maximal systemic O2 transport and utilization such as left ventricular function, circulating blood volume, muscle capillary to mitochondrial diffusion capacity and muscle metabolic capacity are all enhanced in the trained state. However, the documentation of excessive A-aDO2 during exercise at equivalent O2 uptakes in many active (vs. inactive) subjects (see Fig. 5), implies that lung structure/function subserving alveolar to arterial O2 transport is actually abnormally compromised in many of these active subjects. It remains to be determined if intense habitual physical training has the potential to actually compromise the normal morphology of the lung's alveolar-capillary interface.
Consequences
What are the consequences of EIAH in females? At any given submaximal work rate, is not compromised, probably because an increased O2 extraction by the working muscle is possible and this compensates for any hypoxaemia-induced deficiencies in O2 transport. In fact, the reduced ventilatory response in those with EIAH is certainly more economical and may be beneficial under these circumstances. However, at maximal exercise, no room remains for compensation and the occurrence of EIAH means that the maximal (available) arterial-mixed venous oxygen difference will be compromised. Accordingly, preventing EIAH (≤ 92 %Sa,O2) via a mildly hyperoxic inspirate, which maintained Sa,O2 at resting levels, led to significantly higher in men (Powers et al. 1989). Our preliminary findings also show a significant detrimental effect of EIAH on in women (Harms et al. 1997).
Acknowledgments
We wish to thank Dr Peter Hanson for technical assistance. Support for this project came from NHLBI (grant RO1 HL-15469). C. A. Harms and S. R. McClaran were supported by an NIH training grant (T32 HL-07654). C. A. Harms is the recipient of a Parker B. Francis Foundation Fellowship.
References
- Bayly WM, Hodgson DR, Schulz DA, Dempsey JA, Gollnick PD. Exercise-induced hypercapnia in the horse. Journal of Applied Physiology. 1989;67:1958–1966. doi: 10.1152/jappl.1989.67.5.1958. [DOI] [PubMed] [Google Scholar]
- Crapo RO, Morris AH. Standardized single breath normal values for carbon monoxide diffusing capacity. American Review of Respiratory Disease. 1981;123:185–189. doi: 10.1164/arrd.1981.123.2.185. [DOI] [PubMed] [Google Scholar]
- Crapo RO, Morris AH, Gardner RM. Reference values for pulmonary tissue volume, membrane diffusing capacity and pulmonary capillary blood volume. Bulletin European Physiolpathologic Respiration. 1982;18:893–899. [PubMed] [Google Scholar]
- Dempsey JA. Is the lung built for exercise? Medicine and Science in Sports and Exercise. 1986;18:143–155. [PubMed] [Google Scholar]
- Dempsey JA, Hanson PG, Henderson KS. Exercise-induced arterial hypoxaemia in healthy human subjects at sea level. The Journal of Physiology. 1984;355:161–175. doi: 10.1113/jphysiol.1984.sp015412. [DOI] [PMC free article] [PubMed] [Google Scholar]
- Dempsey JA, Powers S, Gledhill N. Cardiovascular and pulmonary adaptations to physical activity: Discussion. In: Bouchard C, Shepard RJ, Stephens T, editors. Exercise, Fitness and Health. Champaign, Illinois, USA: Human Kinetics; 1990. pp. 205–216. [Google Scholar]
- Gledhill N, Froese AB, Dempsey JA. Ventilation to perfusion distribution during exercise in health. In: Dempsey JA, Reed CE, editors. Muscular Exercise and the Lung. Madison, WI, USA: University of Wisconsin Press; 1977. pp. 325–344. [Google Scholar]
- Gore CJ, Little SC, Hahn AG, Scroop GC, Norton KI, Bourdon PC, Woolford SM, Buckley JD, Stanef T, Campbell DP, Watson DB, Emonson DL. Reduced performance of male and female athletes at 580 m altitude. European Journal of Applied Physiology. 1997;75:136–143. doi: 10.1007/s004210050138. 10.1007/s004210050138. [DOI] [PubMed] [Google Scholar]
- Harms CA, McClaran SR, Nickele G, Pegelow D, Dempsey JA. High prevalence of exercise-induced arterial hypoxaemia and expiratory flow limitation in healthy young women. Respiratory and Critical Care Medicine abstract. 1997;144:A910. [Google Scholar]
- Johnson BD, Dempsey JA. Demand vs. capacity in the aging pulmonary system. Exercise and Sport Science Reviews. 1991;19:171–210. [PubMed] [Google Scholar]
- Johnson BD, Saupe KW, Dempsey JA. Mechanical constraints on exercise hyperpnea in endurance athletes. Journal of Applied Physiology. 1992;73:874–886. doi: 10.1152/jappl.1992.73.3.874. [DOI] [PubMed] [Google Scholar]
- Lebrun CM. Effect of the different phases of the menstrual cycle and oral contraceptives on athletic performance. Sports Medicine. 1993;16:400–430. doi: 10.2165/00007256-199316060-00005. [DOI] [PubMed] [Google Scholar]
- McClaran SR, Harms CA, Pegelow DF, Dempsey JA. Flow limitation affects control of breathing during heavy exercise in highly trained women. Medicine and Science in Sports and Exercise abstract. 1996;28:S78. [Google Scholar]
- Mead J. Dysanapsis in normal lungs assessed by the relationship between maximal flow, static recoil, and vital capacity. American Review of Respiratory Disease. 1980;121:339–342. doi: 10.1164/arrd.1980.121.2.339. [DOI] [PubMed] [Google Scholar]
- Otis AB. The work of breathing. In: Fenn WO, Rahn H, editors. Handbook of Physiology, section 3, Respiration. II. Washington, DC, USA: Americal Physiological Society; 1964. pp. 463–476. chap. 17. [Google Scholar]
- Powers SK, Lawler J, Dempsey JA, Dodd S, Landry G. Effects of incomplete pulmonary gas exchange on VO2,max. Journal of Applied Physiology. 1989;66:2491–2495. doi: 10.1152/jappl.1989.66.6.2491. [DOI] [PubMed] [Google Scholar]
- Powers SK, Martin D, Cicale M, Collop N, Huang D, Mengelkoch D, Criswell T. Exercise induced hypoxemia in athletes: role of inadequate hyperventilation. European Journal of Applied Physiology. 1992;65:37–42. doi: 10.1007/BF01466272. [DOI] [PubMed] [Google Scholar]
- Prefaut CG, Anselme F, Caillaud C, Masse-Biron J. Exercise-induced hypoxemia in older athletes. Journal of Applied Physiology. 1994;76:120–126. doi: 10.1152/jappl.1994.76.1.120. [DOI] [PubMed] [Google Scholar]
- Rowell LB, Taylor HL, Wang Y, Carlson WS. Saturation of arterial blood with oxygen during maximal exercise. Journal of Applied Physiology. 1964;19:284–286. doi: 10.1152/jappl.1964.19.2.284. [DOI] [PubMed] [Google Scholar]
- Schwartz J, Katz SA, Fegley RW, Tockman MS. Sex and race differences in the development of lung function. American Review of Respiratory Disease. 1988a;138:1415–1421. doi: 10.1164/ajrccm/138.6.1415. [DOI] [PubMed] [Google Scholar]
- Schwartz JD, Katz SA, Fegley RW, Tockman MS. Analysis of spirometic data from a national sample of healthy 6- to 24-year-olds (NHANES II) American Review of Respiratory Disease. 1988b;138:1405–1414. doi: 10.1164/ajrccm/138.6.1405. [DOI] [PubMed] [Google Scholar]
- Thurlbeck WM. Postnatal human lung growth. Thorax. 1982;37:564–571. doi: 10.1136/thx.37.8.564. [DOI] [PMC free article] [PubMed] [Google Scholar]
- Torre-Bueno JR, Wagner PD, Saltzman HA, Gale GE, Moon RE. Diffusion limitation in normal humans during exercise at sea level and simulated altitude. Journal of Applied Physiology. 1985;58:989–995. doi: 10.1152/jappl.1985.58.3.989. [DOI] [PubMed] [Google Scholar]
- West JB, Matthieu-Costello O, Jones JH, Birks EK, Logeman RB, Pascoe JR, Tyler WS. Stress failure of pulmonary capillaries in racehorses with exercise-induced pulmonary hemorrhage. Journal of Applied Physiology. 1993;75:1097–1109. doi: 10.1152/jappl.1993.75.3.1097. [DOI] [PubMed] [Google Scholar]