

Abstract
The effects of single isovelocity shortening contractions on force production of the electrically stimulated human adductor pollicis muscle were investigated in seven healthy male subjects.
Redeveloped isometric force immediately following isovelocity shortening was always depressed compared with the isometric force recorded at the same muscle length but without preceding shortening. The maximal isometric force deficit (FD) was (mean ± s.e.m.) 37 ± 2 % after 38 deg of shortening at 6.1 deg s−1.
The FD was positively correlated with angular displacement (r2 > 0.98) and decreased with increasing velocity of the shortening step. Stimulation at 20 Hz instead of 50 Hz reduced absolute force levels during the contractions to about 73 % and the FD was decreased to a similar extent. Eighty-nine per cent of the velocity-related variation in the FD could be explained by the absolute force levels during shortening.
FD was largely abolished by allowing the muscle to relax briefly (approximately 200 ms), a time probably too short for significant metabolic recovery.
At all but the highest velocities there was a linear decline in force during the latter part of the isovelocity shortening phase, suggesting that the mechanisms underlying FD were active during shortening.
Our results show that shortening-induced force deficit is a significant feature of human muscle working in situ and is proportional to the work done by the muscle-tendon complex. This finding has important implications for experimental studies of force-velocity relationships in the intact human.
The functional properties of skeletal muscle during dynamic contractions have been extensively studied and often force-velocity characteristics are obtained by measuring the force or velocity at one muscle length. The explicit, or more usually the implicit, assumption made is that once any initial alterations in series elasticity have taken place, the muscle will settle into a phase of steady shortening, with the force sustained being determined only by the relative velocity. In practice, and especially with whole muscle preparations, the force rarely reaches a constant value but declines throughout the shortening contraction. Whilst measurements made at one length may suggest a single force-velocity relationship (e.g. De Haan, Jones & Sargeant, 1989), in reality a family of curves can be obtained by making the measurements after varying degrees of shortening. This effect is well illustrated by the results of Joyce, Rack & Westbury (1969) and Joyce & Rack (1969) in cat soleus, where the force, or shortening velocity, at a certain muscle length depends on the amount of preceding shortening. Since the measurement of force-velocity characteristics is central to much of muscle physiology it is important to understand the mechanism and significance of this behaviour.
The continued decline in force during sustained shortening contractions may be related to another widely recognized, but poorly understood, phenomenon of skeletal muscle, that of shortening deactivation. From the work on isolated muscle preparations (Abbott & Aubert, 1952; Maréchal & Plaghki, 1979; Julian & Morgan, 1979; DeHaan et al. 1989) and single fibres (Sugi & Tsuchiya, 1988; Granzier & Pollack, 1989; Edman, Caputo & Lou, 1993), it has been known that isometric force redevelopment immediately following a single phase of isovelocity shortening is reduced compared with isometric force measured at the same muscle length but without the preceding shortening. Whatever the mechanism of this force decrement, it is possible that the effect could be occurring during the shortening phase and thereby account for the progressive loss of force.
The present study had two main objectives: first to see whether shortening deactivation could be demonstrated in human muscle working in situ and second to see whether there is any link between shortening deactivation and the progressive loss of force seen during shortening at a constant velocity.
METHODS
Subjects
Seven healthy male subjects (20–33 years of age) gave their informed consent to participate in the experiments, which were approved by the Ethics Committee of the Vrije Universiteit.
Hand immobilization
The subject sat in an adjustable chair with the left forearm suppinated in front and to the left with the elbow flexed at 120 deg. The forearm was supported horizontally on a Perspex board, with padding under the elbow and a plastic bag containing salt under the hand. The Perspex support was fixed rigidly to, and positioned 15 cm above, a stainless steel table on which was mounted the motor and the force transducer (Fig. 1). A polystyrene mould was placed within the palm of the hand and the fingers. The hand was held horizontally in a slightly concave form with the abducted thumb slightly above the plane of the other fingers (Fig. 2) so that thumb ab- and adduction were not obstructed. Abduction of the index finger was prevented by a vertical plate placed alongside the finger on the edge of the supporting board. Finally the entire hand, with the exception of the thumb, was immobilized with a Perspex cover plate which was tightened down on the mould. The position of the hand was marked to check that it remained constant throughout the experiment.
Figure 1. Schematic drawing (top view) of the connections between the linear step motor and the force transducer.
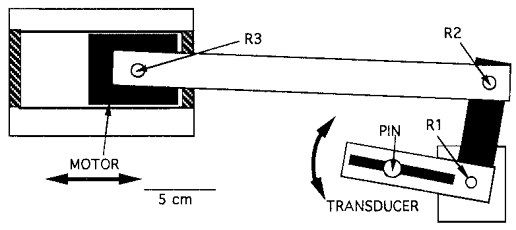
R1 is the fixed axis of rotation of the transducer and the overlying thumb (not shown). The connections R2 and R3 are not fixed and allow for rotation and translation. With this construction, linear motor displacements were converted into rotations of the transducer and thumb.
Figure 2. Photograph of the experimental set-up.
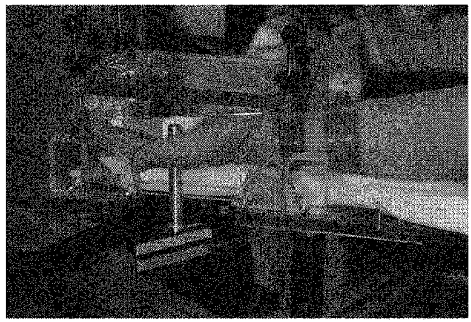
The inside of the left thumb (hand palm up) pressed against the vertical pin which was attached to the transducer.
Electrical stimulation
The adductor pollicis muscle was activated by electrical stimulation of the ulnar nerve at the wrist. Stainless steel button electrodes (9 mm diameter) covered with chamois leather were placed over the ulnar nerve, with the cathode and anode respectively 3 and 7 cm proximal of the pisiform bone. The electrodes were soaked in saline and pressed firmly against the skin with elastic straps around the wrist (Fig. 2). Stimulation was with constant current unidirectional square wave pulses of 100 μs duration (model DS7, Digitimer Ltd, Welwyn Garden City, UK). The current was set 30 % above the stimulus which produced maximal isometric tetanic force.
Force measurement
The thumb pushed against an aluminium pin (10 cm long, 1 cm diameter) placed vertically between thumb and index finger and screwed into a rail on the longer arm of the force transducer (Fig. 2). The transducer positioned directly beneath the arm support was L-shaped (one arm being 10 cm and the other 7.5 cm long). Strain gauges were mounted on the longer arm to measure forces applied in the horizontal plane. The transducer rotated around a pivot at the junction of the two arms (Fig. 1, R1 and Fig. 2) attached to the metal frame and positioned directly under the carpo-metacarpal joint of the thumb so that the axis of rotation of the transducer passed through the centre of rotation of the carpo-metacarpal joint of the thumb. The distance from the pin to the pivot point was adjusted for each subject so that the ulnar side of the thumb pressed against the pin just proximal of the distal phalanx. Consequently, whatever the angle between thumb and index finger in the horizontal plane, the pin remained in contact with the thumb at the same spot. All forces reported in this study are those exerted by the thumb at the pin; no attempt has been made to calculate the forces generated in the muscle. Unless otherwise indicated forces are presented as total force (active + passive force). Passive force was obtained for each subject during passive shortening at several velocities. In general passive forces were zero towards the end of the shortening phase.
The transducer was linear in the range 0–300 N (r2 = 0.98) with a sensitivity of 0.01 N and an undamped resonance frequency > 1 kHz. The compliance of the entire construction, measured with forces applied at the top of the pin, was 0.16 deg N−1.
Angular rotation
The transducer (and consequently the thumb) rotated around its pivot point R1 driven by a linear step motor connected to the transducer via an aluminium link pivoted at R2 and R3 (Fig. 1) so that any linear displacement of the motor was converted into a rotation around R1.
When the thumb was fully adducted its length axis was parallel with that of the index finger and was defined as 0 deg thumb angle. Because the vertical pin on the force transducer was placed between the thumb and the index finger, the smallest thumb angle at which forces could be measured was 36 deg. It was possible to increase thumb angle up to 74 deg (maximal abduction) before anatomical limits were approached so that during isokinetic contractions, the maximal angular displacement was 74–36 = 38 deg; this was produced by a motor displacement of 50 mm.
The motor was positioned so that at half-maximal displacement (55 deg thumb angle) the arm R3-R2 (Fig. 2) was at a 90 deg angle with arm R2-R1. In this central position the sinusoidal movement of the thumb produced by the linear movement of the motor was minimized and, to a first approximation, the movement of the thumb was linear. The velocities presented in this study are those measured at the mid-point of the contraction and fell off by approximately 5 % at either end of the range of movement.
Data recording
Onset, duration and frequency of stimulation, onset and speed of motor movement and the sampling frequency (1000 Hz) of the force and length signal were computer controlled. The measuring and control system has previously been used in rat studies and has been described in detail by DeRuiter, DeHaan & Sargeant (1995).
Experimental procedures
Subjects came into the laboratory on occasions with at least 3 days between visits. On the first occasion the subject was familiarized with the electrical stimulation and other procedures but no data were collected.
To maintain a constant muscle temperature the subject's hand and arm were immersed in a water bath at 45°C for 30 min prior to each test and during the experiment a lamp was used to warm the hand. Skin temperature measured with a thermocouple above the adductor pollicis was 36.0 ± 0.5°C. With the hand securely in position, optimum stimulation parameters were established and then isometric forces (1 s tetani) at different thumb angles were measured to construct the force-angle relationship of the adductor pollicis (36–74 deg thumb angle; Fig. 3). There was little variation in force over the range of joint angles used although there were some changes in this relationship towards the end of a set of experiments (Fig. 3).
Figure 3. Length-force relationship of adductor pollicis muscle.
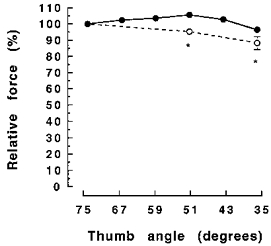
Active force ( = total force - passive force) (means ± s.e.m.) at different thumb angles as a percentage of force at the 74 deg thumb angle. •, the relationship at the start of the second experimental session; ○, 1 h later at the end of the session. *Significant difference (P < 0.05) between relative force at the same thumb angle.
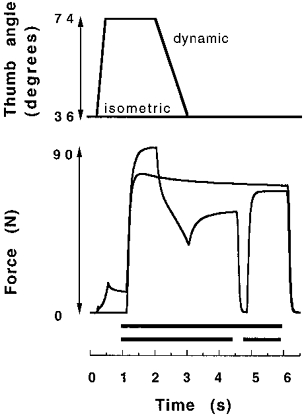
All shortening contractions started with the adductor pollicis muscle being passively stretched from a 36 deg thumb angle to a greater angle (longer muscle complex length). The muscle was then stimulated and after 1 s of isometric contraction the maximally activated muscle complex was allowed to shorten (thumb adduction) at a predetermined velocity, after which force redeveloped under isometric conditions at the shorter muscle length (36 deg thumb angle). The duration of the stimulation depended on the imposed velocity and consequently varied between 8.5 s (at 6.1 deg s−1) and 2.7 s (at 458.4 deg s−1). An example of the type of contractions used is presented in Fig. 4.
Figure 4. Examples of the type of contractions used in the present study.
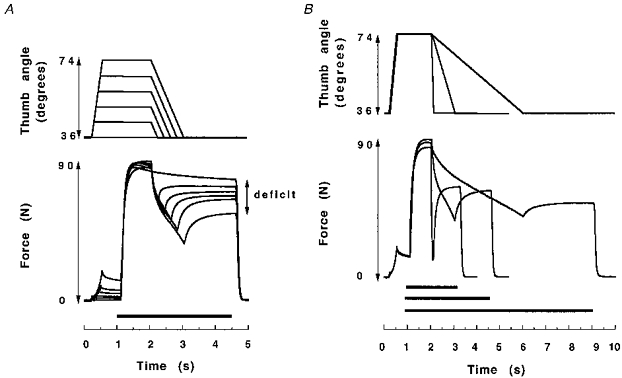
A, displacement (top trace) and force data of 5 isovelocity shortening contractions at 38.2 deg s−1 with different angular displacements (same subject). The adductor pollicis muscle was passively stretched to different thumb angles in each contraction. Stimulation (50 Hz) is indicated by the black bar above the time axis. The difference between the control isometric force at 36 deg (top force trace at 4.5 s) and the redeveloped isometric force was defined as the force deficit. B, data from 3 contractions at different shortening velocities (458.4, 38.2 and 9.5 deg s−1).
Electrical stimulation
Stimulation frequency was normally 50 Hz but for one series of experiments 20 Hz was used where the effect of absolute force levels on the shortening-induced loss of force was investigated.
Shortening velocity and angular displacement
Isometric force redevelopment was measured after shortening at different velocities and for different angular displacements. The force deficit was defined as the difference between the redeveloped isometric force following an isovelocity shortening contraction which ended at the thumb angle of 36 deg and the force of an isometric contraction during which the thumb remained at 36 deg throughout the stimulation (e.g. Fig. 4). The relative FD was defined as the FD expressed as a percentage of the maximal isometric force at the 36 deg angle. The imposed angular velocity was constant during the shortening phase and ranged from 6.1 to 458.4 deg s−1. Angular displacement was changed in steps of 7.6 deg from 0 to 38 deg. The different angular velocities and displacement steps were imposed upon the thumb in random order with 2 min rest between contractions.
Recovery of force deficit
To gain insight into possible mechanisms behind the shortening- induced force depression, the time course of recovery of the force deficit was investigated on the third experimental day. Shortening was set at an intermediate velocity of 38.2 deg s−1 and the maximum angular displacement of 38 deg was used. After force redevelopment at the 36 deg angle, the stimulation was interrupted for short intervals and force allowed to redevelop again. This procedure was repeated three to five times for each subject. Isometric forces recorded during this procedure were compared with force during an isometric tetanus of the same duration without a preceding phase of shortening.
Statistics
Student's paired t test for paired data was used for determination of statistical significance (α = 0.05). All results are presented as means ± s.e.m. Pearson's correlation coefficient was calculated to establish significance of correlation (α = 0.05).
RESULTS
Force following shortening
The isometric force deficit following shortening is illustrated in Fig. 4. The force deficit increased with the length of the shortening step, whilst the velocity was kept constant (Fig. 4A), and was inversely related to velocity, when keeping the displacement constant (Fig. 4B). There was a linear relationship (r2 > 0.98) between angular displacement and force deficit at each velocity of shortening, shown for four velocities in Fig. 5.
Figure 5. The effect of angular displacement on the force deficit.
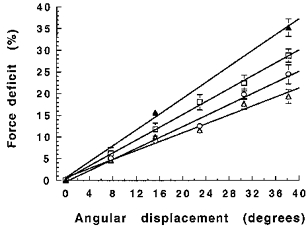
Relative force deficit after isovelocity shortening at different velocities (from top to bottom: 9.5, 38.2, 152.8 and 458.4 deg s−1) and with different angular displacements. Isometric force (50 Hz) is 100 %.
There are two major differences between shortening contractions carried out at fast and slow velocities which might account for the different force deficits illustrated in Fig. 4B. The duration of the contractions will be different as will be the force sustained during the shortening as a consequence of the force-velocity relationship of the muscle. To distinguish between these possibilities the experiments shown in Fig. 4 were repeated using 20 Hz stimulation so the force sustained during shortening was lower than when stimulating at 50 Hz, while the velocity and duration were the same. The data in Table 1 show the relative force deficits observed when stimulating the muscle at either 50 or 20 Hz. The isometric force generated at the lower frequency was, on average, 73 % of that at 50 Hz and stimulation at the lower frequency resulted in a lower relative force deficit for the same velocity and angular displacement. The results suggest that it is the force sustained during the shortening contraction that is important for the force deficit, rather than the velocity per se or the duration of the contraction. Figure 6 shows that approximately 89 % of the variance in the relative deficit after isovelocity shortening at different speeds was explained by the difference in force level during shortening.
Table 1.
Relative force deficit and stimulation frequency
| Relative force deficit (%) | ||
|---|---|---|
| Angular velocity (deg s−1) | 50 Hz | 20 Hz |
| 6.1 | 37.2 (2.1) | 29.9 (2.7) |
| 9.5 (after 15.3 deg) | 15.7 (1.1) | 12.0 (1.3) |
| 9.5 | 35.2 (2.0) | 26.2 (3.4) |
| 38.2 | 28.8 (1.5) | 22.6 (1.6) |
| 458.4 | 19.4 (1.6) | 13.0 (2.2) |
The values shown are the means (with s.e.m. in parentheses) of the relative deficit of redeveloped isometric force (50 or 20 Hz stimulation) in adductor pollicis muscle after 38.2 deg of shortening. For 9.5 deg s−1 the relative deficit after 15.3 deg of shortening is also given. At all velocities, 20 Hz values are significantly (P < 0.05) lower compared with the 50 Hz values.
Figure 6. Relative force deficit as a function of the force at the end of the 38 deg shortening phase expressed as a percentage of 50 Hz maximal isometric force.
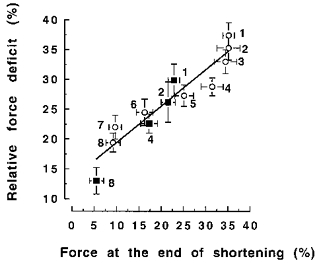
▪ and ○, data obtained from 20 Hz and 50 Hz stimulated contractions, respectively. The numbers (1–8) denote the different imposed shortening velocities (respectively: 6.1, 9.5, 19.1, 38.2, 76.4, 152.8, 305.6, 458.4 deg s−1) during contractions.
Recovery of the force deficit
Experiments illustrated in Fig. 7 show that the force deficit could be substantially reversed by a brief interruption of stimulation during the redevelopment of isometric force. Figure 8 shows the individual data points from experiments where the time during which the stimulation was interrupted was varied. When the interruption was too short for the muscle to relax completely (left of the vertical line in Fig. 8) recovery of the deficit was less than when the time was sufficient for complete relaxation (203 ± 4.5 ms). On average, only 27.2 ± 5.5 % of the deficit remained after the stimulation was interrupted for between 203 and 2400 ms.
Figure 7. Example of the force deficit before and after a short interruption of stimulation.
The black bars above the time axis indicate stimulation. Following isovelocity shortening (38.2 deg s−1), the redeveloped isometric forces at 4.5 and 6 s were compared to the isometric contraction (top force trace on the right).
Figure 8. Individual data showing the effect of stimulus interruption on the force deficit after 38 deg of isovelocity shortening at 38.2 deg s−1.
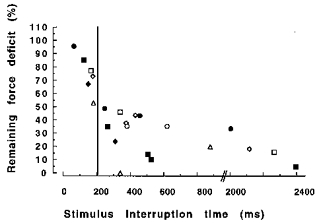
Each data point represents the results of a separate contraction (see Fig. 7 for example), while the different contractions within the same subject are denoted by the same symbol. The data points left to the vertical line were obtained with stimulus interruption times shorter than the muscle relaxation time (203 ± 5 ms).
Rate of force redevelopment
During the redevelopment of isometric force following shortening, more time was needed to reach isometric plateau values compared with the control situation. This slow rise of force during redevelopment of tension was particularly noticeable after contractions with relatively long shortening steps at slow velocities. For example, during the 1500 ms isometric phase immediately following shortening shown in Fig. 7, force increased by 34 % (from 35 to 53 N). After interruption of stimulation the same relative increase in force occurred in less than one-third of this time (490 ms, Fig. 7).
Force during shortening
Figure 4 shows that there was a decrease of force during the entire isovelocity shortening phase. In Fig. 9 the forces sustained during shortening at different velocities are expressed as a percentage of the isometric force immediately before the release. Force decreased rapidly during the early phase of shortening but then the rate of decline slowed. During the later phase of shortening at velocities under 152.8 deg s−1 and between thumb angles of 51 and 36 deg, there was a linear decline in force (r2 > 0.98). In contrast, during the fastest contractions (305.6 and 458.4 deg s−1) such a linear phase of force decline had not been achieved by the end of the shortening step (Fig. 9). An unexpected finding was that forces during shortening at 6.1, 9.5 and 19.1 deg s−1 were very similar (P > 0.05).
Figure 9. Force during shortening at different angular velocities (6.1-458.4 deg s−1) expressed as a percentage of isometric force at the 74 deg thumb angle.
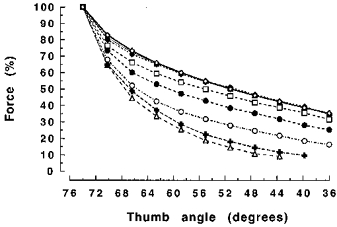
The symbols for 6.1, 9.5 and 19.1 deg s−1 coincide (⋄, the top trace). Others symbols denote forces as follows: □, 38.2 deg s−1; •, 76.4 deg s−1; ○, 152.8 deg s−1; ×, 305.6 deg s−1; ▵, 458.4 deg s−1.
DISCUSSION
Although shortening-induced deactivation has been well documented in isolated muscle and single fibre preparations, it has not been clear whether the phenomenon has any relevance to human muscles with a complex fibre structure working in situ and where their actions are transmitted through series elastic elements. Our results have shown, somewhat to our surprise, that the force deficit is not only present in human muscle but, possibly, is greater in extent than reported for isolated preparations, raising the possibility that the series elasticity has some responsibility for the phenomenon. Our results have also demonstrated that the mechanism responsible probably acts during shortening contractions and thus has a significant effect on the force-velocity characteristics of human muscle.
Force following shortening
In general, the maximal deficit of 37 ± 2 % encountered in the present study is large compared with the results from most single fibre studies. Gordon, Huxley & Julian (1966) reported a deficit of only a few per cent and Edman et al. (1993) observed a deficit of 25 % with fibres shortening from just above optimum to near slack length.
Angular displacement
An important factor contributing to the force deficit after isovelocity shortening was angular displacement (Fig. 4A). The positive linear relationships between angular displacement and force deficit (Fig. 5) are similar to observations made with in vitro preparations (Abbott & Aubert, 1952; Marèchal & Plaghki, 1979; Sugi & Tsuchiya, 1988).
Shortening velocity
Granzier & Pollack (1989), working with single frog fibres, found a significant correlation between the force deficit and the work done during shortening. They suggested that it was tension sustained during the shortening phase, rather than the shortening velocity per se, which determined the magnitude of the force deficit. This issue was addressed directly in the present study, reducing the force during shortening by about 25 % using 20 instead of 50 Hz stimulation. With the same shortening speed, the relative deficit was significantly less with 20 Hz stimulation (Table 1). Moreover 89 % of the variance in the ‘velocity-related’ deficit was explained by the difference in force sustained at the end of shortening (Fig. 6). These findings suggest that the critical factor was tension sustained during the shortening phase, rather than the shortening velocity per se.
Recovery of the deficit
Another interesting feature of the force deficit was that the deficit largely recovered if the stimulation was briefly interrupted and the muscle allowed to relax (Fig. 7). This behaviour has been observed with in vitro preparations (Abbott & Aubert, 1952; Julian & Morgan, 1979; Granzier & Pollack, 1989; Edman et al. 1993). The maximum recovery was seen with interruptions (> 200 ms) which allowed the force to fall to zero before recommencing stimulation. Such a rapid recovery is too fast for substantial metabolic recovery and the fact that it is coupled to muscle relaxation suggests that some mechanical (force related) factor plays an important role.
Possible mechanisms
Studies of shortening single fibres have shown that the force deficit is related to a non-uniformity of sarcomere lengths along the fibre (Julian & Morgan, 1979; Sugi & Tsuchiya, 1988; Granzier & Pollack, 1989). It has also been shown that after a short interruption of stimulation which largely abolished the deficit, a more uniform sarcomere pattern reappeared along the fibre (Granzier & Pollack, 1989; Edman et al. 1993). Moreover Edman et al. (1993) did not find a deficit after isovelocity shortening of a length-clamped fibre segment and they showed that during unloaded shortening, sarcomeres remained homogeneous and the deficit was absent.
The similarities between our findings for muscle in situ and the results of the earlier in vitro studies suggest that the deficit in the present study was caused by the same mechanism(s). Of the proposed mechanisms a shortening-induced sarcomere heterogeneity seems a good candidate and the rapid recovery of the deficit immediately following muscle relaxation would be consistent with a restoration of sarcomere homogeneity. The fact that the force deficit appears to be more pronounced in the intact muscle could be a function of the increased series elastic elements in series with the muscle in situ.
Force decline during shortening
The rapid force decline during the early phase of shortening (Figs 4A and 9) is seen in most preparations released from isometric into isokinetic contractions and is generally believed to be due to unloading of the series elastic elements. After this initial rapid fall, forces continued to decline linearly during the remainder of the shortening phase (Figs 4 and 9). Only at the highest velocities (305.6 and 458.4 deg s−1) was this linear phase of force decline absent (Fig. 9), and we assume that this was because the total duration of the contraction was so short that the component related to the series elastic elements dominated the whole contraction.
The muscle was operating on the plateau of a very flat length-tension relationship (Fig. 3) so that the force decline during shortening could not be explained by shortening of the muscle down the left-hand limb of the relationship. One explanation for the linear force decline could be that the mechanism responsible for the force deficit in the isometric phase following shortening (which is itself linearly related to displacement) was already operating during shortening. A comparison of the data in Figs 5 and 9 shows that for the intermediate velocities of shortening both the decline in force during shortening and the deficit of redeveloped force were linearly related to the distance shortened suggesting a common basic mechanism.
Effects of series elasticity
Since the force maintained by the muscle-tendon complex changes during the shortening contractions, it is important to consider whether the presence of the series elastic elements is responsible for the progressive loss of force which we report. As the force sustained by the whole muscle-tendon complex declines, the series elements will shorten to a length appropriate to the new force and consequently the contractile elements will be moving more slowly than the whole muscle tendon complex. Nevertheless, providing the shortening is steady and the relative compliance of the series and contractile elements remains the same, a constant force would be expected. If the compliance of the series elements were to change during shortening, then the proportion of the movement taken up by the contractile elements will alter, leading to a change in the force that can be sustained. However, it is likely that, if anything, the series compliance increases at shorter lengths. This will have the effect of reducing the velocity of the contractile elements and increasing the force, quite the opposite of what we see. It seems unlikely, therefore, that the presence of series compliance can account for the decrease in force seen during steady shortening. In addition, there is no reason to think that the series elements can account for the deficit of redeveloped isometric tension following a shortening contraction.
Practical implications
Our results have considerable practical importance in seeking to determine the force- velocity characteristics of complex muscles working in situ. The data obtained in the experiments as illustrated in Fig. 4A and B have been plotted in Fig. 10A with the force sustained at the end of shortening contractions of different lengths expressed as a percentage of the initial isometric force. With the exception of the higher velocities of shortening, there was a relatively linear decline in force as a function of the shortening distance. Consequently any force-velocity relationship derived from this data would be very dependent on the extent of shortening. If, as is suggested above, the decline in force during steady shortening is related to the deficit of isometric force seen after shortening, then it might be more appropriate to normalize the dynamic force by the redeveloped isometric tension and this is shown in Fig. 10B. Normalizing the data to the redeveloped force decreases the slope of the relationships between displacement and force, but does not make the relationships horizontal. This procedure still does not allow a force-velocity relationship to be established which is independent of the magnitude of the preceding excursion since the redeveloped force was somewhat greater than the apparent loss of force during the phase of steady shortening. Examining the time course of force redevelopment, as illustrated in Figs 4 and 6, it can be seen that the precise redeveloped force is a little difficult to identify since force approaches a plateau value relatively slowly when compared either with the development of force during the initial isometric phase or after a brief relaxation as seen in Fig. 7. In all the data manipulations described so far the highest value obtained at the end of the stimulation period has been used, but it can be seen that if an earlier time point had been used a lower value of force would have been obtained and this, in turn, would have flattened the relationships shown in Fig. 10B. In other words, it would appear that a degree of recovery was occurring during the isometric phase following shortening, possibly as a result of readjustment of sarcomere lengths within the muscle.
Figure 10. Dynamic force at the end of shortening contractions of different angular displacements and velocities.

A, dynamic forces at the end of the shortening phase are expressed as a percentage of the isometric force immediately before shortening. B, dynamic forces at the end of the shortening phase are expressed as a percentage of the redeveloped isometric force. All contractions ended at a 36 deg thumb angle. Forces at different shortening velocities are denoted by the different symbols as follows: ▴, 9.5 deg s−1; □, 38.2 deg s−1; •, 76.4 deg s−1; ○, 152.8 deg s−1; ▵, 458.4 deg s−1.
In conclusion, the present study clearly demonstrates that the force-generating capacity of human adductor pollicis muscle is significantly reduced following a single isovelocity shortening contraction. This force deficit is positively correlated with angular displacement of the thumb and with the level of force during the shortening phase. Given the very rapid recovery of the deficit after muscle relaxation, it is unlikely that metabolic changes are an important underlying factor of the deficit. The existence of the shortening-induced force deficit is therefore one of the factors which complicates the measurement of force- velocity characteristics in human muscles in situ.
References
- Abbott BC, Aubert XM. The force exerted by active striated muscle during and after change of length. The Journal of Physiology. 1952;117:77–86. [PMC free article] [PubMed] [Google Scholar]
- De Haan A, Jones DA, Sargeant AJ. Changes in velocity of shortening, power output and relaxation rate during fatigue of rat medial gastrocnemius muscle. Pflügers Archiv. 1989;413:422–428. doi: 10.1007/BF00584493. [DOI] [PubMed] [Google Scholar]
- De Ruiter CJ, De Haan A, Sargeant AJ. Physiological characteristics of two extreme muscle compartments in gastrocnemius medialis of the anaesthetized rat. Acta Physiologica Scandinavica. 1995;153:313–324. doi: 10.1111/j.1748-1716.1995.tb09869.x. [DOI] [PubMed] [Google Scholar]
- Edman KAP, Caputo C, Lou F. Depression of tetanic force induced by loaded shortening of frog fibres. The Journal of Physiology. 1993;466:535–552. [PMC free article] [PubMed] [Google Scholar]
- Gordon AM, Huxley AF, Julian FJ. The variation in isometric tension with sarcomere length in vertebrate muscle fibres. The Journal of Physiology. 1966;184:170–192. doi: 10.1113/jphysiol.1966.sp007909. [DOI] [PMC free article] [PubMed] [Google Scholar]
- Granzier HLM, Pollack GH. Effect of active pre-shortening on isometric and isotonic performance of single frog muscle fibres. The Journal of Physiology. 1989;415:299–327. doi: 10.1113/jphysiol.1989.sp017723. [DOI] [PMC free article] [PubMed] [Google Scholar]
- Joyce GC, Rack PMH. Isotonic lengthening and shortening movements of cat soleus muscle. The Journal of Physiology. 1969;204:475–491. doi: 10.1113/jphysiol.1969.sp008925. [DOI] [PMC free article] [PubMed] [Google Scholar]
- Joyce GC, Rack PMH, Westbury DR. The mechanical properties of cat soleus muscle during controlled lengthening and shortening movements. The Journal of Physiology. 1969;204:461–474. doi: 10.1113/jphysiol.1969.sp008924. [DOI] [PMC free article] [PubMed] [Google Scholar]
- Julian FJ, Morgan DL. The effect on tension of non-uniform distribution of length changes applied to frog muscle fibres. The Journal of Physiology. 1979;293:379–392. doi: 10.1113/jphysiol.1979.sp012895. [DOI] [PMC free article] [PubMed] [Google Scholar]
- Maréchal G, Plaghki L. The deficit of the isometric tetanic tension redeveloped after a release of frog muscle at a constant velocity. Journal of General Physiology. 1979;73:453–467. doi: 10.1085/jgp.73.4.453. [DOI] [PMC free article] [PubMed] [Google Scholar]
- Sugi H, Tsuchiya T. Stiffness changes during enhancement and deficit of isometric force by slow length changes in frog skeletal muscle fibres. The Journal of Physiology. 1988;407:215–229. doi: 10.1113/jphysiol.1988.sp017411. [DOI] [PMC free article] [PubMed] [Google Scholar]