

Abstract
5-HT3 receptor-mediated ion current was recorded from NCB-20 neuroblastoma cells using the whole-cell patch-clamp technique. Rapid drug superfusion was used to study the mechanism of alcohol potentiation of 5-HT3 receptor function and to analyse effects of alcohols on receptor-channel kinetics in detail.
Trichloroethanol (TCEt) increased in a dose-dependent way the initial slope, 20–80 % rise time and measured desensitization rate of the current induced by low concentrations (1–2 μm) of 5-HT. Ethanol (EtOH) and butanol (ButOH) had similar effects on the 5-HT3 receptor-induced current.
TCEt and ButOH decreased the measured desensitization rate of current induced by 10 μm 5-HT, a maximally effective concentration of agonist. These alcohols also increased the relative amplitude of steady state to peak current induced by 2 or 10 μm 5-HT, indicating a possible decrease in the intrinsic rate of desensitization.
TCEt also decreased the deactivation rate of the current activated by 2 μm 5-HT after a short pulse of agonist application.
Current sweeps generated by 1 μm 5-HT in the presence or absence of 10 mm TCEt or 100 mm EtOH were well fitted using a modified standard kinetic model derived from the nicotinic acetylcholine receptor. This analysis indicated that potentiation by alcohols could be accounted for by increases in the association rate constant coupled with decreases in the dissociation and desensitization rate constants.
This study suggests that alcohols potentiate 5-HT3 receptor-mediated current by both increasing the rate of channel activation and stabilizing the open state by decreasing the rates of channel deactivation and desensitization.
The profound effects of ethanol (EtOH) on the normal behaviour of humans have been known for centuries (Anstie, 1870), yet the mechanism through which these effects occur remains poorly understood. In the past decade, ligand-gated neuronal ion channels have been shown to be promising candidate targets for EtOH actions (Harris, Mihic, Dildy-Mayfield & Machu, 1995). Since postsynaptic ion channels are sensitive to EtOH at clinically relevant concentrations (≤ 100 mm), it is likely that the actions of EtOH on these receptor-channel complexes may underlie some aspects of alcohol intoxication and abuse.
It has been demonstrated that 5-HT3 receptors modulate extracellular dopamine levels in the nucleus accumbens (Costall & Naylor, 1992). Dopamine levels in this nucleus are considered critical in reward mechanisms of abused drugs, including alcohol. Specific 5-HT3 receptor antagonists are able to reduce voluntary ethanol consumption in both animal models and humans (Fadda, Garua, Marchei, Colombo & Gessa, 1991; Johnson, Campling, Griffiths & Cowen, 1993; Sellers, Tonetto, Romach, Somer, Sobell & Sobell, 1994). Hence, the 5-HT3 receptor-channel may be involved in alcohol intoxication and abuse. Therefore, it is important to understand how alcohol potentiates the function of the 5-HT3 receptor.
Generally, alcohols enhance the function of GABAA, glycine, 5-HT3 and muscle-type nicotinic acetylcholine (nACh) receptors, which all belong to a family of ligand-gated ion channels (Harris et al. 1995; Grant, 1995). These effects are observed at concentrations that produce intoxication or anaesthesia in experimental animals and humans. The effects of alcohols on these receptors share many common features. First, the agonist concentration-response curves for all of these receptors are shifted parallel to the left in the presence of low concentrations of ethanol (Nakahiro, Arakawa & Narahashi, 1991; Lovinger & Zhou, 1993; Kurata, Marszalec, Hamilton, Carter & Narahashi, 1993; Mascia, Machu & Harris, 1996). Consequently, alcohols markedly increase current mediated by low agonist concentrations, while currents evoked by saturating agonist concentrations are unaffected (Zhou & Lovinger, 1996). Second, in addition to the enhancing effect, alcohols increase the measured desensitization rates of current through all of these receptor–channels. Since the structure of the proteins and the effect of the alcohols are similar, a common mechanism may underlie alcohol actions on the muscle-type nACh, GABAA, glycine and 5-HT3 receptors. The effect of long chain alcohols on the muscle-type nACh receptor function is different from that of ethanol. Long chain alcohols inhibit the nACh receptor-channel-mediated current through a channel blocking mechanism possibly involving an alcohol binding site in the ion pore (Forman, Miller & Yellen, 1995).
Several possible mechanisms may explain how alcohols shift the agonist concentration-response curve to the left without altering the amplitude of maximum current. One obvious explanation is that alcohols increase the rate of channel activation. Slowing of desensitization by alcohols may also left-shift the agonist concentration-response curve. Miller and coworkers used a partial agonist, suberyldicholine, to show that EtOH stabilizes the open state of the Torpedo nACh receptor-channel (Wu, Tonner & Miller, 1993). Other mechanisms also may explain alcohol effects on current mediated by these ligand-gated ion channels. For example, one of butanol's effects on the muscle nACh receptor was found to be due to increased rate of channel opening (Liu, Dilger & Vidal, 1994).
The mechanism through which alcohols exert potentiating effects on the 5-HT3 receptor function is still unknown. It has been speculated that alcohols may increase agonist affinity for the receptor as is the case for muscle-type nACh receptors. However, binding studies performed in NCB-20 cells demonstrated that ethanol had no effect on the agonist or antagonist affinity (Hellevuo, Hoffman & Tabakoff, 1991). Since equilibrium ligand binding experiments are usually performed over a period of seconds, the ligand affinity for receptors mainly reflects affinity for receptors in the desensitized states (Bartrup & Newberry, 1996). For this and other reasons, the ligand binding technique also cannot distinguish drug effects on binding and gating (Colquhoun & Farrant, 1993). Therefore, closer examination of drug effects on channel kinetics is needed.
To date, detailed kinetic analysis of alcohol actions on the 5-HT3 receptor-channel has not been performed. The low single channel conductance of 5-HT3 receptors (< 1 pS; Jackson & Yakel, 1995) makes single channel kinetic studies difficult in NCB-20 cells. Thus, we turned to measuring the macroscopic kinetics of this receptor-channel complex using whole-cell patch-clamp recording. In this study, we used rapid drug application techniques to examine mechanisms that may underlie the potentiating effect of alcohol on the 5-HT3 receptor in NCB-20 neuroblastoma cells by measuring changes in receptor-channel kinetics in the presence of alcohols and estimating changes in kinetic parameters from fits using a two identical ligand-binding-site ligand-gated ion channel kinetic model.
METHODS
Cell culture
NCB-20 cell suspensions were rapidly thawed in a heated water bath (35°C), and cells were then plated onto 75 cm2 culture flasks. Cells were grown in culture flasks using previously described techniques (Lovinger, 1991). The cells were plated on 35 mm culture dishes at least 2 days before experiments were performed.
Electrophysiology
Channel function was measured at room temperature (21–23°C, stable within 0.5°C during any given day) by patch-clamp electrophysiology in the whole-cell configuration. The growth medium was replaced by an external solution consisting of (mm): 150 NaCl, 2.5 KCl, 2.5 CaCl2, 1.0 MgCl2, 10 Hepes and 10 glucose; pH was adjusted to 7.4 with NaOH and osmolality to 340 mosmol kg−1 with sucrose. Patch electrodes were filled with internal CsCl solution consisting of (mm): 140 CsCl, 10 CsEGTA and 10 Hepes; pH was adjusted to 7.4 with CsOH and osmolality to 310 mosmol kg−1 with sucrose. 2,2,2-Trichloroethanol (TCEt; > 99 % pure) and 1-butanol (99.9 % pure) were purchased from Aldrich Chemical Co. and Fisher Scientific, respectively. Ethanol at 190 proof (95 %) from AAPER Alcohol and Chemical Co. (Shelbyville, KY, USA) and at 200 proof from McCormick Distilling Co. (Weston, MO, USA) were used with no observable difference in their effects.
Alcohols and agonists were rapidly applied to cells using a piezoelectric-driven θ-tubing pipette with gravity-driven solution superfusion. After establishing a whole-cell recording, cells were lifted clear of the bottom of the culture dish and placed in front of one side of the θ-tubing pipette, which extruded control solution. During the experiment, cells were continuously perfused with normal external solution with or without alcohols from one side of the θ-tubing, while through the other side of the θ-tubing pipette flowed agonist-containing solution with or without alcohols. The solution bathing the cell was exchanged by rapidly moving the θ-tubing pipette laterally with a piezo-electric manipulator so that the agonist-containing side faced the cell.
The time required for complete solution exchange was usually 10 ms in the open pipette tip configuration. In the open-tip configuration, the solution exchange time was determined by measuring the time required to change current induced by rapid switching of the superfusion pipette facing the cell from one containing normal external solution to one containing 50 % (v/v) normal external solution. In the whole-cell configuration, measurement of the solution exchange time was more complicated, and was estimated by switching rapidly from normal extracellular solution to one containing N-methyl-D-glucamine (NMG, an impermeant ion) as the sole external cation. This was done in the continuous presence of 5-HT + 5-hydroxyindole (5-OHI) so that the change in Na+ ion driving force generated a current that was completely dependent on the solution change kinetics. The 5-OHI is used to slow the channel desensitization of the 5-HT3 receptor (Kooyman, Hoof & Vijverberg, 1993). The time course of this current decay, 20–40 ms depending primarily on the size of the cell, associated with the change to NMG solution reflects the speed of the solution exchange under the whole-cell patch-clamp condition.
Solutions flowing through either the control or agonist side of the θ-tubing pipette were changed upstream by opening or closing two-way stopcocks. Alcohols and agonist were dissolved directly into normal external solution. Currents were measured using an Axopatch 200 amplifier (Axon Instruments), filtered at 500 or 1000 Hz (-3 dB) using an eight-pole Bessel filter (Frequency Devices, Haverhill, MA, USA) and digitized on-line at 1 kHz with an ITC-16 analog/digital interface and a Macintosh-IIfx computer (Verdoorn, 1994). Recording electrodes were constructed from thin-walled borosilicate glass (1.5 mm diameter, World Precision Instruments Inc., Sarasota, FL, USA) using a horizontal puller (Sutter Instrument Co., model P-87, Novato, CA, USA) or a vertical puller (Adams-List, model LIM-3P-A, Great Neck, NY, USA). The series resistance during recordings ranged from 2 to 10 MΩ and was compensated using the prediction and correction circuits of the amplifier (setting 65–75 %). All of the experiments described below were performed under voltage clamp with the membrane potential held at -60 mV.
Data analysis, simulation and modelling
Current records were analysed off-line using IGOR (Wavemetrics Inc., Lake Oswego, OR, USA). Peak current amplitude was measured as the difference between current at a time point just prior to agonist application and at the point at which inward current was maximal. The 20–80 % rise time was defined as the time the current took to rise from 20 % to 80 % of the peak current, which is a rough measurement of the speed of channel activation. Another more accurate measurement of the rate of channel activation is the initial slope at the beginning of the current activation phase. We estimated this initial current slope using current at 10–20 % of maximum over time (I10–20 %/t10–20 %) to avoid the sigmoid foot of the current. Current decay in the continuous presence of agonist + drug was used as a measure of the rate of apparent channel desensitization. Decay times were estimated from fitting a single exponential function to the decay phase of the current beginning just after the current peak. Current decay following removal of agonist was also estimated from fitting with a single exponential function beginning just after agonist removal. The recovery curve of current after long TCEt exposure was also fitted using a single exponential function. All averaged measurements are expressed as means ± s.e.m. Graphs were drawn and curves were fitted with uniform data weighting using commercially available software which employs a minimizing algorithm based on a least-squares method (Prism, GraphPad Software, San Diego, CA, USA). Statistical comparisons were made using Statview II (Abacus Concepts Inc., Berkeley, CA, USA). Simulations were done with Matlab 4.0 (The MathWorks, Inc., Natick, MA, USA) using the Q-matrix method (Colquhoun & Hawkes, 1995) on a Dell computer (Dimension XPS p100c).
5-HT3 receptor-channel-mediated currents in the presence or absence of alcohols were fitted using a modified standard kinetic model (model 1) with the Global Analysis program written by Dr Joseph Beechem (Molecular Physiology and Biophysics Department, Vanderbilt University School of Medicine, Nashville, TN, USA; Beechem, 1992). This program employs a Marquardt-Levenberg non-linear least-squares method to fit data based on a specified kinetic model and obtain the best estimated transition rate constants by minimizing the χ2 value calculated from the difference between the observed data and model-generated values.
Model 1.
RESULTS
The initial slope of the current increases with increasing concentrations of either alcohol or agonist
We first examined alcohol actions on the activation process of the receptor by measuring the initial slope of 5-HT3 receptor-mediated current. As expected, the initial slope of the current was significantly steeper when higher concentrations of agonist were used (Fig. 1). Overall, initial slopes of currents activated by 2, 3 and 4 μm 5-HT were 4.5 ± 1.6, 18 ± 4.9 and 23.5 ± 8.2 % of that induced by 10 μm 5-HT, a maximally effective concentration of agonist (n = 3 cells). When 1–10 mm TCEt was coapplied with 2 μm 5-HT, the initial slope of the current also dramatically increased in a TCEt dose-dependent manner as summarized in Fig. 1B. We also observed that 10 mm TCEt shifted the agonist dose-response curves parallel to the left as shown in Fig. 2.
Figure 1. TCEt increases the speed of channel activation.
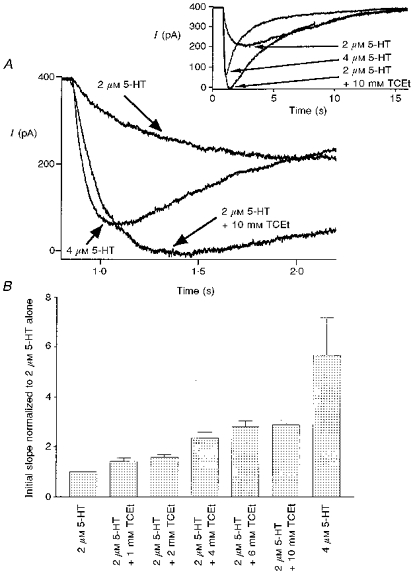
A, examples of current sweeps activated by 2 μm 5-HT, 4 μm 5-HT and 2 μm 5-HT + 10 mm TCEt. The inset contains the entire time course of current, whereas the main figure shows expanded time base records to emphasize the activation phase of current. B, initial slope of current induced by 2 μm 5-HT, 4 μm 5-HT and 2 μm 5-HT + 1 to 10 mm TCEt (n = 2–4 cells).
Figure 2. TCEt shifts the 5-HT concentration-response curve parallel to the left.
Concentration-response curve for 5-HT in the presence and absence of 10 mm TCEt. All measurements were made at current peak and normalized to current activated by 10 μm 5-HT from the same cell. •, 5-HT alone; ○, 5-HT + TCEt. The 5-HT concentration-response curves in the presence or absence of 10 mm TCEt were best fitted with EC50 values of 1.00 ± 0.01 μm and 3.09 ± 0.2 μm, respectively, and Hill slopes of 2.44 ± 0.19 and 2.76 ± 0.46, respectively (the square of the correlation coefficient, r2 = 0.9995 for 5-HT + TCEt and 0.993 for 5-HT alone). n = 4 cells for 1, 2, 4 and 10 μm 5-HT alone; n = 3, 3, 3, 2 cells for 1, 2, 4 and 10 μm 5-HT + 10 mm TCEt, respectively.
One interesting observation made during these experiments was that on average 4 μm 5-HT generated current with an amplitude that was only about 80 ± 9 % (n = 4 cells) of that induced by 2 μm 5-HT + 10 mm TCEt. However, the initial slope of the current in the presence of 4 μm 5-HT was roughly twice as steep as that in the presence of 2 μm 5-HT + 10 mm TCEt (see Fig. 1A and B). The initial slope (normalized to 2 μm 5-HT alone) was 5.70 ± 1.04 in the presence of 4 μm 5-HT (n = 6), and 2.90 ± 0.23 in the presence of 2 μm 5-HT + 10 mm TCEt (n = 4). A clear example of this observation is shown in Fig. 1A. The amplitude of the peak current, normalized to maximal response to a saturating agonist concentration, is heavily influenced by the rates of channel activation, closing and desensitization. A strong correlation between activation rate and the normalized amplitude of peak current is expected if both closing and desensitization rates are unchanged. However, as stated above, such a correlation was not observed during TCEt exposure. These data suggested that the potentiating effect of the alcohol on normalized peak current could not be fully explained by an increase in the rate of channel activation.
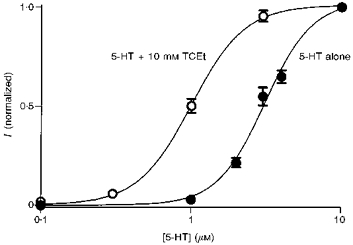
Although EtOH was less efficacious and less potent than TCEt, it had similar effects on the kinetics of the 5-HT3 receptor (Fig. 3). EtOH (100 mm) increased the peak amplitude of 1 μm 5-HT-activated current by 168 ± 43 % (n = 7 cells). This potentiating effect of ethanol declined as 5-HT concentration increased from 1 to 4 μm (potentiation at 4 μm 5-HT + 100 mm EtOH = 5 ± 3 %, n = 8 cells; Table 1). The initial slope of the current induced by 1 μm 5-HT was increased by 262 ± 56 % upon coapplication of 100 mm EtOH (n = 11 cells) and the effect decreased to 55 ± 18 % (n = 10 cells) in the presence of 2 μm 5-HT (Fig. 3 and Table 1).
Figure 3. Ethanol effects on the function of 5-HT3 receptors.
A, ethanol (100 mm) effect on the amplitude of the peak current induced by 1–4 μm 5-HT (n = 7–8 cells). The inset contains typical sweeps induced by 2 μm 5-HT ± 100 mm ethanol. B, ethanol (100 mm) effect on the initial slope of the current induced by 1 or 2 μm 5-HT (n = 11 cells). C, ethanol (100 mm) effect on the 20–80 % rise time of current induced by 1–3 μm 5-HT (n = 3, 8, and 8 cells for 1, 2, and 3 μm 5-HT, respectively). D, ethanol (100 mm) effect on the measured desensitization rate of the current induced by 2 and 3 μm 5-HT (n = 8 cells). All measurements in the presence of 100 mm EtOH were normalized to the same measurements on the same cell in the absence of EtOH. * Statistically significant difference relative to control at the 95 % confidence level; paired two-tailed Student's t test.
Table 1.
Effects of ethanol (100 mm) on 5-HT receptor-channel functions
| 1 μm 5-HT | 2 μm 5-HT | 3 μm 5-HT | ||
|---|---|---|---|---|
| Ipeak (pA) | Control | 37.9 ± 14.7 | 179 ± 77.5 | 346 ± 154 |
| EtOH | 119 ± 63.5 | 251 ± 126 | 386 ± 166 | |
| Initial slope (pA s−1) | Control | 45.5 ± 35 | 760 ± 390 | n.d. |
| EtOH | 243 ± 195 | 810 ± 540 | n.d. | |
| t20–80% (s) | Control | 1.42 ± 0.193 | 0.422 ± 0.05 | 0.124 ± 0.01 |
| EtOH | 1.12 ± 0.23 | 0.356 ± 0.048 | 0.128 ± 0.01 | |
| kdesensitization (s−1) | Control | n.d. | 0.204 ± 0.037 | 0.807 ± 0.051 |
| EtOH | n.d. | 0.364 ± 0.054 | 0.877 ± 0.077 |
Data are means ± s.e.m. The different parameters were measured in different groups of cells, and for each parameter the control and EtOH effects were measured in the same groups of cells.
Another less sensitive, but commonly used, method to quantify the rate of activation is to measure the onset time of the current. We measured the 20–80 % rise time. EtOH (100 mm) and TCEt (10 mm) shortened the 20–80 % rise time and the effect diminished with increasing agonist concentration as shown in Figs 3 and 4 and summarized in Tables 1 and 2 (for 1, 2 and 3 μm 5-HT in Fig. 3C; n = 3, 8, and 8 cells, respectively).
Figure 4. Alcohol effects on responses to 2 μm 5-HT.
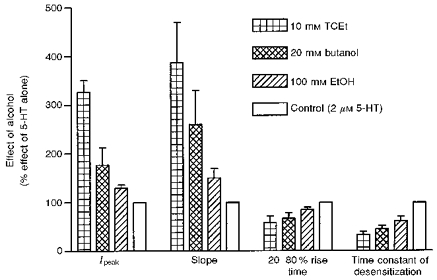
All measurements were normalized to those of 2 μm 5-HT alone. Ipeak, amplitude of the peak current; slope, the initial slope of the current; n = 4–11 cells.
Table 2.
Effects of TCEt (10 mm) on 5-HT receptor-channel functions
| 1 μm 5-HT | 2 μm 5-HT | 3 μm 5-HT | ||
|---|---|---|---|---|
| Ipeak (pA) | Control | 6 ± 2.7 | 34.5 ± 11 | 188 ± 63 |
| TCEt | 98 ± 31 | 126 ± 40 | 197 ± 66 | |
| Initial slope (pA s−1) | Control | 45.5 ± 35 | 760 ± 390 | n.d. |
| TCEt | n.d. | 5000 ± 2000 | n.d. | |
| t20–80% (s) | Control | 1.42 ± 0.193 | 0.422 ± 0.05 | n.d. |
| TCEt | n.d. | 0.095 ± 0.007 | n.d. | |
| kdesensitization (s−1) | Control | n.d. | 0.204 ± 0.037 | 0.90 ± 0.17 |
| TCEt | n.d. | 0.95 ± 0.22 | 0.55 ± 0.07 |
Data are means ± s.e.m. The different parameters were measured in different groups of cells, and for each parameter the control and TCEt effects were measured in the same groups of cells.
Consistent with earlier reports (Lovinger, 1991; Lovinger & Zhou, 1993), EtOH and TCEt also increased the measured desensitization rate of current at low agonist concentrations as shown in Figs 3 and 4 (also see Tables 1 and 2). This has been routinely taken as evidence that alcohols facilitate the desensitization process of the receptor. However, this interpretation of the data may be incorrect under certain conditions, as demonstrated below.
Figure 4 summarizes the effects of different alcohols on 2 μm 5-HT-activated current. Maximally effective concentrations, 10, 20 and 100 mm for TCEt, butanol (ButOH) and EtOH, respectively, were used in this set of experiments. All alcohols examined here had similar effects on the kinetics of 5-HT3 receptors, although TCEt, ButOH and EtOH differed in their efficacy. This strongly suggests that a common mechanism may underlie some effects of these alcohols on 5-HT3 receptors. Since TCEt is the active metabolite of a general anaesthetic, chloral hydrate, as well as the most efficacious alcohol among this group, we concentrated on testing the effects of TCEt, a model alcohol, and then attempted to determine if other alcohols had similar effects.
TCEt and ButOH slow the transition from open to desensitized state(s)
As previously demonstrated, at high agonist concentrations, alcohols do not potentiate peak ion current (Lovinger & White, 1991). However, in the presence of 10 μm 5-HT, TCEt at 3 and 10 mm clearly slowed the measured desensitization rate of the current as shown in Fig. 5A and Table 2. The measured desensitization rate in the presence of 3 mm TCEt was different from that in its absence (kdesensitization: 10 μm 5-HT, 0.94 ± 0.18 s−1; 10 μm 5-HT + 3 mm TCEt, 0.53 ± 0.08 s−1; P = 0.02, paired two-tailed Student's t test; n = 6 cells), while the peak amplitude of the current was almost identical under both conditions (I5-HT/I5-HT + 3 mmTCEt = 1.01 ± 0.06; P = 0.522, paired two-tailed t test; n = 6 cells). In contrast to the common observation that alcohols increase the measured channel desensitization rate, here TCEt actually slowed this rate, perhaps indicating a decrease in the intrinsic desensitization process. Exposure to 20 mm ButOH also decreased the measured desensitization rate (k5-HT + 20 mmButOH/k5-HT = 0.84 ± 0.03; P = 0.003, paired two-tailed t test; n = 6 cells) without affecting the amplitude of the peak current induced by 10 μm 5-HT (I5-HT/I5-HT + 20 mmButOH = 1.05 ± 0.05; P = 0.23, paired two-tailed t test). However, we failed to observe any change in measured desensitization rate in response to 10 μm 5-HT in the presence of 100 mm EtOH.
Figure 5. TCEt slows the desensitization of 5-HT3 receptors.
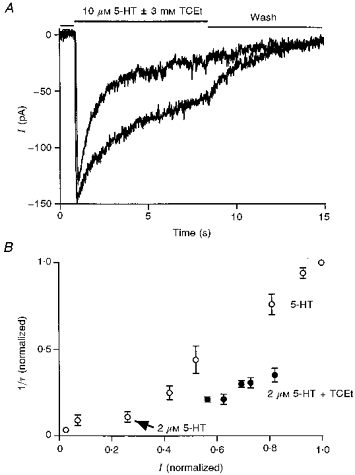
A, two representative current records in the presence of 10 μm 5-HT with or without 3 mm TCEt. TCEt clearly slowed the decay rate in the continuous presence of this high agonist concentration. B, I (normalized) and 1/τ (normalized) were calculated by dividing the amplitude of the peak current or the decay rate of the current activated by the indicated concentration of 5-HT by the same measures made for responses to 40 μm 5-HT. ○, current generated by 5-HT alone; •, current induced by 2 μm 5-HT in the presence of 1, 2, 4, 6 and 10 mm TCEt.
The measured desensitization rate depends on the open probability or the percentage of receptors in the open state at the peak of the response and thus varies with the concentration of agonist used to evoke the response. Simple models of channel kinetics predict that the measured desensitization rate increases nearly proportionally to the amplitude of the normalized peak current, or the apparent open probability at the peak response, without a change in the intrinsic rate of receptor desensitization (see Discussion for simulation). The measured desensitization rate increased proportionally to the normalized amplitude of the peak current activated by different concentrations of 5-HT as predicted by a simple channel kinetic model (Fig. 5B, open circles, n = 4 cells). In the presence of 2 μm 5-HT, TCEt (1–10 mm) increased both the amplitude of the peak current and the measured desensitization rate in a dose-dependent manner as previously reported (Fig. 5B, filled circles, n = 5 cells). However the magnitude of the change in the measured desensitization rate in the presence of TCEt was smaller than that expected if the alcohol effect was solely due to the increase in the normalized peak current. The magnitude of the increase in measured desensitization rate was only about half of the magnitude of the increase in the normalized peak current in the presence of TCEt (1–10 mm; Fig. 5B). The most plausible explanation for this result is that TCEt not only increases the rate of channel activation so that it potentiates the normalized peak current, as shown above, but also slows the intrinsic desensitization of the receptor.
TCEt stabilizes the open channel state
To examine alcohol effects on the rate of deactivation, a brief agonist or agonist + TCEt application (100 ms) was immediately followed by exposure to normal external solution with or without 3 mm TCEt. As shown in Fig. 6A, the presence of TCEt in the wash phase prolonged the duration of inward current. On average, the exponential current decay rates after cessation of a brief application of 2 μm 5-HT were 1.56 ± 0.21 s−1 in normal external wash and 0.63 ± 0.09 s−1 when 3 mm TCEt was present (n = 5 cells). A similar effect was observed when the current was induced by brief perfusion of 2 μm 5-HT + 3 mm TCEt (kwash = 2.25 ± 0.23 s−1, kwash + 3 mmTCEt = 1.04 ± 0.24 s−1, P = 0.003, paired two-tailed t test; n = 5 cells). To test further the idea that TCEt reduces the rate of channel closing, a longer agonist application protocol was used. Again, TCEt (3 mm) dramatically slowed the current decay during the wash phase (n = 5 cells). One typical example of this experiment is shown in Fig. 6B. Interestingly, ButOH (20 mm) and EtOH (100 mm) did not produce detectable effects on the deactivation rate of current when present during the wash phase.
Figure 6. TCEt stabilizes the open state of the receptor-channel.
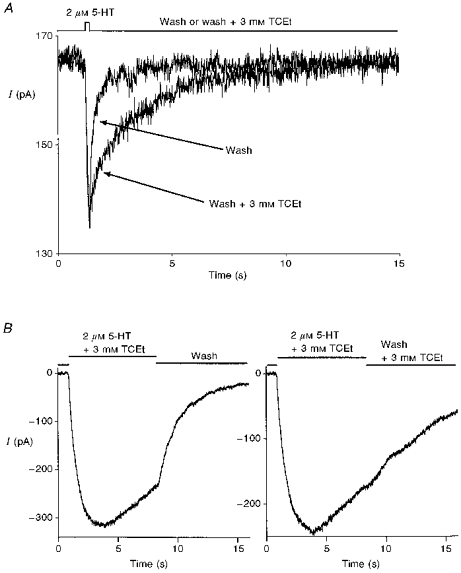
A, a brief (100 ms) application of 2 μm 5-HT was followed by either wash or wash + 3 mm TCEt for 3 s. TCEt (3 mm) in the wash phase significantly prolonged the decay of current. B, the presence of 3 mm TCEt in the wash phase profoundly slowed the decay rate of the current following an 8 s 2 μm 5-HT + 3 mm TCEt application.
TCEt decreases the magnitude of desensitization
Long agonist exposure results in a pronounced desensitization of the 5-HT3 receptor. If alcohols decrease the rate of desensitization, they may also decrease the magnitude of desensitization, which can be measured as the amplitude of steady-state current. The amplitude of steady-state current induced by 2 or 10 μm 5-HT after desensitization was only 5 ± 1 % of that of maximum peak current observed in five cells. Figure 7 shows that 3 mm TCEt significantly increased the steady-state current by 70 ± 21 % (P = 0.02, paired two-tailed t test, n = 5 cells). Similar results were obtained when 20 mm ButOH was used (potentiation = 78 ± 9 %, P = 0.02, paired two-tailed t test, n = 6 cells). Usually, an increase in the level of steady-state current suggests an increase in the channel open probability at equilibrium. These results are consistent with the interpretation that alcohols decrease the rate of channel desensitization without a compensatory change in the rate of channel resensitization, and thus alcohols favour the open state over the desensitized state.
Figure 7. TCEt and ButOH increase steady-state current.
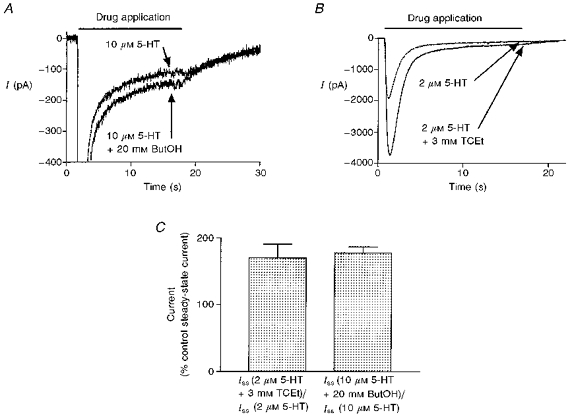
A, representative sweeps of current activated by 10 μm 5-HT in the absence or presence of 20 mm ButOH. The current trace has been expanded to highlight steady-state current while peak current is not shown. B, representative sweeps activated by 2 μm 5-HT + 3 mm TCEt. C, the presence of 3 mm TCEt and 20 mm ButOH increased the amplitude of the steady-state currents (Iss) generated by prolonged application of 2 and 10 μm 5-HT, respectively (P < 0.02 for both cases, two-tailed paired t test; n = 5 cells for TCEt and 6 cells for ButOH).
One prediction that can be made in light of this interpretation is that channel reopenings from desensitized states should be observed when switching from agonist alone to TCEt + wash. Indeed, such a result was observed. One example of such an experiment is shown in Fig. 8. The channel reopening, evidenced as a tail current, could clearly be observed in 3 out of the 5 cells we examined upon wash in 3 mm TCEt after an 8 s, 2 μm 5-HT application. Two additional cells exhibited a slight increase in current after switching the perfusing solution from agonist to TCEt, indicating some degree of channel reopening. These data support the idea that alcohol treatment tilts the balance toward the open state of the receptor-channel.
Figure 8. TCEt favours the open channel state.
A, representative current showing the normal decay during the wash phase. B, representative response from the same cell as in A, showing a tail current after switching from 8 s of 2 μm 5-HT application to 3 mm TCEt. Similar results were obtained in 3 out of 5 cells. A slight increase in the whole-cell conductance was observed in the remaining two cells upon perfusion of wash + 3 mm TCEt after prolonged agonist treatment.
TCEt does not alter recovery from desensitization
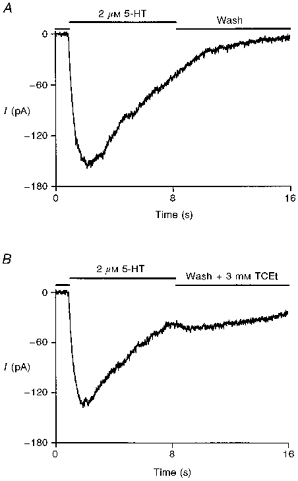
We next examined the effect of TCEt on the recovery time of the receptor after prolonged agonist exposure. Cells were exposed to 2 μm 5-HT or 2 μm 5-HT + TCEt for up to 20 s to ensure complete desensitization. Following different duration washes with normal external solution, the cells were again exposed to the same concentrations of agonist or agonist + TCEt. The amplitude of the peak current after different wash durations was measured and normalized to that observed during the first drug exposure. The recovery curve was plotted as a percentage of control peak current as a function of wash time. As shown in Fig. 9, the recovery curves in the presence or absence of TCEt are almost identical (recovery rate: 0.073 ± 0.013 s−1 for 2 μm 5-HT + 3 mm TCEt and 0.054 ± 0.023 s−1 for 2 μm 5-HT; fitted using a single exponential function; n = 3 cells). This is consistent with the idea that the desensitized states induced by agonist are the same in the absence or presence of TCEt.
Figure 9. TCEt does not alter recovery from desensitization.
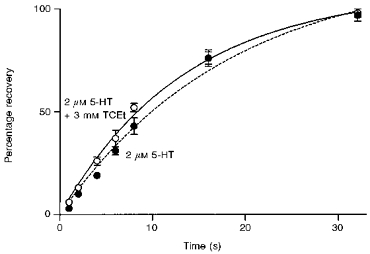
Prolonged exposure to 2 μm 5-HT + 3 mm TCEt (•) resulted in a pronounced desensitization which recovered at the same rate as that induced by 2 μm 5-HT alone (○). The two recovery curves could be fitted with single exponential functions.
Kinetic modelling of the effect of alcohol actions on the function of 5-HT3 receptors
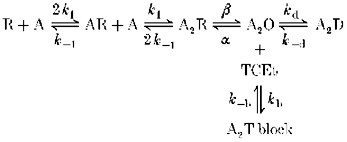
We further characterized alcohol effects on the kinetics of the 5-HT3 receptor by fitting experimental data using a modified standard ligand-gated channel kinetic model. Since 5-HT3 receptors belong to a superfamily of ligand-gated ion channels that includes GABAA, glycine and nACh receptors, a standard identical binding sites kinetic scheme (model 1) was used for nACh receptor function, consisting of the three major steps of sequential agonist binding, channel opening and channel desensitization.
In this model, R, AR, A2R and A are the free receptor, monoliganded closed receptor, doubly liganded closed receptor and agonist, respectively. A2O and A2D represent the open and desensitized channel states, respectively. An additional blocked state (A2T block) was included in the model to account for the TCEt blocking effect at high drug concentrations. The constants k1 and k-1 are the receptor association (or binding) and dissociation (unbinding) rate constants, while β and α are the receptor opening and closing rate constants, and kd and k-d are the desensitization and resensitization rate constants. Finally, kb and k-b are the blocking and unblocking rate constants. All receptors are assumed to reside in the resting closed state (R) prior to agonist application. When fitting the current sweeps activated by agonist alone or agonist plus EtOH, the concentration of TCEt was simply assumed to be zero. During the wash phase after drug application, the concentrations of both agonist and TCEt were set at zero.
Current sweeps from five different cells activated by either 1 μm 5-HT or 1 μm 5-HT + 10 mm TCEt were separately fitted using kinetic model 1 and the modified Global Analysis program. All sweeps consisted of a 1 s baseline period and an 8 s drug application followed by an 8 s wash phase. Nearly perfect fits were obtained for 3 out of the 5 cells and the remainder were also fitted reasonably well with this kinetic model. One example of such a fit is shown in Fig. 10A. The grey lines represent current sweeps from the cell and the continuous lines are the fits to the data. Figure 10B summarizes the estimated changes in different transition rate constants in the presence of 10 mm TCEt from five different cells. The receptor activation rate constant appeared to increase by 226 ± 81 % during TCEt exposure, while the deactivation rate constant in the presence of 1 μm 5-HT + 10 mm TCEt was estimated to be only 12.5 ± 8.1 % of that of 1 μm 5-HT alone (Fig. 10B). The estimated desensitization and resensitization rate constants were substantially reduced during TCEt exposure (3.2 ± 1.4 % and 1 ± 0.7 % of control for desensitization and resensitization rate constants, respectively). However, changes induced in the presence of TCEt in the estimated opening (β) and the closing (α) rate constants are not statistically significant at the 95 % confidence level using a paired two-tailed t test (142 ± 23 % of control for β and 80 ± 16 % of control for α). Estimates of the rate constant values in the absence and presence of TCEt averaged over five cells are presented in Table 3. Similar results were obtained from comparisons of fits to agonist responses in the absence and presence of 100 mm EtOH (Fig. 11A and B). Estimates of the rate constant values in the absence and presence of EtOH are provided in Table 4. All of these changes are consistent with the experimental results which suggest that alcohols increase the activation speed, perhaps through an increase in association rate of the 5-HT3 channel, slow the desensitization and favour the open state.
Figure 10. Fitting currents induced by 5-HT in the absence and presence of TCEt and TCEt-induced changes in estimated channel kinetic parameters.
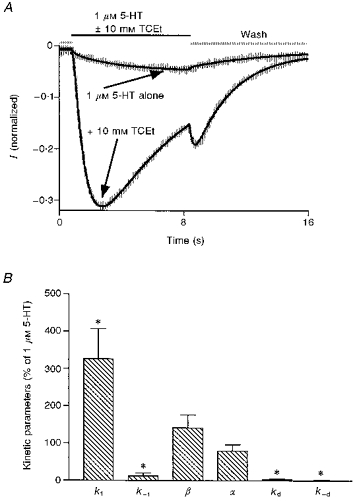
A, currents activated by 1 μm 5-HT ± 10 mm TCEt from a representative cell and the fit to these data using kinetic model 1. All currents were normalized to the current induced by 10 μm 5-HT, a saturating concentration of agonist, in the same cell. While the noisy grey lines represent the real current sweeps, the smooth black lines represent the fit. The smaller amplitude current was induced by 1 μm 5-HT alone and the larger amplitude one was activated by 1 μm 5-HT + 10 mm TCEt. B, changes in estimated kinetic parameters in the presence of 10 mm TCEt. * Statistically significant compared with 100 %.
Table 3.
TCEt effects on estimated transition rate constants
| Parameters | 1 μm 5-HT alone | 1 μm 5-HT + 10 mm TCEt |
|---|---|---|
| k1 (M−1 s−1) | 877 692 ± 175 598 | 2499 427 ± 617 392 |
| k−1 (s−1) | 3.17 ± 0.85 | 0.203 ± 0.085 |
| β (s−1) | 1116 ± 167 | 1369 ± 112 |
| α (s−1) | 540 ± 123 | 390 ± 70 |
| kd (s−1) | 26 ± 8.6 | 0.389 ± 0.085 |
| k-d (s−1) | 2.29 ± 0.88 | 0.007 ± 0.004 |
| kb (M−1 s−1) | — | 74 816 ± 42 357 |
| k-b (s−1) | — | 11 ± 3.9 |
Data are means ± s.e.m. for 5 cells.
Figure 11. Fits of currents generated by 5-HT + EtOH and EtOH-induced changes in estimated channel kinetic parameters.
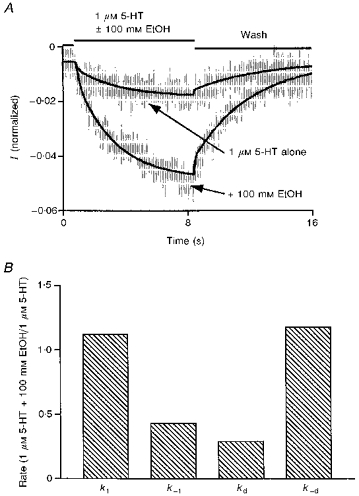
A, the smaller amplitude current (shown in grey) was induced by 1 μm 5-HT alone and the larger amplitude current (also shown in grey) was generated by 1 μm 5-HT + 100 mm EtOH. Both currents are averages of responses generated in four different cells. The continuous lines represent the corresponding fits. B, ethanol increased the receptor activation rate and channel resensitization rate and decreased the receptor deactivation rate and channel desensitization rate.
Table 4.
EtOH effects on estimated transition rate constants
| Parameters | 1 μm 5-HT alone | 1 μm 5-HT + 10 μm EtOH |
|---|---|---|
| k1 (M−1 s−1) | 840 750 | 941 600 |
| k−1 (s−1) | 5.63 | 2.42 |
| β (s−1) | 937.5 | 937.5 |
| α (s−1) | 732.1 | 732.1 |
| kd (s−1) | 49.7 | 14.2 |
| k-d (s−1) | 1.6 | 2.83 |
Data are from fits to single records averaged across 4 cells.
DISCUSSION
There are several possible mechanisms to potentiate the function of 5-HT3 receptors within the framework of a sequential binding channel activation kinetic model (model 1). To explore the possibility that alcohols increase the activation rate of the receptor, we measured the effects of different alcohols on the initial slope of the current induced by a low concentration of 5-HT. All alcohols tested in this study significantly increased the initial slope of the current induced by 1 or 2 μm 5-HT, indicating a common mechanism for the actions of different alcohols.
The 20–80 % current rise time is the most commonly used method to measure current activation. Rise time also decreased in the presence of alcohols, consistent with the hypothesis that alcohols increase the rate constants contributing to channel activation. It is important to bear in mind that there are several intrinsic problems associated with this measure. One disadvantage is that rise time is less sensitive than the initial slope of current to changes in activation rate constants. Another caveat is that rise time analysis neglects the significant impact of desensitization. In the continuous presence of agonist, the rise time is a measure of how long it will take for the desensitization of receptor–channels to overtake activation. Thus, the rise time is not a pure measure of the activation process.
We examined the utility of the initial slope and rise time measures as indicators of altered channel activation by performing simulations of the effects of changing different transition rates on the ion current using a highly simplified three pool model (model 2) consisting of a closed state (C), an open state (A2O) and a desensitized state (A2D).
Model 2.
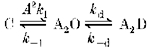
In this model (in which A is agonist), potentiation of the current can be accomplished either by favouring the open state through increasing the activation rate constant (k1) and/or resensitization rate constant (k-d) (these are collapsed rate constants roughly corresponding to the first three steps in model 1), or by stabilizing the open state through decreasing the deactivation rate constant (k-1) and/or decreasing the desensitization rate constant (kd), or any combinations of the above.
The profile of changes in current characteristics associated with changing different transition rate constants generated from this simulation are illustrated in Fig. 12. It is clear that an increase in the initial slope of the current is uniquely associated with an increase in activation ‘rate’ (A2k1). In contrast, it is clear from Fig. 12C that decreasing the desensitization rate constant alone increases both the amplitude of the normalized peak current and the 20–80 % rise time, whereas the initial slope of the current is essentially the same. Thus, shortening or prolonging of the rise time alone cannot be used as direct evidence that the intrinsic activation rate has been altered. Also notice that the measured desensitization rate increased with either an increase in activation rate constant or a decrease in deactivation rate constant without any change in either actual desensitization or resensitization rate constants.
Figure 12. Simulation 1: consequences of changing different transition rate constants.
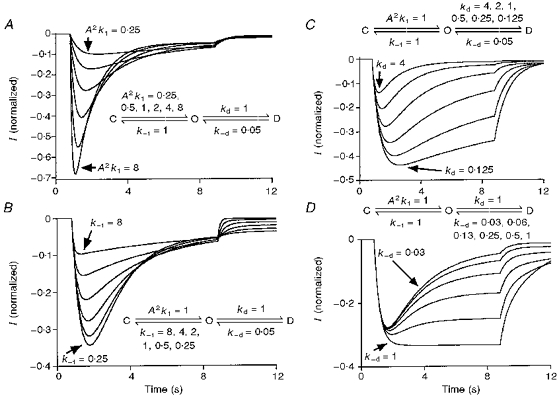
A, increasing the activation rate constant alone will increase the normalized amplitude of the peak current, measured desensitization rate and initial slope of current. B, decreasing the deactivation rate constant alone will increase the normalized amplitude of the peak current and measured desensitization rate without any change in the initial slope of the current. C, decreasing the desensitization rate constant alone will increase the normalized amplitude of the peak current and decrease the measured desensitization rate without any change in the initial slope of the current. D, increasing the resensitization rate constant has little effect on the normalized amplitude of the peak current and initial slope of the current. k1 and k-1 represent the transition rate constants from closed to open state and open to closed state, respectively. kd and k-d represent the desensitization and resensitization rate constants, respectively.
This simulation suggests that the value of the initial slope of the current correlates tightly only with the activation rate of the channel. Therefore, we hypothesize that alcohols increase the agonist-induced activation rate of the 5-HT3 receptor at clinically relevant concentrations, possibly due to an increase in agonist affinity for the receptor or the channel opening rate constant or both. This interpretation is consistent with results from studies of the nACh receptor (Forman, Righi & Miller, 1989; Wu et al. 1993).
Studies of nACh receptor function indicate that for full agonists the effect of increasing agonist efficacy is indistinguishable from that of increasing affinity (e.g. increasing k1; see model 1 in Results). Both changes cause a parallel shift to the left of the concentration-response curve (Wu et al. 1993). While there is no direct evidence suggesting that 5-HT is a full agonist (Popen = 1), it is likely that 5-HT may behave in a similar manner on the 5-HT3 receptor to ACh on the nACh receptor. Hence, in this discussion we will consider both of these as increasing activation rate of the channel and make no further attempt to separate the roles of agonist affinity and the rate of channel opening. It is possible to address this problem using a partial agonist which produces a small channel open probability (Wu et al. 1993; Liu et al. 1994).
The most straightforward way to increase the current conducted by a channel is to increase the single channel conductance. The fact that alcohols did not have a uniform effect across different concentrations of agonist argues against the idea that increasing single channel conductance is responsible for alcohol actions on the 5-HT3 receptor. It is difficult to measure directly single channels given the small conductance of the 5-HT3 channel in NCB-20 cells. However, in the case of nACh receptors, it has been shown that short chain alcohols, including EtOH, do not significantly alter single channel conductance (Bradley, Peper & Sterz, 1980). In the light of the similarities in both receptor structure and alcohol pharmacology between the 5-HT3 and nACh receptors, it is unlikely that alcohols exert their effects through increasing single channel conductance of the 5-HT3 receptor.
One finding of this study that might seem to contradict the general potentiating effect of alcohols on the function of 5-HT3 receptors is the increase in the measured desensitization rate of the current activated by low concentrations of agonist in the presence of alcohols. This observation is usually taken as evidence that the desensitization rate constant has increased, which by itself should reduce the amplitude of the peak current. However, the measured desensitization rate is not a true measure of the real rate constant for transitions from open to desensitized states. Assuming that only the activation rate constant is changing with agonist concentration in model 2, the measured desensitization rate is approximately proportional to the normalized amplitude of the peak current (Fig. 13). Only when the activation process is much faster than the desensitization process, which can be achieved by using high agonist concentrations, does the measured desensitization rate reflect the magnitude of the transition rate constant from open to desensitized states. According to this model, the measured desensitization rate can be increased by increasing either the normalized amplitude of the peak current or the desensitization rate constant. After correcting for the increase in measured desensitization rate due to the increase in the normalized amplitude of the peak current, TCEt actually appears to decrease the desensitization rate constant of the 5-HT3 channel. In other words, the magnitude of the increase in the measured desensitization rate upon alcohol exposure is smaller than that expected solely due to an increase in the normalized amplitude of the peak current. Coupled with the observation that TCEt and ButOH slow desensitization at high agonist concentrations, we conclude that alcohols are most likely to decrease the intrinsic desensitization of the receptor-channel. A similar interpretation has been made with respect to propofol effects on desensitization of GABAA receptors (Orser, Wang, Pennefather & MacDonald, 1994).
Figure 13. Simulation 2: measured desensitization rate and the normalized amplitude of the peak current.
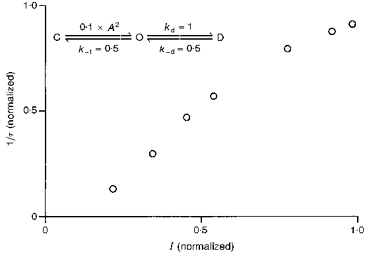
Measured desensitization rate is roughly proportional to the normalized amplitude of the peak current when real desensitization rate constant is unchanged. Simulation was run using relative current amplitudes produced by 2–40 μm 5-HT.
Although there is evidence that alcohols may slow the closing rate of the nACh receptor (Bradley et al. 1980), this action of alcohols is not well characterized. Here, we attempted to examine the possible involvement of the closing rate of the 5-HT3 receptor in the potentiating effect of alcohols. A short pulse of agonist application, which will not induce significant receptor desensitization, was used for this experiment. The decay phase of the current after removing agonist from the environment of the receptor mainly reflects the deactivation or closing of the receptor. TCEt clearly slows the deactivation process as shown in Fig. 7, which supports the idea that the closing rate constants of the 5-HT3 receptor have been altered by this alcohol. This observation may have important implications for alcohol actions on 5-HT3 receptors at synapses. It is commonly thought that the concentration of neurotransmitter in the synapse after secretion is sufficient to saturate receptors. As previously shown, alcohols failed to modify the amplitude of the peak current at high concentrations of agonist. Thus, the alcohol action on the amplitude of peak current may have no significant physiological consequence at a normal synapse during transmission. However, it is quite possible that alcohols potentiate the function of the 5-HT3 receptor at synapses by slowing desensitization and/or deactivation, which would have the net effect of slowing the decay of synaptic current. Such an effect is produced by TCEt on GABAergic transmission (Lovinger, Zimmerman, Levitin, Jones & Harrison, 1993). In order to design drugs that counteract alcohol actions at synapses, we may need to focus more on the closing and desensitization of the receptor.
Additional evidence supporting the hypothesis that alcohols favour the channel open state versus the desensitized state is the tail current observed immediately after switching from 2-μm 5-HT-containing solution to 3 mm TCEt-containing wash solution (Fig. 8). At the end of the 8 s agonist application, a substantial number of receptors have entered the desensitized state from the open state as evidenced by the decay of the current in the continuous presence of the agonist. Upon removal of agonist, the current gradually decreased to the baseline level due to receptors leaving the open state. However, upon washing in the presence of 3 mm TCEt, a tail current could be clearly observed. This suggests the reopening of channels during the wash phase. In the wash phase, there will be no channel opening from the closed state since agonist concentration is reduced to close to zero around the receptors. Thus all of the channel reopenings must come from desensitized state(s). Therefore, we conclude that the introduction of 3 mm TCEt in the wash phase disrupted the previous balance between the open and desensitized states and favoured the open state. These data are most consistent with the hypothesis that TCEt stabilizes the open state by reducing the closing and desensitization rate constants.
One more piece of evidence supporting the idea that alcohols shift the balance between the open and desensitized states toward the open state comes from steady-state current measurements. When a receptor displays a strong desensitization upon prolonged agonist exposure, the steady-state current at equilibrium reflects both the rates of desensitization and resensitization. Therefore, the probability of receptors being in the open state at equilibrium is approximately equal to k-d/kd (Orser et al. 1994). Although the amplitude of the measured maximum peak current has to be smaller than the total available current when all channels open at the same time, it does place a lower limit on the number of receptors available on the cell. Thus, the fraction of the receptors in the open state at steady state has to be at least the same as, or probably smaller than, the ratio of the amplitude of the steady-state current to maximum peak current. We therefore used the ratio of the amplitudes of the steady state and maximum peak currents on the same cell to approximate the channel open probability at equilibrium. High concentrations of 5-HT induce a strong desensitization of the 5-HT3 receptor-channel in NCB-20 cells. Assuming that we can resolve the peak current during the 10 μm 5-HT sweep, k-d/kd should be around 0.05–0.1. Under these conditions, the steady-state current is not very sensitive to changes in the rates of either activation or deactivation as suggested by the simulations shown in Fig. 14. Hence, any change in the steady-state current level caused by alcohols is likely to reflect a change in the balance between the open and desensitized states. Consistent with our hypothesis that alcohols stabilize the open channel state, TCEt and ButOH are both able to increase the steady-state current level. The same phenomenon has been reported for propofol effects on the GABAA receptor (Orser et al. 1994).
Figure 14. Simulation 3: effects of different transition rate constants on the amplitude of steady-state current.
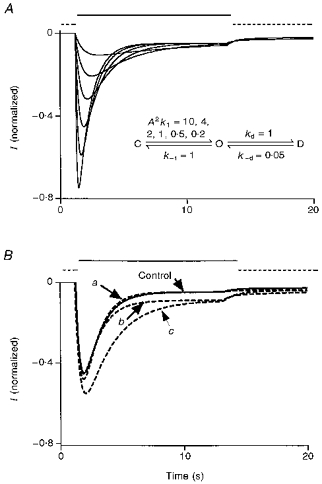
The dashd line indicates the period during which normal external solution application to a cell is simulated. The continuous line represents the period of simulated drug application. A, a 50-fold change in the activation rate constant has little effect on the level of the steady-state current. B, changing deactivation rate constant by 2.5-fold has no effect on the steady-state current. However, the level of steady-state current changes proportionally to the change in the ratio of resensitization and desensitization rate constants. Curve a shows k-1, which decreased from 0.5 to 0.2; curve b shows kd, which decreased from 1 to 0.5; and curve c shows k-d, which increased from 0.05 to 0.1.
As shown in Fig. 2, TCEt at 10 mm shifted the 5-HT dose-response curve parallel to the left without a statistically significant change in the Hill coefficient. This observation indicates that TCEt probably neither alters the number of agonist molecules required to bind to the 5-HT3 receptor-channel before the ion channel can open, nor changes the co-operativity between the bound agonist molecules.
One point that needs clarification is that the tail current we have discussed at present upon switching from agonist to wash + TCEt is different from the tail current we previously reported upon switching from 1 μm 5-HT + 10 mm TCEt to normal wash (Zhou & Lovinger, 1996). Two separate mechanisms underlie these tail currents. The tail current described in this paper is due to favouring of the open state by introducing 3 mm TCEt into the wash phase, while the previously described tail current, which has sometimes been called a ‘surge current’, is caused by removal of 10 mm TCEt in the wash. The appearance of the first tail current is likely to be due to the fact that 3 mm TCEt shifts the balance between the open and desensitized states and favours the open state. On the other hand, the mechanism of the tail current upon washout of high concentrations of TCEt is likely to be the removal of a blocking effect produced by high concentrations of TCEt. This same tail current upon removal of high concentrations of TCEt has also been observed for GABAA receptors (D. M. Lovinger, unpublished observations). We did not observe the tail current upon wash after prolonged exposure to 1 μm 5-HT + 1–6 mm TCEt (for detailed discussion see Zhou & Lovinger, 1996). Dual effects of alcohols, both channel potentiation and block, have also been suggested to occur at nACh and 5-HT3 receptors (Bradley et al. 1980; Bradley, Sterz & Peper, 1984; Liu et al. 1994; Jenkins, Franks & Lieb, 1996), again indicating that similar mechanisms may account for alcohol effects on the 5-HT3, nACh and GABAA receptor subfamily.
Fitting experimental data with a defined kinetic model is a more rigorous way to estimate changes in channel kinetics than other descriptive methods or simulations. Therefore, we have fitted our data using a modified standard ligand-gated ion channel kinetic model (model 1) to obtain numerical estimates of the changes in channel kinetics in the presence of alcohols.
Because the Hill coefficient of the 5-HT3 receptor for serotonin is generally greater than 1 and close to 2 in all tissues and clonal cell lines examined thus far, it is reasonable to assume that at least two ligand molecules need to bind to the receptor before the channel can open. A decay phase of the 5-HT-activated current was consistently observed during continuous 5-HT application at concentrations greater than 1 μm, indicating the existence of at least one desensitized state. Also, considering the apparent blocked state induced by high concentrations of TCEt, a kinetic model consisting of two identical binding steps, one isomerization step, one desensitization step and one blocking step was used in the fitting (see kinetic model 1). Interestingly, this very basic kinetic model can fit perfectly the current sweeps generated by 1 μm 5-HT and can closely fit 1 μm 5-HT + 10 mm TCEt. The fitted curves lie almost exactly in the middle of the real current sweeps (Figs 10A and 11A). Close examination of the individual transition rate constants estimated by the fitting reveals that the intrinsic receptor association rate constant appears to increase while the intrinsic receptor dissociation rate constant and receptor desensitization rate constant both appear to decrease in the presence of TCEt. This result is entirely consistent with experimental observations.
An increase in the intrinsic receptor association rate will lead to an increase in the channel activation speed manifested as an increase in the initial slope of the current (Figs 1, 3B and 4). A decrease in the intrinsic receptor dissociation rate will result in a decrease in the receptor-channel closing rate as reported in the short pulse experiment (Fig. 6A). The ratio of the receptor association rate constant to the dissociation rate constant is increased significantly by 10 mm TCEt. This is consistent with the parallel leftward shift of the dose-response curve caused by TCEt treatment.
Another kinetic step that is altered by TCEt is the receptor-channel desensitization. The estimated values of both the desensitization (kd) and resensitization (k-d) rate constants were reduced substantially in the presence of 10 mm TCEt. The decrease in the estimated desensitization rate constant agrees well with the experimental data which indicate that TCEt and ButOH reduce the measured desensitization rate constant at high agonist concentrations (10 μm 5-HT) and increase the level of steady-state current. However, the more dramatic decrease in the estimated resensitization rate constant compared with the desensitization rate constant contradicts the observation that TCEt increases the steady-state current and favours the open channel state. This is the only observation that is not adequately accounted for by kinetic model 1.
In general, the results of fitting using a modified standard kinetic model (model 1) are in agreement with the experimental observations and provide more detailed estimates for the values of individual transition rate constants and alcohol actions on the kinetics of 5-HT3 receptor–channels. At the same time, our model fitting suggests that the ‘tail’ current induced by the removal of the high concentration of TCEt can be adequately explained by a channel blocking mechanism.
Mechanisms other than direct modification of receptor kinetics are also believed to be responsible for at least part of the alcohol actions on ligand-gated ion channels. One such mechanism is the potential effect of alcohols on receptor phosphorylation. Indeed, evidence from previous studies suggests that potentiation of GABAA receptors by ethanol may be partially mediated by protein kinase C (Wafford & Whiting, 1992). However, this may not be the case for the 5-HT3 receptor. A preliminary report indicates that ethanol potentiates 5-HT3 receptor function even after all thirteen potential intracellular phosphorylation sites on the receptor have been mutated, and potentiation in this mutant receptor is indistinguishable from that seen in the wild-type receptor (Coultrap & Machu, 1997).
We conclude from this study that alcohols potentiate 5-HT3 receptor function by both stabilizing and favouring the open channel state, or in other words reducing the rate constants for transitions out of the open state and increasing the rate constants for entry into the open state. The mechanisms of alcohol actions on the 5-HT3 receptor appear to be similar to actions on muscle-type nACh, GABAA and glycine receptors.
Acknowledgments
We thank Dr Dirk J. Snyders for helpful advice on kinetic simulation and Drs Feng Li and David Weaver for technical assistance with the fast-application system. We thank Dr Joseph M. Beechem for providing the Global Analysis program and for assistance in the use of this software. We also thank Dr Eric Hustedt for help with the Global Analysis program. This study was supported by the National Institute on Alcohol Abuse and Alcoholism AA08986.
References
- Anstie F. On the dietetic and medicinal uses of wines. Part I. On the place of wines in the diet of ordinary life. Practitioner. 1870;4:219–224. [Google Scholar]
- Bartrup JT, Newberry NR. Electrophysiological consequences of ligand binding to the desensitized 5-HT3 receptor in mammalian NG108–15 cells. The Journal of Physiology. 1996;490:679–690. doi: 10.1113/jphysiol.1996.sp021177. [DOI] [PMC free article] [PubMed] [Google Scholar]
- Beechem JM. Global analysis of biochemical and biophysical data. Methods in Enzymology. 1992;210:37–54. doi: 10.1016/0076-6879(92)10004-w. [DOI] [PubMed] [Google Scholar]
- Bradley RJ, Peper K, Sterz R. Postsynaptic effects of ethanol at the frog neuromuscular junction. Nature. 1980;284:60–62. doi: 10.1038/284060a0. [DOI] [PubMed] [Google Scholar]
- Bradley RJ, Sterz R, Peper K. The effects of alcohols and diols at the nicotinic acetylcholine receptor of the neuromuscular junction. Brain Research. 1984;295:101–112. doi: 10.1016/0006-8993(84)90820-5. [DOI] [PubMed] [Google Scholar]
- Colquhoun D, Farrant M. The binding issue. Nature. 1993;366:510–511. doi: 10.1038/366510b0. [DOI] [PubMed] [Google Scholar]
- Colquhoun D, Hawkes AG. A Q-Matrix cookbook: How to write only one program to calculate the single-channel and macroscopic predictions for any kinetic mechanism. In: Sakmann B, Neher E, editors. Single-Channel Recording. 2. New York: Plenum Press; 1995. pp. 589–636. [Google Scholar]
- Costall B, Naylor RJ. The psychopharmacology of 5-HT3 receptors. Pharmacology & Toxicology. 1992;71:401–415. doi: 10.1111/j.1600-0773.1992.tb00570.x. [DOI] [PubMed] [Google Scholar]
- Coultrap SJ, Machu TK. Mutation of putative phosphorylation sites on the 5-HT3 receptor does not eliminate its modulation by ethanol. Alcoholism: Clinical and Experimental Research. 1997;21:7A. [PubMed] [Google Scholar]
- Fadda F, Garua B, Marchei F, Colombo G, Gessa GL. MDL 72222, a selective 5-HT3 receptor antagonist, suppresses voluntary ethanol consumption in alcohol-preferring rats. Alcohol and Alcoholism. 1991;26:107–110. doi: 10.1093/oxfordjournals.alcalc.a045088. [DOI] [PubMed] [Google Scholar]
- Forman SA, Miller KW, Yellen G. A discrete site for general anesthetics on a postsynaptic receptor. Molecular Pharmacology. 1995;48:574–581. [PubMed] [Google Scholar]
- Forman SA, Righi DL, Miller KW. Ethanol increases agonist affinity for nicotinic receptors from Torpedo. Biochimica et Biophysica Acta. 1989;987:95–103. doi: 10.1016/0005-2736(89)90459-8. [DOI] [PubMed] [Google Scholar]
- Grant KA. The role of 5-HT3 receptors in drug dependence. Drug and Alcohol Dependence. 1995;38:155–171. doi: 10.1016/0376-8716(95)01120-n. 10.1016/0376-8716(95)01120-N. [DOI] [PubMed] [Google Scholar]
- Harris RA, Mihic SJ, Dildy-Mayfield JE, Machu TK. Actions of anesthetics on ligand-gated ion channels: role of receptor subunit composition. FASEB Journal. 1995;9:1454–1462. doi: 10.1096/fasebj.9.14.7589987. [DOI] [PubMed] [Google Scholar]
- Hellevuo K, Hoffman PL, Tabakoff B. Ethanol fails to modify [3H]GR65630 binding to 5-HT3 receptors in NCB-20 cells and in rat cerebral membranes. Alcoholism: Clinical and Experimental Research. 1991;15:775–778. doi: 10.1111/j.1530-0277.1991.tb00599.x. [DOI] [PubMed] [Google Scholar]
- Jackson MB, Yakel JL. The 5-HT3 receptor channel. Annual Review of Physiology. 1995;57:447–468. doi: 10.1146/annurev.ph.57.030195.002311. 10.1146/annurev.ph.57.030195.002311. [DOI] [PubMed] [Google Scholar]
- Jenkins A, Franks NP, Lieb WR. Actions of general anaesthetics on 5-HT3 receptors in N1E-1115 neuroblastoma cells. British Journal of Pharmacology. 1996;117:1507–1515. doi: 10.1111/j.1476-5381.1996.tb15314.x. [DOI] [PMC free article] [PubMed] [Google Scholar]
- Johnson BA, Campling GM, Griffiths P, Cowen PJ. Attenuation of some alcohol-induced mood changes and the desire to drink by 5-HT3 receptor blockage: a preliminary study in healthy male volunteers. Psychopharmacology. 1993;112:142–144. doi: 10.1007/BF02247375. [DOI] [PubMed] [Google Scholar]
- Kooyman AR, Hoof JAV, Vijverberg KPM. 5-Hydroxyindole slows desensitization of the 5-HT3 receptor mediated ion current in N1E-115 neuroblastoma cells. British Journal of Pharmacology. 1993;108:287–289. doi: 10.1111/j.1476-5381.1993.tb12795.x. [DOI] [PMC free article] [PubMed] [Google Scholar]
- Kurata Y, Marszalec W, Hamilton B, Carter DB, Narahashi T. Alcohol modulation of cloned GABAA receptor-channel complex expressed in human kidney cell lines. Brain Research. 1993;631:143–146. doi: 10.1016/0006-8993(93)91200-c. 10.1016/0006-8993(93)91200-C. [DOI] [PubMed] [Google Scholar]
- Liu Y, Dilger JP, Vidal AM. Effects of alcohols and volatile anesthetics on the activation of nicotinic acetylcholine receptor channels. Molecular Pharmacology. 1994;45:1235–1241. [PubMed] [Google Scholar]
- Lovinger DM. Ethanol potentiation of 5-HT3 receptor-mediated ion current in NCB-20 neuroblastoma cells. Neuroscience Letters. 1991;122:57–60. doi: 10.1016/0304-3940(91)90192-v. 10.1016/0304-3940(91)90192-V. [DOI] [PubMed] [Google Scholar]
- Lovinger DM, White G. Ethanol potentiation of the 5-hydroxytryptamine3 receptor-mediated ion current in neuroblastoma cells and isolated adult mammalian neurons. Molecular Pharmacology. 1991;40:263–270. [PubMed] [Google Scholar]
- Lovinger DM, Zhou Q. Trichloroethanol potentiation of 5-hydroxytryptamine3 receptor-mediated ion current in nodose ganglion neurons from the adult rat. Journal of Pharmacology and Experimental Therapeutics. 1993;265:771–777. [PubMed] [Google Scholar]
- Lovinger DM, Zimmerman SA, Levitin M, Jones MV, Harrison NL. Trichloroethanol potentiates synaptic transmission mediated by gamma-aminobutyric acid A receptors in hippocampal neurons. Journal of Pharmacology and Experimental Therapeutics. 1993;264:1097–1103. [PubMed] [Google Scholar]
- Mascia MP, Machu TK, Harris RA. Enhancement of homomeric glycine receptor function by long-chain alcohols and anaesthetics. British Journal of Pharmacology. 1996;119:1331–1336. doi: 10.1111/j.1476-5381.1996.tb16042.x. [DOI] [PMC free article] [PubMed] [Google Scholar]
- Nakahiro M, Arakawa O, Narahashi T. Modulation of γ-aminobutyric acid receptor-channel complex by alcohols. Journal of Pharmacology and Experimental Therapeutics. 1991;259:235–240. [PubMed] [Google Scholar]
- Orser SA, Wang LY, Pennefather PS, MacDonald JF. Propofol modulates activation and desensitization of GABAA receptors in cultured murine hippocampal neurons. Journal of Neuroscience. 1994;14:7747–7760. doi: 10.1523/JNEUROSCI.14-12-07747.1994. [DOI] [PMC free article] [PubMed] [Google Scholar]
- Sellers EM, Toneatto T, Romach MK, Somer GR, Sobell LC, Sobell MB. Clinical efficacy of the 5-HT3 antagonist ondansetron in alcohol abuse and dependence. Alcoholism: Clinical and Experimental Research. 1994;18:879–885. doi: 10.1111/j.1530-0277.1994.tb00054.x. [DOI] [PubMed] [Google Scholar]
- Verdoorn TA. Formation of heteromeric γ-aminobutyric acid type A receptors containing two different α subunits. Molecular Pharmacology. 1994;45:457–480. [PubMed] [Google Scholar]
- Wafford KA, Whiting PJ. Ethanol potentiation of GABAA receptors requires phosphorylation of the alternatively spliced variant of the gamma 2 subunit. FEBS Letters. 1992;313:113–117. doi: 10.1016/0014-5793(92)81424-k. 10.1016/0014-5793(92)81424-K. [DOI] [PubMed] [Google Scholar]
- Wu G, Tonner PH, Miller KW. Ethanol stabilizes the open channel state of the Torpedo nicotinic acetylcholine receptor. Molecular Pharmacology. 1993;45:102–108. [PubMed] [Google Scholar]
- Zhou Q, Lovinger DM. Pharmacological characteristics of potentiation of 5-HT3 receptors by alcohols and diethyl ether in NCB-20 neuroblastoma cells. Journal of Pharmacology and Experimental Therapeutics. 1996;278:732–740. [PubMed] [Google Scholar]