

Abstract
Spontaneous, localized transient increases in [Ca2+]i (‘Ca2+ sparks’) were observed in about 40 % of fluo-3-loaded myocytes examined using laser scanning confocal microscopy. Ca2+ sparks persisted after application of Cd2+ (200 μm), but were abolished by ryanodine (30 μm) or thapsigargin (0.1 μm), suggesting that they arise from the spontaneous activation of ryanodine receptors (RyR) in the sarcoplasmic reticulum (SR).
Ca2+ sparks occurred much more frequently at certain sites (or ‘frequent discharge sites’, FDSs) within any confocal plane of the cell and line-scan imaging revealed a wide variation in their spatial size, amplitude and time course. Some spontaneous local transients were very similar to ‘Ca2+ sparks’ observed in heart, i.e. lasting ∼200 ms with a peak fluorescence ratio of 1.75 ± 0.23 (mean ± s.d., n = 33). Other events were faster and smaller, lasting only ∼40 ms with a peak normalized fluorescence of 1.36 ± 0.09 (mean ± s.d., n = 28).
Spontaneous Ca2+ waves with a wide range of propagation velocities (between 30 and 260 μm s−1) were also observed. In about 60% of records (n = 33), Ca2+ sparks could be detected at the sites of wave initiation. Waves of elevated [Ca2+]i propagated with non-constant velocity and in some cases terminated. These observations could be explained by heterogeneity in the distribution of subcellular release sites as well as variability in the contribution of each release site to the wave.
Spontaneous [Ca2+]i transients in single dispersed visceral smooth muscle cells have a wide spectrum of behaviour that is likely to be the result of spatio-temporal recruitment of smaller local events, probably via a calcium-induced calcium release (CICR) mechanism. The spatial non-uniformity of SR and RyR distribution within the cell may account for the existence of ‘frequent discharge sites’ firing the majority of the smooth muscle Ca2+ sparks and the wide variation in the Ca2+ wave propagation velocities observed.
In cardiac and skeletal muscle, the contractile proteins and their associated control mechanisms are arranged in the regular repeating pattern of the sarcomere, and in striated muscle a transverse tubular system is generally present to provide nearly synchronous activation of calcium release across the cell. In both cardiac and skeletal muscle, spontaneous and evoked calcium release events appear as ‘Ca2+ sparks’ (Cheng, Lederer & Cannell, 1993), which occur along Z-lines and which are also the location of the terminal cisternae of the sarcoplasmic reticulum (SR) (Cannell, Cheng & Lederer, 1995; Shacklock, Wier & Balke, 1995; Tsugorka, Rios & Blatter, 1995; Cheng, Lederer, Lederer & Cannell, 1996; Klein, Cheng, Santana, Jiang, Lederer & Schneider, 1996; Parker, Zang & Wier, 1996). Thus calcium release sites in striated muscles occur at regular intervals along the fibre that correspond to sarcomeric structures which do not exist in smooth muscles.
How calcium release sites in smooth muscles are organized in relation to the contractile proteins is unclear. The alternating arrangement of actin and myosin filaments of striated muscle is replaced by a less regular organization of filaments in smooth muscle where a number of thinner actin filaments surround a single myosin filament and are anchored to dense bands on the membrane, or to dense bodies within the cell (Gabella, 1984). Because smooth muscle cells are seldom wider than 5 μm in diameter and contraction is generally slower, it is possible that a less organized structure of contractile proteins and calcium release sites may be sufficient for contractile activation in smooth muscle.
The smooth muscle cell contains about ten thousand times more calcium than is free in the cytoplasm and therefore considerable amounts may be sequestered or stored in the SR (see Bolton, 1986) or even in mitochondria (Drummond & Fay, 1996). In this regard, smooth muscle has some similarity to striated muscle, but the SR is scattered throughout the cell and is often superficial (being related to the plasma membrane or the caveolae; see Devine, Somlyo & Somlyo, 1972) although SR deeper within the cytoplasm also occurs (Gabella, 1981). The SR can occupy 5–6% of cell volume and contains calsequestrin (Wuytack, Raeymaekers, Verbist, Jones & Casteels, 1987) and calreticulin (Milner et al. 1991). The SR itself may be heterogeneous, with specialized areas for calcium uptake and storage (Villa, Podini, Panzeri, Söling, Volpe & Meldolesi, 1993; Tribe, Borin & Blaustein, 1994; Golovina & Blaustein, 1997). Under certain conditions in single isolated smooth muscle cells (similar to those used in the present experiments), the stores have been proposed to release small amounts of calcium periodically which give rise to spontaneous transient outward currents (STOCs) which are due to the simultaneous opening of up to hundred calcium-activated potassium channels (Benham & Bolton, 1986). The calcium release events giving rise to these STOCs have recently been detected by using fluorescent calcium indicators and confocal microscopy (Nelson et al. 1995) and they resemble the ‘Ca2+ sparks’ first observed in cardiac myocytes (Cheng et al. 1993) and proposed to be triggered by calcium-induced calcium release (CICR). Since there is likely to be a CICR mechanism in smooth muscle also (Iino, 1989; Zholos, Baidan & Shuba, 1991; Ganitkevich & Isenberg, 1992), the origin of Ca2+ sparks in smooth muscle may closely parallel those in cardiac muscle, although it is remarkable that Ca2+ sparks from two such morphologically different muscles should appear to be so similar.
In this paper we characterize spontaneous calcium release events in single isolated smooth muscle cells from the longitudinal muscle layer of the small intestine. We show that there are sites in the cell where Ca2+ sparks are discharged frequently (frequent discharge sites, FDSs) and produce evidence for smaller calcium release events (micro-sparks) and for rapid calcium wave propagation, indicative of CICR. We also show data that suggest that sparks may summate to give rise to cell-wide increases in calcium and hence contraction. Some of these results have been described in a preliminary communication (Gordienko, Cannell & Bolton, 1997).
METHODS
Cell preparation
Male guinea-pigs (350–400 g) were killed by decapitation after cervical dislocation. The longitudinal layer of the ileum was dissected and cut into small pieces which were placed in Ca2+- and Mg2+- free saline solution (see below). After 10 min in this solution, the pieces of the tissue were transferred to the same solution plus soybean trypsin inhibitor, collagenase and bovine serum albumin (all at 1 mg ml−1) at 36°C for 25–30 min. The pieces of the tissue were then rinsed for 10 min in enzyme-free solution and triturated with a wide-bore glass pipette. Several cycles of trituration, each followed by transfer to fresh solution with gradually increasing concentrations of Ca2+ (from 0.125 to 1.25 mm), facilitated removal of debris and damaged cells from the suspension and generally improved the yield of relaxed cells. Small aliquots of the cell suspension in the highest [Ca2+]o solution were placed in experimental chambers which were kept for 40 min at 4°C to allow the cells to attach to the glass cover slip forming the bottom of the chambers.
The myocytes were loaded with the fluorescent Ca2+-sensitive indicator fluo-3 by exposure to 5 μm fluo-3 AM (diluted from a stock containing 2 mm fluo-3 AM and 0.025% (w/v) Pluronic F-127 in dimethyl sulphoxide) for 30 min, followed by 30 min wash in a physiological saline solution (PSS) to allow time for de-esterification. The composition of the PSS was (mm): NaCl, 120; KCl, 6; CaCl2, 2.5; MgCl2, 1.2; glucose, 12; Hepes 10; pH adjusted to 7.4 with NaOH. Experiments were performed at room temperature (20–25°C) and cells were used within 5 h of isolation.
Confocal microscopy
Experimental chambers containing cells were placed on the stage of an Axiovert 100 inverted microscope attached to a LSM 410 laser-scanning unit (Zeiss, Oberkochen, Germany). Cells were imaged using a Zeiss plan-Apochromat 63 × 1.4 NA oil-immersion objective. The pinhole was set to provide an x-y resolution of 0.4 μm and a confocal optical section (z resolution) of 0.8-1.0 μm (measured with 0.2 μm fluorescent beads). To improve temporal resolution in some experiments, the line-scan mode of the microscope was used where a single scan line was oriented transversely across or longitudinally along a part of the cell and recorded every 2 ms (see Cannell, Cheng & Lederer, 1994 for a more detailed description of line-scanning). In line-scan images presented here, the horizontal dimension is time (increasing from left to right) and the vertical dimension is position along the scan line.
Fluo-3 fluorescence was excited by the 488 nm line of a 60 mW Argon ion laser (Siemens, Munchen, Germany) and the illumination intensity was set with neutral density filters. The emitted fluorescence was detected by the confocal detector at wavelengths >515 nm. The interface of the confocal microscope was hosted by 33 MHz 486 computer running LSM software (Zeiss) and data files were stored with 128 Mb rewritable optical disks. Image processing was carried out using an Indy workstation (Silicon Graphic, Inc., Mountain View, CA, USA) with custom routines written in IDL (Research Systems, Inc., Boulder, CO, USA). In some cases, estimates of [Ca2+]i were calculated from the normalized fluorescence (F/F0) according to the method given by Cheng et al. (1993). Where appropriate, data are expressed as mean values ± s.d. for the number of cells (n) analysed.
Power spectral analysis
The contribution of the zero-frequency component of the power spectra of line-scan image fragments was removed by subtraction of the average normalized fluorescence from the signal at each pixel within the fragment. For each line-scan image fragment, 20 power spectra (from 20 adjacent pixels along the scan line) were calculated from the Fourier transform of the pixel data and averaged to produce the power spectra shown in Fig. 6.
Figure 6. Noise spectra in line-scan images depends on global average [Ca2+]i.

From a long duration line-scan image (total duration, 15 s) which revealed a gradual increase in the global average fluorescence signal, four fragments (2 μm × 1.86 s) with different levels of average normalized fluorescence (F/F0) are shown (A-D). After subtraction of the average fluorescence signal, the power spectrum of the fluorescence signal was calculated from the Fourier transform of the line-scan data. The graphs show the low-frequency (0–25 Hz) noise spectrum derived from each line-scan image. Note that with increased F/F0 the power spectra exhibited excess noise in the low-frequency domain. Scale bars: x, 2 μm; t, 300 ms.
Chemicals and drugs
Collagenase (Type 1A), soybean trypsin inhibitor (Type II-S), bovine serum albumin, Hepes, dimethyl sulphoxide (DMSO), 1,4-dihydro-2,6-dimethyl-5-nitro-4-[2-(trifluoromethyl)-phenyl]pyridine-3-carboxylic acid methyl ester (Bay K 8644) and cadmium chloride were obtained from Sigma. Fluo-3 acetoxymethyl ester and Pluronic F-127 were obtained from Molecular Probes, Eugene, OR, USA; ryanodine and thapsigargin were obtained from Calbiochem, Beeston, Nottingham, UK.
RESULTS
Time-dependent non-uniformities in fluo-3 fluorescence in ileal myocytes
Cells chosen for imaging were generally relaxed and had a relatively uniform distribution of the dye within the cytosol. Figure 1A shows two sample images from a fluo-3-loaded smooth muscle cell (from a series of 64 images obtained 0.55 s apart). The normalized fluorescence signal (see Methods) was generally uniform, but there were local areas of increased fluorescence ratio, indicating spontaneous local elevations in [Ca2+]i. However, the position and size of these increases changed between images and this is further illustrated in Fig. 1B which shows a larger sequence of images from a portion of the cell shown in Fig. 1A (region bounded by box). Some regions of increased [Ca2+]i (e.g. images 1, 2, 4, 12, 14, 19, 22 and 23 in Fig. 1B) appeared as circular or semicircular areas with radius of 1.5-3 μm. Such local elevations in [Ca2+]i resemble the ‘Ca2+ sparks’ reported in cardiac myocytes (e.g. Cheng et al. 1993; López-López, Schacklock, Balke & Wier, 1995; Cannell et al. 1995; Parker et al. 1996) and would be consistent with the activation of a small discrete calcium release site. Other regions of localized [Ca2+]i elevation (e.g. arrows in Fig. 1A, and in images 4, 6, and 26 in Fig. 1B) had a non-circular appearance and were more extended and followed the outline of the cell surface. Some images showed a low amplitude elevation in [Ca2+]i that extended over a large part of the cell comprising 10–100 μm2 of the confocal section (e.g. images 4, 6–18, 21, 22, and 26–28 in Fig. 1B). It is notable that in some cases, there were several ‘spark-like’ events visible within the region of the low amplitude [Ca2+]i elevation (e.g. images 4, 12, 13, 16, 18 and 22 in Fig. 1B). Therefore, compared with published data from other muscle types, the local spontaneous [Ca2+]i changes in these visceral smooth muscle cells showed a remarkable heterogeneity in spatial appearance.
Figure 1. Confocal fluorescence images of a single ileal smooth muscle cell loaded with fluo-3.
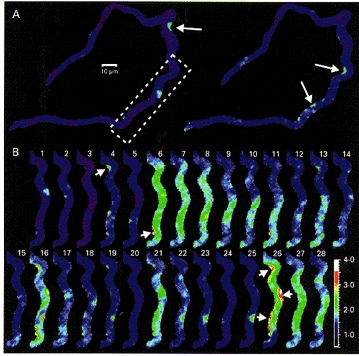
A, the two fluorescence images shown were taken as the 34th and 40th of series of 64 images each acquired 0.55 s apart. The fluorescence intensity was normalized to the average fluorescence intensity in 12 images which revealed the most uniform and least intense fluorescence within the cell among the series. Normalized fluorescence intensity is colour coded as indicated by the bar at the lower right of the figure. B, 28 sequential images from the series described in A are shown. The cell fragment corresponds to the region shown by the box in A. Spontaneous changes in [Ca2+]i occur at many places in the images but these changes are remarkably heterogeneous. Note the elongated shape of the regions of elevated [Ca2+]i indicated by arrows.
These spontaneous fluctuations of [Ca2+]i did not reflect Ca2+ entry through sarcolemmal Ca2+ channels, since they persisted during brief (1–3 min) exposure of the cells to Ca2+-free external solution (n = 4) or 200 μm Cd2+ (n = 21) (data not shown). As has been reported for spontaneous Ca2+ sparks in vascular smooth muscle (Nelson et al. 1995) and cardiac muscle (Cheng et al. 1993), pre-incubation of the myocytes with 0.1 μm thapsigargin (n = 8) or 30 μm ryanodine (n = 11) prevented such spontaneous local [Ca2+]i transients (not shown). It therefore follows that the SR or ryanodine-sensitive calcium store is intimately associated with the genesis of Ca2+ sparks in these cells also.
Location of spontaneously discharging calcium release sites
The frequency of occurrence of spontaneous ‘Ca2+ sparks’ varied widely from several sparks in one x-y image (acquired 0.55 s apart; see Fig. 1) to less than one event during more than 30 s of imaging. To examine the constancy of location of Ca2+ spark events, cells which had higher than average discharge rates had to be used. Local calcium release events were defined as the fluorescence ratio exceeding a value of 1.5 with no change in the ratio in surrounding areas. Data from two cells are shown in Fig. 2 where the number of events at each point within confocal optical slice of the cell has been colour coded. In both cases, there are regions which appear to have a high probability of a Ca2+ spark discharge while no Ca2+ sparks occur in other parts of the cell. It is notable that, in the cell shown in Fig. 2B, the sites of initiation are near the surface of the cell while in Fig. 2A, several sites appear to be almost in the centre of the cell. From these data, we conclude (1) that the distribution of spontaneous SR calcium release is markedly non-uniform and (2) the SR does not have to be in intimate contact with the surface membrane for spontaneous calcium release to occur.
Figure 2. Heterogeneity of spatial distribution of spontaneous calcium release sites.

A, for the cell shown in Fig. 1, the number of times a discrete local increase in [Ca2+]i was detected is coded in colour (calibration bar at left). To be classified as a local Ca2+ release event the local fluorescence intensity had to be greater than 1.5 times the fluorescence in surrounding areas. This criterion led to 21 of the 64 images having spontaneous local release events. Note that some regions of the cell have a much higher probability of spontaneous release and that some release sites are near the membrane while other are deeper in the cytoplasm. B, another cell with a higher occurrence of local [Ca2+]i release events is analysed in the same way as for panel A. In this cell, 84 of 200 images revealed spontaneous Ca2+ sparks. Note that frequent discharge sites are located near the membrane. The insets show these regions at higher magnification.
Heterogeneity of spatio-temporal characteristics of local [Ca2+]i transients
Although spontaneous [Ca2+]i fluctuations in single ileal myocytes could be visualized using x-y scan imaging, this approach did not allow resolution of the time course of [Ca2+]i changes at any particular point within the cell. To improve temporal resolution the line-scan mode of the microscope was used (see Methods). A typical example of a line-scan image obtained by scanning a line oriented parallel to the long axis of the cell is shown in Fig. 3A. The intensity of the fluorescence ratio (F/F0) in this image is grey scale encoded. Three spontaneous calcium release events are clearly seen in the image. The first two events started in a small regions of the cell (apparently < 1 μm across) which were separated by about 7 μm, and resulted in a transient localized increase in F/F0 by a factor of 1.7-2. Such spontaneous calcium release events are characterized by a relatively rapid upstroke (with time-to-peak of 41 ± 17 ms, n = 33) followed by a decline with a time to decay to half-maximal amplitude (t1/2) of 56 ± 29 ms (see Fig. 3B) and were restricted to a small area (with full width at a half-maximal amplitude, FWHM, of 2.1 ± 0.1 μm) rather than spreading across the cell (see Fig. 3C). The peak amplitude of such events was 1.75 ± 0.23 (F/F0, n = 33) and they therefore appear generally similar to the ‘Ca2+ sparks’ reported in cardiac muscle. However, the third event visible in this image had a lower peak amplitude (F/F0 < 1.6), significantly longer rise time (about 340 ms) and slightly larger t1/2 of ∼0.2 s (Fig. 3B). In addition, this event was (spatially) much larger than the other two events and occurred over most of the scan line (Fig. 3A and C). The rise time of this event was too slow and the amplitude too high to have been due to a single ‘Ca2+ spark’ occurring outside the confocal imaging plane (see Pratusevitch & Balke, 1996). Therefore, this spontaneous event must be due to the summation of several out of focus ‘Ca2+ sparks’ or, alternatively, to several in-focus but even smaller release events.
Figure 3. Time course of spontaneous [Ca2+]i transients visualized by confocal line-scan imaging.
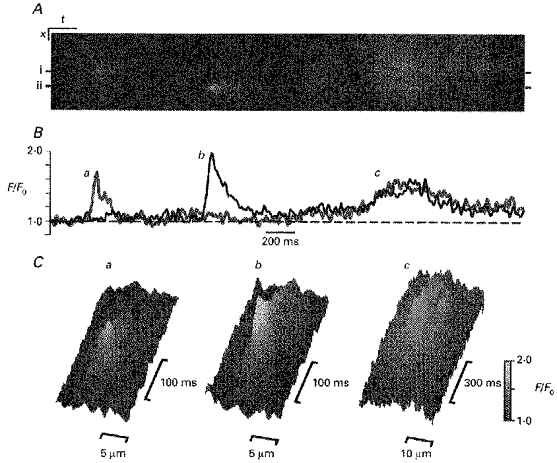
A, line-scan image formed by aligning (from left to right) the successive lines from the confocal scan line (acquired at 500 Hz). The scan line was oriented in parallel with the long axis of the cell. Scale bars: x, 5 μm; t, 200 ms. The fluorescence intensity was normalized to the average fluorescence intensity during the first 100 lines. Normalized fluorescence intensity is coded as indicated by the grey-scale bar in panel C. B, time course of the normalized fluorescence (grey and black lines) from two sites indicated by bars in panel A (i and ii, respectively). The time course of the spontaneous [Ca2+]i increases are either rapid (a, b) or slow (c). There is a marked similarity of the former (a, b) to ‘Ca2+ sparks’ described in cardiac muscle. C, spatio-temporal patterns of [Ca2+]i changes associated with the spontaneous calcium release identified in panel A shown as shaded surface plots. Note the spatially discrete nature of the spontaneous increases in [Ca2+]i associated with the more rapid events (a, b) compared with the slower increase in [Ca2+]i shown in Cc.
Some support for the possible existence of spontaneous calcium release events which are smaller than Ca2+ sparks is shown in Fig. 4. Panel A shows a line-scan image which contains an event similar to Ca2+ sparks near the beginning of the line-scan image. However, there are also several smaller and faster events. Analysis of the fluorescence change associated with these spontaneous events (Fig. 4B) showed that, although near the limit of resolution, they appeared to last only 38 ± 3 ms (n = 28) with a peak fluorescence ratio of 1.36 ± 0.09 (mean ± s.d., n = 28). Such small events are unlikely to be due to a larger out-of-focus Ca2+ spark since such out of focus sparks would exhibit both a reduced amplitude and slower time course whereas the small events are much faster than other Ca2+ sparks of the type seen at the beginning of Fig. 4A. This point is illustrated in Fig. 4C. Panel i in Fig. 4C shows the time course of fluorescence change through the centre of the spark shown in Fig. 4B a (red bars). When the time course of fluorescence change is examined 1 μm from the centre of the spark (blue bars in Fig. 4B a), the amplitude is decreased and the time course is slower (Fig. 4C, panel iii) as might be expected (Pratusevitch & Balke, 1996). When these data are compared with the smaller events shown in Fig. 4B b and Bc, it is apparent that although the smaller events (Fig. 4C, panel ii) have a peak amplitude similar to the out of focus Ca2+ spark (Fig. 4C, panel iii), their time course is much faster. For comparison, the background noise level is shown in Fig. 4C (panel iv) and it is apparent that, although close to the limit of detection, very small Ca2+ sparks or ‘micro-sparks’ occurred in visceral smooth muscle cells.
Figure 4. Variations in the amplitude and kinetics of discrete localized calcium release events.

A, a 3 s line-scan image transversely across the cell (scan rate, 500 Hz). The intensity of fluorescence was normalized to the average fluorescence during the initial 300 lines. Scale bars: x, 3 μm; t, 200 ms. Note that three spontaneous [Ca2+]i release events occur (a, b, c). Ba-c, 3 fragments (12 μm × 280 ms each) of the line-scan image labelled in panel A as a, b and c (respectively) are shown at a higher time scale and magnification. C, time course of the fluorescence changes at the sites indicated by bars (i, ii, iii, iv) in panel B; in the case of ii, iii, and iv the time course of the fluorescence change was obtained by averaging the signal from the pairs of sites labelled in B. Note the small amplitude and rapid time course of the event shown in panel ii compared with that in panel i. Fluorescence measured at a point 1 μm from the centre of the spark (to simulate the kinetics of a spark which is just out of the confocal plane) produces a similar amplitude event (iii) but its time course is much slower. Thus the event in panel ii cannot be explained by an out-of-focus spark. Panel iv shows the background fluorescence signal.
Although all of the events examined in line-scan mode thus far were located towards the centre of the cell, Ca2+ spark-like events also occur at the edge of the cell (Nelson et al. 1995 and Fig. 1). Figure 5 (top) shows a line-scan obtained at a right angle to the cell surface and which crossed the cell edge at a point where a spontaneous Ca2+ release event occurred. While the amplitude of this superficial event was similar to the localized events shown in Fig. 3, its time course was faster and it did not spread as far as other Ca2+ spark-like events (this event reached a peak in 18 ms and a t1/2 of ∼26 ms with a FWHM of 0.9 μm). The average amplitude (F/F0) of such superficial events was 1.58 ± 0.08 with a t1/2 of 28 ± 6 ms and a FWHM of 0.92 ± 0.33 μm (mean ± s.d., n = 7). Therefore, superficial Ca2+ release events also have similar temporal properties to Ca2+ sparks observed in cardiac muscle although, again, their amplitude is somewhat smaller. The smaller FWHM (at least in a direction normal to the surface membrane) may be explained by presence of the surface membrane limiting diffusion to a hemispherical geometry (see Discussion). However, not all spontaneous release events near the membrane conform to a hemisperical diffusion profile with the increase in [Ca2+]i occupying an extended area near the membrane (e.g. Fig. 1). Such variations in the spatio-temporal properties of local calcium release (which may involve more than one Ca2+ spark) could be explained by variations in the local (effective) diffusion coefficient which might arise from either structures restricting free diffusion or the geometry of the SR Ca2+ release sites (see Discussion).
Figure 5. A superficial Ca2+ spark.
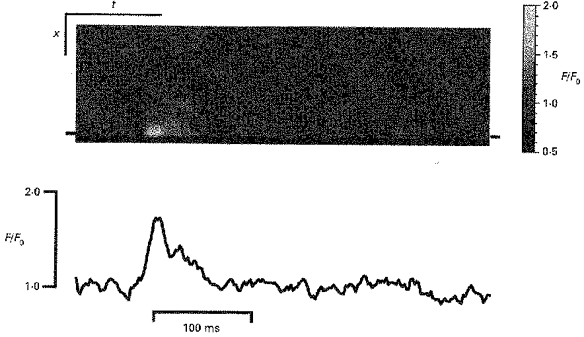
A normalized line-scan image obtained by scanning transversely across the cell every 2 ms is shown (top). A single spontaneous calcium release event occurs at a point where the scan line crosses the cell edge. The time course plot of the normalized fluorescence changes at the superficial site (indicated by bars in the line-scan image) is shown below the image. Scale bars: x, 3 μm; t, 100 ms.
Recruitment and propagation of unitary calcium release events
It is generally agreed that spatio-temporal summation of ‘elementary’ Ca2+ sparks gives rise to the whole cell calcium transient in cardiac muscle (Cannell et al. 1994, 1995; López-López et al. 1995). It was therefore of interest to examine whether the spontaneous release events that we have observed could also summate and give rise to a cell-wide elevation in [Ca2+]i. Since we have already shown that ‘Ca2+ sparks’ in ileal smooth muscle cells have highly variable amplitudes and time courses (with ‘micro-sparks’ at the limit of detection), direct observation of large number of sparks will be problematic given the loss of image contrast that develops as [Ca2+]i increases (Cannell et al. 1994). We therefore employed noise analysis techniques (see Methods) to look for non-uniformities in [Ca2+]i. Figure 6 shows sample line-scan images and corresponding power spectra from a cell which produced a gradual spontaneous increase in [Ca2+]i over a period of 15 s. Figure 6A shows that when [Ca2+]i was at the resting level (F/F0 = 1) the power spectrum was essentially flat as would be expected if the noise in the data arose from photon collection statistics (or ‘shot noise’). However, as [Ca2+]i increased, excess noise in the low-frequency range appeared (Fig. 6B-D), suggesting that small local variations in [Ca2+]i were occurring (cf. Cannell et al. 1994). The reduced level of noise associated with the highest mean [Ca2+]i may be due to (i) the non-linear indicator response or (ii) a change in the buffering properties of the cell at higher [Ca2+]i (Becker, Singer, Walsh & Fay, 1989) or (iii) a reduction in stochastic noise associated with RyR gating if their open probability increases above 0.5.
It has been reported that exposure of cells to 0.5 μm of the L-type Ca2+ channel agonist Bay K 8644 increases Ca2+-spark occurrence in vascular myocytes (Nelson et al. 1995). However, large elevations in [Ca2+]i lead to extensive cell shortening and movement which would preclude simple interpretation of line-scan images. Nevertheless it was possible to obtain some examples of increasing [Ca2+]i in line-scan images before cell shortening occurred. Figure 7A shows such a line-scan image obtained after exposure of the myocyte to Bay K 8644. As can be seen from the image and time course of the fluorescence signal (at the site indicated by bars) a ‘micro-spark’ is followed by three further release events (discharging every ∼580 ms) which do not completely decay to basal levels resulting in a ‘staircase’ of [Ca2+]i. Similar observations were made in four different myocytes. It is therefore apparent that local non-uniformities in [Ca2+]i can occur during increases in global [Ca2+]i and would be consistent with the idea that summation of local calcium release events (either ‘Ca2+ sparks’ or ‘micro-sparks’) underlie the cell-wide increase in [Ca2+]i.
Figure 7. Spatio-temporal summation of discrete calcium release events.

A, normalized line-scan image obtained by scanning transversely across a small region of myocyte exposed to 0.5 μm Bay K 8644. The time course of fluorescence change at the point indicated by the bar is shown below the image. Note the ‘step-like’ increases in fluorescence during the rise of [Ca2+]i and that Ca2+ sparks appear to cause these ‘steps’ as the fluorescence after the Ca2+ sparks does not decay completely. B, normalized line-scan image obtained from another myocyte with the scan line orientated parallel to the long axis of the cell. The time course of fluorescence change at the regions designated by the bar is shown below the image. After a spark-like event, a larger and slower spontaneous release appears to lead to subsequent release in other regions (as evidenced by the fluorescence rising at later times in more distant regions). The inset shows the leading edge of the wave at a 4 times higher time resolution and the arrow marks the site where the earlier spontaneous release event was centred. Note that this site also appears to initiate the wave. For A and B the scale bars are: x, 3 μm; t, 200 ms.
Propagating waves of elevated [Ca2+]i were often observed in ileal myocytes (which were usually semi-contracted) bathed in PSS with 2.5 mm [Ca2+]o (n = 33). In about 60% of line-scan images which showed waves, the Ca2+ wave was initiated at a site where spontaneous Ca2+ sparks were observed. An example is shown in Fig. 7B, and as can be seen in the image, a spontaneous ‘Ca2+ spark’ was followed by a larger release (initiated at the same site; see inset in Fig. 7B) which rapidly spread along the entire scan line. However, the appearance of the wave front is quite non-uniform and ‘ragged’ (see inset, Fig. 7B), suggesting that the wave may involve sequential recruitment of separate calcium release sites (cf. Cheng et al. 1996). In addition, there is a large excess of noise in the decaying phase of the spontaneous transient which would be consistent with spatial non-uniformities in [Ca2+]i, although individual release events are harder to identify.
The propagation velocity of [Ca2+]i waves is highly dependent on the distance between release sites as well as their calcium sensitivity and the amount of calcium released (Backx, de Tombe, Van Deen, Mulder & ter Keurs, 1989). As shown in Figs 2 and 5, there are separate, discrete sites of calcium release near the surface membrane, so we might expect wide variations in propagation velocity near the plasmalemma. This prediction is supported by the data shown in Fig. 8. Panel A shows a line-scan image taken just under the membrane in a direction parallel to the cell surface. The time course of the normalized fluorescence at three points (indicated by bars in Fig. 8A) along the scan line is shown in Fig. 8B and it is clear that as the wave advances there are changes in both the amplitude and time course of the [Ca2+]i transient. Figure 8C shows at a different time scale an enlarged view of the beginning of the [Ca2+]i wave and there is a marked change in the slope of the wave front indicating a fall in propagation velocity as the wave progresses. Initially the [Ca2+]i wave propagation velocity was ∼260 μm s−1 but later this fell to ∼30 μm s−1. This fall in propagation velocity is associated with a reduced rate of rise of [Ca2+]i and peak [Ca2+]i (red trace in Fig. 8B). Of 132 waves observed in 33 cells, 32% showed changes in velocity during their propagation. Again, these results are consistent with variations in the density of recruitable calcium release sites within the cell, with a low density (or absence) of calcium release sites near the bottom of the line-scan image resulting in a low wave propagation velocity and reduced peak [Ca2+]i.
Figure 8. Propagation of [Ca2+]i waves.
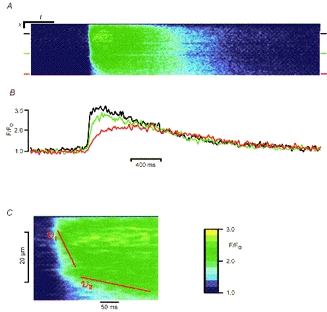
A, normalized line-scan image obtained from a cell with the scan line orientated parallel to the surface of the myocyte. Scale bars: x, 2 μm; t, 400 ms. B, the time course of fluorescence change at the three sites indicated by the coloured bars in panel A (corresponding to the black, green, and red lines). C, the leading edge of the Ca2+ wave (illustrated in panel A) is shown with a different time scale and magnification. Propagation velocities estimated from the slopes of lines drawn along the wave front are: vi = 260 μm s−1; v2 = 30 μm s−1.
DISCUSSION
There is increasing appreciation that many cell functions are regulated by the microenvironment within small regions of the cytoplasm and this concept is termed ‘local control’ (see Berridge, 1997). Direct evidence supporting the idea that ryanodine receptor (RyR) activity is locally controlled during cardiac excitation-contraction coupling (Stern, 1992) has been provided by the discovery of ‘Ca2+ sparks’ in cardiac muscle which are due to SR calcium release via RyRs (Cheng et al. 1993). Subsequent studies have shown that Ca2+ sparks can be triggered by Ca2+ entry via L-type calcium channels in the surface membrane, supporting the view that it is the local microenvironment which determines the probability of SR calcium release (e.g. Cannell et al. 1994, 1995; López-López et al. 1995). Ca2+ sparks have also been observed in vascular smooth muscle cells (Nelson et al. 1995; Mironneau, Arnaudeau, Macrez-Lepretre & Boittin, 1996) and skeletal muscle (Tsugorka et al. 1995; Klein et al. 1996; Shirokova & Rios, 1997). Although smaller voltage-regulated calcium release events in skeletal muscle have been observed, their role in E-C coupling may be to provide the ‘trigger’ calcium for the larger Ca2+ spark (Shirokova & Rios, 1997; see also Klein et al. 1996). Therefore, although the number of RyRs that are activated during a Ca2+ spark is unclear, they can be viewed as ‘elementary’ events underlying E-C coupling in so far as normal E-C coupling is the result of their temporal and spatial summation. In the ileal smooth muscle cells examined here, many of spontaneous calcium release events had a remarkable similarity to the Ca2+ sparks observed in other tissues. Since they were abolished by thapsigargin and ryanodine it is clear that they are also due to spontaneous SR calcium release via RyR activation. To simplify further discussion, we will therefore call these events ‘smooth muscle Ca2+ sparks’ because it is likely that they are due to concerted activation of a number of RyRs also.
Is a Ca2+ spark an elementary calcium release event in smooth muscle cells?
In this study, spark-like events were observed in visceral smooth muscle cells - but their spatio-temporal characteristics were highly variable. The amplitude of Ca2+ sparks should depend on the number and organization of the RyRs in the local volume as well as the local state of SR calcium loading (Cannell et al. 1994; Parker et al. 1996; Cheng et al. 1996; Satoh, Blatter & Bers, 1997). The half-time of decline of the spark and its spatial spread will depend on the local (effective) diffusion coefficient as well as the contribution of calcium transporters which remove calcium from the cytoplasm (Gómez, Cheng, Lederer & Bers, 1996). Therefore in tissues with regularly organized SR release sites (such as striated muscles) one might expect greater uniformity in spark amplitude and time course than in smooth muscle where the microarchitecture of internal calcium stores is highly variable (see Gabella, 1981).
The most obvious difference between the smooth muscle Ca2+ sparks that we have observed and those reported for cardiac muscle were the slower kinetics of Ca2+ sparks in ileal smooth muscle. In heart, Ca2+ sparks peak in about 10 ms (Cheng et al. 1993) and decline with a half-time of ∼24 ms (Cheng et al. 1996). Therefore the rates of rise and decline of ileal smooth muscle Ca2+ sparks were about 25% and 50%, respectively, of those reported for cardiac muscle. The slower rise time may be due to fewer RyRs, lower local SR calcium content, or slower kinetics of SR release channels in ileal smooth muscle cells. In a cultured smooth muscle cell line, it has been shown that calcium stores are highly labile with variable calcium content (Golovina & Blaustein, 1997) so at least a part of the variability in characteristics of smooth muscle Ca2+ sparks may be due to variability in both the number of RyRs recruited and the local trans-SR membrane calcium gradient. Unfortunately, it is not possible to set the exact level of SR calcium content so we cannot assess the relative contribution of local variations in SR calcium content to the variability in time course and amplitude of Ca2+ sparks. The rate of decline of smooth muscle Ca2+ sparks was only half as fast as in cardiac muscle. This small difference may be explained by the contribution of diffusion to the time course of the Ca2+ spark since, even if no SR calcium uptake occurred, calcium would still diffuse from the point of release and cause the Ca2+ spark to decline. Thus diffusion may make a larger percentage contribution to the time course of the Ca2+ spark in smooth muscle. In addition, the smallest smooth muscle Ca2+ sparks we have observed (which we term ‘micro-sparks’) would correspond to an elevation of [Ca2+]i of only 25–70 nm (50 ± 2 nm, n = 28; see Methods) in a region less than 1 μm across. Such small events would involve a calcium flux from the SR more than an order of magnitude lower than that estimated for cardiac muscle. It has been proposed that in oocytes, calcium ‘blips’ may result from the activation of one inositol trisphosphate (IP3) channel while larger calcium ‘puffs’ may be due to the concerted activation of many IP3 channels (Parker & Yao, 1996). It is possible that these ‘microsparks’ might therefore reflect the activation of a single RyR while the smooth muscle Ca2+ ‘spark’ would involve the concerted activation of a cluster of RyRs similar to the ‘functional release unit’ proposed for cardiac muscle (Cannell et al. 1994; Parker et al. 1996).
Although the ileal smooth muscle Ca2+ sparks have quite variable characteristics they are still ‘elementary’ events in calcium signalling. It seems likely that the local spatial organization of RyRs will be an important determinant of smooth muscle Ca2+ spark amplitude and spatial characteristics (see below) because any local clustering of RyRs will promote concerted activation (see Stern, 1992; Cannell et al. 1994; Cheng et al. 1996; Parker et al. 1996). In connection with this point, the variability of smooth muscle Ca2+ sparks (in terms of position and amplitude) can largely explain why spontaneous outward and inward currents (Wang, Hogg & Large, 1992; Henmi, Imaizumi, Muraki & Watanabe, 1996) have such variable amplitudes, although uneven distributions of the surface membrane ion channels underlying these currents may play a role also. Our observation of increased noise in line-scan images (Fig. 6) during slow increases in [Ca2+]i suggests that smooth muscle Ca2+ sparks and/or ‘micro-sparks’ may spatially and temporally summate to produce the cell-wide increase in [Ca2+]i and so would form elementary events underlying excitation-contraction coupling even though each Ca2+ spark contributing to the rise of [Ca2+]i might have a variable amplitude. It follows from this discussion that excitation-contraction coupling in smooth muscle cells is also a ‘local control’ phenomenon because the local microenvironment will determine the probability of SR release and hence the probability of Ca2+ spark discharge. Our observation of sites which frequently discharge sparks supports this idea and suggests that local calcium signalling in microdomains is an important feature of smooth muscle regulation.
Frequent discharge sites
Unlike cardiac muscle, calcium release sites giving rise to spontaneous Ca2+ sparks in ileal myocytes were not distributed uniformly within the cell and there were areas, or ‘frequent discharge sites’ (FDSs), where localized calcium release events occur significantly more frequently than at other sites of the cytoplasm. These sites discharged the majority of Ca2+ sparks during the observation period. It is plausible that the non-uniform distribution of FDSs in smooth muscle (compared with striated muscles) reflects the irregular distribution of SR from which calcium is released and that this in turn is related directly to the small cell size, slow contractile velocity and lack of regular actin-myosin banding, which obviates the need for (or benefit of) regularly and closely spaced release sites throughout the cell. Furthermore, these FDSs are not always located superficially. As can be seen in Fig. 2A, there are FDSs which occur across the width of the myocyte and one of them appears to have the highest probability of Ca2+ spark occurrence in the centre of cytoplasm. It should be noted that the fluorescence signal was acquired from the thin (< 1 μm) confocal optical section situated in the middle of the cell ‘depth’ (which was about 4 μm, as judged by optical sectioning in the axial direction). Caveolae penetrate into the cell to a depth of < 150 nm (Gabella, 1981), suggesting that deep FDSs do not arise from plasmalemma-associated structures (unlike Ca2+ spark sites in cardiac muscle which occur at the location of t-tubules, see Shacklock et al. 1995; Cheng et al. 1996).
Determinants of wave propagation in ileal smooth muscle cells
We have also observed propagating waves of Ca2+ which have variable propagation velocities. It has previously been pointed out that calcium wave propagation velocity depends not only on the local effective diffusion coefficient but also on the relative density of calcium release sites that contribute calcium to the wave (Backx et al. 1989; Lipp and Niggli, 1994; Cheng et al. 1996). Simple diffusion from a point source should be radially symmetrical which should lead to circular (or semicircular if near a membrane) patterns in confocal images. However, some local calcium release events appeared to be localized to a region near the membrane such that the apparent rate of diffusion in a direction parallel to the membrane must have been much larger than in the direction normal to the membrane. This observation could be explained by a physical barrier (such as the location of internal membrane structures) in the direction normal to the membrane and/or a higher density of calcium release sites in the direction parallel to the membrane. If a physical barrier were the sole explanation for the faster propagation of calcium along the membrane then Ca2+ sparks in the centre of the cell should decay faster than those ‘trapped’ by the barrier as local diffusion should contribute to the time course of decline of the Ca2+ spark (see above). To clarify this point, consider the equation for diffusion from a point source in an infinite volume (i.e. three-dimensional free diffusion):
while the corresponding equation for a point source in an infinite plane (i.e. diffusion restricted to two-dimensions) is:
where M is the amount of calcium deposited at r = 0 and t = 0, r is the distance from the source, D is the diffusion coefficient, t is the time and π has its usual meaning (Crank, 1970). It is apparent that these equations differ by the factor 2(π Dt)0.5 showing that, for a given amount of released calcium, the time course of the decline of the Ca2+ spark would be significantly slowed if a barrier prevented diffusion across the cell. However, the time course of decline of Ca2+ sparks near the membrane appeared to be slightly faster than those near the centre of the cell (the t1/2 of decline at the edge of the cell was ∼28 ms and ∼56 ms in the deeper cytoplasm). In connection with this point, the smaller FWHM of smooth muscle Ca2+ sparks at the edge of the cell can be simply explained by the presence of the cell surface membrane which would limit diffusion to a hemispherical pattern with a FWHM which would be half that of spherical diffusion in deeper cytoplasm (as observed). In addition, any restriction to diffusion would result in an increase in the Ca2+ spark amplitude (if the amount of calcium released during a spark were constant) - but this was not observed.
Since a diffusion barrier per se seems an unlikely explanation for some extended patterns of release which followed the surface membrane, it is more likely that such events come about as a result of the spatial distribution of RyRs near the membrane. If RyR ‘clusters’ followed the outline of the cell then the local propagation of calcium release could give rise to the extended pattern of calcium release observed in some x-y images. Alternatively (or additionally) if small clusters of RyR were located near the surface membrane and separated by a small distance, the sequential recruitment of Ca2+ sparks could give rise to a local calcium wave by the same mechanism as that described for cardiac muscle calcium waves (Cheng et al. 1995). The latter possibility is supported by careful examination of Figs 1B and 2B. For example in image 26 of Fig. 1B, there are three regions of higher [Ca2+]i at the membrane (at the right-hand side of the centre of the cell fragment) which correspond to sites of smaller local release events in images 14, 16 and 18 and which resemble Ca2+ sparks. Similarly, there are closely spaced FSDs apparent in the cell shown in Fig. 2B (middle inset).
The probability of sequential SR calcium release site recruitment is likely to be a steep power function of distance between release sites (Cheng et al. 1996; Parker et al. 1996). Therefore the distance between Ca2+ spark sites will be a major determinant of wave propagation velocity in smooth muscle cells (unlike striated muscles where the release sites are organized in the repeating pattern of the sarcomere). It follows that the high local propagation velocities of Ca2+ waves just under the membrane surface (Fig. 8) may be explained by a higher density of calcium release sites in a direction parallel to the cell surface. This effect would be further amplified by any restriction of diffusion in a direction normal to the membrane surface.
In connection with these points, the abrupt reduction in propagation velocity seen in Fig. 8 can now be explained by a local reduction in release site density or ‘gap’ between calcium release sites so that the wave starts to decay (and/or a ‘hole’ in a diffusion barrier which might reduce diffusion across the cell). It follows that the extended appearance of some spontaneous release events in x-y confocal images is probably due to sequential calcium release sites activation near the membrane and the limited temporal resolution of whole cell confocal imaging. Finally, we note that the hypothesis of local concentrations of release sites near the surface membrane suggested by our data has a remarkable similarity to the ‘buffer barrier’ mechanism which has been invoked to explain the effect of SR inhibitors on average [Ca2+]i (see Chen, Cannell & van Breemen, 1992).
Acknowledgments
This work was supported by the Wellcome Trust (M. B. C., T. B. B.) and the Medical Research Council (D. V. G., T. B. B.).
References
- Backx PH, de Tombe PP, Van Deen JHK, Mulder BJM, ter Keurs HEDJ. A model of propagating calcium-induced calcium release mediated by calcium diffusion. Journal of General Physiology. 1989;93:963–977. doi: 10.1085/jgp.93.5.963. [DOI] [PMC free article] [PubMed] [Google Scholar]
- Becker PL, Singer JJ, Walsh JV, Jr, Fay FS. Regulation of calcium concentration in voltage-clamped smooth muscle cells. Science. 1989;244:211–214. doi: 10.1126/science.2704996. [DOI] [PubMed] [Google Scholar]
- Benham CD, Bolton TB. Spontaneous transient outward currents in single visceral and vascular smooth muscle cells of the rabbit. Journal of Physiology. 1986;381:385–406. doi: 10.1113/jphysiol.1986.sp016333. [DOI] [PMC free article] [PubMed] [Google Scholar]
- Berridge MJ. Elementary and global aspects of calcium signalling. Journal of Physiology. 1997;499:291–306. doi: 10.1113/jphysiol.1997.sp021927. [DOI] [PMC free article] [PubMed] [Google Scholar]
- Bolton TB. Calcium metabolism in vascular smooth muscle. British Medical Bulletin. 1986;42:421–429. doi: 10.1093/oxfordjournals.bmb.a072161. [DOI] [PubMed] [Google Scholar]
- Cannell MB, Cheng H, Lederer WJ. Spatial non-uniformities in [Ca2+]i during excitation-contraction coupling in cardiac myocytes. Biophysical Journal. 1994;67:1942–1956. doi: 10.1016/S0006-3495(94)80677-0. [DOI] [PMC free article] [PubMed] [Google Scholar]
- Cannell MB, Cheng H, Lederer WJ. The control of calcium release in heart muscle. Science. 1995;268:1045–1049. doi: 10.1126/science.7754384. [DOI] [PubMed] [Google Scholar]
- Chen Q, Cannell MB, van Breemen C. The superficial buffer barrier in vascular smooth muscle. Canadian Journal of Physiology and Pharmacology. 1992;70:509–514. doi: 10.1139/y92-066. [DOI] [PubMed] [Google Scholar]
- Cheng H, Lederer WJ, Cannell MB. Calcium sparks: elementary events underlying excitation-contraction coupling in heart muscle. Science. 1993;262:740–744. doi: 10.1126/science.8235594. [DOI] [PubMed] [Google Scholar]
- Cheng H, Lederer MR, Lederer WJ, Cannell MB. Calcium sparks and [Ca2+]i waves in cardiac myocytes. American Journal of Physiology. 1996;270:C148–159. doi: 10.1152/ajpcell.1996.270.1.C148. [DOI] [PubMed] [Google Scholar]
- Crank J. The Mathematics of Diffusion. 2. London: Oxford University Press; 1970. [Google Scholar]
- Devine CE, Somlyo AV, Somlyo AP. Sarcoplasmic reticulum and excitation-contraction coupling in mammalian smooth muscles. Journal of Cell Biology. 1972;52:690–718. doi: 10.1083/jcb.52.3.690. 10.1083/jcb.52.3.690. [DOI] [PMC free article] [PubMed] [Google Scholar]
- Drummond RM, Fay FS. Mitochondria contribute to Ca2+ removal in smooth muscle cells. Pflügers Archiv. 1996;431:473–482. doi: 10.1007/BF02191893. [DOI] [PubMed] [Google Scholar]
- Gabella G. Structure of smooth muscles. In: Bülbring E, Brading AF, Jones AW, Tomita T, editors. Smooth Muscle: an Assessment of Current Knowledge. London: Edward Arnold (Publishers) Ltd; 1981. pp. 1–46. [Google Scholar]
- Gabella G. Structural apparatus for force transmission in smooth muscles. Physiological Reviews. 1984;64:455–477. doi: 10.1152/physrev.1984.64.2.455. [DOI] [PubMed] [Google Scholar]
- Ganitkevich VYa, Isenberg G. Contribution of Ca2+-induced Ca2+ release to the [Ca2+]i transients in myocytes from guinea-pig urinary bladder. Journal of Physiology. 1992;458:119–137. doi: 10.1113/jphysiol.1992.sp019409. [DOI] [PMC free article] [PubMed] [Google Scholar]
- Golovina VA, Blaustein MP. Spatially and functionally distinct Ca2+ stores in sarcoplasmic and endoplasmic reticulum. Science. 1997;275:1643–1648. doi: 10.1126/science.275.5306.1643. [DOI] [PubMed] [Google Scholar]
- Gómez AM, Cheng H, Lederer WJ, Bers DM. Ca2+ diffusion and sarcoplasmic reticulum transport both contribute to [Ca2+]i decline during Ca2+ sparks in rat ventricular myocytes. Journal of Physiology. 1996;496:575–581. doi: 10.1113/jphysiol.1996.sp021708. [DOI] [PMC free article] [PubMed] [Google Scholar]
- Gordienko DV, Cannell MB, Bolton TB. Heterogeneity of subcellular calcium signalling in single smooth muscle cells. Biophysical Journal. 1997;72:A183. [Google Scholar]
- Henmi S, Imaizumi Y, Muraki K, Watanabe M. Time-course of Ca2+-dependent K+ and Cl−currents in single smooth muscle cells of guinea-pig trachea. European Journal of Pharmacology. 1996;306:227–236. doi: 10.1016/0014-2999(96)00193-8. [DOI] [PubMed] [Google Scholar]
- Iino M. Calcium-induced calcium release mechanism in the guinea-pig taenia caeci. Journal of General Physiology. 1989;94:363–383. doi: 10.1085/jgp.94.2.363. [DOI] [PMC free article] [PubMed] [Google Scholar]
- Klein MG, Cheng H, Santana LF, Jiang YH, Lederer WJ, Schneider MF. Two mechanisms of quantized calcium release in skeletal muscle. Nature. 1996;379:455–458. doi: 10.1038/379455a0. [DOI] [PubMed] [Google Scholar]
- Lipp P, Niggli E. Modulation of Ca2+ release in cultured neonatal rat cardiac myocytes. Circulation Research. 1994;74:979–990. doi: 10.1161/01.res.74.5.979. [DOI] [PubMed] [Google Scholar]
- López-López JR, Shacklock PS, Balke CW, Wier WG. Local calcium transients triggered by single L-type calcium channel currents in cardiac cells. Science. 1995;268:1042–1045. doi: 10.1126/science.7754383. [DOI] [PubMed] [Google Scholar]
- Milner RE, Baksh S, Shemanko C, Carpenter MR, Smillie L, Vance JE, Opas M, Michalak M. Calreticulin, and not calsequestrin, is the major calcium binding protein of smooth muscle sarcoplasmic reticulum and liver endoplasmic reticulum. Journal of Biological Chemistry. 1991;266:7155–7165. [PubMed] [Google Scholar]
- Mironneau J, Arnaudeau S, Macrez-Lepretre N, Boittin FX. Ca2+ sparks and Ca2+ waves activate different Ca2+-dependent ion channels in single myocytes from rat portal vein. Cell Calcium. 1996;20:153–160. doi: 10.1016/s0143-4160(96)90104-9. [DOI] [PubMed] [Google Scholar]
- Nelson MT, Cheng H, Rubart M, Santana LF, Bonev AD, Knot HJ, Lederer WJ. Relaxation of arterial smooth muscle by calcium sparks. Science. 1995;270:633–637. doi: 10.1126/science.270.5236.633. [DOI] [PubMed] [Google Scholar]
- Parker I, Yao Y. Ca2+ transients associated with openings of inositol trisphosphate-gated channels in Xenopus oocytes. Journal of Physiology. 1996;491:663–668. doi: 10.1113/jphysiol.1996.sp021247. [DOI] [PMC free article] [PubMed] [Google Scholar]
- Parker I, Zang W-J, Wier WG. Ca2+ sparks involving multiple Ca2+ release sites along Z-lines in rat heart cells. Journal of Physiology. 1996;497:31–38. doi: 10.1113/jphysiol.1996.sp021747. [DOI] [PMC free article] [PubMed] [Google Scholar]
- Pratusevitch VR, Balke CW. Factors shaping the confocal image of the calcium spark in cardiac muscle cells. Biophysical Journal. 1996;71:2942–2957. doi: 10.1016/S0006-3495(96)79525-5. [DOI] [PMC free article] [PubMed] [Google Scholar]
- Satoh H, Blatter LA, Bers DM. Effects of [Ca2+]i, SR Ca2+ load, and rest on Ca2+ spark frequency in ventricular myocytes. American Journal of Physiology. 1997;272:H657–668. doi: 10.1152/ajpheart.1997.272.2.H657. [DOI] [PubMed] [Google Scholar]
- Shacklock PS, Wier WG, Balke CW. Local Ca2+ transients (Ca2+ sparks) originate at transverse tubules in rat heart cells. Journal of Physiology. 1995;487:601–608. doi: 10.1113/jphysiol.1995.sp020903. [DOI] [PMC free article] [PubMed] [Google Scholar]
- Shirokova N, Rios E. Small event Ca2+ release: a probable precursor of Ca2+ sparks in frog skeletal muscle. Journal of Physiology. 1997;502:3–11. doi: 10.1111/j.1469-7793.1997.003bl.x. [DOI] [PMC free article] [PubMed] [Google Scholar]
- Stern MD. Theory of excitation-contraction coupling in cardiac muscle. Biophysical Journal. 1992;63:497–517. doi: 10.1016/S0006-3495(92)81615-6. [DOI] [PMC free article] [PubMed] [Google Scholar]
- Tribe RM, Borin ML, Blaustein MP. Functionally and spatially distinct Ca2+ stores are revealed in cultured vascular smooth muscle cells. Proceedings of the National Academy of Sciences of the USA. 1994;91:5908–5912. doi: 10.1073/pnas.91.13.5908. [DOI] [PMC free article] [PubMed] [Google Scholar]
- Tsugorka A, Rios E, Blatter LA. Imaging elementary events of calcium release in skeletal muscle cells. Science. 1995;269:1723–1726. doi: 10.1126/science.7569901. [DOI] [PubMed] [Google Scholar]
- Villa A, Podini P, Panzeri MC, Söling HD, Volpe P, Meldolesi J. The endoplasmic-sarcoplasmic reticulum of smooth muscle: immunocytochemistry of vas deferens fibers reveals specialized subcompartments differently equipped for the control of Ca2+ homeostasis. Journal of Cell Biology. 1993;121:1041–1051. doi: 10.1083/jcb.121.5.1041. [DOI] [PMC free article] [PubMed] [Google Scholar]
- Wang Q, Hogg RC, Large WA. Properties of spontaneous inward currents recorded in smooth muscle cells isolated from the rabbit portal vein. Journal of Physiology. 1992;451:525–537. doi: 10.1113/jphysiol.1992.sp019177. [DOI] [PMC free article] [PubMed] [Google Scholar]
- Wuytack F, Raeymaekers L, Verbist J, Jones LR, Casteels R. Smooth-muscle endoplasmic reticulum contains a cardiac-like form of calsequestrin. Biochimica et Biophysica Acta. 1987;899:151–158. doi: 10.1016/0005-2736(87)90395-6. [DOI] [PubMed] [Google Scholar]
- Zholos AV, Baidan LV, Shuba MF. Properties of the late transient outward current in isolated intestinal smooth muscle cells of the guinea-pig. Journal of Physiology. 1991;441:555–574. doi: 10.1113/jphysiol.1991.sp018851. [DOI] [PMC free article] [PubMed] [Google Scholar]