

Abstract
Molecular mechanisms underlying physiological adaptation to increased levels of dietary peptides have been elucidated by studying the response to the substrate glycyl-l-glutamine (Gly-Gln) of the proton-coupled peptide transporter, hPepT1, in the Caco-2 human intestinal cell line. Vmax for apical uptake of [14C]glycyl-[14C]sarcosine was increased 1.64 (± 0.34)-fold after incubation of Caco-2 cells for 3 days in a peptide-rich medium (4 mm Gly-Gln replacing 4 mm Gln).
A full-length Caco-2 hPepT1 cDNA clone was identical to human small intestinal hPepT1 with the exception of a single amino acid substitution Ile-662 to Val. Transcript sizes, on Northern blots of Caco-2 poly(A)+ RNA probed with a 630 bp 5′ hPepT1 cDNA probe, correspond to the reported band pattern seen with human small intestinal RNA. The dipeptide-induced increase in substrate transport was accompanied by a parallel increase of 1.92 (± 0.30)-fold (n = 9) in hPepT1 mRNA. This was in part due to an increase in hPepT1 mRNA half-life from 8.9 ± 1.1 to 12.5 ± 1.6 h (n = 3), but the increase in half-life does not account fully for the observed increase in mRNA levels, suggesting that there was also a dipeptide-mediated increase in hPepT1 transcription.
Anti-hPepT1-specific antipeptide antibodies localized hPepT1 exclusively to the apical membrane of human small intestinal enterocytes and Caco-2 cells. Gly-Gln supplementation of media resulted in a 1.72 (± 0.26)-fold (n = 5) increase in staining intensity of Caco-2 cells.
We conclude that Caco-2 cells provide an appropriate model for the study of adaptation of intestinal hPepT1, at the molecular level, to increased levels of dietary peptide. The magnitude of functional increase in apical peptide transport activity in response to Gly-Gln can be fully accounted for by the increased levels of hPepT1 protein and mRNA, the latter mediated by both enhanced hPepT1 mRNA stability and increased transcription. The signalling pathway between increased dietary peptide and hPepT1 upregulation, therefore, involves direct action on the enterocyte, independent of hormonal and/or neural control.
Absorption of small peptides makes a significant contribution to total dietary protein assimilation (Grimble & Silk, 1989; Matthews, 1991). cDNAs for rabbit (Fei et al. 1994), human (Liang et al. 1995) and rat (Saito, Okuda, Terada, Sasaki & Inui, 1995) intestinal, proton-coupled peptide transporters (PepT1, hPepT1 and rat PepT1, respectively) have been cloned. As suggested by earlier functional studies (Thwaites, Brown, Hirst & Simmons, 1993a; Yuasa, Fleisher & Amidon, 1994), these cDNAs confer proton-coupled absorption in Xenopus laevis oocytes of a number of clinically important drugs, including β-lactam antibiotics and angiotensin-converting enzyme (ACE) inhibitors, as well as of di- and tripeptides (Boll, Markovich, Weber, Korte, Daniel & Murer, 1994; Fei et al. 1994). Regulation of hPepT1, therefore, has both nutritional and therapeutic implications.
Substrate upregulation of nutrient transporters is a mechanism for ensuring economy to the cell of synthetic and maintenance costs. It is well exemplified by the Na+-glucose cotransporter, SGLT1, which is upregulated in rats and mice by a high carbohydrate diet (Diamond, Karasov, Cary, Enders & Yung, 1984; Cheeseman & Harley, 1991; Ferraris, Villenas, Hirayama & Diamond, 1992), and in sheep by infusion of glucose into the intestine (Lescale-Maty, Dyer, Scott, Wright & Shirazi-Beechey, 1993). Regulation of the ovine transporter is principally by translational or post-translational mechanisms. Additionally, in rat there is evidence for a rapid regulatory response of SGLT1 to jejunal glucose that precedes the onset of increased protein expression at the lumenal membrane (Sharp, Debnam & Srai, 1996). In the human intestine the abundance and activity of SGLT1 is maintained by lumenal nutrients (Dyer, Hosie & Shirazi-Beechey, 1997). In vivo feeding studies in rats and mice suggest that the proton-coupled peptide transporter also demonstrates this form of regulation. Uptake of the dipeptide l-carnosine into everted intestinal sleeves of mice fed a high (72 %) protein diet compared with a low (18 %) protein diet was increased (30–70 %) in proximal regions of the gut (Ferraris, Diamond & Kwan, 1988). In rats, a switch from a low protein diet, comprising 4% casein, to a high protein diet, containing 50% gelatine, produced increases in PepT1 mRNA of 1.5- to 2-fold (Erickson, Gum, Lindstrom, McKean & Kim, 1995). However, the precise inducer(s) of functional PepT1 expression remains to be established, and the mechanism by which the increase in PepT1 accumulation occurs has not yet been investigated. In addition, it is unclear whether the dietary effect on PepT1 is elicited via a process acting directly on small intestinal enterocytes or through indirect hormonal and/or neural pathways. These important questions are not readily amenable to resolution by studies of peptide transport in the whole animal. In vitro, cell line models offer a more appropriate system for investigation of the control of PepT1 expression. They afford the opportunity to manipulate precisely and easily nutrient levels in the culture medium and are more accessible than in vivo models to examination of the regulatory mechanism at the molecular level. The Caco-2 cell line is derived from a human colon adenocarcinoma and grows as an adherent monolayer of differentiated, polarized cells that show many features of the typical small intestinal enterocyte (Hidalgo, Raub & Borchardt, 1989). Correct polarity of expression in Caco-2 cells of a number of proteins, for example lactase, sucrase-isomaltase (Van Beers, Al, Rings, Einerhand, Dekker & Buller, 1995) and neutral endopeptidase (Jalal et al. 1992), has been demonstrated. The cell line is a well-established model for the functional study of proton-coupled dipeptide uptake and transepithelial transport (Thwaites, Brown, Hirst & Simmons, 1993b; Brandsch, Miyamoto, Ganapathy & Leibach, 1994).
The present study utilizes the Caco-2 cell line to address the question of the molecular mechanism of peptide transport regulation by a substrate. The data demonstrate that hPepT1 activity, protein and mRNA levels in Caco-2 cells are upregulated by the dipeptide Gly-Gln. Increased hPepT1 mRNA levels in response to substrate are a reflection of both increased transcription and mRNA stability mediated via a signalling pathway acting directly on the enterocyte.
METHODS
Cell culture
Caco-2 cells (passage number, 99–115) were cultured in Dulbecco's modified Eagle's medium (DMEM) with 4.5 g l−1 glucose supplemented with 6 mm l-glutamine, 1% (w/v) non-essential amino acids, 10% (v/v) fetal calf serum and 60 μg ml−1 gentamicin (all from Sigma). For growth in flasks, Caco-2 cells were seeded at a density of 5 × 104 cm−2 in 162 cm2 flasks (Costar) and grown at 37°C, 5% CO2, in humidified air for around 5 days, to confluence. After a further 3 days, 4 mm glutamine (Gln) was replaced with 4 mm glycyl-l-glutamine (Gly-Gln; Life Technologies). All other additions remained constant. Control cells remained in 6 mm Gln. Three days after treatment, RNA was either harvested directly or cells were first treated with actinomycin D to allow determination of hPepT1 mRNA half-life (see below). For preparation of the mRNA sample for the Northern blot shown in Fig. 2, cells were grown for 14 days postconfluence in control medium. For growth on filters, cells were seeded at a density of 4 × 105 cm−2 either in control medium or in Gly-Gln-supplemented medium on 24.5 mm diameter polycarbonate filters (Transwell, Costar) and cultured at 37°C, 5% CO2 for 21 days. All experiments were performed 18–24 h after replenishing the media.
Figure 2. hPepT1 transcripts in Caco-2 cells.
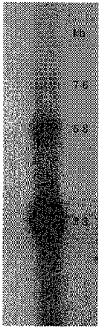
Northern blot of 10 μg Caco-2 poly(A)+ RNA probed with a 32-P-labelled hPepT1 cDNA probe and washed at 47 °C in 2 × SSC. Sizes of the three transcripts are indicated.
Determination of apical dipeptide and amino acid uptake
Cells grown for 21 days on polycarbonate filters were washed extensively in Na+-free modified Krebs buffer and incubated at 37°C in fresh 6-well plates with Na+-free modified Krebs solution, pH 5.5 (Thwaites, McEwan, Hirst & Simmons, 1993) in the apical chamber and pH 7.4 in the basolateral chamber. [14C]Glycyl-[14C]sarcosine (Gly-Sar; 109 mCi mmol−1, Zeneca) at concentrations up to 10 mm, 2.6 nm l-[4,5-3H]leucine (194 Ci mmol−1, Amersham) or 5.7 nm l-[4,5-3H]lysine monohydrochloride (100 Ci mmol−1, Amersham) was added to the apical chamber and uptake was measured over 5 min. At the end of the incubation period cell monolayers were washed in 4 × 500 ml ice-cold Na+-free Krebs solution (pH 7.4) and removed from the inserts. Accumulated radiolabel was determined by scintillation counting. Non-specific solute binding/uptake was determined using 36 μm d-[1-3H(N)]-mannitol (30 Ci mmol−1, Du Pont NEN) added simultaneously with Gly-Sar and, for comparison with tritiated amino acids, measured in parallel, under identical experimental conditions, on separate filters from the same passage.
Protein determination
Cells were lysed for 20 min on ice in 2% Nonidet P-40, 0.2% SDS, 1 mm dithiothreitol (DTT) in PBS, and total cellular protein was determined using DC Protein Assay Reagent (BioRad).
DNA sources and preparation of radiolabelled probes
An N-terminal EcoRI fragment of hPepT1 cDNA spanning nucleotides 1–630 (Liang et al. 1995) subcloned into pBluescript II was a gift from F. Leibach, School of Medicine, Medical College of Georgia, USA. Sucrase-isomaltase cDNA was provided as pSI2 (Green et al. 1987), a 2 kb insert of human jejunal cDNA in pUC 8, by D. Swallow, MRC Human Biochemical Genetics Unit, London. β-Actin cDNA comprised a 1.8 kb clone isolated from rat PC12 cells (adrenal medullary tumour-derived line) in a pBR322-SV40 hybrid vector (Okayama & Berg, 1982) and was obtained from C. Redfern, University of Newcastle, UK. DNA inserts were purified from restriction digests of these constructs, following agarose gel electrophoresis, using a DNA extraction kit (MBI Fermentas) and labelled in a random-priming reaction with [32P]dCTP (Megaprime kit, Amersham). Radiolabelled DNA was separated from unincorporated nucleotide on a Sephadex G-50 column (Pharmacia Biotech).
Isolation of a Caco-2 hPepT1 cDNA clone
A PepT1 cDNA clone spanning nucleotides 1–2632 of the published human small intestinal hPepT1 sequence, and including the entire coding sequence (nucleotides 57–2183), was amplified from poly(A)+ Caco-2 RNA by RT-PCR (reverse transcriptase PCR). The full-length clone was constructed from two amplified, overlapping products. Nucleotides 1–1666 were amplified using the following primers: 5′-CCACCTGCCAGGAGCACG-3′ (bases 1–18; primer 06518) and 5′-GCGGAATCTCTGTTGAGC-3′ (bases 1666–1648; primer PT3). Nucleotides 1587–2618 were amplified using the following primers: 5′-AGCAGCTACAATGCC AGC-3′ (bases 1587–1604; primer PT2) and 5′-CGGGCGCGG TAGCTCAAG-3′ (bases 2635–2618; primer 06655). Both products were purified from a 1% agarose gel using a DNA extraction kit (MBI Fermentas) and subcloned into the pTAg cloning vector (Ingenius). Pure PCR products were then amplified from these constructs and added together to a further PCR reaction containing primers 06518 and 06655 to obtain a product, F6, that included the full-length hPepT1 coding sequence. This was cloned into pTAg to give pTAF6. Sequencing of the primary reaction products allowed verification of the sequence of the primer regions 1648–1666 and 1587–1604. To distinguish real mutations, compared with the published human small intestinal hPepT1 sequence, from Taq polymerase-driven base misincorporations, the primary reaction products were regenerated, subcloned and sequenced.
All PCR reactions were performed over thirty cycles using recombinant Taq polymerase (MBI Fermentas) with 2 mm MgCl2 in the buffer provided, using the following cycling parameters: 30 s, 94°C; 30 s, 55°C; 60 s, 74°C, increased to 120 s for generation of the full-length clone.
Preparation of poly(A)+ RNA
The method for isolation of poly(A)+ RNA was based on detergent lysis, digestion of RNases with proteinase K and capture of polyadenylated molecules on oligo-dT cellulose. Cells were lysed for 20 min on ice in 2% SDS, 200 mm NaCl, 1.5 mm MgCl2 and 200 mm Tris-HCl pH 7.5, containing 50 μg ml−1 proteinase K (Sigma) and 5 mm EDTA. DNA was then sheared by passing through a 21 gauge needle 3 times. After 30 min incubation at 45°C to allow proteinase K activity, NaCl was added to 500 mm and the mixture was again passed 3 times through a 21 gauge needle. Oligo-dT cellulose powder (Pharmacia, Type 7) was added and left, with agitation, for 30 min. Oligo-dT cellulose was then collected by centrifugation for 5 min at 4000 g and washed twice in 500 mm NaCl, 10 mm Tris-HCl pH 7.5, and 3 times in 250 mm NaCl, 10 mm Tris-HCl pH 7.5. Oligo-dT cellulose was then transferred to a spin column (Invitrogen) and washed 3 times more in 250 mm NaCl, 10 mm Tris-HCl pH 7.5. RNA was eluted with 10 mm Tris-HCl pH 7.5, precipitated with 1/10 volume 3 m sodium acetate pH 5.2 (Sigma), 2.5 volumes 100% ethanol and taken up in 10 mm Tris-HCl pH 7.5. RNA was quantified by measurement of the optical density at 260 nm. Except where stated, all reagents were analytical grade.
Northern blotting
Poly(A)+ RNA samples (5–10 μg) were run on 1% formaldehyde-containing agarose gels, transferred to nylon membrane (Hybond N, Amersham) by capillary blotting and fixed by UV cross-linking. Membranes were prehybridized at 42°C in 50% formamide, 2 × SSPE (300 mm NaCl, 20 mm NaH2PO4, 2 mm EDTA, pH 7.4), 5 × Denhardt's reagent, 0.5% (w/v) SDS, 100 μg ml−1 sonicated salmon sperm DNA (Sigma), and then hybridized overnight in the same buffer containing 25 ng 32P-labelled cDNA probe. Membranes were washed to 2 × SSC (300 mm NaCl, 30 mm sodium citrate), 0.1% SDS, 47°C and examined by autoradiography. Signals were quantified by phosphorimage analysis (Molecular Dynamics). All signals were corrected against β-actin for variations in loading and transfer efficiency. Except where stated, all reagents were analytical grade.
Determination of hPepT1 mRNA half-life
After treatment with Gly-Gln for 3 days, cells were placed in serum-free Gly-Gln-supplemented or control medium, and actinomycin D was added to 5 μg ml−1. Poly(A)+ RNA was harvested at time points between 0 and 48 h and probed on Northern blots for hPepT1 and β-actin.
Generation and affinity purification of anti-P085 hPepT1 antipeptide antibody
A synthetic peptide, RLEKSNPYFMSGANS (P085), corresponding to residues 690–704 in the cytoplasmic terminal domain of hPepT1, was coupled, via a cgg linker, to keyhole limpet haemocyanin. Anti-P085 antibody was raised in rabbit against this conjugate following a standard 80 day immunization protocol during which a subcutaneous injection was administered every 14 days. For affinity purification of the polyclonal serum, 1 μg of the synthetic peptide was coupled to 10 ml Affi-Gel 10 (BioRad) in 100 mm Na-Hepes pH 8.0, following the manufacturer's instructions, and poured into a column. The column was equilibrated with starting buffer (50 mm Tris-HCl pH 7.4, 300 mm NaCl, 1 mm EDTA, 0.5 μl ml−1 Tween 20, 1 mg ml−1 NaN3) and 5 ml crude serum was applied. After washing with starting buffer, antibody was eluted with 200 mm glycine-HCl pH 2.5, 150 mm NaCl, neutralized with 2 m Na-Hepes pH 9.0 and stored at 4°C in 1 mm phenylmethylsulphonyl fluoride (PMSF), 5 mm EDTA, 10 mg ml−1 bovine serum albumin (BSA).
Immunolocalization and immunoquantification of hPepT1 expression
Cells grown for 21 days on polycarbonate filters were fixed in 2% paraformaldehyde in phosphate-buffered saline (PBS) for 1 h on ice and permeabilized with 0.1% Triton X-100 in PBS for 30 min on ice. Monolayers were incubated for 1 h at room temperature (20–24°C) with either a 1 : 40 dilution of crude immune serum or 0.05 mg ml−1 affinity-purified anti-P085 antibody in 3% goat serum, 3% BSA in PBS. Background filters were prepared by incubation in a 1 : 40 dilution of preimmune rabbit serum or in the presence of purified antibody plus 5 μg ml−1 peptide P085 as appropriate. After washing in PBS, cells were incubated for 1 h at room temperature with fluorescein isothiocyanate (FITC)-conjugated goat anti-rabbit IgG (Sigma) at a 1 : 40 dilution. Cells were mounted in Vectashield mounting medium (Vector Laboratories) and imaged by confocal laser scanning microscopy (BioRad MRC 600). For quantification of staining intensity, areas within the visual field at × 60 magnification were selected randomly and the integrated pixel intensity of a full projected Z-series was determined using Comos software (BioRad). Cellular density was determined from these images by counting well-defined clusters of cells and measuring their area (Comos, BioRad).
Frozen sections of human duodenum and ileum were cut from surgically resected sections taken for diagnostic purposes and were treated in exactly the same way as Caco-2 monolayers but were also stained with 5 μg ml−1 propidium iodide (Sigma) in PBS, to show tissue morphology, prior to mounting.
Data analyses
Results are presented as means ± 1 s.e.m. of n observations. Except where otherwise stated, n refers to different cell passages. Significance of difference between mean values was tested by non-parametric analyses (Instat, GraphPad Software Inc., San Diego, CA, USA). Kinetic parameters Km and Vmax were calculated by iteration to the Michaelis-Menten equation (Origin, Microcal Software Inc., MA, USA) with initial estimates derived from Eadie-Hofstee plots: d.f. denotes degrees of freeedom. All rates are expressed per milligram of total cell protein. Linear regression analysis of mRNA degradation as a function of time was performed by the method of least squares (Microcal Origin).
RESULTS
Effect of Gly-Gln on Gly-Sar and amino acid uptake
Previous exposure of Caco-2 cell layers for 3 days to 4 mm Gly-Gln (replacing 4 mm Gln) resulted in a 1.64 (± 0.34)-fold increase in Vmax for the apical uptake of Gly-Sar into Caco-2 monolayers, from 20.7 ± 1.4 to 34.0 ± 4.7 nmol min−1 mg−1 (d.f. = 14; Fig. 1). The Km remained unchanged at 4.2 ± 0.4 mm (d.f. = 14) in control medium and 3.9 ± 0.2 mm (d.f. = 14) in 4 mm Gly-Gln. Parallel increases in amino acid uptake were also observed. The sodium-independent rate of uptake of 5.7 nm lysine increased from 41.3 ± 3.2 to 61.1 ± 2.3 pmol min−1 mg−1 (n = 4 filters), and for leucine a change in rate of uptake at 2.6 nm from 10.1 ± 0.7 to 15.1 ± 1.0 pmol min−1 mg−1 (n = 4 filters) was measured. These data are consistent with upregulation of amino acid transport systems b0+ (and y+ in the case of lysine) but may underestimate total increase in uptake of lysine and leucine if sodium-dependent systems B and B0+ are similarly upregulated. Total cell protein was essentially unaffected by Gly-Gln treatment (87 ± 6% compared with control, n = 6, P = 0.08, Student's t test), indicating that changes in Vmax could not be accounted for by changes in total protein.
Figure 1. Upregulation of apical Gly-Sar uptake by Gly-Gln.
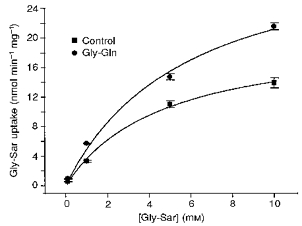
Concentration dependence of apical uptake of [14C]glycyl-[14C]sarcosine under sodium-free conditions into Caco-2 cell monolayers grown on polycarbonate filters. Uptake was determined at apical pH 5.5, basolateral pH 7.4. Points are shown as means ± 1 s.e.m. of 4 filters. The data have been fitted to Michaelis-Menten kinetics (Microcal Origin), indicating an increase in Vmax from 20.7 ± 1.4 to 34.0 ± 4.7 nmol min−1 mg−1 (d.f. = 14) in Gly-Gln-supplemented medium.
Caco-2 hPepT1 mRNAs
A Caco-2 hPepT1 cDNA clone, encompassing the entire coding region, cloned from Caco-2 poly(A)+ RNA contained four single base substitutions, corresponding to four amino acid changes, compared with human small intestinal hPepT1 (Liang et al. 1995) over the amplified region (bases 1–2632). Reamplification of the relevant regions, however, identified three of these changes as being Taq DNA polymerase-driven misincorporations. A fourth substitution, a to g at position 2040 also occurred in three reamplified clones. The conserved amino acid change, Ile-662 to Val, substituting one aliphatic side chain for another in a region predicted by hydropathy analysis to lie within the C-terminal-most helix of twelve transmembrane helices (Fei et al. 1994; Liang et al. 1995), is very unlikely to have any bearing on the functional properties of the transporter and probably reflects normal polymorphism in hPepT1. The findings, therefore, are consistent with proton-coupled dipeptide uptake in Caco-2 cells being mediated by hPepT1, identical in function to the human small intestinal form. The DNA sequence of Caco-2 hPepT1 has been deposited in the Genbank database with accession number AF043233. A Northern blot of Caco-2 poly(A)+ RNA probed with the 630 bp human small intestinal hPepT1 cDNA probe revealed transcripts of 3.3, 5.8 and 7.6 kb (Fig. 2). This corresponds to the reported band pattern seen on Northern blots of human small intestinal RNA (Liang et al. 1994). Increasing the washing stringency of the blot to 0.1 × SSC, 65°C had no effect on the relative band intensities, indicating that they represent alternative transcripts of the same gene, rather than separate but homologous mRNAs, and confirming that the Caco-2 cell line is an appropriate model for the study of human small intestinal hPepT1 mRNA species.
Effect of Gly-Gln on hPepT1 mRNA levels
Quantification by phosphorimage analysis of the most abundant (3.3 kb) hPepT1 signal on Northern blots of Caco-2 poly(A)+ RNA indicated upregulation (e.g. Fig. 3) by a factor of 1.92 ± 0.30 (range, 1.14-4.06; n = 9, P < 0.0005, Mann-Whitney U test), corrected against constitutively expressed β-actin, following supplementation of the growth medium with 4 mm Gly-Gln. Selectivity of the effect was verified by probing three blots with cDNA for the brush-border hydrolase sucrase-isomaltase, which showed no increase in levels of mRNA expression (e.g. Fig. 3) at 0.93 ± 0.07 times control value (n = 3) in 4 mm Gly-Gln. The possibility of selecting a subpopulation of highly expressing cells, rather than observing an effect on hPepT1 mRNA levels within individual cells, was avoided by adding dipeptide only after the cells had reached confluence and were no longer, therefore, a dividing population. Under modified test conditions, where free, added Gln was maintained at 6 mm in both control and treated cells, the increase in hPepT1 mRNA levels induced by the addition of 4 mm Gly-Gln (2.7-fold) fell within the range observed under standard test conditions. Upregulation of hPepT1 mRNA levels, therefore, was not induced by depletion of free Gln.
Figure 3. Upregulation of hPepT1 mRNA by Gly-Gln.
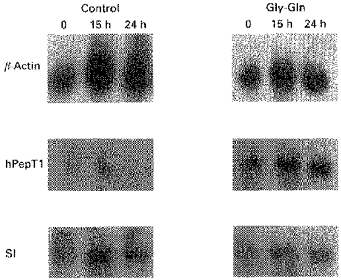
Northern blots of poly(A)+ RNA, prepared from Caco-2 cells grown either under control conditions or in medium supplemented with 4 mm Gly-Gln, probed separately with 32P-labelled hPepT1, sucrase-isomaltase (SI) and β-actin cDNAs. Poly(A)+ RNA was prepared 0, 15 and 24 h after the addition of 5 μg ml−1 actinomycin D. Each lane was loaded with 5 μg poly(A)+ RNA. Blots were washed at 47 °C in 2 × SSC.
Effect of Gly-Gln on hPepT1 message stability
Actinomycin D was added at 5 μg ml−1, a concentration shown to inhibit RNA transcription in Caco-2 cells (Kusuhara, Shimada & Inui, 1992), to examine the effect of Gly-Gln on hPepT1 mRNA half-life. Measurement of the decay in hPepT1 signal intensity, corrected against the corresponding signal for β-actin, whose stability was unaffected by Gly-Gln supplementation, indicated a mean increase in hPepT1 mRNA half-life from 8.9 ± 1.1 to 12.5 ± 1.6 h (n = 3), calculated according to the equation:
(where k = 2.303 × slope of plot of log10mRNA vs. time), describing a first-order decay process. Figure 4 shows the effect of Gly-Gln supplementation on the rate of decay of hPepT1 mRNA measured in one specific experiment. The half-life for sucrase-isomaltase mRNA remained virtually unchanged (15.6 h in control medium, 16.8 h on supplementation with 4 mm Gly-Gln), indicating the effect to be selective.
Figure 4. Increased hPepT1 mRNA half-life in response to Gly-Gln.
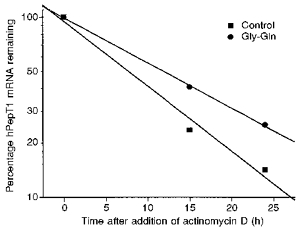
Decay over time of hPepT1 mRNA in control and Gly-Gln-supplemented Caco-2 cells following the addition of 5 μg ml−1 actinomycin D. Values were determined by phosphorimage quantification of the blot shown in Fig. 3, and have been corrected in accordance with a half-life for β-actin mRNA in Caco-2 cells of 15.1 h calculated in a separate experiment. The data indicate half-lives for hPepT1 of 8.3 h in control medium and 12.0 h in Gly-Gln-supplemented medium, calculated according to the equation: t½ = 0.693/k, where k = 2.303 × slope of plot log10 mRNA vs. time. Similar results were obtained in two other, separate, experiments.
Calculation of the theoretical degree of accumulation of hPepT1 mRNA over the time course of the experiment (6–9 days postconfluence, during which time, in unstimulated cells, hPepT1 mRNA levels increase by 2-fold), produced by half-life increases of the magnitude observed, indicates that an additional process must contribute to the elevated hPepT1 mRNA levels measured on supplementation of Caco-2 cells with Gly-Gln. Over the 72 h experimental period, the half-life change accounts for an increase in hPepT1 mRNA by a factor of 1.50 ± 0.09 (n = 3). This compares with an actual increase, over the three separate experiments where stability was determined, of 2.67 ± 0.76 times (n = 3) control. Overall, therefore, the magnitude of changes in mRNA levels seen and the calculated increase in half-life is consistent with a contribution from increased hPepT1 transcription in addition to increased mRNA stability.
Immunolocalization of hPepT1 in Caco-2 cells and human duodenum and ileum
Anti-P085-specific immunostaining was demonstrated by competition with 5 μg ml−1 peptide P085 (Fig. 5A and B) and by comparison with preimmune serum (Fig. 5C and D). Staining was detected only at the apical membrane/apical pole of human duodenal and ileal enterocytes and Caco-2 monolayers (Fig. 5), demonstrating that the cell line model shows correct polarity of hPepT1 expression. In ileum and duodenum, staining was absent from the undifferentiated cells in the crypts, accumulating from the region of the crypt-villous junction upwards.
Figure 5. Apical membrane localization of hPepT1 in human intestine and Caco-2 cells.
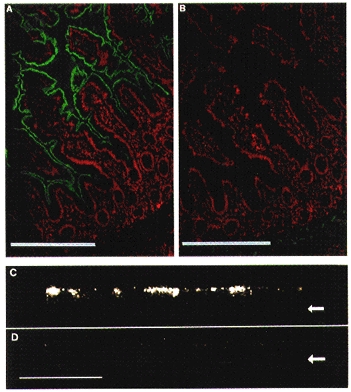
Immunolocalization of hPepT1 by anti-P085 (anti-hPepT1) immunostaining at the apical membrane of human ileum and a Caco-2 monolayer. A and B, immunofluorescence in a section of human ileum. The FITC signal (anti-hPepT1) is shown in green and propidium iodide fluorescence (tissue morphology) is shown in red. The section shown in B was stained in the presence of 5 μg ml−1 peptide P085. Scale bar, 100 μm. A similar staining pattern was observed in human duodenum. C and D, immunofluorescence, imaged by confocal laser scanning microscopy, through Caco-2 cells perpendicular to the plane of the monolayer. D shows a control stained with pre-immune rabbit serum. Arrows indicate the position of the base of the monolayer. Scale bar, 100 μm. Human tissues were stained with affinity-purified anti-P085 antibody at a concentration of 0.05 mg ml−1, as detailed in Methods. Caco-2 cells were stained with anti-P085 polyclonal serum at a 1:40 dilution.
Effect of Gly-Gln on hPepT1 protein expression
Increased levels of hPepT1 protein expression are apparent by anti-P085 immunostaining in Caco-2 cells grown in the presence of 4 mm Gly-Gln compared with control (Fig. 6). Cell density was unchanged by Gly-Gln treatment ((7.71 ± 0.35) × 105 cells cm−2 in control medium, (7.88 ± 0.31) × 105 cells cm−2 in Gly-Gln, n = 5 filters), as was total protein (see above), showing the effect on hPepT1 expression to be specific, and not simply a function of altered cellular growth. Anti-P085-specific immunostaining was quantified on five areas of Caco-2 cells selected at random on control and Gly-Gln-treated filters. The background intensity, determined from cells stained in the presence of the peptide P085, was subtracted from all values. Total staining intensity was increased from 6.1 ± 0.3 to 10.5 ± 1.1 (integrated pixel intensity × 106; n = 5 filters, P < 0.05, Mann-Whitney U test) by treatment with Gly-Gln, indicating levels of hPepT1 protein expression to have increased by a factor of 1.72 ± 0.26. This is consistent with the measured increase in hPepT1 mRNA levels elicited by addition of Gly-Gln. Selection and quantification of the single brightest-staining cell in each image showed that under control conditions 3.1 ± 2.5% of pixels were of an intensity greater than 200 (n = 5 filters). After growth in Gly-Gln, however, 39.6 ± 10.0% of pixels making up the brightest-staining cell were of this intensity or greater (n = 5 filters). This difference (P < 0.005, Mann-Whitney U test) suggests that individual cells have the capability to upregulate hPepT1 expression and further argues against the observed changes being due to altered cellular growth.
Figure 6. Upregulation of hPepT1 protein expression by Gly-Gln.

Projected Z-series through Caco-2 cells grown on polycarbonate filters, stained with anti-P085 hPepT1 antibody and imaged by confocal laser scanning microscopy. The staining shown is representative of that observed on 5 separate filters for each condition. A and C, staining of cells grown in control medium. B and D, staining of cells grown in medium containing 4 mm Gly-Gln. C and D show the background staining achieved in the presence of 5 μg ml−1 peptide P085. Scale bar, 100 μm.
DISCUSSION
A physiological response to increased levels of dietary protein (Ferraris et al. 1988; Erickson et al. 1995) has been confirmed in human intestinal Caco-2 cells in vitro, as increased functional activity of apical dipeptide (Gly-Sar) and amino acid uptake, indicating that this is a direct effect of nutrient supply on epithelial cell function, without a requirement for neural and/or hormonal mediators. Gly-Sar, a non-hydrolysable dipeptide, is a substrate of the cloned proton-coupled peptide transporter hPepT1 (Liang et al. 1995) and increased upake, therefore, is consistent with increased hPepT1 activity. The underlying molecular mechanism for this upregulation of functional activity is increased levels of hPepT1 mRNA and concomitant increases in hPepT1 protein expression. The magnitude of the increases in hPepT1 activity, mRNA and protein levels is in the range 1.64-1.92 times basal values, demonstrating that control of mRNA accumulation, rather than translation or post-translational modification, is the primary mechanism of regulation. Furthermore, the close agreement between the enhanced levels of dipeptide uptake (1.64-fold) and hPepT1 protein expression (1.72-fold) shows that hPepT1 alone accounts for all peptide-regulated Gly-Sar uptake into Caco-2 cells.
An increase in hPepT1 mRNA stability accounts, at least to some degree, for the observed upregulation, with half-life increasing from 8.9 to 12.5 h. A discrepancy between the calculated level of hPepT1 mRNA accumulation, resulting from a change of this magnitude, and the measured increase in hPepT1 mRNA indicates that there is also a contribution from increased hPepT1 mRNA transcription. Direct demonstration of a transcriptional component to the regulatory response to peptide, by nuclear run-off analysis, was precluded by the very low levels of hPepT1 mRNA expression and, therefore, awaits examination of control and peptide-induced levels of expression by other, more sensitive, techniques, such as the use of a reporter gene coupled to the hPepT1 promoter region.
Increased hPepT1 mRNA stability could, speculatively, arise from reduced expression of a message-destabilizing factor, increased expression of a message-stabilizing factor or altered interactions between hPepT1 mRNA and such factors. A number of recent studies report the involvement of mRNA-binding protein factors in the regulation of mRNA stability (e.g. Zhang et al. 1993; Preiss, Sang, Chrzanowska & Lightowlers, 1995; Geneste, Raffalli & Lang, 1996; Pende et al. 1996). Involvement of intracellular second messenger signalling molecules in the modulation of mRNA stability has also been reported (reviewed in Williams, Sensel, McTigue & Binder, 1993). For the Na+-coupled glucose transporter, SGLT1, for example, elevated cAMP resulted in increased message stability (Peng & Lever, 1995), and protein kinase C activation has been implicated in message destabilization (Shioda, Ohta, Isselbacher & Rhoads, 1994). Downregulation of hPepT1 by both cAMP (Muller, Brandsch, Prasad, Fei, Ganapathy & Leibach, 1996) and protein kinase C (Brandsch et al. 1994) has been reported, although the fact that these responses are observed over a time scale as short as 2 h, plus the fact that the protein kinase C-mediated decrease in hPepT1 activity is independent of de novo protein synthesis (Brandsch et al. 1994), suggests that they are distinct from the upregulation reported here. Nonetheless, this does not rule out a role for protein kinase A and/or protein kinase C in the longer-term response to Gly-Gln.
Under our standard experimental conditions, the signal for hPepT1 upregulation might be the dipeptide itself or changes in levels of the constituent amino acids Gly and Gln in the culture medium. This issue is addressed by the observation that even under conditions where complete extracellular hydrolysis of added dipeptide would have produced no net increase in amino acid concentration in the nutrient medium (addition of Gly-Gln reduced to 2 mm, whilst glutamine was still depleted by 4 mm), upregulation of hPepT1 mRNA levels to the same degree as observed under our standard conditions was still measured (Picker, Hall, Walker & Hirst, 1997). This indicates that extracellular hydrolysis of dipeptide to increase net amino acid concentration is not required to induce transporter upregulation. However, this does not exclude a role for apical peptidase activity in the signalling mechanism for hPepT1 upregulation. It is also impossible, at this stage, to rule out the possibility of intracellular hydrolysis being necessary to induce transporter upregulation. In fact, our choice of the dipeptide Gly-Gln to induce hPepT1 upregulation was based on it being an hPepT1 substrate which, whilst being relatively robust, is still hydrolysed by intestinal brush-border membrane hydrolases to some degree (Minami, Morse & Adibi, 1992) to release the component, metabolically active amino acids, of which Gln in particular is an important energy source for the gut (Ashy, Salleh & Ardawi, 1988). By satisfying these criteria, Gly-Gln represents a physiological dietary product whose assimilation is mediated by hPepT1 and which provides the intestinal cells, and the organism in general, with important nutrients.
The response of PepT1 mRNA levels to a protein-rich diet in rats (Erickson et al. 1995) could also be dipeptide mediated. However, an earlier study which found uptake of the non-hydrolysable dipeptide l-carnosine into everted mouse intestinal sleeves to be increased by elevated levels of dietary protein (casein) also showed that, at an intermediate level of dietary protein, uptake levels were independent of its composition, with full hydrolysate producing the same effect as non-hydrolysed casein (Ferraris et al. 1988). It seems possible, then, that at least two different pathways might contribute to adaptive upregulation of PepT1.
A further pertinent question is whether the parallel response of amino acid transport systems, demonstrated here as increased Lys and Leu uptake, is mediated via a dipeptide-stimulated pathway, or if hydrolysis to amino acids is required first. This, and the other issues concerning the nature of the regulatory stimulus discussed above, will be the subject of further investigation.
Concerning the systemic link between protein/dipeptide in the gut lumen and the regulatory response, our study has shown that dipeptide-mediated upregulation of PepT1 in the enterocyte involves a direct effect that operates independently of hormonal and/or neural pathways, and that these effects can account for the full magnitude of upregulation reported in vivo (Ferraris et al. 1988; Erickson et al. 1995).
Evidence for the existence of discrete or common peptide transport mechanisms in the apical and basolateral membranes of the enterocyte is equivocal. Different profiles for pH dependency of Gly-Sar (Thwaites et al. 1993b) and bestatin (Saito & Inui, 1993) uptake into Caco-2 cells across apical and basolateral surfaces, plus selective inhibition by p-chloromercuribenzene sulphonate at apical and basolateral Caco-2 membranes (Saito & Inui, 1993) point to discrete transporters. The results of hybrid depeletion studies, indicating PepT1 accounts for all Gly-Sar uptake activity in Xenopus laevis oocytes injected with rabbit small intestinal mRNA, are, however, apparently in conflict with these data (Fei et al. 1994). By use of hPepT1-specific antibodies, we have immunolocalized hPepT1 expression exclusively to the apical membranes of human enterocytes in vivo and Caco-2 cells in vitro. This provides further evidence for a distinct basolateral peptide transporter.
In conclusion, we have demonstrated that Caco-2 cells provide an appropriate model for the study of adaptation of intestinal hPepT1, at the molecular level, to increased levels of dietary peptide. Levels of hPepT1 mRNA and protein are increased by an amount commensurate with the magnitude of functional increase in activity in response to Gly-Gln. The level of hPepT1 upregulation demonstrated in this epithelial model represents the full, in vivo response. The signalling pathway between increased dietary peptide and hPepT1 upregulation, therefore, involves direct action on the enterocyte and operates independently of hormonal and/or neural control. Upregulation is mediated in part via increased hPepT1 mRNA stability. A role for increased hPepT1 gene transcription is also likely: however, establishing this unequivocally awaits additional studies using the hPepT1 promoter region coupled to a sensitive reporter gene. Further clarification of the molecular details of this regulatory response requires the demonstration and identification of putative hPepT1 mRNA-interacting proteins and investigation of the involvement of recognized intracellular second messenger signalling pathways.
Acknowledgments
This work was funded by the BBSRC. D. T. T. was supported by The Wellcome Trust. We are grateful to Professor F. C. Campbell and Dr M. K. Bennett for providing tissue samples. We thank Mrs Maxine Geggie for excellent technical assistance.
References
- Ashy AA, Salleh M, Ardawi MSM. Glucose, glutamine and ketone-body metabolism in human enterocytes. Metabolism: Clinical and Experimental. 1988;37:602–609. doi: 10.1016/0026-0495(88)90179-5. [DOI] [PubMed] [Google Scholar]
- Boll M, Markovich D, Weber W-M, Korte H, Daniel H, Murer H. Expression cloning of a cDNA from rabbit small intestine related to proton-coupled transport of peptides, β-lactam antibiotics and ACE-inhibitors. Pflügers Archiv. 1994;429:146–149. doi: 10.1007/BF02584043. [DOI] [PubMed] [Google Scholar]
- Brandsch M, Miyamoto Y, Ganapathy V, Leibach FH. Expression and protein kinase C-dependent regulation of peptide/H+ co-transport system in the Caco-2 human colon carcinoma cell line. Biochemical Journal. 1994;299:253–260. doi: 10.1042/bj2990253. [DOI] [PMC free article] [PubMed] [Google Scholar]
- Cheeseman CI, Harley B. Adaptation of glucose transport across rat enterocyte basolateral membrane in response to altered dietary carbohydrate intake. Journal of Physiology. 1991;437:563–575. doi: 10.1113/jphysiol.1991.sp018611. [DOI] [PMC free article] [PubMed] [Google Scholar]
- Diamond JM, Karasov WH, Cary C, Enders D, Yung R. Effect of dietary carbohydrate on monosaccharide uptake by mouse small intestine in vitro. Journal of Physiology. 1984;349:419–440. doi: 10.1113/jphysiol.1984.sp015165. [DOI] [PMC free article] [PubMed] [Google Scholar]
- Dyer J, Hosie KB, Shirazi-Beechey SP. Nutrient regulation of human intestinal sugar transporter (SGLT1) expression. Gut. 1997;41:56–59. doi: 10.1136/gut.41.1.56. [DOI] [PMC free article] [PubMed] [Google Scholar]
- Erickson RH, Gum JRG, Lindstrom MM, McKean D, Kim YS. Regional expression and dietary regulation of rat small intestinal peptide and amino acid transporter mRNAs. Biochemical and Biophysical Research Communications. 1995;216:249–257. doi: 10.1006/bbrc.1995.2617. [DOI] [PubMed] [Google Scholar]
- Fei Y-J, Kanai Y, Nussberger S, Ganapathy V, Leibach FH, Romero MF, Singh SK, Boron WF, Hediger MA. Expression cloning of a mammalian proton-coupled oligopeptide transporter. Nature. 1994;368:563–566. doi: 10.1038/368563a0. [DOI] [PubMed] [Google Scholar]
- Ferraris RP, Diamond J, Kwan WW. Dietary regulation of intestinal transport of the dipeptide carnosine. American Journal of Physiology. 1988;255:G143–149. doi: 10.1152/ajpgi.1988.255.2.G143. [DOI] [PubMed] [Google Scholar]
- Ferraris RP, Villenas SA, Hirayama BA, Diamond J. Effect of diet on glucose transporter site density along the intestinal crypt-villus axis. American Journal of Physiology. 1992;262:G1060–1068. doi: 10.1152/ajpgi.1992.262.6.G1060. [DOI] [PubMed] [Google Scholar]
- Geneste O, Raffalli F, Lang MA. Identification and characterization of a 44 kDa protein that binds specifically to the 3′-untranslated region of CYP2A5 mRNA: inducibility, subcellular distribution and possible role in mRNA stabilization. Biochemical Journal. 1996;313:1029–1037. doi: 10.1042/bj3131029. [DOI] [PMC free article] [PubMed] [Google Scholar]
- Green F, Edwards Y, Hauri HP, Povey S, Ho MW, Pinto M, Swallow D. Isolation of a cDNA probe for a human jejunal brush-border hydrolase, sucrase-isomaltase, and assignment of the gene locus to chromosome 3. Gene. 1987;57:101–110. doi: 10.1016/0378-1119(87)90181-8. [DOI] [PubMed] [Google Scholar]
- Grimble GK, Silk DBA. Peptides in human nutrition. Nutrition Research Reviews. 1989;2:87–108. doi: 10.1079/NRR19890009. [DOI] [PubMed] [Google Scholar]
- Hidalgo IT, Raub TJ, Borchardt RT. Characterization of the human colon carcinoma cell line (Caco-2) as a model system for intestinal epithelial permeability. Gastroenterology. 1989;96:736–749. [PubMed] [Google Scholar]
- Jalal F, Jumarie C, Bawab W, Corbeil D, Malo C, Berteloot A, Crine P. Polarized distribution of neutral endopeptidase 24.11 at the cell surface of cultured human intestinal epithelial Caco-2 cells. Biochemical Journal. 1992;288:945–951. doi: 10.1042/bj2880945. [DOI] [PMC free article] [PubMed] [Google Scholar]
- Kusuhara H, Shimada O, Inui J. Effect of 25-hydroxycholesterol on cholesteryl ester formation in Caco-2 cells. Lipids. 1992;27:478–480. doi: 10.1007/BF02536393. [DOI] [PubMed] [Google Scholar]
- Lescale-Maty L, Dyer J, Scott D, Wright EM, Shirazi-Beechey SP. Regulation of ovine intestinal Na+/glucose cotransporter (SGLT1) is dissociated from mRNA abundance. Biochemical Journal. 1993;291:435–440. doi: 10.1042/bj2910435. [DOI] [PMC free article] [PubMed] [Google Scholar]
- Liang R, Fei Y-J, Prasad P, Ramamoorthy S, Han H, Yang-Feng TL, Hediger MA, Ganapathy V, Leibach FH. Human intestinal H+/peptide cotransporter. Cloning, fuctional expression and chromosomal localization. Journal of Biological Chemistry. 1995;270:6456–6463. doi: 10.1074/jbc.270.12.6456. [DOI] [PubMed] [Google Scholar]
- Liang R, Fei Y-J, Ramamoorthy S, Prasad PD, Hediger MA, Ganapathy V, Leibach FH. Molecular cloning and functional expression of a peptide/proton cotransporter from human small intestine. Gastroenterology. 1994;106:A617. [Google Scholar]
- Matthews DM. Protein Absorption. New York: Wiley-Liss; 1991. [Google Scholar]
- Minami H, Morse EL, Adibi SA. Characteristics and mechanism of glutamine-dipeptide absorption in human intestine. Gastroenterology. 1992;103:3–11. doi: 10.1016/0016-5085(92)91088-l. [DOI] [PubMed] [Google Scholar]
- Muller U, Brandsch M, Prasad PD, Fei Y-J, Ganapathy V, Leibach FH. Inhibition of the H+/peptide cotransporter in the human intestinal cell line Caco-2 by cyclic AMP. Biochemical and Biophysical Research Communications. 1996;218:461–465. doi: 10.1006/bbrc.1996.0082. [DOI] [PubMed] [Google Scholar]
- Okayama H, Berg P. High-efficiency cloning of full-length cDNA. Molecular and Cellular Biology. 1982;2:161–170. doi: 10.1128/mcb.2.2.161. [DOI] [PMC free article] [PubMed] [Google Scholar]
- Pende A, Tremmel KD, DeMaria CT, Blaxall BC, Minobe WA, Sherman JA, Bisognano JD, Bristow MR, Brewer G, Port J. Regulation of the mRNA-binding protein AUF1 by activation of the beta-adrenergic receptor signal transduction pathway. Journal of Biological Chemistry. 1996;271:8493–8501. doi: 10.1074/jbc.271.14.8493. [DOI] [PubMed] [Google Scholar]
- Peng H, Lever JE. Post-transcriptional regulation of Na+/glucose cotransporter (SGLT1) gene expression in LLC-PKL cells. Journal of Biological Chemistry. 1995;270:20536–20542. doi: 10.1074/jbc.270.35.20536. [DOI] [PubMed] [Google Scholar]
- Picker JD, Hall J, Walker D, Hirst BH. Regulation of the human H+/dipeptide cotransporter hPepT1 mRNA. FASEB Journal. 1997;11:A531. [Google Scholar]
- Preiss T, Sang AE, Chrzanowska LZ, Lightowlers RN. The mRNA-binding protein COLBP is glutamate dehydrogenase. FEBS Letters. 1995;367:291–296. doi: 10.1016/0014-5793(95)00569-u. [DOI] [PubMed] [Google Scholar]
- Saito H, Inui K-I. Dipeptide transporters in apical and basolateral membranes of the human intestinal cell line Caco-2. American Journal of Physiology. 1993;265:G289–294. doi: 10.1152/ajpgi.1993.265.2.G289. [DOI] [PubMed] [Google Scholar]
- Saito H, Okuda M, Terada T, Sasaki S, Inui K-I. Cloning and characterisation of a rat H+/peptide cotransporter mediating absorption of β-lactam antibiotics in intestine and kidney. Journal of Pharmacology and Experimental Therapeutics. 1995;275:1631–1637. [PubMed] [Google Scholar]
- Sharp PA, Debnam ES, Srai SKS. Rapid enhancement of brush border glucose uptake after exposure of rat jejunal mucosa to glucose. Gut. 1996;39:545–550. doi: 10.1136/gut.39.4.545. [DOI] [PMC free article] [PubMed] [Google Scholar]
- Shioda T, Ohta T, Isselbacher KJ, Rhoads DB. Differentiation-dependent expression of the Na+/glucose cotransporter (SGLT1) in LLC-PK1 cells: role of protein kinase C activation and ongoing transcription. Proceedings of the National Academy of Sciences of the USA. 1994;91:11919–11923. doi: 10.1073/pnas.91.25.11919. [DOI] [PMC free article] [PubMed] [Google Scholar]
- Thwaites DT, Brown CDA, Hirst BH, Simmons NL. Proton-coupled dipeptide (glycylsarcosine) transport across apical and basolateral borders of human intestinal Caco-2 cell monolayers displays distinctive characteristics. Biochimica et Biophysica Acta. 1993a;1151:237–245. doi: 10.1016/0005-2736(93)90108-c. [DOI] [PubMed] [Google Scholar]
- Thwaites DT, Brown CDA, Hirst BH, Simmons NL. Transepithelial glycylsarcosine transport in intestinal Caco-2 cells mediated by expression of H+-coupled carriers at both apical and basal membranes. Journal of Biological Chemistry. 1993b;268:7640–7642. [PubMed] [Google Scholar]
- Thwaites DT, McEwan GTA, Hirst BH, Simmons NL. Transepithelial dipeptide (glycylsarcosine) transport across epithelial monolayers of human Caco-2 cells is rheogenic. Pflügers Archiv. 1993;425:178–180. doi: 10.1007/BF00374520. [DOI] [PubMed] [Google Scholar]
- Van Beers EH, Al RH, Rings EH, Einerhand AW, Dekker J, Buller HA. Lactase and sucrase-isomaltase gene expression during Caco-2 cell differentiation. Biochemical Journal. 1995;308:769–775. doi: 10.1042/bj3080769. [DOI] [PMC free article] [PubMed] [Google Scholar]
- Williams DL, Sensel M, McTigue M, Binder R. Hormonal and developmental regulation of mRNA turnover. In: Belasco JG, Brawerman G, editors. Control of Messenger RNA Stability. New York: Academic Press; 1993. pp. 161–197. [Google Scholar]
- Yuasa H, Fleisher D, Amidon GL. Noncompetitive inhibition of cephadrine uptake by enalapril in rabbit intestinal brush-border membrane vesicles: An enalapril specific inhibitory binding site on the peptide carrier. Journal of Pharmacology and Experimental Therapeutics. 1994;269:1107–1111. [PubMed] [Google Scholar]
- Zhang W, Wagner BJ, Ehrenman K, Schaefer AW, DeMaria CT, Crater D, De Haven K, Long L, Brewer G. Purification, characterization, and cDNA cloning of an AU-rich element RNA-binding protein, AUF1. Molecular and Cellular Biology. 1993;13:7652–7665. doi: 10.1128/mcb.13.12.7652. [DOI] [PMC free article] [PubMed] [Google Scholar]