

Abstract
Single pacemaker cells were isolated from the sinus venosus of cane toad (Bufo marinus) in order to study the mechanisms involved in the spontaneous firing rate of action potentials. Intracellular calcium concentration ([Ca2+]i) was measured with indo-1 to determine whether [Ca2+]i influenced firing rate. A rapid transient rise of [Ca2+]i was recorded together with each spontaneous action potential. [Ca2+]i at the peak of systole was 655 ± 64 nm and the minimum at the end of diastole was 195 ± 15 nm.
Reduction of extracellular Ca2+ concentration from 2 to 0.5 mm caused a reduction in both systolic and diastolic [Ca2+]i and the spontaneous firing rate also gradually declined.
Application of the acetoxymethyl (AM) ester of BAPTA (10 μm), in order to increase intracellular calcium buffering, caused a decline in systolic and diastolic [Ca2+]i. The firing rate declined progressively until the cells stopped firing after 10–15 min. At the time that firing ceased, the diastolic [Ca2+]i had declined by 141 ± 38 nm.
In the presence of ryanodine (2 μm), which interferes with Ca2+ release from the sarcoplasmic reticulum, the systolic and diastolic [Ca2+]i both declined and the firing rate decreased until the cells stopped firing. At quiescence diastolic [Ca2+]i had declined by 93 ± 20 nm.
Exposure of the cells to Na+-free solution caused a rise in [Ca2+]i which exceeded the systolic level after 4.8 ± 0.3 s. This rise is consistent with Ca2+ entry on a Na+-Ca2+ exchanger.
Rapid application of caffeine (10–20 mm) to cells clamped at −60 mV caused a rapid increase in [Ca2+]i which then spontaneously declined. An inward current with a similar time course to that of [Ca2+]i was also generated. Application of Ni2+ (5 mm) or 2,4-dichlorobenzamil (25 μm) reduced the amplitude of the inward current produced by caffeine by 96 ± 1 % and 74 ± 10 %, respectively. In a Na+-free solution the caffeine-induced current was reduced by 93 ± 7 %.
Under a variety of circumstances the diastolic [Ca2+]i showed a close association with pacemaker firing rate. The existence of a Na+-Ca2+ exchanger and its estimated contribution to inward current during the pacemaker potential suggest that the Na+-Ca2+ exchange current makes a contribution to pacemaker activity.
The regular spontaneous firing of the heart arises in specialized pacemaking regions: the sinoatrial node in mammals and the sinus venosus in amphibians. Spontaneously active pacemaker tissues exhibit a slowly depolarizing potential during diastole, the pacemaker potential, which triggers an action potential when a threshold potential is exceeded. This slow depolarization requires the presence of net inward current during the pacemaker potential. Several inward currents have been proposed to contribute to the pacemaker current; these include the hyperpolarization-activated cation current (If) (for review see DiFrancesco, 1993), background Na+ current (Hagiwara, Irisawa, Kasanuki & Hosoda, 1992), persistent Na+ current (Ju, Saint & Gage, 1996), L- and T-type Ca2+ currents (ICa(L), ICa(T), Hagiwara, Irisawa & Kameyama, 1988), and the sustained inward current (Guo, Ono & Noma, 1995). In addition the delayed rectifier current (IK, an outward potassium current) will decay during diastole and, in combination with a constant or background inward current, could contribute to pacemaker currents. At present there is no consensus on which of these currents makes the major contribution to pacemaking activity (compare DiFrancesco, 1993 and Irisawa, Brown & Giles, 1993) and it is likely that several currents are involved and that their relative importance varies in different species.
Intracellular calcium concentration ([Ca2+]i) has been proposed as an important factor in cardiac pacemaking activity (DiFrancesco & Noble, 1985; Campbell, Rasmusson & Strauss, 1992). [Ca2+]i is known to influence the rate of inactivation of ICa(L) (Irisawa et al. 1993) and to modulate If (Hagiwara & Irisawa, 1989). A recent study also suggested that [Ca2+]i may be important in the regulation of IK (Nitta, Furukawa, Marumo, Sawanobori & Hiraoka, 1994). In addition the sustained inward current is increased by lowering extracellular [Ca2+] (Guo et al. 1995). Therefore [Ca2+]i could indirectly influence the firing rate. However perhaps most important is that [Ca2+]i is one of the factors which determines the magnitude of the Na+-Ca2+ exchanger. Early evidence for the existence of a Na+-Ca2+ exchanger current (INa,Ca) in rabbit pacemaker cells came from measurement of two components of inward current in response to depolarization, the second being proposed to be INa,Ca (Brown, Kimura, Noble, Noble & Taupignon, 1984). These ideas were extended in studies of latent pacemaker cells in the cat atrium which exhibit secondary slow inward currents and tail currents characteristic of INa,Ca (Zhou & Lipsius, 1993). Nevertheless, the role of INa,Ca as a pacemaker current remains controversial even though its presence is often assumed for modelling purposes (DiFrancesco & Noble, 1985; Rasmusson, Clark, Giles, Shibata & Campbell, 1990). For instance, Janvier & Boyett (1996) in a review of the role of INa,Ca in mammalian cardiac cells concluded that the evidence for its role in pacemaker cells was weak.
Despite the importance of [Ca2+]i to pacemaker currents, the only extensive studies of [Ca2+]i in pacemaker cells to date are in rabbit atrioventricular cells (Hancox, Levi & Brooksby, 1994) and in the latent pacemaker cells of the cat atrium (Bassani, Bassani, Lipsius & Bers, 1997). Several factors suggest that the regulation of [Ca2+]i in the pacemaker cells will differ from the well-established patterns in ventricular and atrial myocytes. First, the SR is relatively sparse in pacemaker cells and, particularly in amphibian hearts, it is thought that the Ca2+ required for activation is largely derived from the ICa (Chapman, 1979; Rasmusson et al. 1990). Second, there are no T-tubules (Moore, Clark, Shibata & Giles, 1986) so that the spread of activation into the interior of the cell is likely to be slow. Third, there are relatively few myofilaments so that the component of Ca2+ buffering caused by troponin is likely to be less.
In the present study we used the fluorescent Ca2+ indicator indo-1 to monitor [Ca2+]i in single spontaneously beating pacemaker cells. We found that diastolic [Ca2+]i is closely associated with the firing rate and that there is a very active Na+-Ca2+ exchanger in these pacemaker cells. These results support and extend the proposal that INa,Ca produces an inward current during the pacemaker potential which contributes to pacemaking activity.
METHODS
Isolation of pacemaker cells
Toads (Bufo marinus) were killed by decapitation and pithed. The heart was rapidly removed and the sinus venosus was carefully dissected free under a dissection microscope. Single pacemaker cells were isolated using collagenase and elastase as previously described (Ju, Saint, Hirst & Gage, 1995; Ju et al. 1996). The cells were routinely superfused with the following solution (mm): 110 NaCl, 2.5 KCl, 0.5 MgSO4, 2 CaCl2, 10 NaHepes and 10 glucose; pH 7.3; equilibrated with air. All experiments were at room temperature (22°C).
Drugs were dissolved in H2O except for the acetoxymethyl (AM) ester of 1,2-bis(O-aminophenoxy)ethane-N,N,N‘,N’-tetraacetic acid (BAPTA), which was dissolved in dimethylsulphoxide (DMSO). At the concentration of BAPTA AM used the DMSO was 0.1 % and this concentration of DMSO alone had no significant effect on the firing rate of pacemaker cells.
Fluorescence measurements
After isolation, cells were loaded with Ca2+ indicator by a 15 min exposure to 5 μm indo-1 AM at room temperature. The loaded cells were allowed to settle onto glass coverslips which were coated with poly-l-lysine in a recording chamber. The recording chamber was mounted on an inverted microscope and the cell observed through an oil-immersion, ×40, NA 1.3 objective. Cells were superfused for 30 min after loading to allow time for hydrolysis of the indo-1 AM and to wash out residual indo-1 AM from the recording chamber. Typically 10–20 % cells would recover spontaneous activity after loading with indo-1 AM.
For fluorescence measurements cells were illuminated at 360 ± 5 nm with a UV light source. To minimize bleaching cells were only illuminated during the experimental procedures and a neutral density filter which reduced the illumination intensity by 30-fold was used. The emitted fluorescence was guided to two photomultiplier tubes with either a 400 ± 5 nm or a 510 ± 5 nm interference filter in front of their photocathodes. Collected light was restricted to the cell area by a rectangular diaphragm and the background light (cell absent) was noted at each wavelength (BG400 and BG510). Emitted fluorescence at 400 nm (F400) and 510 nm (F510) was sampled at 50 Hz and displayed on a computer screen. The indo-1 ratio (F400 - BG400)/(F510 - BG510) was calculated and displayed in real time. The emitted fluorescence was routinely filtered with a 10 Hz low-pass filter. In preliminary experiments we compared the magnitude and time course of Ca2+ transients recorded with 100 Hz and 10 Hz filters and there was no obvious difference.
Calibration of indo-1
The whole-cell patch clamp technique was used to calibrate the indo-1 ratio. [Ca2+]i in the cells was set to various known levels by the use of highly buffered solution within the patch electrodes. The pipette solution for internal dialysis contained (mm): 90 KCl, 10 KH2PO4, 10 TES, 5 Na2ATP, 2 MgSO4 and 0.4 indo-1; pH 7.3. Calcium buffers made by mixing EGTA and CaEGTA (40 mm) in different proportions were added to the pipette solutions. The fluorescence measurements for this purpose were restricted to a small fraction of the cell volume by reducing the size of the rectangular diaphragm to about 20 × 20 μm and positioning it close to the tip of the pipette. This manoeuvre restricted the observed area to that with the highest buffer concentration and excluded most of the indo-1 in the pipette from the measurement region. Fluorescence from the pipette was further reduced by making the background measurements with the pipette patched onto the cell but prior to rupturing the patch membrane. Under these conditions the emitted fluorescence and the ratio had reached steady values within 10 min of cell access. The effects of Na+-Ca2+ exchanger on [Ca2+]i were minimized by using a holding potential close to the reversal potential for the Na+-Ca2+ exchanger calculated by ENa-Ca= 3 ENa - 2Eca (Bassani, Bassani & Bers, 1995). The ratio for lowest achievable [Ca2+]i (Rmin) was obtained with a pipette solution containing 40 mm EGTA and was 0.11 ± 0.008 (n= 8). The ratio for a saturating [Ca2+]i (Rmax) was obtained with a pipette solution containing 40 mm CaEGTA and 1 mm CaCl2 and was 1.94 ± 0.11 (n= 6). Figure 1 shows the collected values from eight calibration experiments with a range of buffered [Ca2+]i. The smooth line is a least squares fit of the theoretical relation between [Ca2+]i and the indo-1 ratio (R) and is of the form (Grynkiewicz, Poenie & Tsien, 1985):
| (1) |
where β is the ratio of F510 at very low and saturating [Ca2+]i and Kd is the apparent dissociation constant of indo-1 for Ca2+ in the intracellular environment. The smooth line in Fig. 1 gives a value of Kdβ of 1720 ± 130 nm. To calculate β the method described by Bakker, Head, Williams & Stephenson (1993) was used. Briefly F510 was plotted against F400 using data from spontaneously active cells. The slope (m) of this plot was then used to determine β using the following equation:
| (2) |
This method gave β= 2.84 ± 0.74 (n= 9) and hence Kd= 606 nm. Similar calibrations were carried out in vitro (150 mm KCl, pH 7.3) and gave the following values: Rmin= 0.024, Rmax= 1.23, β= 4.35, Kd= 295 nm. This value of Kd is close to the published value of 250 nm in simple ionic solution (Grynkiewicz et al. 1985). Thus the properties of indo-1 change substantially in the intracellular environment as previously shown (Westerblad & Allen, 1993; Bassani et al. 1995). The indo-1 ratios were converted to [Ca2+]i using the intracellular values of Rmin, Rmax, β and Kd given above in combination with eqn (1).
Figure 1. The calibration of intracellular indo-1.
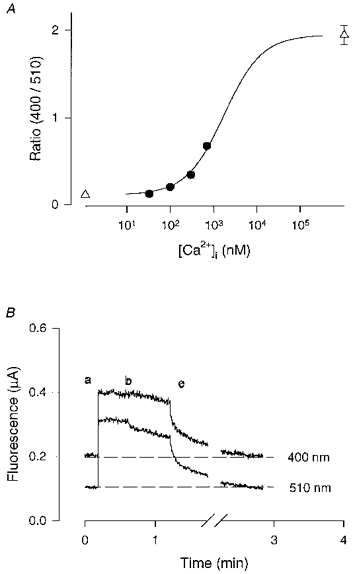
A, the whole-cell patch clamp technique was used to buffer the cell [Ca2+] to various levels set by Ca2+-EGTA buffers in the patch pipette. The pipette also contained 400 μm indo-1. •, means ± s.e.m of experimental data from at least 5 cells for each point (error bars in most cases smaller than symbols). ▵, ratios achieved with EGTA alone (Rmin) and Ca2++ CaEGTA (Rmax). The continuous line is the least squares fit of eqn (1) to the data points and gave a Kdβ= 1720 ± 130 nm. B, the decline of fluorescence at 400 and 510 nm (F400 and F510) after breaking the membrane of a cell loaded with indo-1 AM. The labels in the figure represented background (a); the F400 and F510 from an indo-1 AM loaded cell before (b) and after breaking the cell membrane (c). F510 signal was shifted down by 0.5 unit to help distinguish the two traces.
It is known that indo-1 AM can load into mitochondria and possibly other intracellular organelles (Miyata, Silverman, Sollott, Lakatta, Stern & Hansford, 1991). If this were the case in the pacemaker cells then the calibration procedure, which is based on indo-1 located entirely in the myoplasm, might be in error. To test for this possibility we patched onto indo-1 AM loaded cells, made intracellular contact and then removed the patch clamp electrode to leave a cell with a damaged membrane. Figure 1B shows the background fluorescence before loading (a), the F400 and F510 from the indo-1 AM loaded cell (b) and the time course of decline of F400 and F510 after the patch electrode was removed at (c). Note that F400 and F510 decline to the original fluorescence level within 2 min. In three cells the half-time of decline averaged 7 s and only 0–2 % of the loaded signal remained after 3 min. Thus all the indo-1 appeared to leave the cell rapidly and there was no evidence for indo-1 trapped in intracellular organelles.
The indo-1 concentration was estimated by the method described by Westerblad & Allen (1993). This showed the intracellular indo-1 concentration to be in the range 150–200 μm. This level is sufficiently high to contribute to intracellular Ca2+ buffering but in these small cells this level of loading was required for an adequate signal-to-noise ratio. This relatively high level may also explain why only a small fraction of cells were spontaneously active since we show in the results that further increase in intracellular Ca2+ buffering with BAPTA slows the firing rate.
Patch-clamp procedure
The nystatin perforated-patch technique was used for recording spontaneous action potentials and the Na+-Ca2+ exchange current. The pipette solution for recording action potentials contained (mm): 100 KCl, 10 KH2PO4, 10 TES, 5 Na2ATP, 2 MgSO4; pH 7.3. The pipette solution for recording Na+-Ca2+ exchange current contained 100 caesium aspartate, 10 tetraethylammonium chloride, 10 TES, 5 Na2ATP, 2 MgCl2; pH 7.3. Nystatin (240 μm) was added to the pipette. Membrane potentials were corrected for liquid junction potentials (Barry & Lynch, 1991). An Axopatch-200A amplifier (Axon Instruments) was used in either current or voltage clamp mode to record membrane potentials or currents. When [Ca2+]i was measured simultaneously with the action potential or current, data were sampled at 50 Hz. For measurements of the action potential alone, sample rate was 500 Hz.
Data analysis
All values are quoted as means ±s.e.m. with the number of cells tested as n. Statistical significance was established by Student's paired t tests and results with P < 0.05 were regarded as significant. Firing rates were generally calculated as the mean over a 30 s period.
RESULTS
The measurements of action potentials and [Ca2+]i in spontaneously beating pacemaker cells
The nystatin perforated-patch technique was used to simultaneously record action potentials and Ca2+ signals from isolated single pacemaker cells. Figure 2 shows a representative example. Action potentials (n= 5) had a maximum diastolic potential of -48 ± 3 mV, a peak of +32 ± 4 mV and a maximum rate of rise of 5.1 ± 1.0 V s−1. We found that a rapid transient rise of [Ca2+]i occurred with each spontaneous action potential as shown in Fig. 2. In forty-seven cells, the minimum [Ca2+]i during diastole was 195 ± 15 nm, while systolic peak of [Ca2+]i was 655 ± 64 nm. The average firing rate of spontaneously active cells was 31 ± 2 min−1 but the rate was often quite variable (e.g. Fig. 3). The time from the first detectable rise of [Ca2+]i to the peak [Ca2+]i was 350 ± 20 ms. The decline of the [Ca2+]i signal from 100 ms after the peak was roughly exponential with a time constant of 470 ± 30 ms (see Fig. 3C). A superimposed action potential and Ca2+ transient from another cell is shown in Fig. 2B. Note that the [Ca2+]i is falling slowly throughout diastole and that the early diastolic [Ca2+]i is 50–100 nm higher than the diastolic minimum.
Figure 2. Simultaneously recorded action potentials and [Ca2+]i signals from a spontaneously firing toad pacemaker cell.
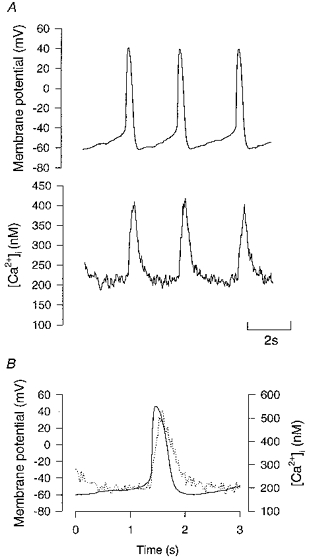
A, simultaneously recorded action potentials (upper panel) and calcium transients (lower panel). Action potentials were recorded using the nystatin perforated-patch technique and have been corrected for the calculated liquid junction potentials (−5 mV). B, superimposed action potential and [Ca2+]i from a different cell from A. The action potential data has been smoothed with 10 Hz low-pass filter to match the filtering of the [Ca2+]i signal.
Figure 3. The effect of low [Ca2+]o on the [Ca2+]i and firing rate of a toad pacemaker cell.

A, continuous record of [Ca2+]i (lower panel) during exposure to reduced extracellular Ca2+ concentration (reduced from 2 to 0.5 mm). Upper panel shows the instantaneous, spontaneous firing rate calculated from the interval between each Ca2+ transient. B and C, the correlation between firing rate and diastolic [Ca2+]i (B) and systolic [Ca2+]i (C). The symbols represent different experiments (n= 5). The values of correlation coefficient (r) are shown on each panel and are statistically significant (P < 0.05).
[Ca2+]i is closely associated with firing rate
As indicated in the Introduction, there are a number of suggestions that the firing rate of pacemaker cells is influenced by [Ca2+]i. We therefore changed [Ca2+]i by a variety of interventions and examined the effects on firing rate.
When extracellular Ca2+ concentration was reduced from 2 to 0.5 mm, the systolic and diastolic [Ca2+]i fell as did the associated firing rate (Fig. 3). In five such experiments diastolic [Ca2+]i fell by 30 ± 5 nm, systolic [Ca2+]i fell by 188 ± 52 nm while the spontaneous firing rate gradually fell from 24 ± 3.9 to 14 ± 2.5 min−1. Figure 3B shows the correlation between the decline in diastolic [Ca2+]i and firing rate while Fig. 3C shows the equivalent for systolic [Ca2+]i. It has been suggested that [Ca2+]i could modulate firing rate by either modulating pacemaker currents, such as ICa(L), ICa(T) or If (Hagiwara & Irisawa, 1989), or by activating the Na+-Ca2+ exchanger, which would provide an inward current which contributed to diastolic depolarization (Zhou & Lipsius, 1993). If, however, seems to be absent from toad pacemaker cells (Ju et al. 1995). We propose that lower [Ca2+]i could slow the firing rate by reducing INa,Ca. However, one could still argue that lower extracellular Ca2+ may affect firing rate by reducing Ca2+ currents (ICa(L), ICa(T)) rather than simply reduce Na+-Ca2+ exchange current due to lower [Ca2+]i. Therefore it is necessary to test if a similar result could be obtained by changing [Ca2+]i using different methods.
Increasing intracellular calcium buffering will tend to reduce and slow changes of [Ca2+]i and will also cause a temporary reduction in steady [Ca2+]i levels. To achieve this we added 10 μm BAPTA AM to the superfusate. After a few minutes reductions in the magnitude and time course of the Ca2+ transients were apparent and eventually Ca2+ transients were undetectable (Fig. 4A). In five experiments after 5 min exposure to BAPTA AM, there was a fall in the diastolic [Ca2+]i of 99 ± 34 nm, a fall in systolic [Ca2+]i of 270 ± 55 nm and a reduction in the firing rate by 15 ± 3 min−1. Cells became quiescent after 7–15 min and at this time the diastolic [Ca2+]i had fallen by 141 ± 38 nm. Figure 4C and D confirms that for all cells studied in this way there was a good correlation between either systolic and diastolic [Ca2+]i and firing rate. To establish that the action potential firing rate followed the same pattern as the Ca2+ transients, in three experiments we recorded action potentials from cells which had not been loaded with indo-1. In each of these cells the firing rate slowed and stopped as shown in Fig. 4B.
Figure 4. The effect of exposure to BAPTA AM on the [Ca2+]i and the spontaneous action potential recorded from different toad pacemaker cells.

A, [Ca2+]i recorded under control and after 5 and 8 min exposure to 10 μm BAPTA AM. B, the effects of BAPTA AM on spontaneous action potential were recorded from a non-indo loaded cell. The panels show control, 5 and 8 min exposure. C and D, the correlations between firing rate and [Ca2+]i from 12 measurements of 5 cells. C shows diastolic [Ca2+]i and D shows systolic [Ca2+]i. The correlation coefficients are shown (r) on each panel and are statistically significant (P < 0.01).
It is well established that ryanodine changes [Ca2+]i through its effects on SR Ca2+ release channels (Anderson, Lai, Liu, Rousseau, Erickson & Meissner, 1989). It has also previously been reported that ryanodine reduces firing rate when applied to mammalian pacemaker cells (Rubenstein & Lipsius, 1989; Zhou & Lipsius, 1993). However it is widely believed that frog heart does not contain a functionally important SR (Chapman, 1979; Rasmusson et al. 1990) so it is not clear whether similar results would occur in amphibian pacemaker cells. Here we carried out experiments to see whether ryanodine affects [Ca2+]i and firing rate in toad pacemaker cells (Fig. 5). Figure 5A shows the changes in [Ca2+]i and firing rate for a representative cell. In eight cells in the presence of 2–10 μm ryanodine, the diastolic [Ca2+]i first slightly increased by 62 ± 10 nm in the first minute of exposure (not shown). Over this period the systolic [Ca2+]i did not change significantly while the spontaneous firing rate accelerated by 8.7 ± 1.5 min−1. Over the next 10 min, diastolic [Ca2+]i decreased by 102 ± 15 nm, systolic [Ca2+]i decreased by 327 ± 70 nm while the firing rate slowed by 11.5 ± 2 min−1 (all measured from the original control values). After 15–30 min the Ca2+ transients were undetectable and at this time the diastolic [Ca2+]i had decreased by 93 ± 20 nm. We also performed three independent experiments recording action potentials from unloaded cells and in each of these experiments the firing rate of the action potentials slowed and then stopped (Fig. 5B). Figure 5C and D shows the correlation between diastolic and systolic [Ca2+]i and firing rate for all the cells examined.
Figure 5. The effects of 10 μm of ryanodine on the [Ca2+]i and the spontaneous action potential from different toad pacemaker cells.
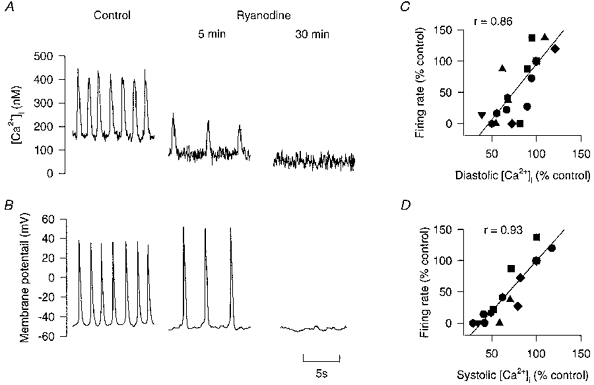
A, [Ca2+]i recorded under control and after 5 and 30 min exposure to ryanodine (10 μm). B, the effects of ryanodine on spontaneous action potentials were recorded from a non-indo loaded cell. The panels show control and 5 and 30 min exposure. C and D, the correlations between firing rate and [Ca2+]i from 14 measurements of 8 cells. C shows diastolic [Ca2+]i and D shows systolic [Ca2+]i. The correlation coefficients are shown (r) on each panel and are significant (P < 0.01).
The effect of ryanodine on the firing rate suggests that [Ca2+]i influences one of the pacemaker currents and one possibility is INa,Ca. Existence of a Na+-Ca2+ exchanger in pacemaker cells is often assumed for modelling purposes (DiFrancesco & Noble, 1985; Rasmusson et al. 1990) and can provide the additional inward current required to make these models spontaneously active. While there is good evidence for INa,Ca in cat latent pacemaker cells (Zhou & Lipsius, 1993), the role of INa,Ca in other pacemaker cells is equivocal (e.g. Janvier & Boyett, 1996) and we therefore sought more detailed evidence for its existence and magnitude in the toad pacemaker cells.
Na+-Ca2+ exchanger and exchange current in sinus venosus cells
In order to demonstrate that Na+-Ca2+ exchanger exists in sinus venosus pacemaker cells, we exposed pacemaker cells to Na+-free solution (substituted with equimolar N-methyl-D-glucamine). In cells with a Na+-Ca2+ exchanger this manoeuvre leads to a rise in [Ca2+]i as Na+ leaves the cell and Ca2+ enters (Allen, Eisner, Lab & Orchard, 1983). Figure 6 shows a representative result from a pacemaker cell. Application of Na+-free solution leads to a rapid rise in [Ca2+]i which exceeded the preceding systolic [Ca2+]i level. The time for [Ca2+]i to reach systolic level averaged 4.8 ± 0.4 s (n= 6). Restoration of normal Na+ solution caused a very rapid recovery of [Ca2+]i and the cell immediately resumed firing, initially at an increased rate. Hancox et al. (1994) also reported an increase in [Ca2+]i when Na+ was removed in atrioventricular node cells but in their preparation the rise time was much slower (∼80 s). During the influx of Ca2+, the SR and cell buffers will take up Ca2+ and reduce the rate of rise of [Ca2+]i. Thus a clearer indication of the maximum rate of influx of Ca2+ is obtained if the SR is made ineffective by ryanodine. Figure 6B shows that the rate of rise of [Ca2+]i is about twice as fast after application of ryanodine and supports the buffering role of SR on Ca2+ influx.
Figure 6. The effect of Na+-free solution on [Ca2+]i recorded from a toad pacemaker cell.

Extracellular Na+ was replaced by N-methyl glucamine. A, application of Na+-free solution abolishes spontaneous firing and causes a rapid increase in [Ca2+]i. B, superimposed records of [Ca2+]i on exposure to Na+-free solution from the same cell before and after 30 min exposure to 2 μm ryanodine.
The above experiment provides evidence for the existence of a Na+-Ca2+ exchanger in isolated pacemaker cells. To investigate the magnitude of the exchange current, the inward current associated with Ca2+ released from intracellular stores was studied using rapid application of caffeine to trigger SR Ca2+ release (Callewaert, Cleemann & Morad, 1989; Delbridge, Bassani & Bers, 1996).
The nystatin perforated-patch technique was used in order to minimize current rundown and changes in the intracellular environment. After forming a whole-cell configuration, both membrane current at −60 mV and Ca2+ signals were recorded. Rapid application of 10–20 mm caffeine induced an inward current as shown in Fig. 7A. In twelve cells, caffeine caused an increase in [Ca2+]i of 1142 ± 48 nm which declined in the continuing presence of caffeine with an approximately exponential time course (time constant, 0.81 ± 0.13 s) and induced a peak inward current of 154 ± 32 pA. The shape and time course of the two are similar though the current has a slightly faster time course than the intracellular Ca2+ signal (see Fig. 9A).
Figure 7. Inward current and [Ca2+]i induced by rapid application of 10 mm caffeine.

The nystatin perforated-patch technique was used to record the whole-cell current. A Cs+-rich solution was used in the pipette to block K+ currents as described in the method section. The cell was voltage clamped at −60 mV. A, rapid application of 10 mm caffeine induced an inward current (upper panel) with the time course similar to that of [Ca2+]i (lower panel). Line drawn through declining phase of [Ca2+]i is an exponential fit whose time constant (τ) is shown. B, caffeine and 5 mm Ni2+ applied simultaneously. The inward current was largely blocked while the [Ca2+]i increase was larger but declined more slowly. Exponential fit to early [Ca2+]i decline is shown by line and time constant (τ).
Figure 9. Relations between the caffeine-induced inward current and the [Ca2+]i.

 |
Identity of the caffeine-induced inward current
To establish the nature of the inward current induced by caffeine a variety of experiments were performed. We first tested two inhibitors of Na+-Ca2+ exchange, Ni2+ and 2,4-dichlorobenzamil (DCB; O'Neill, Valdeolmillos & Eisner, 1988; Kleyman & Cragoe, 1988). When 5 mm Ni2+ was added to the external solution, the caffeine-induced transient inward current was largely suppressed although the experiment shown in Fig. 7B shows a small and short-lived inward current. This current may be the initial part of an INa,Ca before the inhibitory effect of Ni2+ was fully developed. On average the peak inward current was reduced by 96 ± 1 % (n= 5) by 5 mm Ni2+. In the presence of Ni2+, the time course of decay of the caffeine-induced increase of [Ca2+]i also became much slower but remained approximately exponential with a time constant (τ) = 21.4 ± 4.1 s (n= 5). These observations are consistent with the current and the decline of [Ca2+]i both being caused by INa,Ca. DCB at 25 μm reduced the inward current by 74 ± 10 % (n= 5) which fits well with the reported EC50 of 17 μm for DCB inhibition of Na+-Ca2+exchange (Kleyman & Cragoe, 1988). We found that DCB fluoresced at 400 nm, which interfered with the indo-1 ratio, so it was not possible to make simultaneous [Ca2+]i measurements. To test whether caffeine might directly activate a current, caffeine was applied and then reapplied to a cell within 20 s before the SR was able to reaccumulate Ca2+ (Fig. 8A). Under these conditions application of caffeine produced only a very small elevation of [Ca2+]i and inward current. This experiment shows that the inward current depends on an elevated [Ca2+]i and is not directly caused by caffeine. It also shows a proportionality between the caffeine-induced peak inward current and peak [Ca2+]i.
Figure 8. Evidence that the inward current induced by caffeine is Na+-Ca2+ exchange current.
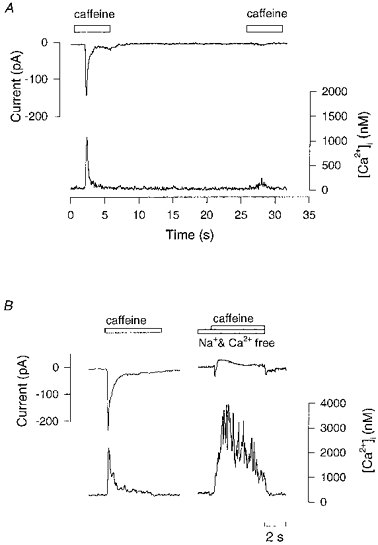
An indo-1 loaded cell was voltage clamped at −60 mV. A, first application of caffeine (10 mm) induced a typical inward current and rise in [Ca2+]i. Reapplication of caffeine after 20 s caused only a small [Ca2+]i increase and a small inward current. B, control caffeine application on the left. Right hand panel shows same cell after 5 s perfusion with Na+- and Ca2+-free solution. Caffeine application under these conditions caused a greatly reduced inward current while the [Ca2+]i increase was larger and declined more slowly.
The inward current induced by caffeine also was dependent on extracellular Na+. This was tested by replacing extracellular Na+ with N-methyl-D-glucamine; extracellular Ca2+ was also reduced to zero to minimize the rise in [Ca2+]i associated with zero Na+ solutions (Fig. 6). Under these conditions the caffeine-induced current was greatly reduced (Fig. 8B). This experiment in fact shows a small outward current on application of caffeine but this was not usually seen and may be a small movement artefact because these cells contract when caffeine is applied. On average the caffeine-induced inward current was reduced by 93 ± 7 % in the absence of extracellular Na+ but the caffeine-induced [Ca2+]i was increased in amplitude and declined much more slowly. Note that there is a small inward current when control solution was reperfused presumably caused by reactivation of the INa,Ca when external Na+ was replaced.
Figure 9 shows a simultaneously recorded Ca2+ transient and inward current, both recorded with a 10 Hz low-pass filter. Note that the caffeine-induced inward current precedes the [Ca2+]i by about 100 ms as noted previously in other cell types (Callewaert et al. 1989; Trafford, Diaz, O'Neill & Eisner, 1995). Callewaert et al. (1989) suggested that the lag was caused by the slow kinetics of indo-1; however the delays due to indo-1 are only of the order of 5–10 ms (Westerblad & Allen, 1996) and we think it more likely that the delay is because the inward current is triggered by the rise of [Ca2+]i close to the surface membrane whereas it takes some time for caffeine to diffuse to the interior of the cell and trigger Ca2+ release there (Trafford et al. 1995). Because of the differences in time course a plot of current against [Ca2+]i (Fig. 9C) is a loop rather than the near-linear relation predicted by models of INa,Ca (DiFrancesco & Noble, 1985). If the amount of Ca2+ release from the SR was modulated by reapplying caffeine before the SR had completely refilled, then it is possible to see the inward current provoked by much smaller [Ca2+]i signals, as shown in the experiment of Fig. 8A. Figure 9B shows the results obtained in this way with three cells and the linear regression through these points has a slope of 0.16 ± 0.02 pA nm−1 and predicts a INa,Ca of 24 ± 2 pA at the resting [Ca2+]i of 200 nm. Another way to estimate the magnitude of the INa,Ca is to use a model such as that described by Rasmussen et al. (1990). The solution to their model is shown as the lower (dotted) line in Fig. 9C (for details see figure legend). Clearly their model does not fit our data well and the upper (dashed) line shows a version of their model fitted to the mean peak current and peak [Ca2+]i induced by caffeine. This line has had the scaling factor KNa,Ca (see legend to Fig. 9) increased 11-fold and has a mean slope of 0.15 pA nm−1 and predicts an inward INa,Ca of 13 pA at the resting [Ca2+]i of 200 nm.
DISCUSSION
Intracellular Ca2+ in pacemaker cells
In this study we measured [Ca2+]i in isolated spontaneously beating sinus venosus pacemaker cells from the cane toad Bufo marinus. We found that toad sinus venosus pacemaker cells have a Ca2+ transient caused by triggered release of Ca2+ from the SR as shown by reduced Ca2+ release with ryanodine and stimulated release with caffeine. This finding is in contrast to the view that the functional SR Ca2+ release is of minimal importance in amphibian hearts (Chapman, 1979; Rasmusson et al. 1990). The importance of this finding is that interventions and neurotransmitters which affect the SR Ca2+ loading may potentially affect [Ca2+]i and cell functions which are dependent on [Ca2+]i. We also found strong evidence for Na+-Ca2+ exchange and the magnitude of the associated INa,Ca suggests it will be important in the pacemaker activity.
Our results show a number of differences from the widely studied [Ca2+]i levels in ventricular cells. (i) The time course of the calcium transients is very slow in these cells. For instance the time to peak was 350 ms which compares with around 50 ms in rabbit atrioventricular cells (Hancox et al. 1994) and rat ventricular cells (Callewaert et al. 1989). The slow time to peak [Ca2+]i probably reflects (a) the fact that sinus venosus pacemaker cells lack T-tubules (Moore et al. 1986), (b) a slower time course of Ca2+ release in amphibian hearts (Chapman, 1979) and (c) the fact that our experiments were at 22°C. (ii) Toad pacemaker cells appear to have a relatively high diastolic [Ca2+]i. In cells firing spontaneously at 30 min−1 minimum diastolic [Ca2+]i was about 195 nm, which compares with values of around 50 nm in mammalian ventricular cells at the same frequency (Frampton, Orchard & Boyett, 1991). However a recent measurement of resting [Ca2+]i in rabbit ventricular cells (Bassani et al. 1995) obtained a value of 295 nm using an intracellular value for the Kd of indo-1 (844 nm) so the difference may be methodological rather than real. In our pacemaker cells during a rest of 1–2 min [Ca2+]i declined to about 100 nm. This observation suggests that the high diastolic [Ca2+]i in spontaneously active cells may represent leakage of Ca2+ from the SR whose Ca2+ load decreases during quiescence (Bassani et al. 1997). (iii) The fact that Ni2+, which blocks the Na+-Ca2+ exchanger, greatly slowed decline of [Ca2+]i on caffeine application (Fig. 7) suggests that Na+-Ca2+ exchange is a major extrusion mechanism for Ca2+ in pacemaker cells. The very slow rate of decline of Ca2+ when caffeine was applied in the presence of Ni2+ also suggests that other Ca2+ extrusion mechanisms (mitochondrial Ca2+ uptake and surface membrane Ca2+ pump) have a very minor role in this preparation (compare with Varro, Negretti, Hester & Eisner, 1993).
[Ca2+]i and firing rate
Three different interventions which changed [Ca2+]i each caused changes in the firing rate. On first principles, one would predict that diastolic [Ca2+]i would be of greater importance to firing rate since it is presumably this level which influences the pacemaker currents. Furthermore, the effect of [Ca2+]i on the INa,Ca will be smaller during systole than during diastole because of voltage dependence of the exchanger. On the other hand, when the systolic [Ca2+]i is elevated systolic current may be modified and the early diastolic [Ca2+]i is likely to be elevated so that systolic [Ca2+]i might exert some effect on the pacemaker potential. In fact the correlations between systolic and diastolic [Ca2+]i and firing rate in Figs 3, 4 and 5 were similar.
Reduction of extracellular calcium produced the expected fall in both systolic and diastolic [Ca2+]i and a significant slowing of firing rate. However the interpretation of this experiment is complicated by the reduction in ICa(L) and ICa(T) which this intervention will produce. The final two interventions, BAPTA and ryanodine, were both shown to reduce systolic and diastolic [Ca2+]i substantially and slowed the firing rate to quiescence. BAPTA is not thought to directly affect any pacemaker current so it seems likely that its effect on firing rate is an indirect one, i.e. the reduced [Ca2+]i leads to changes in a pacemaker current. Most of the effects of ryanodine on currents are also thought to be caused by changes in [Ca2+]i but a very recent paper by Li, Qu & Nathan (1997) suggests that ryanodine may, in addition, have a direct inhibitory effect on ICa(T). Rigg & Terrar (1996), found that both ryanodine and cyclopiazonic acid, an inhibitor of the SR Ca2+-ATPase which causes SR Ca2+ depletion, caused a decline in the firing rate of the isolated guinea-pig sinoatrial node. Thus three interventions which lower [Ca2+]i by quite different mechanisms (BAPTA, ryanodine and cyclopiazonic acid) all reduce the firing rate.
Given that lowering [Ca2+]i in cane toad pacemaker cells slows the firing rate, what are the possible mechanisms? As mentioned in the introduction, a number of currents in pacemakers cells have been reported to be Ca2+ sensitive. The magnitude of ICa(L) will tend to increase as [Ca2+]i falls so this effect is in the wrong direction to explain our observations. If is reduced by a fall in [Ca2+]i but Bufo marinus pacemaker cells have been reported not to have any If (Ju et al. 1995). The IK in guinea-pig ventricular muscle has been reported to be [Ca2+]i sensitive and a reduction of [Ca2+]i will reduce this current (Nitta et al. 1994). This suggests that the outward IK during the pacemaker potential could be smaller so that the firing rate should increase. The sustained inward current is increased when extracellular [Ca2+] is lowered (Guo et al. 1995) and thus this would be expected to increase the firing rate. Thus these two latter effects are the opposite of what we observe. One possibility is ICa(T) because this current has been shown to decrease when [Ca2+]i falls, potentially slowing the firing rate if ICa(T) is a pacemaker current (Tseng & Boyden, 1991). This current has been described in frog sinus venosus cells but it was fully inactivated in the steady state at −45 mV with an inactivation time constant of 20–40 ms (Bois & Lenfant, 1991). Thus with the maximum diastolic potential at around −48 mV in these cells the current would be largely inactivated. In addition the current is only marginally [Ca2+]i sensitive: a reduction in patch pipette [Ca2+] from 200 nm to 0.1 nm only halved the ICa(T) (Tseng & Boyden, 1991). These considerations suggest that ICa(T) may have only a minor role as a Ca2+-sensitive pacemaker current. The main possibility is that changes in diastolic [Ca2+]i cause proportional changes in inward INa,Ca so that a decrease in [Ca2+]i would cause a reduced pacemaker current and therefore a decrease in the firing rate (Zhou & Lipsius, 1993).
Na+-Ca2+ exchange current
The present experiments demonstrate the presence and magnitude of the Na+-Ca2+ exchanger in toad sinus venosus pacemaker cells. Both the rapid rise of [Ca2+]i on removal of external Na+ and the generation of an inward current when [Ca2+]i is elevated are characteristic of the Na+-Ca2+ exchange (Allen et al. 1983; Callewaert et al. 1989, Delbridge et al. 1996). The current is not caused by caffeine alone when applied under conditions which do not cause [Ca2+]i release, is blocked by known blockers of the exchanger and is largely eliminated by the removal of external Na+. In addition the current seems to be close to a linear function of [Ca2+]i (Fig. 9B). These features confirm that our caffeine-activated current is INa,Ca.
We found that the inward current preceded the [Ca2+]i changes by about 100 ms; for this reason the plot of INa,Ca against [Ca2+]i is not a simple almost linear relation as predicted by models of INa,Ca (DiFrancesco & Noble, 1985). Trafford et al. (1995) examined this issue and concluded that the most likely explanation was that the [Ca2+]i in some small region close to the membrane rose faster than the bulk [Ca2+]i. Since the INa,Ca depends on the near-membrane [Ca2+]i this explanation is a possibility though studies of the distribution of [Ca2+]i following sudden exposure to caffeine have not had the resolution to detect such a region.
Several features suggest that the Na+-Ca2+ exchanger in this cell type is relatively large. (i) A comparative study by Sham, Hatem & Morad (1995) investigated the INa,Ca in ventricular myocytes from rat, guinea-pig, hamster and humans. The INa,Ca values during caffeine contractures were between 0.8 and 4.1 pA pF−1 (normalized to membrane capacitance as an indication of cell surface area). Toad pacemaker cells have a capacitance of 30–40 pF (Ju et al. 1996) so that our peak INa,Ca of 154 pA becomes a normalized INa,Ca in the range 3.9–5.1 pA pF−1. (ii) A method to compare the functional importance of the SR against that of the INa,Ca in Ca2+ extrusion is to compare the time course of decline of the voltage-generated Ca2+ transient with that produced by caffeine application. In the former both the SR and the INa,Ca contribute to Ca2+ extrusion whereas in the latter only the INa,Ca is involved. In the ventricular cells studied by Sham et al. (1995) the ratio of the caffeine-induced time constant to the voltage-generated time constant varied between 3.5 and 5 whereas in the toad pacemaker cells this ratio was only 0.81/0.45 = 1.8. Thus in the toad pacemaker cells the SR pump appears to have a relatively small role or, alternatively, the INa,Ca has a relatively large role in extruding Ca2+.
Importance of INa,Ca to pacemaker activity
A number of other studies have considered the possible role of INa,Ca in pacemaker activity. Zhou & Lipsius (1993) identified an inward current attributed to INa,Ca in the cat latent pacemaker cells and showed that it could be abolished by ryanodine. Zhou & Lipsius proposed that INa,Ca contributed to pacemaker currents and might also underlie part of the chronotropic effects of isoprenaline. Because the effect of ryanodine was largest on the later part of the pacemaker potential, they suggested that INa,Ca contributes mainly to the later part of the pacemaker potential. We would predict that the INa,Ca would be greatest in the early part of diastole, because the [Ca2+]i is greater then, but to predict the overall effect it would be necessary to know the magnitude of all the pacemaker currents throughout diastole. In contrast, Janvier & Boyett (1996) reviewed the possible role of INa,Ca in pacemaker activity and dismissed it on the ground that, in their experience, neither the inclusion of EGTA in the patch pipette attached to a sinoatrial node cell nor the application of ryanodine had any effect on firing rate. This suggests there may be variations between cell types in the importance of this mechanism.
The modelling study of amphibian pacemaker cells by Rasmussen et al. (1990) included a INa,Ca component whose magnitude was based on estimates from frog atrial cells. INa,Ca was very small during the pacemaker potential and removal of both the INa,Ca and the Na+ pump current produced a small increase in firing rate. They concluded that INa,Ca had only a minor role as a pacemaker current (see also Campbell et al. 1992). If we compare the magnitude of our measured INa,Ca with the current assumed by Rasmussen et al. several differences are apparent. First their assumed Ca2+ transients (peak 8 μm) are about 12 times those we measure (peak 650 nm). Second the magnitude of the current which we measure for a given [Ca2+]i is about 11 times greater than that assumed by Rasmusson et al. (see Fig. 9C). Since these two differences are in opposite directions they partially offset one another. Third, our measurements show the diastolic [Ca2+]i is higher (250–300 nm) in early diastole than in late diastole (200 nm) (see Fig. 2B). Using the dashed line in Fig. 9C leads to an estimate of the inward INa,Ca as 20–27 pA in early diastole and 12 pA in late diastole. Similar values are obtained by extrapolating the experimental data in Fig. 9B. These estimates of INa,Ca during diastole are considerably larger than the estimates of Rasmusson et al. (2–7 pA) and suggests that the importance of this current to pacemaker activity may be greater than their modelling led them to believe.
In this context it is important to realize that the net inward current required for the pacemaker potential (-I= dV/dt×C= 0.02 V s−1× 35 pF) is only ∼1 pA (DiFrancesco, 1993). Thus our large inward INa,Ca must be offset by outward currents of a similar magnitude. However quite small relative changes in INa,Ca, for instance caused by changes in [Ca2+]i, would now be expected to cause substantial changes in the firing rate.
These quantitative features of the INa,Ca in toad pacemaker cells suggest why these cells seem to be relatively sensitive to interventions which change [Ca2+]i. It seems that INa,Ca is a contributor to the pacemaker currents so that changes in diastolic [Ca2+]i modulate the total pacemaker current and therefore the firing rate.
Acknowledgments
This work was supported by grants from National Health and Medical Research Council and the National Heart Foundation of Australia.
References
- Allen DG, Eisner DA, Lab MJ, Orchard CH. The effects of low sodium solutions on intracellular calcium concentration and tension in ferret ventricular muscle. Journal of Physiology. 1983;345:391–407. doi: 10.1113/jphysiol.1983.sp014984. [DOI] [PMC free article] [PubMed] [Google Scholar]
- Anderson K, Lai FA, Liu QY, Rousseau E, Erickson HP, Meissner G. Structural and functional characterization of the purified cardiac ryanodine receptor-Ca2+ release channel complex. Journal of Biological Chemistry. 1989;264:1329–1335. [PubMed] [Google Scholar]
- Bakker AJ, Head SI, Williams DA, Stephenson DG. Ca2+ levels in myotubes grown from the skeletal muscle of dystrophic (mdx) and normal mice. Journal of Physiology. 1993;460:1–13. doi: 10.1113/jphysiol.1993.sp019455. [DOI] [PMC free article] [PubMed] [Google Scholar]
- Barry PH, Lynch JW. Liquid junction potentials and small cell effects in patch-clamp analysis. Journal of Membrane Biology. 1991;121:101–117. doi: 10.1007/BF01870526. [DOI] [PubMed] [Google Scholar]
- Bassani JW, Bassani RA, Bers DM. Calibration of indo-1 and resting intracellular [Ca2+] in intact rabbit cardiac myocytes. Biophysical Journal. 1995;68:1453–1460. doi: 10.1016/S0006-3495(95)80318-8. [DOI] [PMC free article] [PubMed] [Google Scholar]
- Bassani RA, Bassani JW, Lipsius SL, Bers DM. Diastolic SR Ca efflux in atrial pacemaker cells and Ca-overloaded myocytes. American Journal of Physiology. 1997;273:H886–892. doi: 10.1152/ajpheart.1997.273.2.H886. [DOI] [PubMed] [Google Scholar]
- Bois P, Lenfant J. Evidence for two types of calcium currents in frog cardiac sinus venosus cells. Pflügers Archiv. 1991;417:591–596. doi: 10.1007/BF00372956. [DOI] [PubMed] [Google Scholar]
- Brown HF, Kimura J, Noble D, Noble SJ, Taupignon A. The ionic currents underlying pacemaker activity in rabbit sino-atrial node: experimental results and computer simulations. Proceedings of the Royal Society. 1984;B 222:329–347. doi: 10.1098/rspb.1984.0067. [DOI] [PubMed] [Google Scholar]
- Callewaert G, Cleemann L, Morad M. Caffeine-induced Ca2+ release activates Ca2+ extrusion via Na+-Ca2+ exchanger in cardiac myocytes. American Journal of Physiology. 1989;257:C147–152. doi: 10.1152/ajpcell.1989.257.1.C147. [DOI] [PubMed] [Google Scholar]
- Campbell DL, Rasmusson RL, Strauss HC. Ionic current mechanisms generating vertebrate primary cardiac pacemaker activity at the single cell level: an integrative view. Annual Review of Physiology. 1992;54:279–302. doi: 10.1146/annurev.ph.54.030192.001431. [DOI] [PubMed] [Google Scholar]
- Chapman RA. Excitation-contraction coupling in cardiac muscle. Progress in Biophysics and Molecular Biology. 1979;35:1–52. doi: 10.1016/0079-6107(80)90002-4. [DOI] [PubMed] [Google Scholar]
- Delbridge LM, Bassani JW, Bers DM. Steady-state twitch Ca2+ fluxes and cytosolic Ca2+ buffering in rabbit ventricular myocytes. American Journal of Physiology. 1996;270:C192–199. doi: 10.1152/ajpcell.1996.270.1.C192. [DOI] [PubMed] [Google Scholar]
- DiFrancesco D. Pacemaker mechanisms in cardiac tissue. Annual Review of Physiology. 1993;55:455–472. doi: 10.1146/annurev.ph.55.030193.002323. [DOI] [PubMed] [Google Scholar]
- DiFrancesco D, Noble D. A model of cardiac electrical activity incorporating ionic pumps and concentration changes. Philosophical Transactions of the Royal Society. 1985;B 307:3–98. doi: 10.1098/rstb.1985.0001. [DOI] [PubMed] [Google Scholar]
- Frampton JE, Orchard CH, Boyett MR. Diastolic, systolic and sarcoplasmic reticulum [Ca2+] during inotropic interventions in isolated rat myocytes. Journal of Physiology. 1991;437:351–375. doi: 10.1113/jphysiol.1991.sp018600. [DOI] [PMC free article] [PubMed] [Google Scholar]
- Grynkiewicz G, Poenie M, Tsien RY. A new generation of Ca2+ indicators with greatly improved fluorescence properties. Journal of Biological Chemistry. 1985;260:3440–3450. [PubMed] [Google Scholar]
- Guo J, Ono K, Noma A. A sustained inward current activated at the diastolic potential range in rabbit sino-atrial node cells. Journal of Physiology. 1995;483:1–13. doi: 10.1113/jphysiol.1995.sp020563. [DOI] [PMC free article] [PubMed] [Google Scholar]
- Hagiwara N, Irisawa H, Kameyama M. Contribution of two type of calcium currents to the pacemaker potentials of rabbit sinoatrial node cells. Journal of Physiology. 1988;395:233–253. doi: 10.1113/jphysiol.1988.sp016916. [DOI] [PMC free article] [PubMed] [Google Scholar]
- Hagiwara N, Irisawa H, Kasanuki H, Hosoda S. Background current in sino-atrial node cells of the rabbit heart. Journal of Physiology. 1992;448:53–72. doi: 10.1113/jphysiol.1992.sp019029. [DOI] [PMC free article] [PubMed] [Google Scholar]
- Hagiwara N, Irisawa H. Modulation by intracellular Ca2+ of the hyperpolarization-activated inward current in rabbit single sino-atrial node cells. Journal of Physiology. 1989;409:121–141. doi: 10.1113/jphysiol.1989.sp017488. [DOI] [PMC free article] [PubMed] [Google Scholar]
- Hancox JC, Levi AJ, Brooksby P. Intracellular calcium transients recorded with Fura-2 in spontaneously active myocytes isolated from the atrioventricular node of the rabbit heart. Proceedings of the Royal Society. 1994;B 255:99–105. doi: 10.1098/rspb.1994.0014. [DOI] [PubMed] [Google Scholar]
- Irisawa H, Brown HF, Giles W. Cardiac pacemaking in the sinoatrial node. Physiological Reviews. 1993;73:197–227. doi: 10.1152/physrev.1993.73.1.197. [DOI] [PubMed] [Google Scholar]
- Janvier NC, Boyett MR. The role of Na-Ca exchange current in the cardiac action potential. Cardiovascular Research. 1996;32:69–84. [PubMed] [Google Scholar]
- Ju YK, Saint DA, Hirst GD, Gage PW. Sodium currents in toad cardiac pacemaker cells. Journal of Membrane Biology. 1995;145:119–128. doi: 10.1007/BF00237370. [DOI] [PubMed] [Google Scholar]
- Ju YK, Saint DA, Gage PW. Tetrodotoxin-sensitive inactivation-resistant sodium channels in pacemaker cells influence heart rate. Pflügers Archiv. 1996;431:868–875. doi: 10.1007/s004240050079. [DOI] [PubMed] [Google Scholar]
- Kleyman TR, Cragoe EJ. Amiloride and its analogs as tools in the study of ion transport. Journal of Membrane Biology. 1988;105:1–21. doi: 10.1007/BF01871102. [DOI] [PubMed] [Google Scholar]
- Li J, Qu J, Nathan RD. Ionic basis of ryanodine's negative chronotropic effect on pacemaker cells isolated from the sinoatrial node. American Journal of Physiology. 1997;273:H2481–2489. doi: 10.1152/ajpheart.1997.273.5.H2481. [DOI] [PubMed] [Google Scholar]
- Miyata H, Silverman HS, Sollott SJ, Lakatta EG, Stern MD, Hansford RG. Measurement of mitochondrial free Ca2+ concentration in living single rat cardiac myocytes. American Journal of Physiology. 1991;261:H1123–1134. doi: 10.1152/ajpheart.1991.261.4.H1123. [DOI] [PubMed] [Google Scholar]
- Moore LE, Clark RB, Shibata EF, Giles WR. Comparison of steady-state electrophysiological properties of isolated cells from bullfrog atrium and sinus venosus. Journal of Membrane Biology. 1986;89:131–138. doi: 10.1007/BF01869709. [DOI] [PubMed] [Google Scholar]
- Nitta J, Furukawa T, Marumo F, Sawanobori T, Hiraoka M. Subcellular mechanism for Ca2+-dependent enhancement of delayed rectifier K+ current in isolated membrane patches of guinea pig ventricular myocytes. Circulation Research. 1994;74:96–104. doi: 10.1161/01.res.74.1.96. [DOI] [PubMed] [Google Scholar]
- O'Neill SC, Valdeolmillos M, Eisner DA. The effects of nickel on contraction and membrane current in isolated rat myocytes. Quarterly Journal of Experimental Physiology. 1988;73:1017–1020. doi: 10.1113/expphysiol.1988.sp003213. [DOI] [PubMed] [Google Scholar]
- Rasmusson RL, Clark JW, Giles WR, Shibata EF, Campbell DL. A mathematical model of a bullfrog cardiac pacemaker cell. American Journal of Physiology. 1990;259:H352–369. doi: 10.1152/ajpheart.1990.259.2.H352. [DOI] [PubMed] [Google Scholar]
- Rigg L, Terrar DA. Possible role of calcium release from the sarcoplasmic reticulum in pacemaking in guinea-pig sino-atrial node. Experimental Physiology. 1996;81:877–880. doi: 10.1113/expphysiol.1996.sp003983. [DOI] [PubMed] [Google Scholar]
- Rubenstein DS, Lipsius SL. Mechanisms of automaticity in subsidiary pacemakers from cat right atrium. Circulation Research. 1989;64:648–657. doi: 10.1161/01.res.64.4.648. [DOI] [PubMed] [Google Scholar]
- Sham JS, Hatem SN, Morad M. Species differences in the activity of the Na+-Ca2+ exchanger in mammalian cardiac myocytes. Journal of Physiology. 1995;488:623–631. doi: 10.1113/jphysiol.1995.sp020995. [DOI] [PMC free article] [PubMed] [Google Scholar]
- Trafford AW, Diaz ME, O'Neill SC, Eisner DA. Comparison of subsarcolemmal and bulk calcium concentration during spontaneous calcium in rat ventricular myocytes. Journal of Physiology. 1995;488:577–586. doi: 10.1113/jphysiol.1995.sp020991. [DOI] [PMC free article] [PubMed] [Google Scholar]
- Tseng GN, Boyden PA. Different effects of intracellular Ca and protein kinase C on cardiac T and L Ca currents. American Journal of Physiology. 1991;261:H364–379. doi: 10.1152/ajpheart.1991.261.2.H364. [DOI] [PubMed] [Google Scholar]
- Varro A, Negretti N, Hester SB, Eisner DA. An estimate of the calcium content of the sarcoplasmic reticulum in rat ventricular myocytes. Pflügers Archiv. 1993;423:158–160. doi: 10.1007/BF00374975. [DOI] [PubMed] [Google Scholar]
- Westerblad H, Allen DG. The influence of intracellular pH on contraction, relaxation and [Ca2+]i in intact single fibres from mouse muscle. Journal of Physiology. 1993;466:611–628. [PMC free article] [PubMed] [Google Scholar]
- Westerblad H, Allen DG. Intracellular calibration of the calcium indicator indo-1 in isolated fibers of Xenopus muscle. Biophysical Journal. 1996;71:908–917. doi: 10.1016/S0006-3495(96)79294-9. [DOI] [PMC free article] [PubMed] [Google Scholar]
- Zhou Z, Lipsius SL. Na+-Ca2+ exchange current in latent pacemaker cells isolated from cat right atrium. Journal of Physiology. 1993;466:263–285. [PMC free article] [PubMed] [Google Scholar]