

Abstract
The mechanical signal(s) that may be important in regulating the number of sarcomeres in series in skeletal muscle fibres or fascicles (sarcomere number) remain(s) speculative, in part because the in vivo mechanical environment of muscle has not yet been defined during sarcomere number perturbations. In the present study, measurements of the in vivo mechanical environment were used to test the hypothesis that increasing muscle excursion results in increased serial sarcomere addition in growing animals.
The tibialis anterior (TA) was released from its retinacular restraint at the ankle joint to increase muscle excursion in 4-week-old female New Zealand White rabbits. Twelve weeks post release, muscle excursion and sarcomere number were significantly increased for released TAs compared with control TAs.
General cage activity over a 24 h period and in vivo ankle joint kinematics of the experimental leg during hopping on a treadmill were not significantly different between control and release groups, suggesting that altered animal and joint activity patterns were not responsible for the increased serial sarcomere addition associated with TA release.
In vivo TA forces during hopping and during a large force-producing foot-flicking motion were significantly decreased in released TAs compared with control TAs. Chronically decreased force production may have been involved in the decreased longitudinal tendon growth observed for the released TA compared with the control TA, which, in turn, may have stimulated the increase in serial sarcomere addition. However, increasing force production of the released TA by partial ablation of the extensor digitorum longus did not inhibit the increase in serial sarcomere addition.
The results of this study support the hypothesis that increasing excursion results in increased serial sarcomere addition in growing animals and, when combined with the results of previous studies indicating that decreasing excursion results in decreased serial sarcomere addition, support the working hypothesis that excursion is important in regulating sarcomere number in growing animals.
Adaptation in the number of sarcomeres in series in skeletal muscle fibres or fascicles (sarcomere number) may be important in pathologies associated with cerebral palsy (O'Dwyer, Neilson & Nash, 1989) and with bone lengthening (Simpson, Williams, Kyberd, Goldspink & Kenwright, 1995). Adaptations in sarcomere number also have implications for the function of normal muscle: muscle force-length properties (passive and active; Williams & Goldspink, 1978) and force-velocity properties (Spector, Gardiner, Zernicke, Roy & Edgerton, 1980) can be influenced by sarcomere number. Despite the likely importance of sarcomere number adaptation, the factors responsible for such adaptation remain unknown. Specifically, though mechanical signals appear to be important for inducing serial sarcomere addition or deletion (Herring, Grimm & Grimm, 1984; Goldspink, 1985), the nature of these signals remains to be elucidated.
Muscle length (or passive tension) is widely thought to be important in regulating sarcomere number. Immobilizing adult skeletal muscle in stretched or shortened positions produces increases or decreases, respectively, in sarcomere number (e.g. Tabary, Tabary, Tardieu, Tardieu & Goldspink, 1972; Williams & Goldspink, 1978). The adaptations in sarcomere number appear to produce near-optimal sarcomere lengths at the immobilized muscle length. These results have led to the conclusion that the working length of the muscle is important in regulating sarcomere number.
In growing animals, muscle excursion (the change in muscle length required to produce the full range of joint motion) may be important in regulating sarcomere number. In contrast to the results from adult animals, immobilizing growing muscle in a stretched position decreases sarcomere number relative to the contralateral control muscle (Williams & Goldspink, 1971, 1978; Tardieu, Tabary, Tabary & Huet de la Tour, 1977). Such a decrease could be associated with the decreased excursion induced by immobilization.
In addition, a procedure assumed by Crawford (1954, 1961) to increase muscle excursion increased longitudinal muscle growth in young animals (Crawford, 1954, 1961). This procedure involved releasing the tibialis anterior (TA) tendon from its retinacular restraint at the ankle joint in 3- to 4-week-old rabbits (Fig. 1). After 4 months, muscle belly length was 20 % longer for the released compared with the contralateral TA, despite the muscle working at a shorter length for all but the most plantarflexed ankle joint angles. If the increase in muscle length was accounted for by an increase in sarcomere number, these results may suggest a relationship between increased muscle excursion and increased sarcomere number. However, neither muscle excursion nor sarcomere number were measured; thus a relationship between the two remains speculative. In fact, in all studies of sarcomere number adaptation to date, the in vivo mechanical environment of muscle has not been defined. Thus, suggested links between the mechanical environment and sarcomere number regulation in general have only been speculative.
Figure 1. Schematic diagram of releasing the tibialis anterior (TA) from its retinacular restraint at the ankle joint.

Tibia and foot shown as continuous lines; foot shown in plantarflexion and dorsiflexion. TA muscle-tendon unit shown as dashed line; length of line between origin and insertion represents TA muscle-tendon unit length in plantarflexion and dorsiflexion. Difference between TA muscle-tendon unit lengths in plantarflexion and dorsiflexion is TA muscle excursion. After TA release, TA muscle-tendon unit length is decreased for all but the most plantarflexed ankle joint angles and TA muscle excursion is increased.
Another explanation for the increase in muscle length associated with TA release involves the possible decreased force production of the TA. TA release increases the moment arm of the TA at the ankle joint, and thus decreased TA force production may help to achieve near normal torque production about the ankle joint (Koh, 1997). This possibility is supported by the observation that, 4 months after release, the maximum isometric force produced by the released TA is less than that produced by its contralateral counterpart (Crawford, 1961). Chronically decreased force production could be responsible for reduced longitudinal tendon growth; the released tendon was shorter than the contralateral tendon (Crawford, 1954, 1961). This possibility is supported by data suggesting that tension is an important stimulus for longitudinal tendon growth (Tardieu, Blanchard, Tabary & le Lous, 1983; Blanchard, Cohen-Solal, Tardieu, Allain, Tabary & le Lous, 1985; Davison, 1992). Decreased tendon growth would result in a chronically increased working length of the released muscle. A chronically increased muscle length has been shown to be a stimulus for sarcomere number addition (Tabary et al. 1972; Tardieu et al. 1977). Thus, this sequence of events could be responsible for the increase in longitudinal muscle growth associated with release.
The working hypothesis for the present study was that muscle excursion is important in regulating sarcomere number in growing animals. The specific hypotheses of the study were (1) that increased excursion results in increased serial sarcomere addition following TA release in growing animals (primary hypothesis), and (2) that decreased TA force production results in increased serial sarcomere addition following TA release (secondary hypothesis). The primary hypothesis was tested by determining whether sarcomere number and in vivo muscle excursion were increased following TA release. Cage activity and in vivo ankle joint kinematics were also recorded to determine whether altered animal or joint activity patterns could be related to sarcomere number adaptation. The secondary hypothesis was tested by determining whether in vivo TA force production was decreased following TA release, and whether increasing the in vivo force production of the released TA (via ablation of the synergistic extensor digitorum longus (EDL)) inhibited the expected increase in sarcomere number associated with release. The present investigation appears to be the first study of sarcomere number adaptation in which the in vivo mechanical environment of muscle has been defined.
METHODS
Animals
Female New Zealand White rabbits (4 weeks old) were obtained from a single supplier (Vandermeer, Edmonton, AB, Canada). Twelve rabbits each were allotted into control, sham-operated, TA release, and TA release plus EDL ablation groups. Animals in the control group received no surgical treatment at 4 weeks of age. Animals in the remaining groups received the surgical treatments described below at 4 weeks of age. Six rabbits in each group were used for measurements of in vivo muscle force, in vivo ankle joint kinematics and in situ maximum muscle force at 15–16 weeks of age. The remaining six rabbits in each group were used for measurements of muscle excursion and muscle architecture at 16 weeks of age. All procedures were performed according to the guidelines of the Canadian Council on Animal Care and were approved by the Animal Care Committee of the University of Calgary.
Sham, TA release and EDL ablation procedures
Animals were anaesthetized with halothane for surgery. TA release was performed essentially following Crawford (1954). Under sterile conditions, a small (2 cm long) incision was made over the anterior part of the left ankle joint to expose the proximal extensor retinaculum (also called the crural ligament). For animals in the release-only and release plus ablation groups, the retinaculum was removed, and the fascia overlying the TA muscle belly and tendon was divided 1 cm proximal and distal to the ankle. For sham-operated animals, identical procedures were used, except the retinaculum was not removed. For rabbits receiving partial EDL ablation in addition to TA release, one-third of the distal muscle belly of the EDL was removed along with its tendon reaching 1 cm distal to the ankle. Care was taken not to damage nerve or blood supply to the TA. After closing the incision, the rabbit was given an injection of butorphanol (0.1 mg kg−1) for analgesia. The rabbits appeared to recover quickly from surgery; noticeable limping was absent after 2 days. Rabbits were housed singly (cage dimensions, 44 cm × 60 cm × 38 cm) and allowed normal cage activity.
Cage activity
Cage activity over a 24 h period was assessed 11–12 weeks post surgery to determine whether a possible lack of adaptation in sarcomere number was due to a lack of animal activity. Cage activity was measured as the total time that the rabbit spent moving in the cage. Activity was monitored with a motion detector (Noma, Toronto, ON, Canada) placed above the cage. The sensitivity of the motion detector was set to monitor only entire body movements. The sampling rate of the detector was adjusted to 2 Hz. The total time that the rabbit spent moving in the cage was calculated by multiplying the total number of motion detector counts by 0.5 s.
In vivo TA muscle force
In vivo TA muscle force production was measured for six rabbits in each experimental group 11–12 weeks post surgery to determine the influence of TA release and EDL ablation on in vivo TA force production. Muscle force was measured using surgically implanted custom made {font AaSans}E-shaped tendon force transducers (Herzog, Stano & Leonard, 1993). Briefly, under anaesthesia, transducers were implanted on the left and right TA tendon just distal to the muscle belly through a small incision (2 cm long) over the anterior part of each leg. Another incision was made over the mid-line of the thoracic spine (5 cm long) to allow subcutaneous passage of the transducer leads from the leg to the back where they were sutured subcutaneously to fascia for strain relief. The leads terminated in a custom-made electrical connector. After closing the incisions, the rabbit was given an injection of butorphanol (0.1 mg kg−1) for analgesia.
Muscle forces were recorded 5–7 days after the transducers were implanted. Each animal was briefly anaesthetized with isoflurane (< 1 min; induced at 5 %, maintained at 2 %), two sutures on the back were removed and the connector was exteriorized and linked by a cable to a strain-gauge amplifier (Intertechnology, 2100 System, Toronto, ON, Canada). After the animal recovered from anaesthesia, muscle force was recorded at 500 Hz via a microcomputer while the rabbit was (a) hopping on a motor-driven treadmill at 0.3 m s−1, (b) hopping on a walkway at a self-selected speed, and (c) performing a large force-producing flicking motion while attempting to remove a piece of foil taped to its foot. Twenty hops or flicks were chosen for analysis from each condition for each rabbit. Force data were low-pass filtered at 50 Hz (2nd-order recursive Butterworth filter), and peak force and impulse (the integral of force over time) for each hop or flick were measured with a computer program written for the purpose. For hopping, peak force and impulse were averaged over twenty hops to provide representative values for each rabbit. For the flicking motion, values were averaged over flicks that produced the five largest peak force and five largest impulse values.
In vivo ankle joint kinematics
Bilateral sagittal plane ankle joint kinematics were measured for the rabbits during treadmill hopping to determine whether altered joint kinematics could be related to sarcomere number adaptations. Two high-speed (60 Hz) video cameras (Motion Analysis, Santa Rosa, CA, USA) were used to record rabbits hopping on the treadmill; one camera each was focused on the lateral surface of the left and right legs. The twenty hops selected for TA force analysis (cf. previous paragraph) were also used for kinematic analysis for each rabbit. TA force data were synchronized with kinematic data using a time-code generator (Datum, Model 9550, San Jose, CA, USA).
The swing phase was identified for each hop (separately for each leg) as the set of frames from the video record between take-off and touchdown of each foot. For each hop, every frame showing the swing phase, plus ten frames prior to, and ten frames after, the swing phase, were analysed. In each frame, two reflective markers placed on the lateral side of each foot (lateral malleolus, metatarsal-phalangeal joint), and two points on the anterior surface of the leg (one near the knee, one near the ankle) were digitized manually (Motion Analysis, Manual Input System). These points were selected to minimize artifacts from soft tissue movement, and they defined the long axes of the foot and leg. Ankle joint angles were defined as the included angle between the long axes of the leg and foot, and these angles were low-pass filtered (2nd-order recursive Butterworth) at 10 Hz. For each hop, the duration of the swing phase (swing time), the maximum and minimum angles achieved in each hop (typically at take-off and mid-swing), the difference between these values (joint excursion) and the maximum velocity of dorsiflexion were calculated using a computer program written for the purpose. Each parameter was averaged over the twenty hops to provide representative values for each rabbit.
In situ TA muscle force
After the in vivo force and kinematic measurements, maximum in situ TA muscle force was assessed. Each animal was anaesthetized with isoflurane, and nerve cuff stimulating electrodes were placed on the left and right common peroneal nerves. The animal was then placed in a device designed to secure the lower limb with the knee joint fixed at 90 deg. The foot was strapped to a footplate, which could be fixed at any desired ankle joint angle. The nerve cuff was connected to an isolated stimulator (Grass, Model S88, West Warwick, RI, USA) and supramaximal stimulation intensity (pulse duration, 0.1 ms; frequency, 150 Hz; train duration, 400 ms; intensity, 1–2 V) was determined as that which produced maximum force (measured using the tendon force transducer). Maximum developed isometric TA force was measured for ankle joint angles from 60 to 160 deg in 20 deg increments (full plantarflexion, 160 deg) to determine the maximum force-producing capability of the muscle. Following this protocol, the animal was killed with an overdose of pentobarbitone, the TA tendon was freed from its distal attachment, and the tendon force transducer was calibrated by hanging a series of known weights on the tendon.
TA muscle excursion
TA muscle excursion was determined for the left leg of the remaining six rabbits in each group at 12 weeks post surgery to quantify the increase in excursion associated with TA release. Each rabbit was anaesthetized with isoflurane, and a nerve-stimulating cuff was implanted on the left common peroneal nerve. Radiopaque wire markers were implanted (1) at the tibial tubercle and (2) on the TA tendon near the muscle-tendon junction; these landmarks allowed for consistent placement of markers between animals. The rabbit was placed on its side on an X-ray table. A fluoroscope was focused on the left leg, and the displacement of the markers was recorded on fluoroscopic video during three trials of dorsiflexion. The foot was first held in a fully plantarflexed position, the TA was then submaximally stimulated (pulse duration, 0.1 ms; frequency, 40 Hz; train duration, 2 s; intensity, 1–2 V), the foot was allowed to dorsiflex slowly, and the movements of the bones and wire markers were recorded. A scale was placed in the field of view of the fluoroscope, and in the plane of the leg, to calibrate the distances measured on the fluoroscopy images.
For each trial, every frame of the fluoroscopy video record from the onset of stimulation with the foot plantarflexed until the foot reached full dorsiflexion was analysed. Eight points were manually digitized (Motion Analysis) in each frame: the two ends of the scale, the two wire markers, two arbitrary points defining the long axis of the tibia, and two arbitrary points defining the long axis of the foot. The ankle joint angle and the distance between the wire markers were calculated for each frame. Data were then grouped over the three trials. Muscle excursion was determined as the difference between the maximum (at full plantarflexion) and minimum (at full dorsiflexion) distances between the wire markers.
Muscle and tendon architecture
After measurement of TA excursion, rabbits were killed by an overdose of pentobarbitone. Both lower limbs were removed, skinned, and cleaned of excess muscle and connective tissue. The limbs were then immersed and stored (> 1 month) in 10 % neutral-buffered formalin with the TA left attached to the bones and the ankle joint positioned at 90 deg.
After fixation, each TA was dissected carefully from its bony attachments. The length of the tibia was measured with vernier callipers. The length of the external tendon and proximal and distal aponeuroses were measured with a steel ruler (Fig. 2). The tendon was excised at the muscle-tendon junction. The muscle was blotted dry and muscle mass was measured.
Figure 2.

Anterior and posterior views of the surface architecture of the rabbit tibialis anterior muscle-tendon complex.
The muscle belly was divided into thirds with longitudinal cuts. The central third of each muscle was then placed in 30 % nitric acid (Loeb & Gans, 1986) for approximately 10 h until the connective tissue had been softened sufficiently to allow the teasing of small fascicles of fibres (approximately 20 fibres in diameter) that spanned the distance between proximal and distal aponeuroses (Fig. 2). Twelve fascicles were teased from each muscle (6 each from the superficial and deep surfaces of the muscle). Fascicles were mounted in glycerol jelly on microscope slides, and fascicle length was measured using a video analysis system (Media Cybernetics, ImagePro Plus, Silver Spring, MD, USA). Sarcomere length was measured at five points along the length of each fascicle using a laser diffraction system (beam diameter, 0.8 mm; Allinger, 1995): (1) centre of the fascicle, (2 and 3) midway between the centre and each end of the fascicle, and (4 and 5) 2 mm from each end of the fascicle. Sarcomere number for each fascicle was estimated by dividing the fascicle length by the mean sarcomere length for the fascicle (Tabary, Tardieu, Tardieu, Tabary & Gagnard, 1976; Simpson et al. 1995). Sarcomere number was averaged across fascicles to provide a representative value for superficial and deep fascicles for each muscle. Most individual fibres in the rabbit TA do not span the distance from proximal to distal aponeuroses (Mackay & Harrop, 1969; Crawford, 1973); they are arranged serially such that up to three fibres are required to span the distance between aponeuroses. The measurements in the present study thus indicate sarcomere number for fascicles that span the distance from proximal to distal aponeuroses, which seems functionally more important than sarcomere number for individual fibres. Previous studies of sarcomere number adaptation in the rabbit TA, and in the cat TA (which also has series-fibred architecture), also reported fascicle sarcomere number (Tabary et al. 1976; Simpson et al. 1995).
Muscle physiological cross-sectional area (PCSA; cm2) was estimated from the equation:
where fibre length (cm) was calculated by multiplying sarcomere number (averaged over superficial and deep regions for each muscle) by 2.2 μm (Sacks & Roy, 1982). Muscle mass (g) was corrected for the loss of mass due to fixation (measured as 7 % by comparing mass before and after fixation in a pilot study) before calculating cross-sectional area. The value of muscle density used was 1.0564 g cm−3 (Mendez & Keys, 1960).
Muscle architecture measurements similar to those for the TA were performed for the soleus muscle. The architecture of the soleus muscle is highly sensitive to changes in its mechanical environment (Lieber, 1992). Thus, if TA adaptations are due to altered ankle joint kinematics or hindlimb loading, the soleus muscle may show adaptive changes as well.
Data analysis
For the primary hypothesis, mean values were compared between control, sham-operated and release groups using one-way analysis of variance (ANOVA). Scheffé‘s test was used for post-hoc multiple comparisons. For the secondary hypothesis, mean values were compared between release and release plus EDL ablation groups using Student's two-sample t tests. For all statistical tests, the 0.05 level was taken to indicate statistical significance.
RESULTS
Primary hypothesis
Muscle excursion was increased with release
The primary hypothesis that increasing muscle excursion results in increased sarcomere number following TA release was tested by measuring muscle excursion and sarcomere number as well as other possible influences on sarcomere number regulation. For an ankle joint motion from 160 deg (full plantarflexion) to 40 deg (full dorsiflexion), muscle excursion for the released TA was significantly larger (40 %) than values for the control or sham-operated TAs (Fig. 3). Muscle excursion for the control and sham-operated TAs were not significantly different, and nearly identical. Thus the TA release procedure had the desired effect of increasing the muscle excursion of the TA.
Figure 3. TA muscle excursion and sarcomere number for control, sham-operated and release groups.
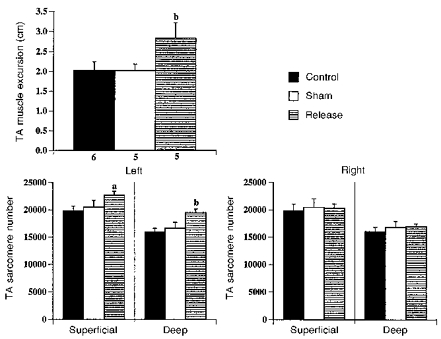
Muscle excursion measured for the left (experimental) TA, sarcomere number measured for both left and right TAs. Values shown are means, and error bars represent s.d. Muscle excursion data lost for 1 rabbit in sham-operated and release groups because of technical problems with fluoroscopy. For sarcomere number data, n= 6 for each mean value. aP < 0.01, bP < 0.001: release group significantly different from control and sham-operated groups.
Sarcomere number was increased with release
Sarcomere numbers for the released TA were significantly larger for the released TA than those for the control and sham-operated TAs (Fig. 3). In comparison with the control TA, sarcomere numbers for the released TA were 14 and 22 % larger for superficial and deep fascicles, respectively. In comparison with the sham-operated TA, sarcomere numbers for the released TA were 11 and 17 % larger for superficial and deep fascicles, respectively. Sarcomere numbers were not significantly different between control and sham-operated TAs, in either superficial or deep regions. In addition, sarcomere number for the contralateral (right) TA showed no significant differences between groups in either the superficial or deep regions. Thus the TA release procedure appeared to result in increased serial sarcomere addition in the experimental TA but did not affect serial sarcomere addition in the contralateral TA.
To provide an indication of the reliability of the procedure for sarcomere number estimation, the entire procedure (fascicle sampling, fascicle length measurement, sarcomere length measurement, sarcomere number calculation) was repeated for one muscle. On average, sarcomere number varied between repeated measurements by 2 %, suggesting that the procedure was reliable.
Rabbit growth was not changed with release
The mass of the rabbits at death was not significantly different for control (3.3 ± 0.4 kg), sham-operated (3.3 ± 0.3 kg) and release (3.2 ± 0.4 kg) groups. Tibia length was also not significantly different between control (10.6 ± 0.3 cm), sham-operated (11.0 ± 0.4 cm) and release (10.6 ± 0.2 cm) groups. Thus the release procedure did not appreciably affect the mass or tibial growth of the rabbits.
Cage activity was not changed with release
The average amount of time spent moving in the cage over a 24 h period was not significantly different between control (39.3 ± 14.8 min), sham-operated (41.0 ± 14.9 min) and release (44.2 ± 5.7 min) groups. Hence the release procedure did not appreciably affect the cage activity levels of the rabbits.
In vivo ankle joint kinematics were not changed with release
Parameters of ankle joint kinematics for the swing phase of treadmill hopping showed no significant differences between groups for the experimental (left) leg (Table 1). For the contralateral (right) leg, the maximum ankle joint angle achieved during hopping was smaller (by 8 %) for the release compared with the control and sham-operated groups. No other parameters of ankle joint kinematics were significantly different between groups for the contralateral leg. Thus the release procedure did not appreciably affect the ankle joint kinematics of the experimental leg, and minimally influenced those of the contralateral leg.
Table 1.
Ankle joint kinematics for experimental (left) and contralateral (right) legs for each rabbit group during the swing phase of hopping on a treadmill at 0.3 m s−1
| Group | Swing time (s) | Maximum angle (deg) | Minimum angle (deg) | Excursion (deg) | Peak velocity (deg s−1) |
|---|---|---|---|---|---|
| Left leg | |||||
| Control | 0.15 ± 0.01 | 118 ± 12 | 50 ± 3 | 68 ± 11 | 1210 ± 85 |
| Sham | 0.15 ± 0.01 | 119 ± 6 | 46 ± 9 | 72 ± 8 | 1262 ± 200 |
| Release | 0.14 ± 0.01 | 109 ± 10 | 47 ± 9 | 62 ± 10 | 1128 ± 121 |
| Right leg | |||||
| Control | 0.15 ± 0.02 | 122 ± 8 | 54 ± 5 | 68 ± 10 | 1128 ± 74 |
| Sham | 0.16 ± 0.01 | 120 ± 4 | 50 ± 11 | 70 ± 7 | 1140 ± 202 |
| Release | 0.14 ± 0.01 | 107 ± 6 a | 45 ± 5 | 62 ± 7 | 1139 ± 106 |
P < 0.01: release group significantly different from control and sham-operated groups. Values shown are means ±s.d. Swing time: duration of swing phase; Maximum angle: maximum included angle between leg and foot during swing phase; Minimum angle: minimum included angle during swing phase; Excursion: difference between maximum and minimum angles; Peak velocity: peak velocity of dorsiflexion during swing phase. n = 6 for both sham-operated and release groups, n = 5 for control group; data from 1 rabbit in control group was discarded because of technical problems.
To provide an indication of the reliability of measuring ankle joint kinematics from the video record, the entire group of twenty hops for one rabbit were digitized twice. The mean values for all parameters of ankle joint kinematics varied by less than 3 % between repeated digitizations suggesting that the digitizing procedures were reliable. To evaluate the influence of the force transducer implant on ankle joint kinematics, treadmill hopping was recorded for three rabbits before and after the implant. The mean values for swing time, minimum angle, and maximum angle varied by an average of 4 % between pre- and post-implant measurements, and excursion and maximum dorsiflexion velocity varied by an average of 7 %. The differences observed across rabbits between pre- and post-implant measurements were not systematic. Thus, the transducer implant did not appreciably affect ankle joint kinematics.
Soleus architecture was not changed with release
Neither soleus sarcomere number nor PCSA showed significant differences between groups, for either the experimental or contralateral legs (Table 2). Thus, the release procedure did not appreciably affect soleus architecture.
Table 2.
Soleus sarcomere number and physiological cross-sectional area (PCSA) for experimental (left) and contralateral (right) legs for each rabbit group
| Sarcomere number | |||
|---|---|---|---|
| Group | Proximal | Distal | PCSA (cm2) |
| Left leg | |||
| Control | 6976 ± 430 | 6369 ± 548 | 1.34 ± 0.21 |
| Sham | 7568 ± 840 | 6992 ± 484 | 1.24 ± 0.09 |
| Release | 7174 ± 792 | 6766 ± 770 | 1.26 ± 0.17 |
| Right leg | |||
| Control | 6898 ± 400 | 6338 ± 439 | 1.29 ± 0.22 |
| Sham | 7284 ± 1111 | 7148 ± 1270 | 1.20 ± 0.14 |
| Release | 6966 ± 677 | 6404 ± 625 | 1.30 ± 0.10 |
Values shown are means ±s.d., n= 6 for each mean value. Sarcomere numbers are for proximal and distal regions of the soleus muscle.
In vivo TA force production was decreased with release
For hopping on the treadmill, peak in vivo force for the experimental (left) TA of the release group was significantly smaller than that for the control and sham-operated groups (Fig. 4). The impulse (the integral of force over time during the swing phase) for the released group was also significantly smaller than that for the sham-operated group. For hopping on the walkway, peak force and impulse were significantly smaller for the released group compared with the control and sham-operated groups. For the large force-producing flicking motion, the peak force for the released group was significantly smaller compared with the sham-operated group, while impulse was significantly smaller compared with both control and sham-operated groups. In vivo force production of the experimental TA of control and sham-operated groups showed no significant differences for any of the activities. In vivo force production of the contralateral (right) TA also showed no significant differences between control, sham-operated and release groups for any of the activities. In short, the release procedure resulted in decreased TA force production for a variety of activities requiring both small and large force magnitudes.
Figure 4. TA force production during hopping on a motor-driven treadmill, during hopping on a walkway, and during a large force-producing flicking motion for control, sham and release groups.

▪, control; □, sham;  , release. Peak force and impulse (integral of force over time) measured for both left (experimental) and right (contralateral) muscles. Values shown are means and error bars represent s.d.n (shown below each bar) sometimes less than 6 because of technical difficulties with force transducers and recording equipment. * Release group significantly different from control group; ** release group significantly different from control and sham-operated groups. aP < 0.05, bP < 0.01, cP < 0.001.
To evaluate the possibility that in vivo force measurements were influenced by tissues surrounding the tendon force transducer (especially via impingement on the tibia), maximum elicited TA forces were measured for one muscle under two conditions: (1) in situ and (2) with the tendon held by a clamp away from the tibia and other tissues. When the muscle was held isometric at identical lengths between conditions (corresponding to those at which peak in vivo force usually occurred), this measured maximum-elicited force varied by 4 % between conditions.
In situ force production and PCSA were decreased with release
The maximum in situ isometric force was significantly smaller for the experimental TA of the release group than for that of the control and sham-operated groups (Table 3). Maximum force for control and sham-operated groups was not significantly different. Maximum force of the contralateral TA also showed no significant differences between groups. PCSA for the experimental TA was significantly smaller for the release group than for the control and sham-operated groups. PCSA for the experimental TA was not significantly different between control and sham-operated groups, and PCSA for the contralateral TA showed no significant differences between any groups. The decreased maximum in situ isometric force and PCSA for the released TA support the argument that force production was chronically decreased in this muscle.
Table 3.
Tibialis anterior maximal in situ isometric force and physiological cross-sectional area (PCSA) for experimental (left) and contralateral (right) legs for each rabbit group
| Group | Maximal force (N) | PCSA (cm2) |
|---|---|---|
| Left leg | ||
| Control | 22.1 ± 1.7 | 0.78 ± 0.04 |
| Sham | 19.4 ± 1.7 | 0.79 ± 0.08 |
| Release | 14.4 ± 1.7 a | 0.58 ± 0.09 a |
| Right leg | ||
| Control | 21.5 ± 1.7 | 0.74 ± 0.07 |
| Sham | 19.3 ± 2.1 | 0.73 ± 0.08 |
| Release | 19.7 ± 2.5 | 0.70 ± 0.11 |
Values shown are means ±s.d., n= 6 for each mean value.
P < 0.001: release group significantly different from control and sham-operated groups.
Tendon length was decreased with release
External tendon length was significantly shorter for the released TA compared with the control and sham-operated TAs (12 % and 16 %, respectively; Table 4). External tendon length was not significantly different between control and sham- operated TAs. Proximal aponeurosis length was significantly shorter for the released TA compared with the control and sham-operated TAs (21 and 24 %, respectively), as was distal aponeurosis length (23 and 25 %, respectively), whereas control and sham-operated TA aponeurosis lengths were not significantly different. Thus release of the TA was associated with shorter lengths of all tendon components.
Table 4.
Tibialis anterior external tendon length, proximal aponeurosis length and distal aponeurosis length for experimental (left) and contralateral (right) legs for each rabbit group
| Group | External tendon length (cm) | Proximal aponeurosis length (cm) | Distal aponeurosis length (cm) |
|---|---|---|---|
| Left leg | |||
| Control | 4.9 ± 0.1 | 1.3 ± 0.1 | 3.1 ± 0.1 |
| Sham | 5.1 ± 0.2 | 1.3 ± 0.2 | 3.2 ± 0.2 |
| Release | 4.3 ± 0.3 b | 1.0 ± 0.1 a | 2.4 ± 0.2 b |
| Right leg | |||
| Control | 5.0 ± 0.2 | 1.3 ± 0.1 | 3.0 ± 0.1 |
| Sham | 5.1 ± 0.2 | 1.3 ± 0.1 | 3.2 ± 0.2 |
| Release | 5.0 ± 0.3 | 1.2 ± 0.1 | 3.0 ± 0.2 |
Values shown are means ±s.d., n= 6 for each mean value.
P < 0.01
P < 0.001: release group significantly different from control and sham-operated groups.
Secondary hypothesis
In vivo TA force production was increased by EDL ablation
The secondary hypothesis that decreased TA force production results in increased serial sarcomere addition following TA release (via decreased longitudinal tendon growth) was tested by attempting to increase the force production of the released TA by partial ablation of the EDL. Peak in vivo force production for the experimental TA of the release plus EDL ablation group was significantly greater than that for the release group for hopping on the treadmill, for hopping on the walkway, and for the large force-producing flicking motion (Fig. 5). Impulse during the swing phase was also greater for the release plus ablation group than for the release group. In short, EDL ablation had the desired effect of increasing the force production of the released TA.
Figure 5. TA force production during hopping on a motor-driven treadmill, during hopping on a walkway, and during a large force-producing flicking motion for release and release plus extensor digitorum longus muscle (EDL) ablation groups.

▪, TA release; □, TA release + EDL ablation. Peak force and impulse (force × time) were measured for both left (experimental) and right (contralateral) muscles. Values shown are means and error bars represent s.d.n (shown below each bar) sometimes less than 6 because of technical difficulties with force transducers and recording equipment. aP < 0.05, bP < 0.01: release plus ablation group significantly different from release-only group.
Excursion and sarcomere number were not changed by EDL ablation
Excursion of the experimental TA for the release plus EDL ablation group was not significantly different from that for the release-only group (Fig. 6), suggesting that ablation did not affect the increase in excursion associated with release. Sarcomere number was also not significantly different for the experimental TA between release plus ablation and release-only groups, for either the superficial or deep regions (Fig. 6). Thus increasing the force production of the released TA via EDL ablation did not appear to inhibit the increase in serial sarcomere addition associated with TA release.
Figure 6. TA muscle excursion and sarcomere number for release and release plus EDL ablation groups.
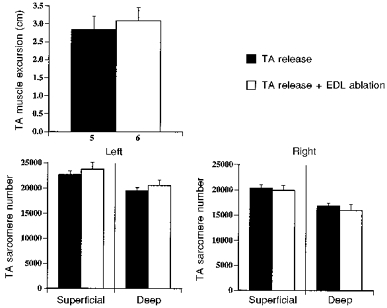
Values shown are means and error bars represent s.d. Excursion data was lost for 1 rabbit in release group because of technical problems with fluoroscopy. For sarcomere number data, n= 6 for each mean value.
Tendon length was not increased by EDL ablation
External tendon length for the experimental TA was significantly shorter (P < 0.05) for the release plus EDL ablation group (4.00 ± 0.24 cm) than for the release-only group (4.33 ± 0.28 cm). Proximal aponeurosis length (1.00 ± 0.09 cm versus 1.01 ± 0.12 cm) and distal aponeurosis length (2.63 ± 0.33 cm versus 2.37 ± 0.18 cm) were not significantly different between release plus ablation and release-only groups, although there was a trend of longer distal aponeurosis length in the release plus ablation group (P= 0.09). Thus, longitudinal tendon growth of the released TA was not increased by EDL ablation as predicted by the secondary hypothesis; however, tendons did appear to adapt differently to release plus ablation than to release only.
Rabbit growth and activity were not changed by EDL ablation
The mass of the rabbits at death (3.4 ± 0.3 kg versus 3.2 ± 0.4 kg), tibia length (10.7 ± 0.2 cm versus 10.6 ± 0.2 cm) and cage activity (46.2 ± 7.9 min versus 44.2 ± 5.7 min) were not significantly different for the release plus ablation group versus the release-only group, suggesting that EDL ablation did not appreciably affect the mass, tibial growth, or cage activity levels of the animals.
In vivo ankle joint kinematics were changed by EDL ablation
For the experimental leg, swing time (0.15 ± 0.01 versus 0.14 ± 0.01 s), the maximum ankle joint angle (122 ± 14 versus 109 ± 10 deg), ankle joint excursion (55 ± 13 versus 62 ± 10 deg), and maximum velocity of dorsiflexion (970 ± 197 versus 1128 ± 120 deg s−1) for hopping on the treadmill were not significantly different for the release plus ablation versus the release-only group. The minimum ankle joint angle during hopping was significantly larger for the release plus ablation group (68 ± 3 deg) than for the release-only group (47 ± 9 deg). Thus, ablation of the EDL appeared to reduce dorsiflexion of the ankle during the swing phase of treadmill hopping.
Excursion and sarcomere number were linearly related
Plots of mean TA sarcomere number (for both superficial and deep fascicles) versus mean muscle excursion for each group of this study (plus an EDL ablation-only group) showed significant linear relationships (Fig. 7). This supports the working hypothesis that excursion is important in regulating sarcomere number in these growing rabbits.
Figure 7. Plot of TA sarcomere number (for superficial and deep fascicles) versus TA muscle excursion.

•, superficial; ▪, deep. Data for control (C), sham-operated (S), release-only (R), release plus ablation (R + A), and ablation only (A) groups included (each data point represents mean value with s.d. bars for 6 rabbits). Least-squares linear regression yielded significant (P < 0.001) fits for both superficial (y= 3470x+ 12970; r2= 0.98) and deep (y= 4080x + 7960; r2 = 0.99) fascicles.
DISCUSSION
Previous studies have suggested that muscle excursion may be important in regulating sarcomere number in growing animals (Crawford, 1954, 1961; Williams & Goldspink, 1971, 1978). However, changes in the in vivo mechanical environment of the muscle (excursion, force production, joint kinematics, animal activity) were not measured in these studies; thus this hypothesis could not be evaluated.
Primary hypothesis
The primary hypothesis of this study was that increasing excursion results in increased serial sarcomere addition following TA release in growing animals. TA release resulted in increased muscle excursion, and in increased sarcomere number in both superficial and deep fascicles of the TA. The increase in sarcomere number occurred despite the working length of the muscle being reduced for all but the most plantarflexed ankle joint positions (Fig. 1); decreased working length has been associated with decreased sarcomere number for immobilization experiments using adult muscle (Tabary et al. 1972; Williams & Goldspink, 1978).
TA release did not appreciably affect rabbit mass or tibia length, nor cage activity over a 24 h period. These results suggest that increased serial sarcomere addition in the released TA was not the result of changes in animal growth or activity. In addition, TA release did not appreciably affect the ankle joint kinematics of the experimental leg during hopping on a treadmill, suggesting that the increased serial sarcomere addition was not due to a chronic change in ankle joint kinematics. The architecture of the soleus muscle (both sarcomere number and PCSA) is highly sensitive to changes in the mechanical environment (Lieber, 1992); the absence of an effect of TA release on soleus architecture provides further evidence that chronic changes in joint kinematics or hindlimb loading were not responsible for the increased serial sarcomere addition in the released TA. Finally, the mean sarcomere number and mean muscle excursion for all of the experimental groups of this study showed a linear relationship. Taken together, these results support the hypothesis that increased excursion results in increased serial sarcomere addition following TA release in growing animals.
The percentage increase in muscle excursion was larger than the percentage increase in sarcomere number for the released TA. This may simply indicate that muscle excursion does not regulate sarcomere number in a one-to-one manner. Another explanation for the discrepancy between the increases in muscle excursion and sarcomere number is that the excursion over which the TA is normally active may not be increased by release as much as the total TA excursion. However, the estimated TA muscle excursion during force production in treadmill hopping for the release group (1.74 ± 0.30 cm) was 40 % greater than that for the control group (1.24 ± 0.11 cm). Thus, the muscle excursion during force production in hopping was increased by the same percentage as total muscle excursion.
Two further possible explanations for the greater increase in excursion than in sarcomere number are: (1) that muscle excursion does not accurately reflect excursion at the sarcomere level (the latter is likely more important for mechanical signal transduction in the muscle cell), possibly because of sliding of in-series fibres within a fascicle past each other, and (2) that muscle excursion is not increased as much immediately post release in 4-week-old rabbits as after 12 weeks of growth. To examine these possibilities, the increase in sarcomere excursion with release was estimated in a separate group of 4-week-old rabbits (following Muhl, Grimm & Glick, 1978). For six rabbits, the left TA was fixed in formalin in full plantarflexion and the right TA was fixed in full dorsiflexion; three rabbits had bilateral TA releases, and the other three served as controls. Released muscle excursion (1.59 ± 0.10 cm) was greater than control muscle excursion (1.23 ± 0.10 cm) and sarcomere excursion for the released muscle (1.24 ± 0.03 μm) was greater than that for control muscle (0.98 ± 0.08 μm). The similar percentage increase in muscle (29 %) and sarcomere (27 %) excursion with release suggests that muscle excursion reflects sarcomere excursion fairly well, and that in-series fibre sliding does not appreciably affect passive sarcomere length changes. These measurements in fixed muscles from 4-week-old rabbits showed a smaller percentage increase in muscle excursion than the fluoroscopic measurements after 12 weeks of growth (29 %versus 40 %). If these measurements represent a real increase with age in the effect of release on muscle excursion, the stimulus for serial sarcomere addition may not be as great as would be indicated by the increase in muscle excursion after the 12 week growth period (40 %), but would still be greater than the percentage increase in sarcomere number.
Secondary hypothesis
The secondary hypothesis of this study was that decreased TA force production results in increased serial sarcomere addition following TA release. TA release decreased the in vivo force production of the TA for a variety of activities that required both small and large force magnitudes. Decreased maximum in situ isometric force and PCSA for the released TA support the argument that force production was chronically decreased in the released TA.
Chronically decreased force production of the released TA may not have provided a sufficient stimulus for normal longitudinal tendon growth, as external tendon, proximal aponeurosis, and distal aponeurosis lengths were shorter than control. A link between tension and longitudinal tendon growth is supported by previous observations that longitudinal tendon growth is increased when growing muscle is immobilized in a stretched position, and that this increase can be attenuated by denervating the immobilized muscle (Blanchard et al. 1985). In addition, decreased tendon growth has been associated with surgical shortening of bone; a chronic decrease in tension may be important in this model as well (Tardieu et al. 1983).
Decreased longitudinal tendon growth would chronically increase the working length of the released TA. Since chronically increased muscle length has been shown to be a stimulus for serial sarcomere addition (Tabary et al. 1972; Tardieu et al. 1977), this sequence of events could be responsible for the increase in serial sarcomere addition observed.
Although partial ablation of the EDL increased in vivo force production in the released TA in the present study, increasing the force production of the released TA did not inhibit the increased growth in sarcomere number associated with release. Thus the secondary hypothesis that decreased TA force production was responsible for increased serial sarcomere addition was not supported by these results.
The increased minimum angle of the ankle joint during hopping for the release plus ablation group compared with the release-only group may have been due to a decreased ability to dorsiflex the foot when EDL force production is removed. The increased force production of the TA may not have been enough to compensate for EDL ablation (the contribution of the EDL to dorsiflexion is unknown, as EDL forces were not measured). However, the change in kinematics appeared not to affect TA serial sarcomere addition, as TA sarcomere number was not different for release plus ablation and release-only groups.
Partial ablation of the EDL did not increase longitudinal tendon growth as predicted by the secondary hypothesis. Ablation did appear to decrease external tendon length (by 3 mm) and showed a trend of increasing distal aponeurosis length (by 3 mm). Thus, ablation seemed to alter the relative distribution of internal and external tendon lengths. In summary, upon examination of all the groups of this study, no clear relationship between TA force production and longitudinal tendon growth could be discerned.
Other considerations
Adaptations in sarcomere number associated with immobilization of adult muscle appear to produce near-optimal sarcomere length at the immobilized muscle length (Williams & Goldspink, 1978). Thus, such adaptations appear to allow optimum isometric force production at the immobilized muscle length. In the present study, increasing the excursion of the growing TA produced an increased sarcomere number in the released TA compared with control. Without such an increase in sarcomere number, the increased excursion of the released TA would increase the amount and rate of shortening that individual sarcomeres would have to undergo to produce a given amount of ankle dorsiflexion. This would decrease the force potential of the TA muscle, based on the force-length (Gordon, Huxley & Julian, 1966) and force-velocity relationships (Hill, 1938) of skeletal muscle. Thus, the increase in sarcomere number associated with TA release may restore the functional capabilities of the muscle. In support of this idea, Crawford (1961) has shown that the plateau of the force-length relationship is indeed wider for released compared with control TA muscles.
Satellite cell proliferation and fusion may be important in adaptive longitudinal growth of muscle fascicles. Moss & Leblond (1971) have demonstrated that satellite cells are the source of myonuclei during growth. Williams & Goldspink (1971) presented electron microscopic evidence for satellite cell fusion at the end of growing muscle fibres. Cyclic stretch of muscle cells has been shown to release insulin-like growth factor 1 (IGF-1; Perrone, Fenwick-Smith & Vandenburgh, 1995), which, in turn, stimulates proliferation and differentiation of satellite cells (Allen & Rankin, 1990). Thus increased excursion following release could increase the rate of proliferation and differentiation of satellite cells, which could be involved in increased serial sarcomere addition.
Cyclic stretch (which could be considered excursion) has been shown to increase DNA, RNA and protein synthesis and accumulation in cultured cells of different types (e.g. muscle: Vandenburgh, Hatfaludy & Shansky, 1989; tendon: Banes et al. 1995; endothelial: Awolesi, Sessa & Sumpio, 1995). For muscle cells, cyclic stretch increases the growth in length and diameter of cultured myotubes (Vandenburgh et al. 1989); however, the influence of cyclic stretch on sarcomere number in myotubes has not been investigated. Although controlled comparisons of static versus cyclic strain appear not to have been made for muscle cells, cyclic strain appears to be better than static strain for preventing bone loss and producing new bone formation in vivo (Lanyon & Rubin, 1984).
The series-fibred architecture of the TA provides different possibilities for increasing sarcomere number in fascicles spanning the distance between proximal and distal aponeuroses. Fascicle sarcomere number (or fascicle length) could be increased by (1) sliding of fibres past each other during adaptation without sarcomere addition, (2) addition of sarcomeres only to the ends of the fibres at the proximal and/or distal aponeurosis without such fibre sliding, or (3) addition of sarcomeres to all fibres with concomitant sliding of fibres. These possibilities remain unexplored and would be intriguing issues for future study.
The interpretation of the data for this study is limited by the lack of information about the mechanical environment at time points other than those immediately prior to the killing of the animal. The possibility exists that differences in the mechanical environment between groups changed over the growth period. For example, excursion was increased more in the measurements immediately prior to death (40 %) than in the measurements immediately after release (29 %). However, in both measurements excursion was significantly increased, and the difference between measurements does not substantially affect the interpretation of the data. In addition, visual observation of the rabbits suggested that joint kinematics did not change appreciably over time (each rabbit was observed at least once per week). The observation that changes in cross-sectional area of the muscle, as well as the maximum in situ isometric muscle force, paralleled changes in in vivo force production supports the argument that force production was chronically decreased in the released TA. Hence the possibility that a change in the mechanical environment over time would affect the interpretation of the results is considered unlikely.
The interpretation of the data for this study is also limited by the lack of knowledge of unmeasured factors that could influence sarcomere number regulation. For example, the surgical procedure for release could have produced unknown systemic factors that may have influenced serial sarcomere addition. The age-matched control and sham-operated animals should control for the effects of growth and the surgical procedures (apart from TA release). However, the results may have been influenced by unknown interactions between muscle growth and TA release. Nonetheless, the results are pertinent to understanding the regulation of sarcomere number in growing animals.
In conclusion, the results of this study support the working hypothesis that muscle excursion is important in regulating sarcomere number following TA release in growing animals. Characterization of the in vivo mechanical environment of the TA allowed direct correlation of excursion and sarcomere number, and allowed the exclusion of altered cage activity, ankle joint kinematics and TA force production as possible factors contributing to altered serial sarcomere addition. The cellular mechanisms that regulate sarcomere number also remain an exciting area for future study.
Acknowledgments
The authors would like to thank the Alberta Heritage Foundation for Medical Research, the Natural Sciences and Engineering Research Council of Canada and The Killam Foundation for financial support. Thanks to Dr Brian MacIntosh for use of the laser diffraction equipment and to Dr MacIntosh and Dr John Matyas for critical comments. Superb technical support was provided by Timothy Leonard, Andrzej Stano, Hoa Nguyen, Heather Finch, Lorraine Poulin and Sue Henderson.
References
- Allen RE, Rankin LL. Regulation of satellite cells during skeletal muscle growth and development. Proceedings of the Society for Experimental Biology and Medicine. 1990;194:81–86. doi: 10.3181/00379727-194-43060. [DOI] [PubMed] [Google Scholar]
- Allinger TL. Calgary, AB, Canada: University of Calgary; 1995. Stability and the descending limb of the force-length relation in mouse skeletal muscle—a theoretical and experimental examination. PhD Dissertation. [Google Scholar]
- Awolesi MA, Sessa WC, Sumpio B. Cyclic strain upregulates nitric oxide synthase in cultured bovine aortic endothelial cells. Journal of Clinical Investigation. 1995;96:1449–1454. doi: 10.1172/JCI118181. [DOI] [PMC free article] [PubMed] [Google Scholar]
- Banes AJ, Tsuzaki M, Hu P, Brigman B, Brown T, Almekinders L, Lawrence WT, Fischer T. PDGF-BB, IGF-1, and mechanical load stimulate DNA synthesis in avian tendon fibroblasts in vitro. Journal of Biomechanics. 1995;28:1505–1513. doi: 10.1016/0021-9290(95)00098-4. [DOI] [PubMed] [Google Scholar]
- Blanchard O, Cohen-Solal L, Tardieu C, Allain JC, Tabary C, le Lous M. Tendon adaptation to different long term stresses and collagen reticulation in soleus muscle. Connective Tissue Research. 1985;13:261–267. doi: 10.3109/03008208509152405. [DOI] [PubMed] [Google Scholar]
- Crawford GNC. An experimental study of muscle growth in the rabbit. Journal of Bone and Joint Surgery. 1954;36B:294–303. doi: 10.1302/0301-620X.36B2.294. [DOI] [PubMed] [Google Scholar]
- Crawford GNC. Experimentally induced hypertrophy of growing voluntary muscle. Proceedings of the Royal Society. 1961;B 154:133–138. doi: 10.1098/rspb.1961.0024. [DOI] [PubMed] [Google Scholar]
- Crawford GNC. The growth of striated muscle immobilized in extension. Journal of Anatomy. 1973;114:165–183. [PMC free article] [PubMed] [Google Scholar]
- Davison PF. The organization of collagen in growing tensile tissues. Connective Tissue Research. 1992;28:171–179. doi: 10.3109/03008209209015034. [DOI] [PubMed] [Google Scholar]
- Goldspink G. Malleability of the motor system: a comparative approach. Journal of Experimental Biology. 1985;115:375–391. doi: 10.1242/jeb.115.1.375. [DOI] [PubMed] [Google Scholar]
- Gordon AM, Huxley AF, Julian FJ. The variation in isometric tension with sarcomere length in vertebrate muscle fibres. Journal of Physiology. 1966;184:170–192. doi: 10.1113/jphysiol.1966.sp007909. [DOI] [PMC free article] [PubMed] [Google Scholar]
- Herring SW, Grimm AF, Grimm BR. Regulation of sarcomere number in skeletal muscle: A comparison of hypotheses. Muscle and Nerve. 1984;7:161–173. doi: 10.1002/mus.880070213. [DOI] [PubMed] [Google Scholar]
- Herzog. W, Stano A, Leonard TR. Telemetry system to record force and EMG from cat ankle extensor and tibialis anterior muscles. Journal of Biomechanics. 1993;26:1463–1471. doi: 10.1016/0021-9290(93)90097-x. 10.1016/0021-9290(93)90097-X. [DOI] [PubMed] [Google Scholar]
- Hill AV. The heat of shortening and the dynamic constants of muscle. Proceedings of the Royal Society. 1938;126:136–195. doi: 10.1098/rspb.1949.0019. [DOI] [PubMed] [Google Scholar]
- Koh TJ. University of Calgary; 1997. Regulation of sarcomere number in the growing rabbit tibialis anterior. PhD Thesis. [DOI] [PMC free article] [PubMed] [Google Scholar]
- Lanyon LE, Rubin CE. Static versus dynamic loads as an influence on bone remodeling. Journal of Biomechanics. 1984;17:897–905. doi: 10.1016/0021-9290(84)90003-4. 10.1016/0021-9290(84)90003-4. [DOI] [PubMed] [Google Scholar]
- Lieber RL. The Structure and Function of Skeletal Muscle. Baltimore: Williams and Wilkins; 1992. [Google Scholar]
- Loeb GE, Gans C. Electromyography for Experimentalists. University of Chicago; 1986. [Google Scholar]
- Mackay B, Harrop TJ. An experimental study of the longitudinal growth of skeletal muscle in the rat. Acta Anatomica. 1969;72:38–49. doi: 10.1159/000143234. [DOI] [PubMed] [Google Scholar]
- Mendez RA, Keys A. Density and composition of mammalian muscle. Metabolism. 1960;9:184–188. [Google Scholar]
- Moss FP, Leblond CP. Satellite cells as the source of nuclei in muscles of growing rats. Anatomical Record. 1971;170:421–435. doi: 10.1002/ar.1091700405. [DOI] [PubMed] [Google Scholar]
- Muhl ZF, Grimm AF, Glick PL. Physiologic and histologic measurements of the rabbit digastric muscle. Archives of Oral Biology. 1978;23:1051–1059. doi: 10.1016/0003-9969(78)90108-5. 10.1016/0003-9969(78)90108-5. [DOI] [PubMed] [Google Scholar]
- O'Dwyer NJ, Neilson PD, Nash J. Mechanisms of muscle growth related to muscle contracture in cerebral palsy. Developmental Medicine and Child Neurology. 1989;31:543–547. doi: 10.1111/j.1469-8749.1989.tb04034.x. [DOI] [PubMed] [Google Scholar]
- Perrone CE, Fenwick-Smith D, Vandenburgh HH. Collagen and stretch modulate autocrine secretion of insulin-like growth factor-1 and insulin-like growth factor binding proteins from differentiated skeletal muscle cells. Journal of Biological Chemistry. 1995;270:2099–2106. doi: 10.1074/jbc.270.5.2099. 10.1074/jbc.270.5.2099. [DOI] [PubMed] [Google Scholar]
- Sacks RD, Roy RR. Architecture of the hind limb muscles of cats: functional significance. Journal of Morphology. 1982;173:185–195. doi: 10.1002/jmor.1051730206. [DOI] [PubMed] [Google Scholar]
- Simpson AHR, Williams PE, Kyberd P, Goldspink G, Kenwright J. The response of muscle to leg lengthening. Journal of Bone and Joint Surgery. 1995;77B:630–636. [PubMed] [Google Scholar]
- Spector SA, Gardiner PF, Zernicke RF, Roy RR, Edgerton VR. Muscle architecture and force-velocity characteristics of cat soleus and medial gastrocnemius: implications for motor control. Journal of Neurophysiology. 1980;44:951–960. doi: 10.1152/jn.1980.44.5.951. [DOI] [PubMed] [Google Scholar]
- Tabary JC, Tabary C, Tardieu C, Tardieu G, Goldspink G. Physiological and structural changes in the cat's soleus muscle due to immobilization at different lengths by plaster casts. Journal of Physiology. 1972;224:231–244. doi: 10.1113/jphysiol.1972.sp009891. [DOI] [PMC free article] [PubMed] [Google Scholar]
- Tabary JC, Tardieu C, Tardieu G, Tabary C, Gagnard L. Functional adaptation of sarcomere number of normal cat muscle. Journal of Physiology (Paris) 1976;72:277–291. [PubMed] [Google Scholar]
- Tardieu C, Blanchard O, Tabary JC, le Lous M. Tendon adaptation to bone shortening. Connective Tissue Research. 1983;11:35–44. doi: 10.3109/03008208309015009. [DOI] [PubMed] [Google Scholar]
- Tardieu C, Tabary JC, Tabary C, Huet de la Tour E. Comparison of sarcomere number adaptation in young and adult animals. Journal of Physiology (Paris) 1977;73:1045–1055. [PubMed] [Google Scholar]
- Vandenburgh HH, Hatfaludy S, Shansky J. Skeletal muscle growth is stimulated by intermittent stretch/relaxation in tissue culture. American Journal of Physiology. 1989;256:C674–682. doi: 10.1152/ajpcell.1989.256.3.C674. [DOI] [PubMed] [Google Scholar]
- Williams PE, Goldspink G. Longitudinal growth of striated muscle fibers. Journal of Cell Science. 1971;9:751–767. doi: 10.1242/jcs.9.3.751. [DOI] [PubMed] [Google Scholar]
- Williams PE, Goldspink G. Changes in sarcomere length and physiological properties in immobilized muscle. Journal of Anatomy. 1978;127:459–468. [PMC free article] [PubMed] [Google Scholar]