Abstract
In anaesthetized rats, using a focal recording technique, activity was recorded from single sympathetic postganglionic neurones innervating the lateral tail veins. On-going activity was examined in order to determine whether it had similar or different characteristics to those recorded from the caudal ventral artery in a previous study.
Animals were artificially ventilated, vagotomized, paralysed and given a pneumothorax.
The discharges of fourteen out of seventeen sympathetic postganglionic neurones were rhythmic. Such units had a mean firing frequency of 1.62 ± 0.70 Hz. The mean frequency of the dominant sympathetic rhythm under control conditions was 0.82 ± 0.05 Hz.
The frequency of the dominant sympathetic rhythm was different from that of the phrenic rhythm in nine out of fourteen cases.
The mean frequency of the dominant sympathetic rhythm was: (i) not influenced significantly by hypocapnic apnoea, (ii) decreased by hyperthermia, which increased the frequency of the phrenic rhythm, (iii) in all cases different from that of the artificial ventilation cycle.
The above characteristics are similar to those recorded from the sympathetic supply to the caudal ventral artery of the same vascular bed under comparable conditions.
The degree of sympathetic innervation of veins varies between circulations. For example, abdominal and cutaneous veins are richly innervated by sympathetic nerves, whereas most muscle veins are, at best, weakly innervated (Fuxe & Sedvall, 1965; Furness & Marshall, 1974; Shepherd & Vanhoutte, 1975; Marshall, 1982): not surprisingly, the responses to stimulation of their nerve supplies reflects this (Donegan, 1921; Furness & Marshall, 1974; Marshall, 1982). The rich innervation of abdominal and cutaneous venous beds is compatible with the idea that both are potential major volume reservoirs, at least in humans (Rowell, 1986; Hainsworth, 1990).
It is probable that the innervation of arteries and that of veins arises from distinct populations of postganglionic neurones: Dehal, Kartseva & Weaver (1992) found that following application of retrograde tracers to a femoral artery and vein, separate populations of postganglionic sympathetic neurones were labelled. This observation provides an anatomical basis for the differential control of resistance and capacitance vessels. Differential control is also indicated by studies that demonstrate that the frequency- response curves (to sympathetic nerve stimulation) of arteries and veins are different, with venous responses being maximal at lower frequencies of electrical stimulation (Karim & Hainsworth, 1976; Nilsson, Ljung, Sjöblom & Wallin, 1985; Kreulen, 1986). However, it is unknown whether the natural discharges in sympathetic nerves supplying arteries and veins are different or similar.
Studies from this laboratory using a focal recording technique (Johnson & Gilbey, 1994, 1996) characterized, for the first time, the on-going discharges of single sympathetic neurones innervating an identified blood vessel, the caudal ventral artery of the rat tail: the circulation of the rat tail plays a major role in thermoregulation (see Gordon, 1990). Briefly, discharges were found to occur principally in bursts. The bursts could be highly rhythmical, were unaffected by hypocapnic apnoea, and their frequency decreased during whole-body warming as did mean firing frequency. In addition, the frequency of the sympathetic bursts (dominant sympathetic rhythm) could be similar or different from that of the rhythmic phrenic discharge (an indicator of central respiratory drive). It is likely that the dominant sympathetic rhythm is neither generated by a central respiratory oscillator nor by afferent feedback relayed via sinus, aortic or vagus nerves. The dominant sympathetic rhythm was termed the tail (T) rhythm by Johnson & Gilbey (1996).
The principal veins of the tail are the lateral (caudal) veins (Thorington, 1966); for a diagram of the vascular anatomy of the rat tail see Young & Dawson (1981). Using angiography, Young & Dawson (1981) demonstrated that, during heat-induced vasodilatation of the tail, blood entered mainly via the caudal ventral artery and drainage was chiefly via the lateral veins. As it has been demonstrated that the lateral veins of the tail also receive a relatively dense sympathetic innervation (Andrews, 1993), in the present study the discharges of single sympathetic nerve fibres recorded from the surface of lateral veins were characterized. So as to determine whether artery and vein receive similar or different sympathetic drives, the characteristics of sympathetic discharges recorded from the lateral vein have been compared with those recorded previously from the caudal ventral artery (Johnson & Gilbey, 1994, 1996). In order to do this, the same protocols were followed as described by Johnson & Gilbey (1996) for the caudal ventral artery using vagotomized, paralysed and artificially ventilated anaesthetized preparations.
A preliminary account of this work has been published as an abstract (Johnson & Gilbey, 1995).
METHODS
Anaesthesia and general animal maintenance
Experiments were conducted on twelve male Sprague-Dawley rats (220-310 g) anaesthetized initially with sodium pentobarbitone (60 mg kg−1, i.p.). Animals were paralysed (gallamine triethiodide, 16 mg kg−1 h−1, i.v.), artificially ventilated, given a pneumothorax and had their vagi cut. The depth of anaesthesia was monitored continuously and supplements of α-chloralose (10-30 mg kg−1, i.v.) given when required, as judged from: (i) the stability of heart rate, blood pressure, phrenic nerve activity (or respiratory movements); (ii) the size of pupils; and (iii) palpebral and paw-pinch reflexes. Animals were paralysed during periods of data collection. Before periods of paralysis the depth of anaesthesia was assessed as described above, and during periods of paralysis by monitoring heart rate, blood pressure and phrenic nerve discharge. The animals were killed by an overdose of sodium pentobarbitone (i.v.).
A femoral artery and vein were cannulated to monitor arterial blood pressure and administer drugs, respectively. The trachea was cannulated low in the neck and the animals were ventilated artificially (70-120 breaths min−1) using O2-enriched room air. Peak expiratory CO2 was monitored continuously and arterial blood samples (75 μl) were taken regularly. During normocapnia, arterial pH and gas tensions were kept within the following ranges: pH, 7.30-7.45; PCO2, 38-50 mmHg; PO2, 100-200 mmHg. Oesophageal temperature was monitored and maintained at 37.0 ± 0.5°C (under control conditions). The bladder was cannulated to allow free passage of urine. Mean arterial blood pressure during recordings from sympathetic postganglionic neurones (n = 17) was 98 ± 3 mmHg. For further details see Johnson & Gilbey (1994, 1996).
Preparation of nerves
The preparation of the nerves for stimulation and/or recording have been described previously, as have recording techniques (Johnson & Gilbey, 1994). Activity was recorded from a phrenic nerve (an indicator of central respiratory drive). Either the lumbar sympathetic chain was stimulated (1 ms pulse, 5-10 V) or two needle electrodes were placed in the ventral tendons at the base of the tail, one on either side, so that postganglionic sympathetic axons in the collector nerves could be stimulated (1-10 ms pulse, 10-100 V; see below).
To record sympathetic activity from nerve fibres on the surface of the lateral tail vein, the tip (i.d., 20-50 μm) of a focal recording electrode (pulled from GC 150T-10 capillary glass; Clarke Electromedical Instruments, Reading, UK) filled with Krebs solution was placed on the vessel and a ‘seal’ between the tip and the vessel was achieved by applying gentle suction. The lateral veins (left and right) lie in small lateral grooves. The same initial procedures as those used to expose the caudal ventral artery were followed (see Johnson & Gilbey, 1994) except that lateral skin flaps were retracted further. Fine forceps were then used to remove surrounding connective tissue.
Data collection and analysis
All signals were processed as described previously (see Johnson & Gilbey, 1994, 1996) before being transferred to the computer, tape recorder and display modules. All neuronal activities were amplified (100 000-200 000 times) and filtered (unit activity, 300-1200 Hz; phrenic activity, 5-1500 Hz). Unit activity, phrenic nerve activity, blood pressure, tracheal pressure and trigger pulses were digitized (11 800 samples s−1 channel−1; VR100-B, Instrutech, USA) and recorded on tape using a standard video recorder (Panasonic, NV-5025). Oesophageal temperature was registered on the voice channel. The distance between stimulating and recording electrodes and the latency of the evoked action potential were estimated so that the ‘conduction velocity’ of the evoked action potential could be calculated.
Interspike interval histograms (ISIHs), autocorrelograms and crosscorrelograms (bin width, 50 ms) were computed using hardware and software described previously (Johnson & Gilbey, 1994). Phrenic nerve activity was rectified and smoothed and then fed into an interface that generated a transistor-transistor logic (TTL) pulse when phrenic nerve activity reached a preset level. Such TTL pulses were used to produce autocorrelograms showing the periodicities of rhythmic phrenic discharges; frequencies were calculated as the reciprocal of these (see below).
Protocols
Assessment of pattern of sympathetic unit activity and frequency of the dominant sympathetic rhythm and phrenic rhythm during normocapnia and normothermia
These were assessed using 300 s data sets (except where specified). Autocorrelograms showing the periodicity of phrenic nerve discharges were generated using the TTL pulses produced from such discharges (see above), and those of sympathetic unit activity were generated from TTL pulses produced from action potentials. The modal frequencies of the dominant sympathetic rhythm and the phrenic rhythm were calculated in each case from the reciprocal of the peak-to-peak time. These autocorrelograms were used to judge whether, in a particular case, the frequency of the dominant sympathetic rhythm and that of the phrenic rhythm were the same or different.
Assessment of the influence of hypocapnic apnoea
Unit and phrenic activity during normocapnia were analysed as described above. Hypocapnic apnoea was then induced by hyperventilation (n = 6). Mean ventilation rate was raised from 81 ± 4 to 109 ± 4 cycles min−1, and arterial CO2 pressure (Pa,CO2) was decreased to 38 ± 1 mmHg (range, 34-40 mmHg). Mean arterial blood pressure was not significantly changed from control values (98 ± 3 mmHg versus 100 ± 2 mmHg). A 300 s data section was analysed from a period commencing 5 min after the blood gases had equilibrated. The frequency of the dominant sympathetic rhythm was then compared in the two conditions.
Assessment of the influence of hyperthermia on the frequencies of the dominant sympathetic rhythm and phrenic rhythm
The animals were taken from normothermia to hyperthermia by whole-body warming using a heating blanket (Johnson & Gilbey, 1994). The frequency of phrenic discharge was normally decreased before warming by hyperventilating the animals. Data were recorded continuously during a normothermic control period of 5-10 min prior to heating, during warming, and in some cases during recovery as body temperature returned to the control level. Each animal was heated until activity in the sympathetic unit was minimal or absent. The frequency of the dominant sympathetic rhythm was calculated in the control period and in the 100 s data section prior to switch-off (see Results). Data sections of 100 s were analysed, not 300 s (as with analysis in other protocols), so that: (i) a change in frequency could be detected before the unit switched off; and (ii) a change in the unit rhythm as it slowed could be shown clearly, avoiding a ‘blurring’ of the rhythm peaks as the frequency changed during the heating ‘ramp’.
Statistical analysis
All results are expressed as means ±s.e.m. One-way analysis of variance (ANOVA), G test of independence, and Student's paired and unpaired t tests were used to assess significance (P < 0.05).
RESULTS
Identification of single sympathetic units
Recordings were ascribed as being from single sympathetic units using criteria similar to those described previously (see Johnson & Gilbey, 1994, 1996). Briefly, the shape and amplitude of discriminated on-going action potentials had to be similar to single action potentials evoked either following stimulation of the sympathetic chain or following activation of postganglionic sympathetic neurones (trans-tail stimulation) running in the collector nerves. Recordings were made from seventeen units conforming to the above criteria (Fig. 1A). In all six cases when the ganglion blocker chlorisondamine (3 mg kg−1, i.v.) was given, on-going activity ceased. In addition, the latencies of the evoked responses in all cases were consistent with conduction via sympathetic C fibre axons (mean conduction velocity, 0.39 ± 0.02 m s−1; range, 0.30-0.50 m s−1, n = 17). Such unit recordings were made from localized patches of vein, and, when found, fibres could only be tracked over short distances (< 2 mm).
Figure 1. Unit identification and mean firing frequency.
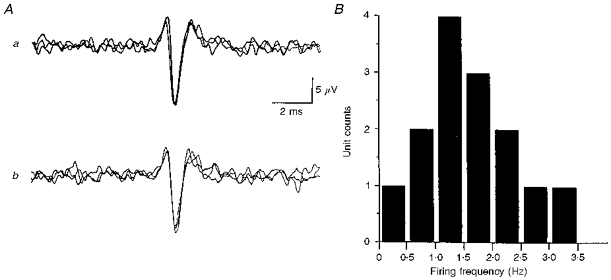
A, single unit identification: similar shape and amplitude of on-going and evoked action potentials. a, activity evoked in response to trans-tail stimulation (3 trials; sweep delay, 185 ms; distance between stimulus site and recording location, 80 mm). Such stimulation activates sympathetic postganglionic neurones innervating the lateral vein. Consequently, evoked responses have a constant latency. b, 3 superimposed on-going action potentials of the discriminated unit shown in a (TTL pulses generated from action potential used to trigger computer). B, histogram showing the distribution of mean firing frequencies of 14 rhythmically discharging sympathetic postganglionic neurones supplying the lateral vein.
As observed for activity recorded from single postganglionic neurones innervating the caudal ventral artery, activity recorded from single postganglionic neurones associated with the lateral vein characteristically (14/17) displayed rhythmical discharges (see Figs 2 and 3, and below).
Figure 2. Type A firing pattern where the modal frequency of the sympathetic rhythm is close to that of the phrenic rhythm.
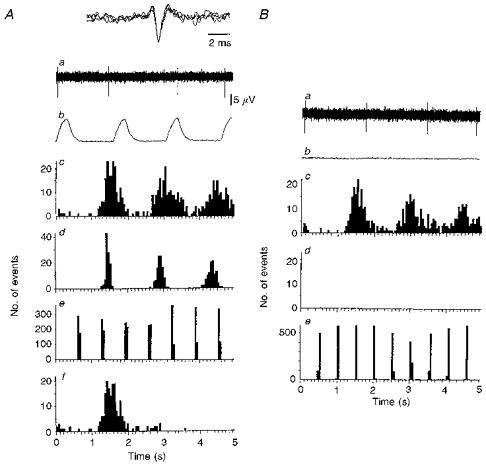
A and B are discharges from the same unit (no. 5 in Fig. 5A). A, normocapnia. B, hypocapnic apnoea. a, neurogram of unit activity where the dominant sympathetic rhythm presented as single action potentials. Inset in Aa, all action potentials in neurogram superimposed to demonstrate similar shape and amplitude characteristic of single units. b, rectified and smoothed phrenic activity over the same period as that shown in a. Note phrenic silence in Ab. c, autocorrelogram of unit activity shown in a (triggers over 300 s: A, 193; B, 183). d, autocorrelogram of phrenic bursts over same period as c (A, 200 triggers; B, 0 triggers - phrenic silence). e, autocorrelogram of lung inflation over same period as in c (derived from tracheal pressure: A, 464 triggers; B, 592 triggers). Af, ISIH of unit activity over same period as in c - type A firing profile. Comparing Ac with Ad, it can be seen that the activity of the sympathetic unit has a periodicity close to that of the phrenic bursts (nearly 1 : 1 relationship). As different peripheral delays cause phase shifts, allowing for about a 350 ms greater peripheral delay in the sympathetic outflow than the phrenic, sympathetic discharges fall mainly in early expiration (compare Aa and Ab). Note that comparing Ac with Ad does not provide any information regarding phase relationship as they are autocorrelograms.
Figure 3. Type B and C firing patterns.
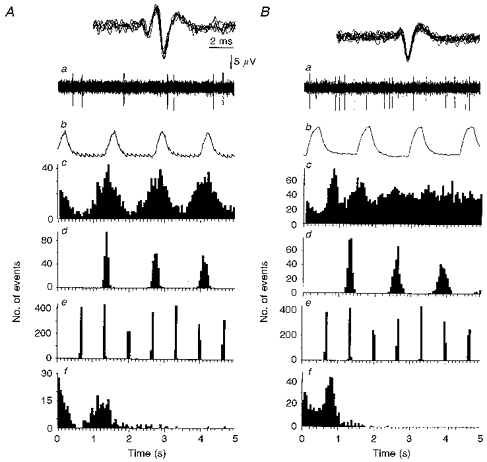
A, type B firing pattern where the modal frequency of the dominant sympathetic rhythm is the same as that of the phrenic rhythm. B, type C firing pattern where the modal frequency of the dominant sympathetic rhythm is different from that of the phrenic rhythm. a, neurogram of sympathetic unit activity showing discharges occurring in doublets (A), or characteristic bursts on ‘tonic’ (B). Inset, all action potentials in neurogram superimposed to demonstrate similar shape and amplitude characteristic of single units. b, rectified and smoothed phrenic activity over the same period as that shown in a. c, autocorrelogram of unit activity shown in a (A, 332 triggers over 300 s; B, 657 triggers over 300 s). d, autocorrelogram of phrenic bursts over the same period as in c (A, 220 triggers; B, 233 triggers). e, autocorrelogram of lung inflation over the same period as in c (derived from tracheal pressure: A, 452 triggers; B, 454 triggers). f, ISIH of unit activity over the same period as in c showing a typical type B profile (A, see text), or type C firing profile (B). In Ba, the rhythmical discharge of the sympathetic unit is not apparent from the neurogram. However, comparing the autocorrelograms in Bc and d, the ratio of the frequency of the dominant sympathetic rhythm to that of the phrenic is close to 3:2.
The mean firing frequency for units with rhythmical discharges was 1.62 ± 0.70 Hz (median, 1.46 Hz; range, 0.4-3.4 Hz; n = 14; Fig. 1B). The remaining three units had firing frequencies of 0.1, 0.7 and 1.3 Hz.
Firing patterns associated with rhythmic sympathetic discharges
Unit firing patterns were classified as one of three types following the examination of neurograms and ISIHs (300 s data sets; see Johnson & Gilbey, 1996): types A (3/14), B (2/14) and C (9/14) were characterized by rhythmical discharges involving single spikes, bursts of action potentials and bursts of action potentials on a background of tonic activity, respectively (Figs 2 and 3).
In the case of type A firing (n = 3), although the average firing frequency was low (0.89 ± 0.01 Hz), infrequent short interspike intervals were occasionally observed (see Fig. 2A) with a mean maximal instantaneous frequency of 24.67 ± 8.33 Hz. The mean modal intraburst frequency associated with type B firing (n = 2) was 19.5 ± 15.50 Hz (Fig. 3Af). For type C firing, the mean modal intraburst frequency was estimated as 34.66 ± 1.44 Hz (n = 4, Fig. 3Bf).
Although analysis of 300 s data sections allowed a classification of unit firing as either a type A, B or C, these must be considered as marker points in a continuum (see Johnson & Gilbey, 1996). This fact is highlighted by the observation that in all units transient changes in interspike interval distribution could be demonstrated by examining the same data sets but in consecutive 20 s periods (Fig. 4A).
Figure 4. Stability of pattern and rhythmicity.
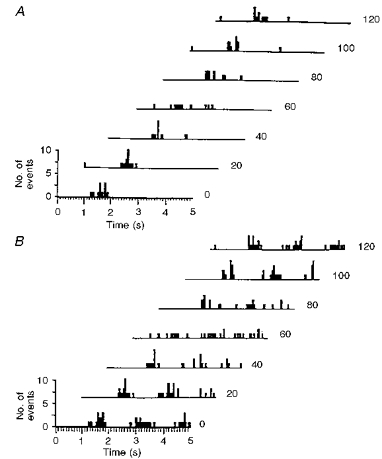
A, pattern. Waterfall ISIHs produced from 7 consecutive 20 s data sets showing a transient change in interspike interval distribution (3rd and 4th histograms from top). B, rhythmicity. Waterfall autocorrelograms (from same data set used in A) show that the rhythmic nature of the unit's discharge is disrupted concurrently with the change in interspike interval distribution (3rd and 4th histogram from top). Thus, pattern and rhythmicity over longer data sets are the ‘preferred’ pattern or rhythmicity of the unit.
Firing rhythmicity and stability
As judged by autocorrelation analysis (300 s data sets), fourteen out of seventeen units showed a dominant rhythm in their discharges (mean frequency, 0.82 ± 0.05 Hz). The discharge rhythm was unstable at times, which was apparent from autocorrelograms of short data sets (20 s) with pattern and/or frequency of the rhythmical discharge changing (Fig. 4B). By analysing six consecutive data sets of 50 s from ten units it was calculated that unit activity lost rhythmicity on average for 23% of a 300 s data series (range, 0-50%).
Relationship between the frequency of the dominant sympathetic rhythm and that of the phrenic rhythm
In five out of fourteen units the frequency of the dominant sympathetic rhythm was the same as that of the phrenic rhythm (mean frequency of both, 0.71 ± 0.03 Hz). An example of one case is shown in Fig. 3A, and the relationship between the two frequencies in individual cases is shown in a scatter diagram (Fig. 5A). In the remaining nine units the mean frequency of the dominant sympathetic rhythm (0.93 ± 0.03 Hz) was significantly different from that of the phrenic rhythm (0.61 ± 0.03 Hz) (see Fig. 3B, and scatter diagram in Fig. 5A for individual cases). Note that both integer and non-integer ratios are evident.
Figure 5. Scatter diagrams relating the frequency of the dominant sympathetic rhythm to the respiratory frequencies.
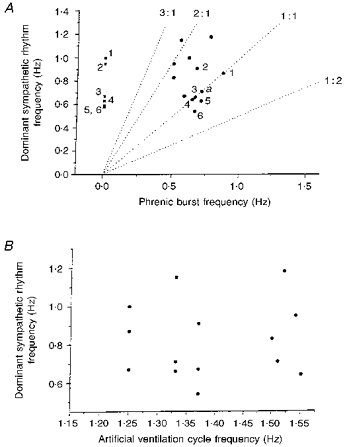
A, scatter diagram relating the frequency of the dominant sympathetic rhythm and that of the phrenic rhythm in 14 cases during normocapnia and normothermia, and 6 cases in hypocapnic apnoea (nos 1-6 indicate points taken from the same unit in both hypocapnia and normocapnia). ▪, during hypocapnic apnoea. •, during normocapnia (a denotes 2 cases superimposed). Dotted lines represent frequencies at which sympathetic and phrenic rhythms have a 3:1, 2:1, 1:1 and 1:2 relationship. Note that integer and non-integer ratios occur. B, scatter diagram relating the frequency of the dominant sympathetic rhythm to that of the artificial ventilation cycle during normocapnia and normothermia (n = 14). It can be seen that the artificial ventilation was never related 1:1 to the dominant sympathetic rhythm. Therefore the sympathetic bursts were not a direct result of the stimulation of afferents during the lung inflation cycle.
Persistence of dominant sympathetic rhythm during hypocapnic apnoea
Whilst recording from six units, activity was observed under control conditions and during hypocapnic apnoea (see Methods). Neither the frequency of the dominant sympathetic rhythm (0.74 ± 0.07 Hz during normocapnia versus 0.74 ± 0.08 Hz during hypocapnic apnoea) nor unit firing frequency (1.30 ± 0.32 versus 1.25 ± 0.32 Hz) were significantly influenced by hypocapnia. Data from one such experiment are shown in Fig. 2, and individual cases are shown in the scatter diagram in Fig. 5A.
Assessment of the influence of hyperthermia
The discharges of five units were recorded during whole-body warming. Data from a representative experiment are shown in Fig. 6. As core temperature increased, unit discharge frequency and the frequency of the dominant sympathetic rhythm were unaffected until a temperature of between 37.4 and 39.5°C (mean, 38.5 ± 0.36°C) was reached. As unit firing frequency declined, the dominant sympathetic rhythm slowed significantly (from 0.86 ± 0.10 to 0.64 ± 0.04 Hz) in the last 100 s period in which the rhythm was discernible. In two units the dominant sympathetic rhythm disappeared 300-400 s before activity disappeared. In contrast, phrenic frequency increased during whole-body warming. When unit activity had switched off, the frequency of the phrenic discharge had risen significantly (from 0.31 ± 0.14 to 0.66 ± 0.11 Hz). In two experiments where activities were recorded as the core temperature returned to control levels, the frequency of the dominant sympathetic rhythm was seen to return to its control value. In these two cases the rhythmicity of unit discharge was not apparent during part of the recovery (see Fig. 6).
Figure 6. Unit firing frequency, the dominant sympathetic rhythm and phrenic rhythm during whole-body warming to hyperthermia and return to normothermia.
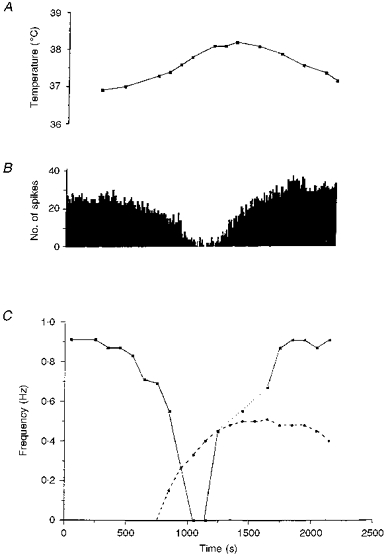
A, oesophageal temperature. B, histogram showing the firing frequency of the sympathetic unit (10 s bins). C, frequency of the dominant sympathetic rhythm (▪) and frequency of the phrenic rhythm (•). As temperature increased, the frequency of the phrenic rhythm increased. Meanwhile, the frequency of the dominant sympathetic rhythm decreased. During recovery, the sympathetic rhythm was lost transiently (dotted line). Note that the phrenic burst frequency remains elevated whilst that of the sympathetic rhythm returns to control.
The lung inflation cycle and the dominant sympathetic rhythm
From the scatter diagram shown in Fig. 5B it can be seen that for each of the cases presented in this paper the frequency of the dominant sympathetic rhythm was different from the frequency of artificial ventilation (see Figs 2 and 3 for examples). In addition, when hypocapnic apnoea was induced by increasing the frequency of ventilation there was no significant change in the frequency of the dominant sympathetic rhythm (compare Fig. 2A and B).
Crosscorrelation of phrenic and sympathetic activities
Crosscorrelation analysis was performed to examine the probability of sympathetic discharge during the various phases of the respiratory cycle. However, it was beyond the scope of the study to examine the mechanisms underlying the relationship (see Johnson & Gilbey, 1996). This complex problem is currently under investigation in our laboratory.
When the frequency of the dominant sympathetic rhythm and that of the phrenic discharge were the same or similar, crosscorrelograms (phrenic to sympathetic) showed peak activity that occurred during expiration (after adjusting for phase shift due to different central and peripheral delays) - see Fig. 7A and B. From Fig. 7C it can be seen that although there was a near 3:2 relationship between the dominant sympathetic rhythm and the phrenic frequency (see Fig. 3B), the greatest probability of sympathetic discharge was associated with expiration, although substantial activity also occurred during inspiration (Fig. 7C). This pattern of phrenic-related activity probably results from the fact that at the 3:2 ratio two sympathetic bursts occur during expiration for each burst that occurs during inspiration. When the frequency of the dominant sympathetic rhythm was twice that of the phrenic rhythm, two expiratory-related peaks were discernible (e.g. Fig. 7D). Note that in this example there is an augmented depression of activity associated with the phrenic discharge (inspiration). Interestingly, of the three units that showed no rhythmic activity, two showed a notable depression of activity during inspiration (close to the trigger point - see Fig. 7E).
Figure 7. Phrenic-triggered crosscorrelograms of unit activity.
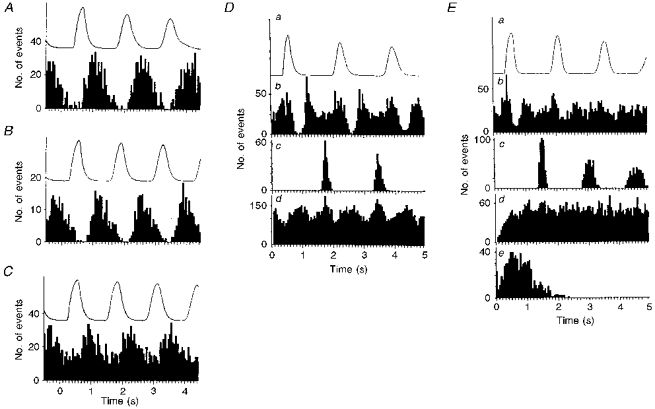
A, B and C, phrenic-triggered crosscorrelograms of unit activities shown in Figs 3A, 2A and 3B, respectively. In A and B, the frequencies of the dominant sympathetic rhythm and phrenic discharges were similar and identical, respectively (A, 200 triggers; B, 220 triggers; see Figs 2 and 3A). Note that in both cases peak activities occur during expiration with little if any activity during inspiration (phase relationships have been adjusted to take into account different conduction times in the two pathways). In C (233 triggers), although there was a close to 3:2 relationship between the dominant sympathetic rhythm and the phrenic frequency, peak activity also occurs during expiration but with substantial activity occurring during inspiration. This is probably because at this ratio two sympathetic bursts occur during expiration for each that occurs during inspiration. D and E (from different units) have the same format except that E contains an ISIH. In both D and E, all data shown are taken from the same 300 s data set. In D the frequency of the dominant sympathetic rhythm equals twice that of the phrenic rhythm, and in E there is no dominant sympathetic rhythm. For D and E: a, rectified and smoothed phrenic activity averaged over the period; b, phrenic-triggered crosscorrelogram of sympathetic activity over same period as in a (D, 181 triggers; E, 198 triggers); c, phrenic-triggered autocorrelogram (over the same period and same number of triggers as above); d, autocorrelograms of sympathetic unit activity (D, 884 triggers, E, 786 triggers). Ee, ISIH of unit activity.
Comparison of characteristics of activity recorded from the lateral vein and the caudal ventral artery
The characteristics of lateral vein and caudal ventral artery (taken from Johnson & Gilbey, 1996, and authors’ unpublished observations) unit activities were recorded from vagotomized and artificially ventilated animals where mean arterial blood pressure (MABP) and mean phrenic activity frequencies were not significantly different (see Table 1). Artery and vein unit responses to hypocapnia and to hyperthermia were similar: in hypocapnic apnoea both firing frequency and rhythm frequency were unperturbed, and during hyperthermia both firing frequency and rhythm frequency were decreased. Furthermore, when the frequency of the dominant sympathetic rhythm and that of the phrenic rhythm were the same, both in artery and vein, maximal sympathetic discharge occurred during expiration. Table 1 shows that in the various aspects of sympathetic activity examined, no significant differences were found between the sympathetic activity recorded from the surface of the two vessels. Note that comparisons were only made with artery data that were recorded from vagotomized, paralysed and artificially ventilated preparations with pneumothorax.
Table 1.
Comparison of lateral vein and caudal ventral artery sympathetic activities
| Variable | Caudal ventral artery | Lateral vein |
|---|---|---|
| MABP (mmHg) | 95 ± 3 | 98 ± 2 (n.s.) |
| (n = 17) | (n = 17) | |
| Phrenic frequency (Hz) | 0.70 ± 0.05 | 0.65 ± 0.03 (n.s.) |
| (n = 17) | (n = 14) | |
| DSR frequency (Hz) | 0.83 ± 0.03 | 0.82 ± 0.05 (n.s.) |
| (n = 17) | (n = 14) | |
| Mean unit firing | 1.78 ± 0.24 | 1.62 ± 0.70 (n.s.) |
| frequency (Hz) | (n = 17) | (n = 14) |
| Unit firing pattern† | ||
| Type A | n = 3* | n = 3 |
| Type B | n = 7* | n = 2 |
| Type C | n = 7* | n = 9 |
| Total | n = 17 | n = 14 |
| Units showing no rhythm in autocorrelogram | 1/18* | 3/17 |
| Percentage time not firing rhythmically (300 s) | 15* | 23 |
MABP, mean arterial blood pressure. DSR, dominant sympathetic rhythm. n.s., not significantly different to caudal ventral artery values.
Authors' unpublished results.
No significant difference between artery and vein distributions (G test). Caudal ventral artery data from Johnson & Gilbey (1996), except where indicated.
DISCUSSION
This is the first study that we are aware of in which the activity of single sympathetic units has been recorded from fibres on the surface of a vein; lateral veins of the rat tail. It is probable that activity was recorded from fibres supplying the lateral vein rather than those destined for other blood vessels as such unit recordings were made from localized patches of vein and, when found, fibres could only be tracked over short distances.
Comparison of activity recorded from the lateral vein and the caudal ventral artery
The recorded activity had similar characteristics to that recorded from the caudal ventral artery (see Johnson & Gilbey, 1996). As previously argued for the dominant sympathetic rhythm recorded from the caudal ventral artery, the dominant rhythm of discharge recorded from single sympathetic fibres on the surface of lateral veins does not appear to be derived from the central respiratory oscillator, as: (i) it can have a different frequency to central respiratory drive (not necessarily a harmonic frequency), as indicated by phrenic nerve discharge; (ii) it remained unperturbed during apnoea; and (iii) its frequency was decreased during whole-body warming when the phrenic frequency increased. Thus, the dominant sympathetic rhythm recorded from sympathetic fibres associated with lateral veins appears to be analogous to the T rhythm recorded previously from the caudal ventral artery (see Johnson & Gilbey, 1996, for full discussion).
As with the T rhythm recorded from sympathetic fibres innervating the caudal ventral artery, when the frequency of the dominant sympathetic rhythm supplying the vein was the same as that of the phrenic discharge, peak activity coincided with expiration (after allowing for different delays in the two pathways). Such a relationship is not necessarily indicative of modulation of sympathetic activity by central respiratory drive (see Johnson & Gilbey, 1996, for discussion). Indeed the frequency of the T rhythm and that of the phrenic rhythm were often different. As observed in the case of sympathetic activity destined for the caudal ventral artery (see Johnson & Gilbey, 1996), in addition to the T rhythm there may be respiratory modulation of activity (compared with respiratory-related activity): there was sometimes a tendency for relatively prolonged interspike intervals close to the point of phrenic-triggered crosscorrelograms. The phenomenon is currently under investigation in our laboratory.
The frequency of phrenic bursts was low in the current preparation, similar to that observed in our previous study (Johnson & Gilbey, 1996). This may, in part, reflect that the preparation was vagotomized and was given a pneumothorax, thus reducing the influence of reflex mechanisms that limit the duration of the respiratory cycle. In addition, this may reflect a depression of the central respiratory rhythm due to the affects of anaesthesia. It follows that the relationship seen between the phrenic rhythm and the T rhythm may be a consequence of anaesthesia. This is unlikely for two reasons. First, although no recordings using the focal electrode have been made in conscious animals, in the previous study (Johnson & Gilbey, 1996) ‘unlocking’ of the T and phrenic rhythms was observed in spontaneously breathing animals with afferents and chest wall intact. Second, recently we have observed the same relationship between phrenic and T-rhythm frequencies in Wistar rats anaesthetized with Saffan (Johnson, Marshall & Gilbey, 1997), an agent that is known to have less of a depressive influence than pentobarbitone-chloralose anaesthesia on forebrain influences over the cardiovascular system (Timms, 1981).
Functional implications of findings
These studies indicate that caudal ventral artery and lateral veins receive a similar sympathetic drive, at least in terms of the characteristics of the on-going discharges of the single postganglionic neurones innervating them. The mean discharge frequencies of rhythmically active units in similar preparations were the same in the two vessels. This may be considered somewhat surprising as the frequency response curves (to electrical stimulation) of resistance compared with capacitance vessels are strikingly different: that of capacitance vessels is much steeper than that of resistance vessels (see Introduction). This would indicate that the lateral tail vein receives maximal vasoconstrictor drive during normothermia. Conversely, during hyperthermia, sympathetic drive is decreased and switched off as it is in the caudal ventral artery (Johnson & Gilbey, 1994, 1996), thereby presumably minimizing changes in venous pressure and, consequently, capillary hydrostatic pressure resulting from the increase in tail blood flow (see Aukland & Wiig, 1984).
In conclusion, this study has examined the characteristics of on-going activity recorded from lateral tail veins in the rat. It is of particular interest that this activity seems similar to that recorded from the caudal ventral artery of the same vascular bed. This finding is in complete contrast to previous studies in which the findings were interpreted as indicating that activity to veins probably was of a lower frequency than that influencing resistance vessels (see Introduction). However, it is well known that many factors may influence the vascular response to sympathetic activity (Bevan, Bevan & Duckles, 1986), and differences in the density of the perivascular plexus of caudal ventral artery and lateral vein in rat tail have been found (Andrews, 1993). Therefore, the possibility remains that differential control of arterial and venous vessels may occur due to factors additional to patterning and frequency of action potentials in sympathetic postganglionic neurones. It remains to be established whether there is differential reflex control of these tail arteries and veins.
Acknowledgments
This study was supported by a Wellcome Trust project grant. Chlorisondamine was a gift from Ciba-Geigy Pharmaceuticals.
References
- Andrews T J. PhD Thesis. University of London; 1993. The role of targets and growth factors in neuronal ageing. [Google Scholar]
- Aukland K, Wiig H. Haemodynamics and interstitial fluid pressure in the rat tail. American Journal of Physiology. 1984;247:H80–87. doi: 10.1152/ajpheart.1984.247.1.H80. [DOI] [PubMed] [Google Scholar]
- Bevan J A, Bevan R D, Duckles S P. Adrenergic regulation of smooth muscle. In: Shepherd J T, Abboud F M, editors. Handbook of Physiology, section 2, The Cardiovascular System. III. Bethesda, MD, USA: American Physiological Society; 1986. pp. 515–566. part 1. [Google Scholar]
- Dehal N S, Kartseva A G, Weaver L C. Comparisons of locations and peptide content of postganglionic nerves innervating veins and arteries of the rat hindlimb. Journal of the Autonomic Nervous System. 1992;39:61–72. doi: 10.1016/0165-1838(92)90251-b. 10.1016/0165-1838(92)90251-B. [DOI] [PubMed] [Google Scholar]
- Donegan J F. The physiology of veins. Journal of Physiology. 1921;55:226–245. doi: 10.1113/jphysiol.1921.sp001964. [DOI] [PMC free article] [PubMed] [Google Scholar]
- Furness J B, Marshall J M. Correlation of the directly observed responses of mesenteric vessels of the rat to nerve stimulation and noradrenaline with the distribution of adrenergic nerves. Journal of Physiology. 1974;239:75–88. doi: 10.1113/jphysiol.1974.sp010556. [DOI] [PMC free article] [PubMed] [Google Scholar]
- Fuxe K, Sedvall G. The distribution of adrenergic nerve fibers to the blood vessels in skeletal muscle. Acta Physiologica Scandinavica. 1965;64:75–86. doi: 10.1111/j.1748-1716.1965.tb04155.x. [DOI] [PubMed] [Google Scholar]
- Gordon C J. Thermal biology of the laboratory rat. Physiology and Behaviour. 1990;47:963–991. doi: 10.1016/0031-9384(90)90025-y. 10.1016/0031-9384(90)90025-Y. [DOI] [PubMed] [Google Scholar]
- Hainsworth R. The importance of vascular capacitance in cardiovascular control. News in Physiological Sciences. 1990;5:250–255. [Google Scholar]
- Johnson C D, Gilbey M P. Sympathetic activity recorded from the rat caudal ventral artery in vivo. Journal of Physiology. 1994;476:437–442. doi: 10.1113/jphysiol.1994.sp020145. [DOI] [PMC free article] [PubMed] [Google Scholar]
- Johnson C D, Gilbey M P. Characteristics of sympathetic unit activity supplying the lateral tail vein in the anaesthetized rat. Journal of Physiology. 1995;483.P:103–104P. [Google Scholar]
- Johnson C D, Gilbey M P. On the dominant rhythm in the discharges of single postganglionic sympathetic neurones innervating the rat tail artery. Journal of Physiology. 1996;497:241–259. doi: 10.1113/jphysiol.1996.sp021764. [DOI] [PMC free article] [PubMed] [Google Scholar]
- Johnson C D, Marshall J M, Gilbey M P. Patterns and rhythms in single sympathetic neurone activity recorded from the tail artery in anaesthetized Wistar rats. Journal of Physiology. 1997;504.P:207P. [Google Scholar]
- Karim F, Hainsworth R. Responses of abdominal vascular capacitance to stimulation of splanchnic nerves. American Journal of Physiology. 1976;231:434–440. doi: 10.1152/ajplegacy.1976.231.2.434. [DOI] [PubMed] [Google Scholar]
- Kreulen D L. Activation of mesenteric arteries and veins by preganglionic and postganglionic nerves. American Journal of Physiology. 1986;251:H1267–1275. doi: 10.1152/ajpheart.1986.251.6.H1267. [DOI] [PubMed] [Google Scholar]
- Marshall J M. The influence of the sympathetic nervous system on individual vessels of the microcirculation of skeletal muscle of the rat. Journal of Physiology. 1982;332:169–186. doi: 10.1113/jphysiol.1982.sp014408. [DOI] [PMC free article] [PubMed] [Google Scholar]
- Nilsson H, Ljung B, Sjöblom N, Wallin B G. The influence of the sympathetic impulse pattern on contractile responses of rat mesenteric arteries and veins. Acta Physiologica Scandinavica. 1985;123:303–309. doi: 10.1111/j.1748-1716.1985.tb07592.x. [DOI] [PubMed] [Google Scholar]
- Rowell L B. Human Circulation: Regulation During Physical Stress. New York: Oxford University Press; 1986. [Google Scholar]
- Shepherd J T, Vanhoutte P M. Veins and Their Control. London, Philadelphia and Toronto: W. B. Saunders Company Ltd.; 1975. [Google Scholar]
- Thorington R W. The Biology of Rodent Tails. A Study of Form and Function. Fort Wainwright, Alaska: AAL-TR-65–8, Arctic Aeromedical Laboratory; 1966. [Google Scholar]
- Timms R J. A study of the defence reaction showing the value of Althesin anaesthesia in studies on the functions of the fore-brain in cats. Pflügers Archiv. 1981;391:49–56. doi: 10.1007/BF00580694. [DOI] [PubMed] [Google Scholar]
- Young A A, Dawson N J. Evidence for on-off control of heat dissipation from the tail of the rat. Canadian The Journal of Physiology and Pharmacology. 1981;60:392–398. doi: 10.1139/y82-057. [DOI] [PubMed] [Google Scholar]


